
Abstract
In order to improve the test capability of automated test systems to deal with complex systems, the concept of a signal-oriented test system model was proposed to guide the design of test systems and the implementation of test work and to analyze the test results. First, a method for establishing signal-oriented test system model is proposed, which is based on IEEE 1641 standard, and combined with the unit under test requirements and test objectives. Second, corresponding verification methods are proposed in the mathematical domain and signal domain. Finally, a verification method based on gene expression programming algorithm is designed to verify the complex signal-oriented test system model. In addition, the battery charge regulator module of the NS2 satellite verified the effectiveness of the signal-oriented test system model. Compared with the traditional identification method, the identification accuracy of the simple system (with mathematical model) has been significantly improved; for complex systems (no mathematical model), the traditional method is difficult to work, and the gene expression programming algorithm still has a good effect. The actual verification shows that the signal-oriented test system model, which combines the advantages of the mathematical model and the physical model, can well represent the testing requirements of the complex system.
Introduction
Automated test system (ATS) is a general term for a standardized system that provides stimulus sources, testing, data processing, and automatic display or output of the test results. 1 The signal-oriented software structure is one of the main developing directions of ATS with general purpose, 2 and the uniform test system model is the key to the resource management and configuration in the signal-oriented test system. There are two purposes in the test system: one is the test object and the other is the test result. On one hand, the connotation of test is expanding, testing technology has been developed, and testing function has been enhanced. The purpose of testing is no longer limited to condition monitoring and fault detection. It also gradually integrates fault isolation, diagnosis, and health prediction. On the other hand, with the extending of testing denotation and the increasing diversification of testing items, traditional classification of the signals can no longer meet the need of test, 3 and the requirement of test result is multiplying. 4 To solve these fundamental questions in test area, two important standards in the test field are proposed by the IEEE Standards Coordinating Committee 20 (IEEE SCC20): IEEE 1641 gives the definition of signal and test operations and IEEE 1226 defines a broader test environment. Both of them jointly develop the software implementation framework and point out the development direction of ATS. 5
Although IEEE 1641 standard has a very important guiding value for the implementation of the test and the design of the test system, more of its value is reflected in the underlying definition, and there is still a lack of a uniform guideline’s specification at the system level. Combining the definition of the signal of the 1641 standard and the mathematical model analysis method in the field of automatic control, this paper proposes a signal-oriented test system model (referred to as SSM). Furthermore, this paper gives the definition of SSM and the method of model establishment. The corresponding verification methods are given in the mathematical domain and the signal domain. Finally, the application requirements of the NS2 satellite test are given.
SSM
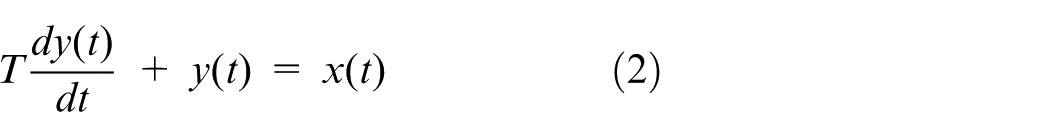
Traditional control theory is based on the analysis of the mathematical model, including the outside model (transfer function model) and the inside model (state-space model). However, testing theory is based on error theories, and it usually has less relationship with models. With the development of the testing technology, the requirements for modeling and standardizing are increasing. Because the test systems, testing objects, and the testing aims have all drastically changed, signals are becoming more and more important in test systems, unit under test (UUT), and test program set (TPS). This paper proposes the concept and identification method of SSM according to the definition of signal in IEEE 1641 standard, which can provide a fast testing method for the establishment of testing requirements and support the construction of complex ATS software and hardware.
Summary of IEEE 1641 standard
In the 1950s, the American military and some airline companies felt that tests became more and more important in the production and maintenance of large weapon equipment and airplanes. Thus, they invested a lot of money to develop test systems. 6 Their achievements led to the IEEE 716 standard. On one hand, with the development of test bus and virtual instruments, the UUT became more and more complex and the classification of signals in IEEE 716 could no longer satisfy the test requirements; on the other hand, the development trend of UUT-oriented test extremely reduced the probability of replantation and reutilization of TPS. A lot of existing technology could not be inherited, which led to enormous waste and limited the development of ATS. In order to adapt to the development of ATS in the new century, the IEEE Standard Committee released the IEEE 1641 standard in 2004, which defined the signal model 7 and proposed the concept of signal-oriented test.
The concept of delamination was introduced in the IEEE 1641 standard, and its basic signal components (BSCs) layer provided the reusable and format-descriptive base signal classes. The base classes shown in Table 1 are used to define BSC class properties.
Signal function base classes.
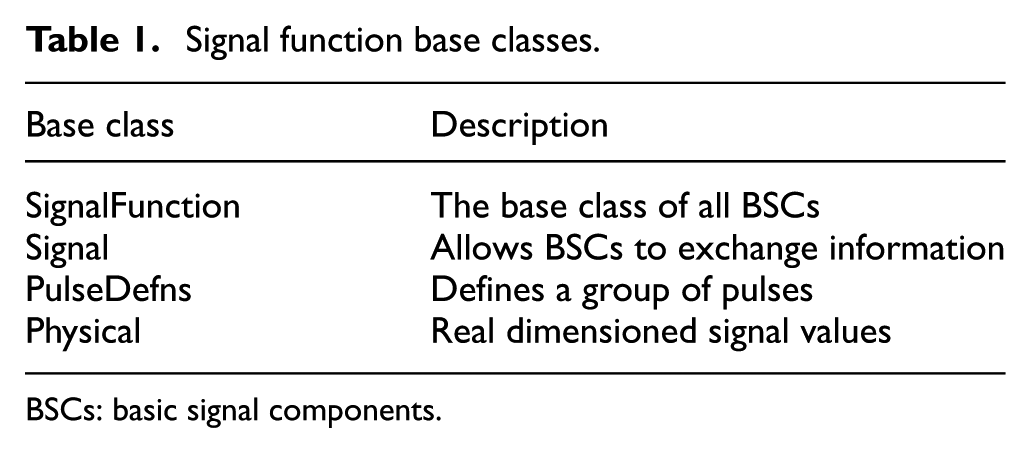
BSCs: basic signal components.
Figure 1 represents a generalized form of a BSC, which shows all possible interfaces and properties.
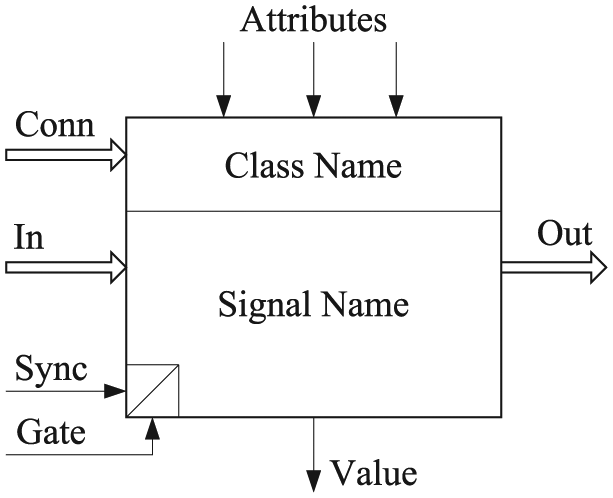
BSC diagram.
In Figure 1, the following naming conventions are used:
Establishment of SSM
The SSM is proposed to meet the signal-oriented requirement of ATS. On the basis of the I/O signal of a system, SSM can be established according to the classification of the basic signal defined in IEEE 1641, whose connotation can be understood from the following four aspects:
Test object: the object of the SSM can be UUT or the ATS itself.
Basic Module: the basic module of the SSM is signal model, which is defined by IEEE 1641, and any operation to the signal can also be regarded as a signal model.
Content: the contents of the SSM reveal the inside structure of an actual test system and its outside signal features in a form of model.
Description: the description of the SSM is unfixed. It can be represented by mathematical equations, unified modeling language (UML) class diagrams, or automatic test markup language (ATML), which is introduced by the IEEE Standard Committee.
The main function of an instrument is the production and measurement of signals. 8 The SSM can be classified into two classes: the signal source and the signal pipeline.
For example, the class diagram of a sinusoidal wave generator is shown in Figure 2.
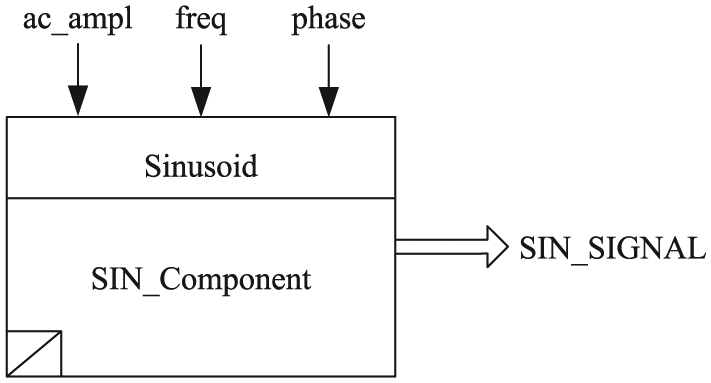
Class diagram of a sinusoidal wave generator.
Its ATML description 9 is
<Sinusoidal amplitude=ac_ampl, period=freq, phase = phase…/> is a (Voltage, Time) signal
This sinusoidal wave generator can also be expressed as a mathematical equation, as shown in equation (1). Where ac_ampl, freq and phase respectively represent the amplitude, frequency and phase of the sinusoidal wave generator.

Among the three expression forms, the UML class diagram is the most intuitionistic form, the mathematical equation is suitable for the simulation of SSM, and the ATML description is the most comprehensive form.
The measurement of the signal can be interpreted as a transform action of the signal. A measurement instrument receives some signals as the input and produces other signals as the output. Thus, the measurement instrument can be considered to be a signal pipeline, which can change signal type or parameter. The signal pipeline maybe a real instrument or a test system. For example, the class diagram of a low-pass filter is shown in Figure 3.
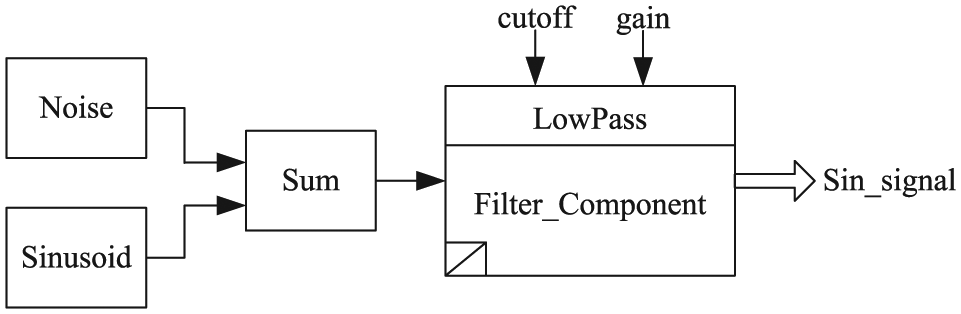
Class diagram of a low-pass filter.
Its ATML description is
<LowPass cutoff=cutoff, gain=gain…/> is a (Frequency, Time) signal
This low-pass filter can also be expressed as
Model identification method
Identification has three key elements—data, model classes, and estimating standard. 10 In other words, identification means to choose a model from the model classes under some estimating standard, whose relationship between input and output data is similar to that of an actual system. 11 Thus, a SSM contains three parts: signal, model classes, and estimating standard. SSM can be classified into two types, which can or cannot be described by mathematical equations.
Identification method of SSM with available mathematical model
The identification of SSM with available mathematical equation may use the traditional system identification theory. First, mathematical equations can be found according to the relationship between input and output data of an actual system, and then, they can be changed into a UML class diagram or ATML form. This method is called numerical domain identification method.
The signal in SSM is a set of input and output signals produced by an actual test system, and the signal model can be built with their parameters. There are two basic kinds of models in test system, stationary model and black box model.
Stationary model
This kind of model can be built with the physical regulations, and its parameter is generally unknown, which can be expressed by
where
Black box model
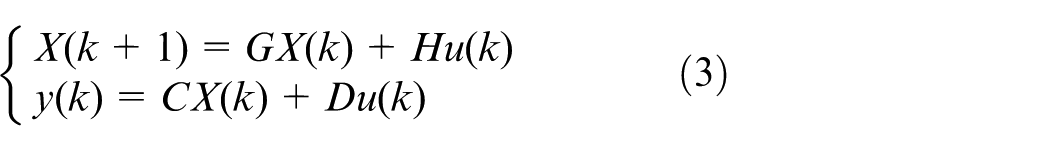
This kind of model cannot be described by physical regulations, and the system model can only be created according to the historical data. Generally, a black box model can be expressed by

where

If
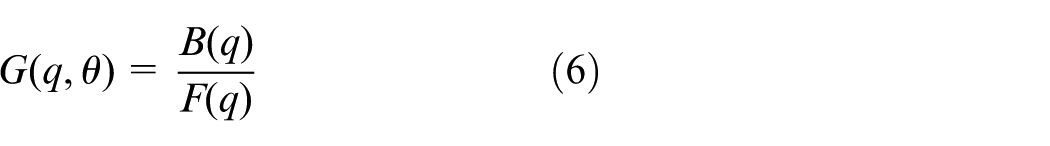
where

Similarly, the noise can be expressed by

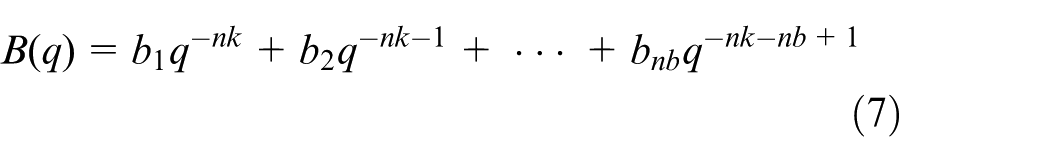
where
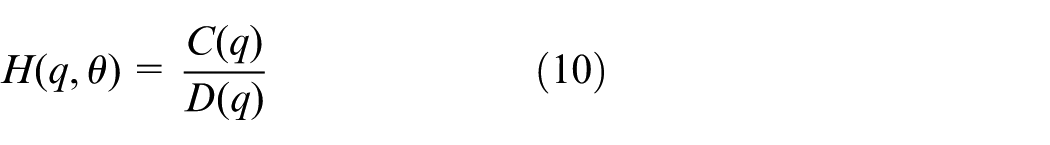


In equation (9),

This model is described by five structural parameters:
The structure chart of BJ model.
After choosing the structure of the model, the next task is to estimate the value of the parameters
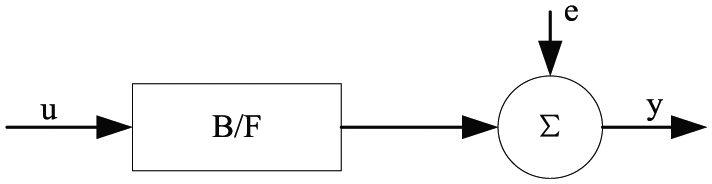
The structure chart of OE model.
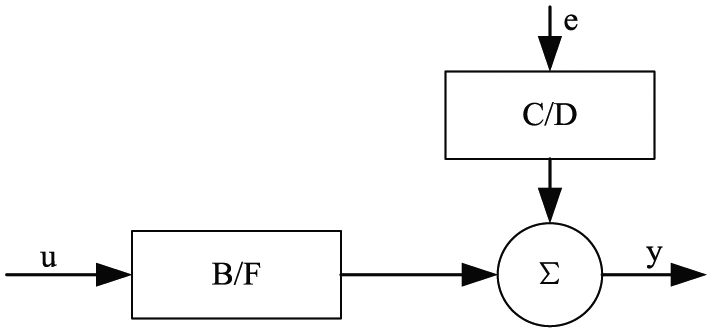
If the denominator of
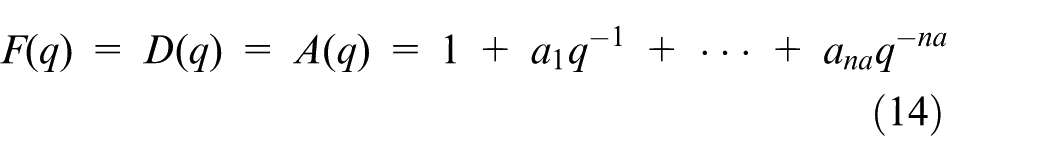
So, when both sides of equation (11) are multiplied by

This model is called auto regression moving average extra-input (ARMAX), and its structure is shown in Figure 6.
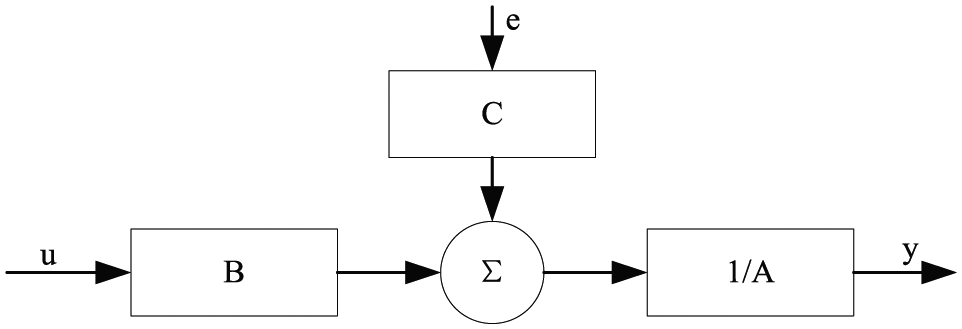
The structure chart of ARMAX model.
Traditional identification theory is based on control theory 13 and has many model assessment criteria,14,15 for example, the mean square error (MSE), the root-mean-square error (RMSE), and the R-square.
Identification method of SSM without available mathematical model
The SSM without available mathematical model cannot be identified using the numerical domain identification method. For this kind of model, the symbol domain identification method may be useful, where the generalization of model classes in symbol domain and the evaluation principle are the key problems.
Gene expression programming (GEP) 16 is widely used in the system identification area as an intelligent algorithm, 17 which synthesizes the excellent features of the genetic algorithms (GA) and genetic programming (GP). It adopts linear symbol coding and the biological concept of open reading frame (ORF). The gene is divided into two parts: the head and the tail. The last bits of the gene maybe in the non-coding region, which is also called gene inner-region. In this way, complex models can be represented by limited symbol coding.
The flowchart of a gene expression algorithm is shown in Figure 7.
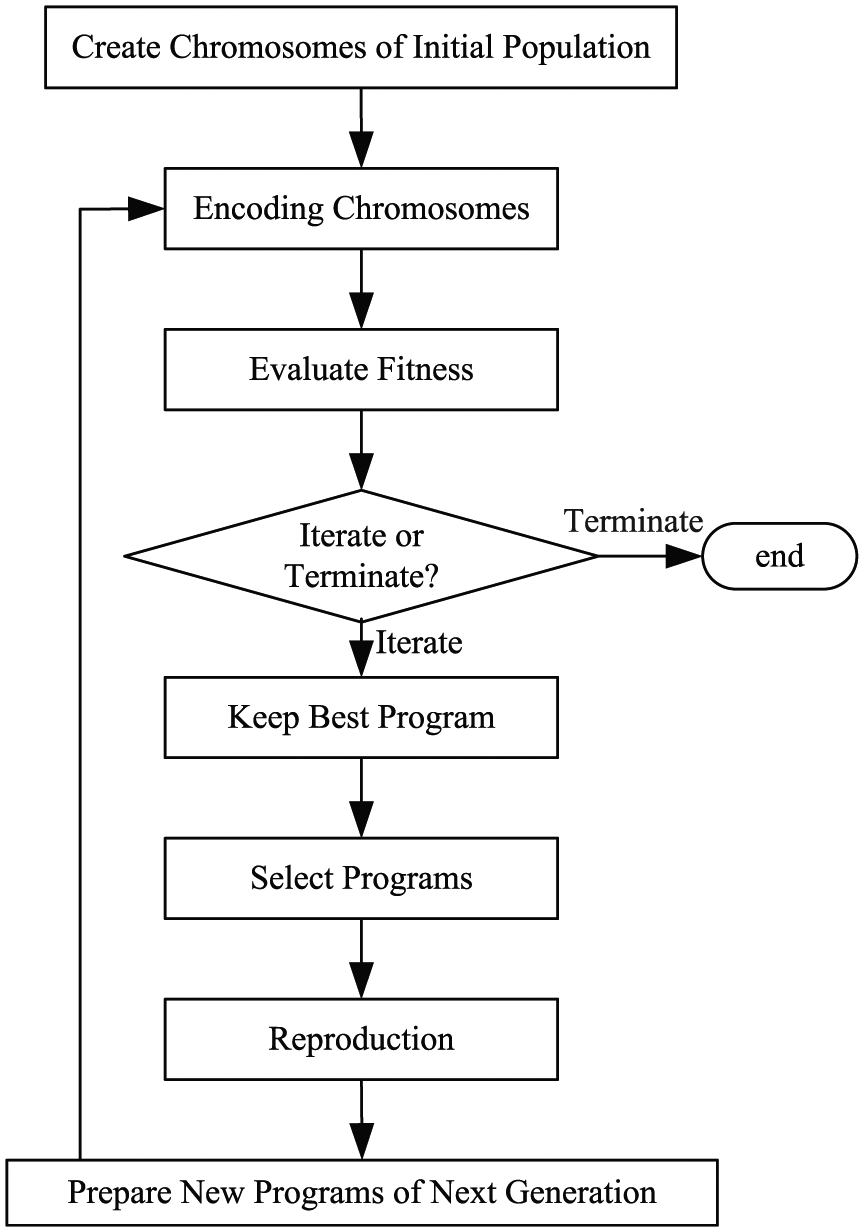
Flowchart of gene expression algorithm.
The process begins with the random generation of chromosomes of initial population. Then, the chromosomes are encoded, and the fitness of each individual is evaluated. These individuals are selected according to their fitness to reproduce with modification, leaving progeny with new traits. The individuals of this new generation are, in their turn, subjected to the same developmental process: expression of the genomes, confrontation of the selection environment, and reproduction with modification. The process is repeated for a certain number of generations until a solution has been found.
Analysis of GEP identification method
Comparison between GEP identification method and existing method
Generally speaking, there are two methods to model test systems: one is based on classical control theory and the other is based on optimal estimate theory. Both of these methods accomplish the structural identification and parameter estimation based on prior knowledge. However, when the system is too complicated or lacks prior knowledge, the modeling ability is insufficient. The GEP-modeling method proposed in this paper is based on the intelligent algorithm, which can achieve the identification of complex systems. A detailed comparison is shown in Table 2.
Comparison of modeling methods.
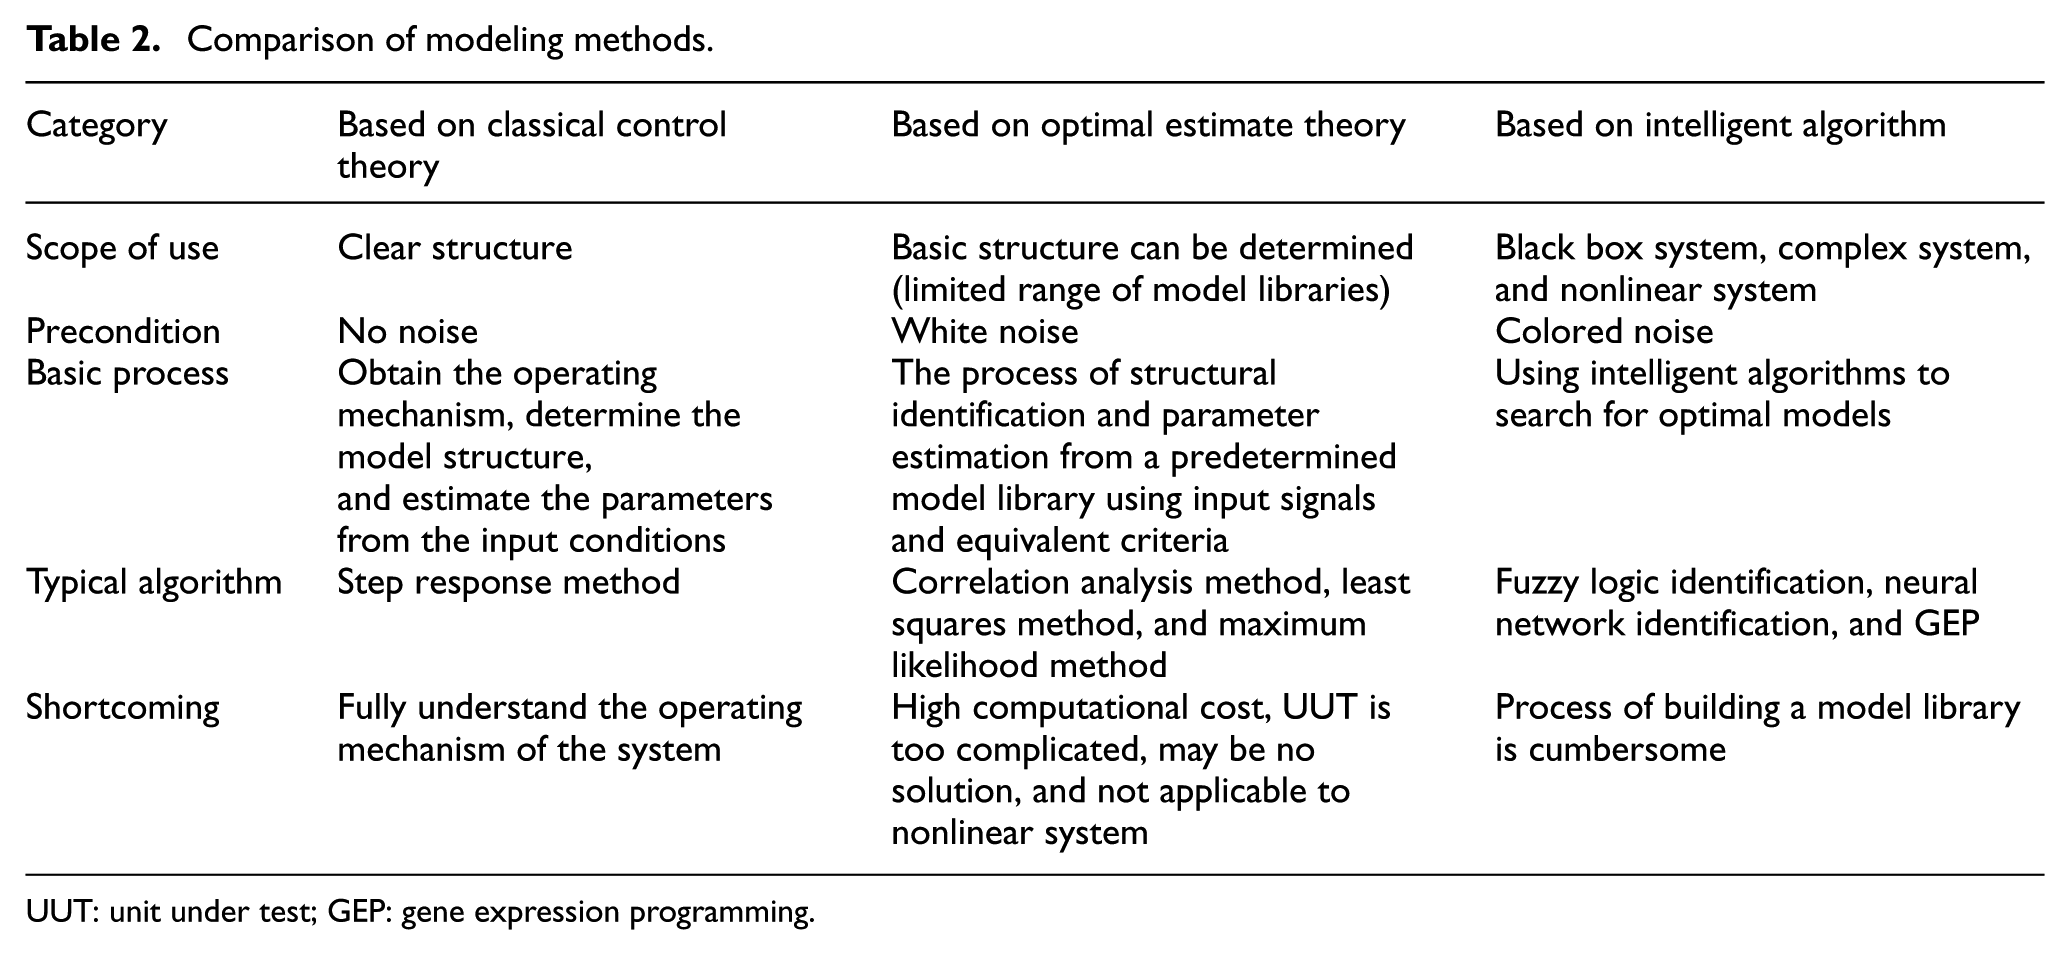
UUT: unit under test; GEP: gene expression programming.
Although suitable system models can be searched by intelligent algorithms, this is based on a complete model library. Based on IEEE 1641 standard, this paper establishes a model element library for SSM. The basic signal units can be divided into two types: signal source and signal operation, according to their function, which corresponds to the terminal and function operators in GEP. Since other intelligent algorithms cannot operate function operators, the modeling method in this paper is based on GEP. One good feature of GEP is that it does not need prior knowledge of the system. It can automatically generate SSM model with limited observation data. It can identify the structure and parameters of the system and has certain noise suppression capability.
Analysis of ATS
ATS has been developed for three generations, since it was proposed in the 1980s. The first generation is a dedicated test system for specific UUT. The second generation is based on standardized buses such as General Purpose Interface Bus (GPIB) and Computer-Aided Measurement and Control (CAMAC), and various bus-type devices are configured and combined by means of “building blocks.” In order to solve the problems of the second-generation ATS, such as low speed of bus and unshareable hardware and software resources, the ATS has developed to the third generation. The third generation is based on VXI, PXIe, and other high-speed buses and is composed of modular instruments. Among them, the most famous ones are Consolidated Automated Support System (CASS), developed by Lockheed Martin Corporation, and Third Echelon Test Set (TETS), developed by MANTEC Corporation.
Because the UUT is more complicated, and the intelligent processing of fault isolation and fault diagnosis is more demanding, the intelligent processing capability of the UUT is required to be higher. The SSM modeling method proposed in this paper meets the test requirements. The detailed comparison is shown in Table 3.
Comparison of ATS.
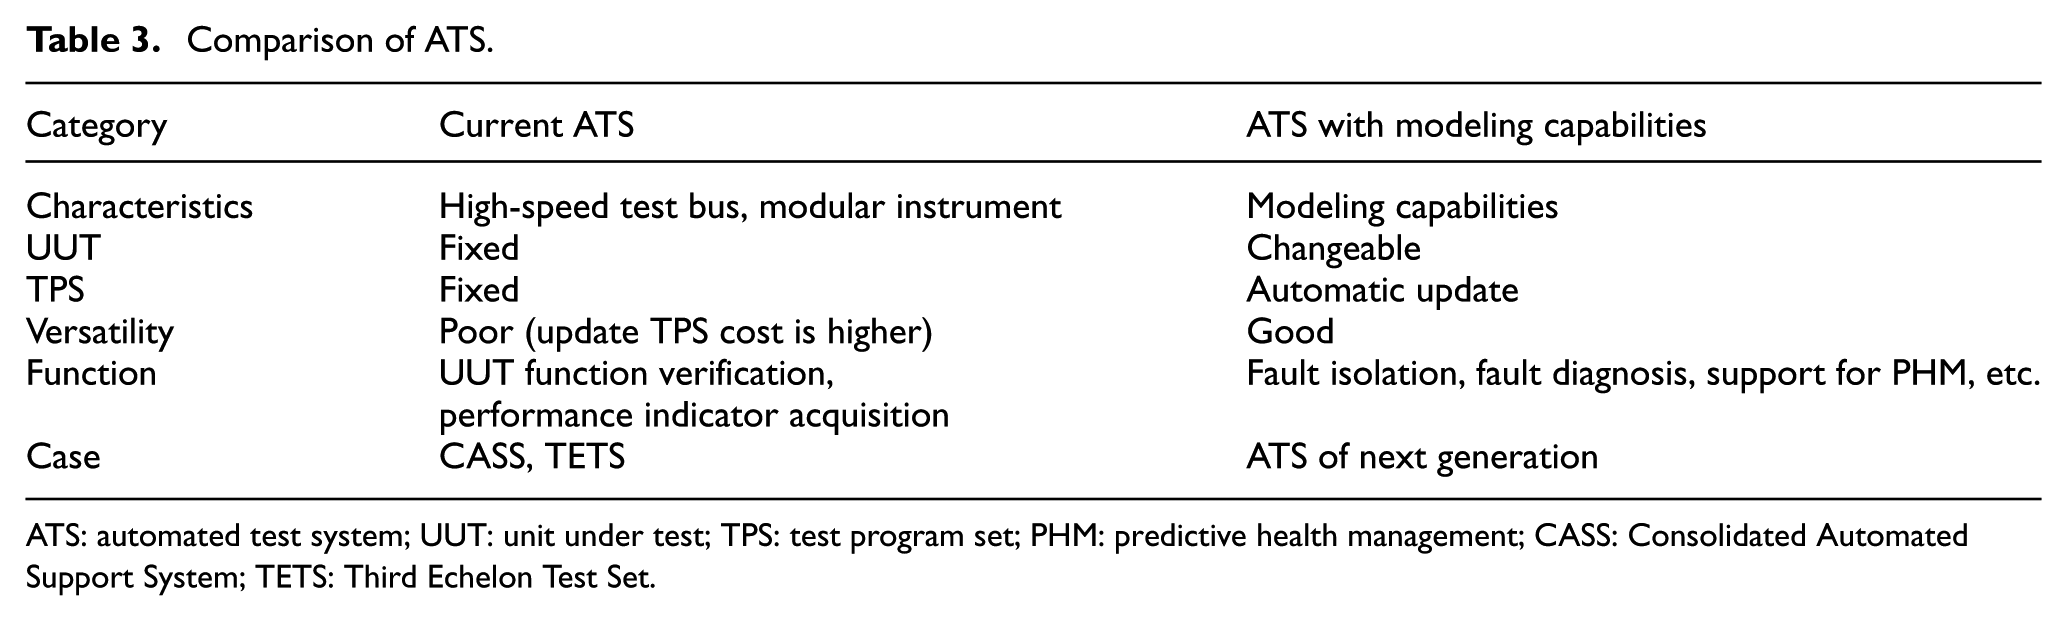
ATS: automated test system; UUT: unit under test; TPS: test program set; PHM: predictive health management; CASS: Consolidated Automated Support System; TETS: Third Echelon Test Set.
It can be seen that ATS with modeling capability has extremely high versatility and can automatically update the TPS as the UUT changes. Therefore, it is a real universal test system.
Comparison of test results between two different methods
In the circuit shown in Figure 8,
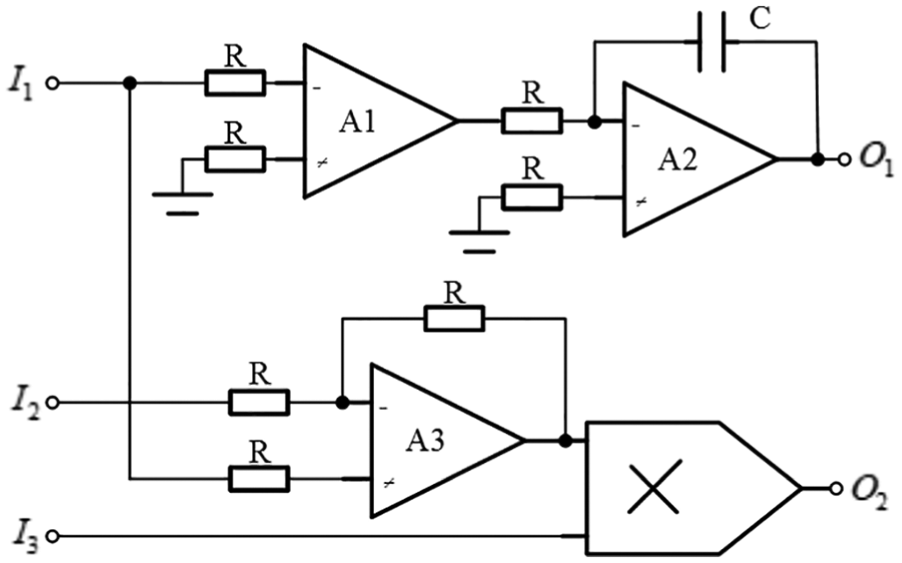
Multiple input–multiple output circuit.
Using the test data, the model is identified by the MATLAB System Identification Toolbox as
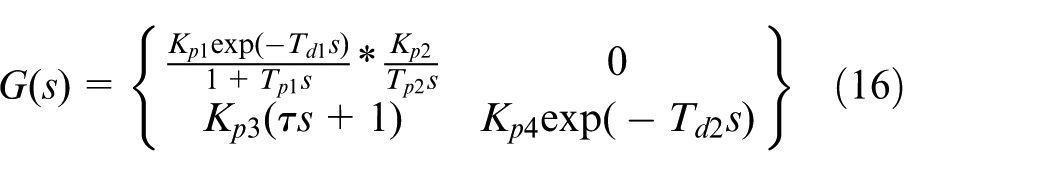
Because
The parameters in the MIMO Circuit experiment.
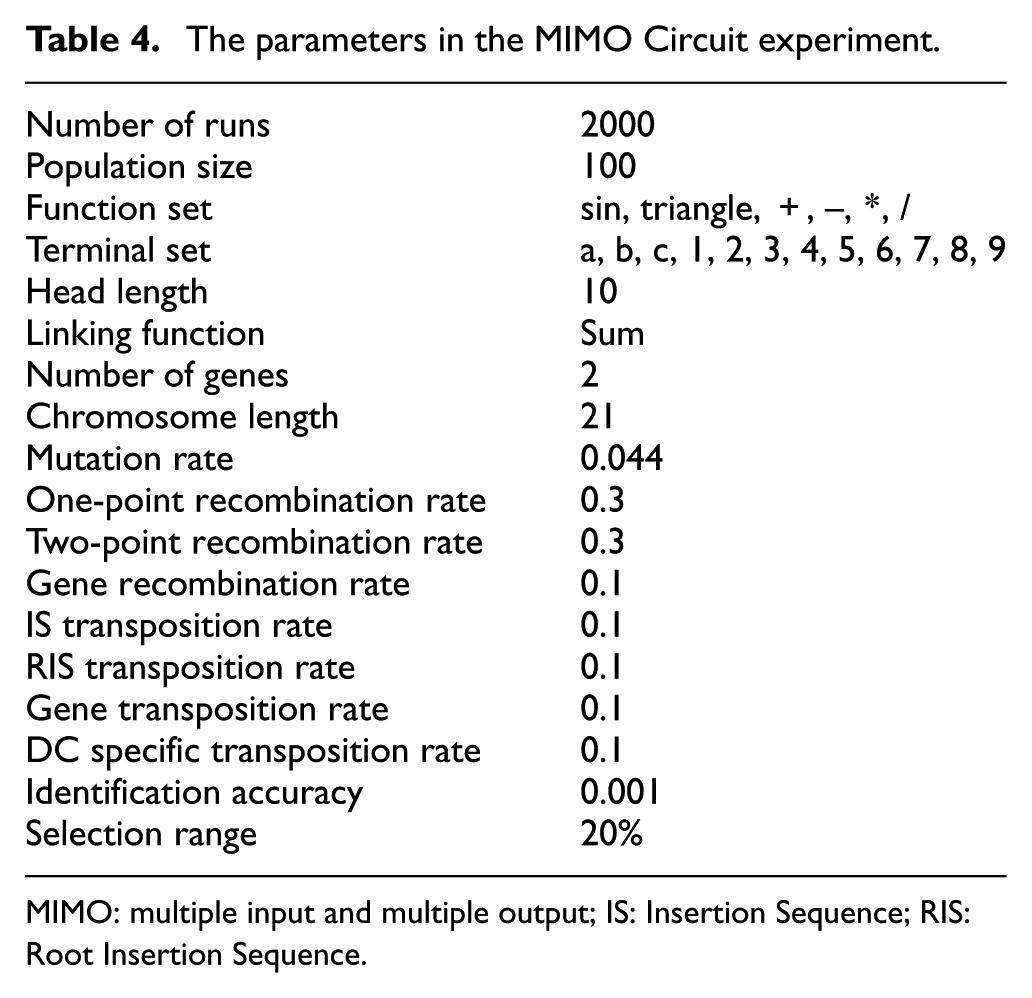
MIMO: multiple input and multiple output; IS: Insertion Sequence; RIS: Root Insertion Sequence.
The identification result of the algorithm can be described by the following two chromosomes:
012345678901234567890
Gene1: {triangle}ab23b79b43c0471bbbaa
Gene2: *b-*c2acccbbbb2196abb
Where a, b, and c represent the three inputs
When identifying multiple input and multiple output (MIMO) circuit system (see section “Analysis of GEP identification method”), the estimation criterion used is the RMSE. Table 5 gives a detailed comparison. The identification accuracy of the GEP algorithm is preset, and its value is 1.
Comparison of two system identification methods.
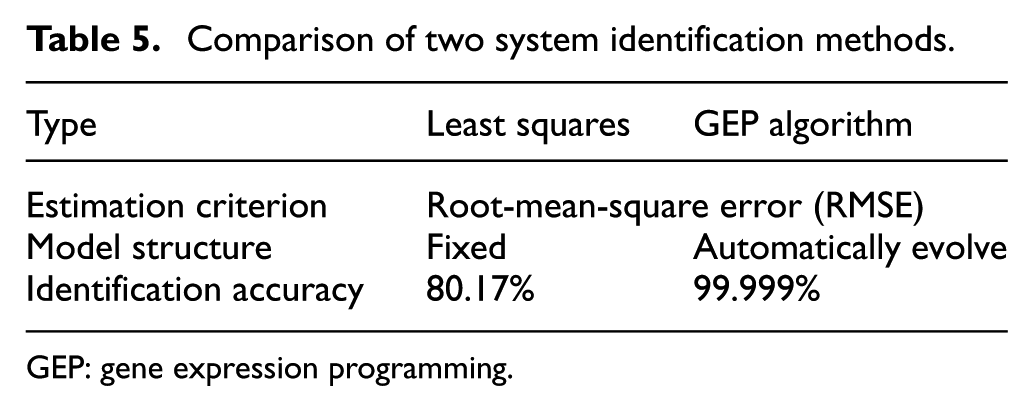
GEP: gene expression programming.
Preliminary applications of the black box models
Through modeling the UUT, two tasks should be accomplished. One, the test requirements of UUT should be built, including the requirements for test signal, test strategy, and frame generation of TPS.18,19 Another task is that the model should reflect the correct physical structure of UUT.
Introduction to battery charge regulator module of the NS2 satellite
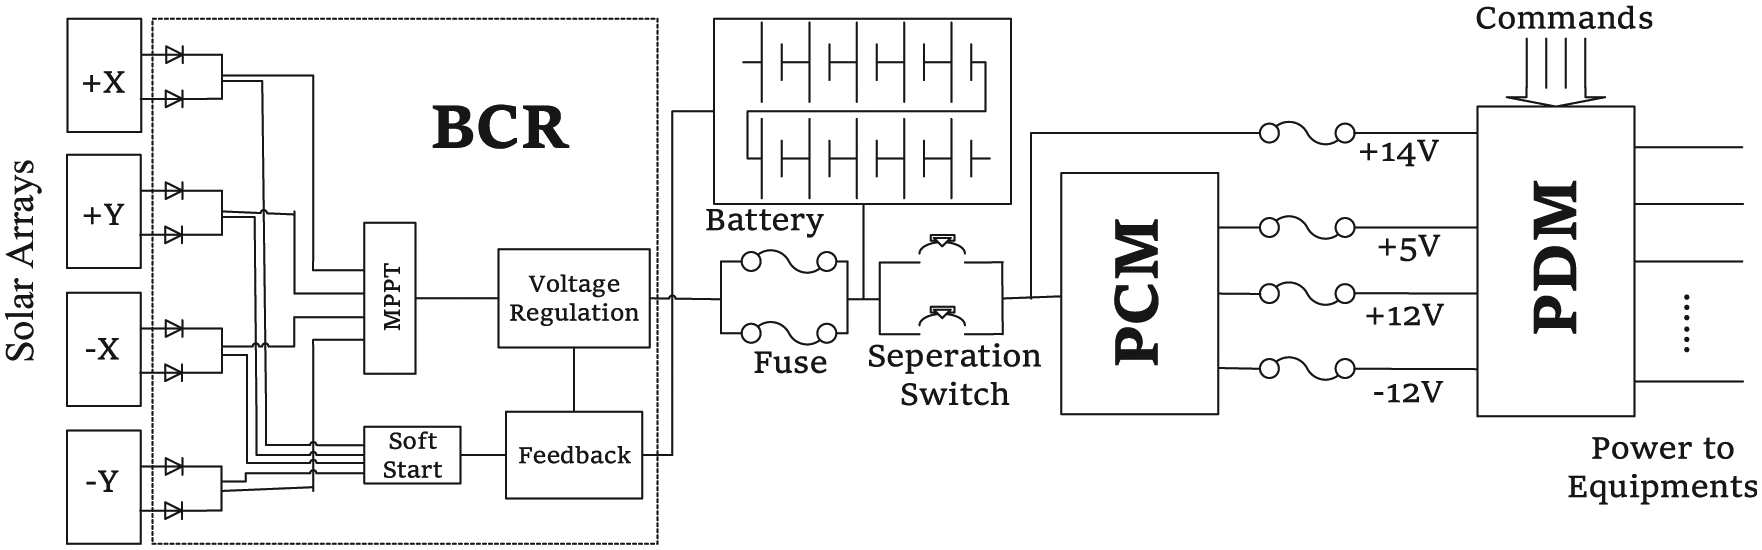
The power subsystem is one of the basic components of the NS2 satellite, and the battery charge regulator (BCR) is a key component for energy conversion and storage management. Figure 9 shows the basic framework diagram of the NS2 satellite power subsystem. The solar array is an onboard generator. The BCR implements solar energy collection, power regulation, battery charge and discharge management, and primary power conversion; the separation switch is an automatic power-up device when the satellite is separated; power conditioning module (PCM) achieves power conversion; power distribution module (PDM) achieves onboard power distribution.
NS2 satellite power system.
BCR consists of four parts: soft start, maximum power point tracking (MPPT circuit), bus voltage regulation circuit, and feedback adjustment circuit. The soft start is a solar array charge control switch. When at least one solar array voltage is higher than 6 V, the bus voltage regulation circuit and MPPT circuit can be started to power the battery and satellite. MPPT circuit is the maximum power point tracking, automatically switching to select the maximum output power of the solar array, to achieve battery charging and onboard power supply. The primary power is supplied by bus voltage regulation circuit. The output power is monitored and adjusted by feedback adjustment circuit, according to the output of solar array and requirement of satellite.
Identification test for BCR
Figure 10 shows some of the pictures related to this research. Figure 10(a) shows the NS2 small satellite developed by Tsinghua University, which weighs 20 kg. Figure 10(b) shows the small satellite under test (engineering sample), and it is connected to the ATS through the test cable network. ATS consists of bus-type instruments manufactured by National Instrument (NI) Corporation, including the main processor case (PXIe1065 and PXIe8135), downlink (PXI5661), uplink (PXIe5673), and multi-channel I/O adapter (PXI7842 and PXIe4112). Figure 10(c) shows the BCR subsystem of the NS2 satellite.
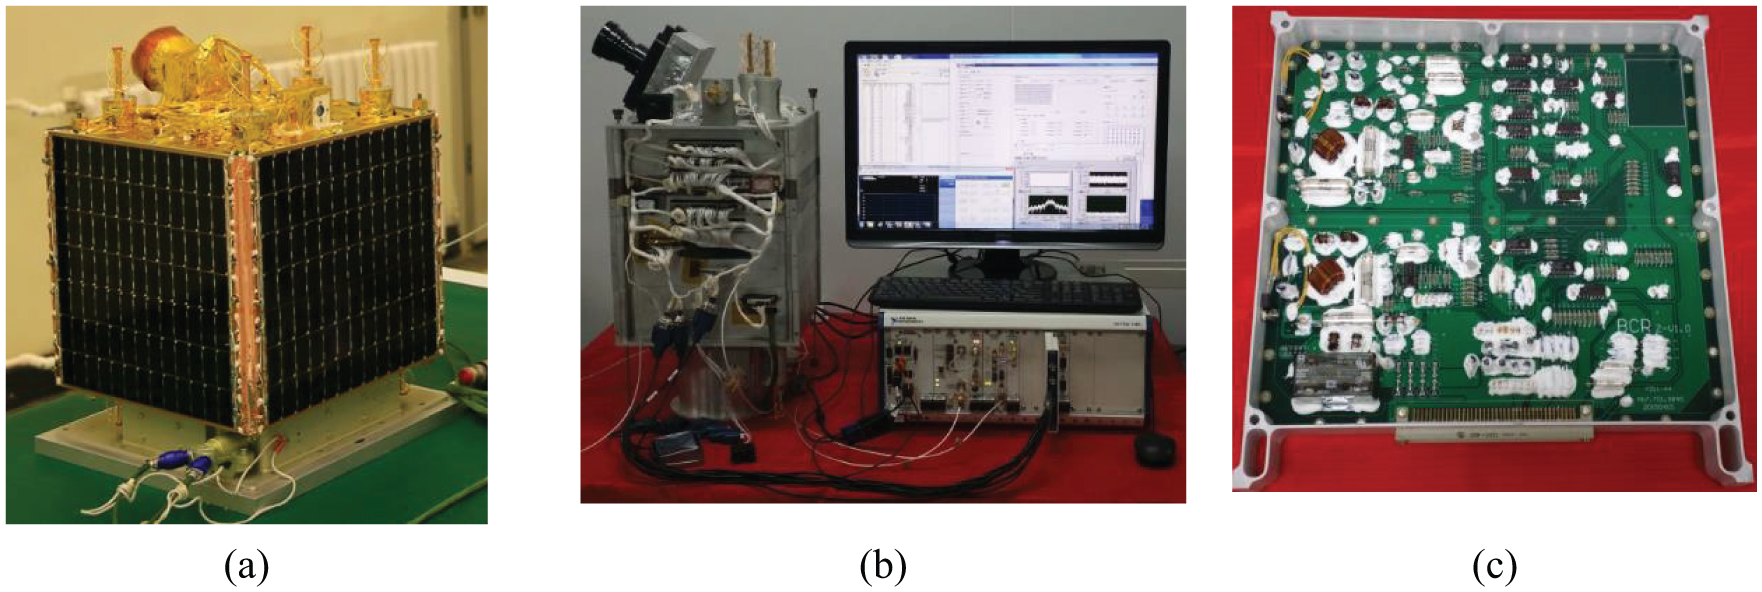
(a) NS2 satellite (delivery product), (b) NS2 satellite under test (engineering prototype), and (c) BCR subsystem of NS2 satellite.
According to the input and output signals of the BCR, the algorithm based on GEP is designed, and some parameters of the algorithm are listed in Table 6.
The parameters in BCR experiment.
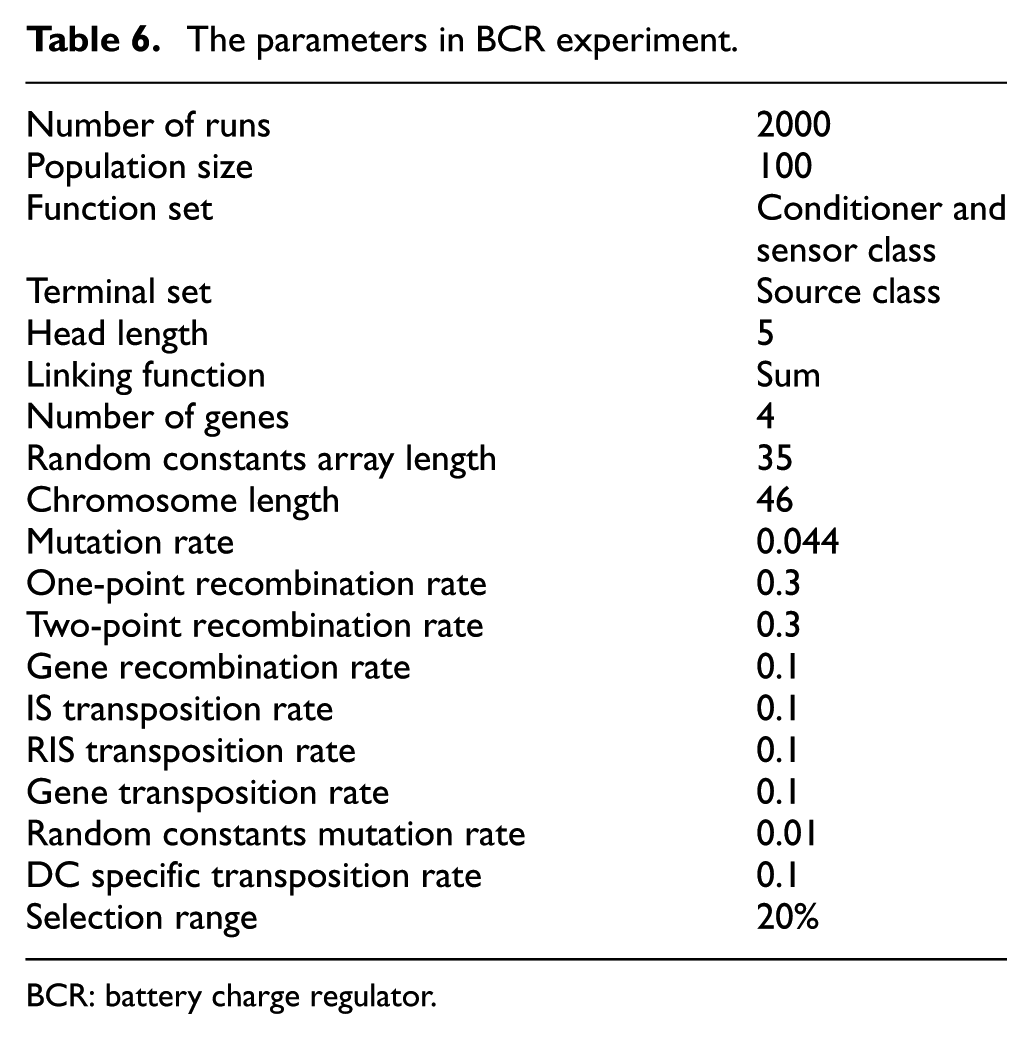
BCR: battery charge regulator.
The identification result of the algorithm can be described by either expression trees or chromosomes. Following is the description of four chromosomes (the chromosome is too long to write perfectly):
0123456789012345678901234567890123456789012345
Gene1: {Measure}abbbbaabbb***********************************
Gene2: {SignalDelay}aaaabaaabb***********************************
Gene3: {SignalDelay}baaaaaabbb***********************************
Gene4: {SignalDelay}aaabbbbbba***********************************
The four chromosomes stand for the four output ports of data. Generally, the first element of a chromosome belongs to a class of the function set, which means the signal operation, the lowercase “a” means sinusoidal signal input (which can be one of the four solar arrays), and “b” means switch signal input (which can be generated by soft start and MPPT). The UML diagram after encoding of the chromosomes is shown in Figure 11.
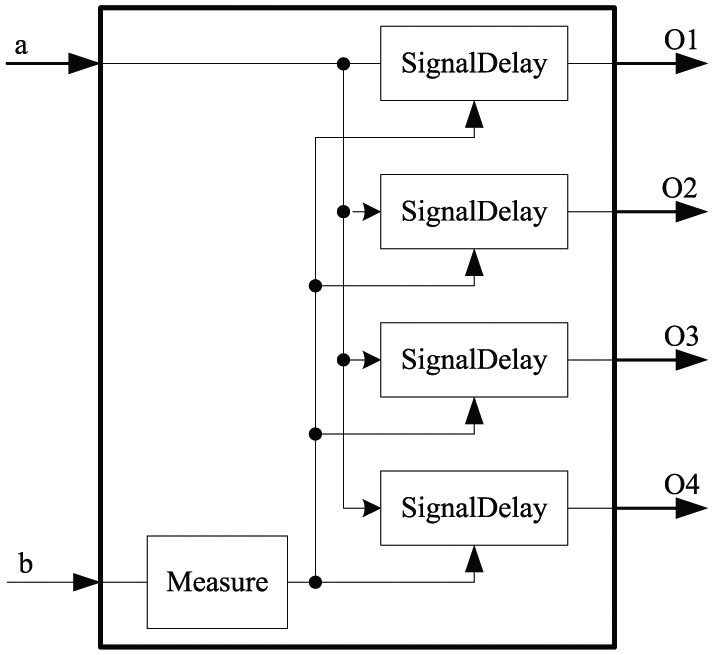
The SSM of the BCR.
It can be seen from Figure 11 that the structure of the BCR is an encoder controlled by input signal “b.” At any time, only one signal of the input group will be outputted without delay, and the other three signals will be delayed forever, that is to say, they will not be outputted.
In essence, the BCR is an energy transmission device. The four solar arrays form four inputs. The soft start and MPPT constitute two control switches. When the soft start is enabled and the MPPT is switched to the corresponding input, the corresponding solar array will be connected to the system, so that solar energy will be properly connected to the output. Otherwise, the solar array is disconnected and the system is in an independent power supply state of the battery to ensure that the battery energy will not be reversed.
It can be seen from Figure 12 that the test model has four channels, and each channel contains a cutting-out resistance and a passing resistance. Essentially, they are the contact resistance and the insulation resistance of the relay, respectively. In this figure, four solar array signals are regarded as an input group to simplify the problem. Four control signals are used to control the relays, and every time, only one solar array signal is transmitted to the buck circuit.
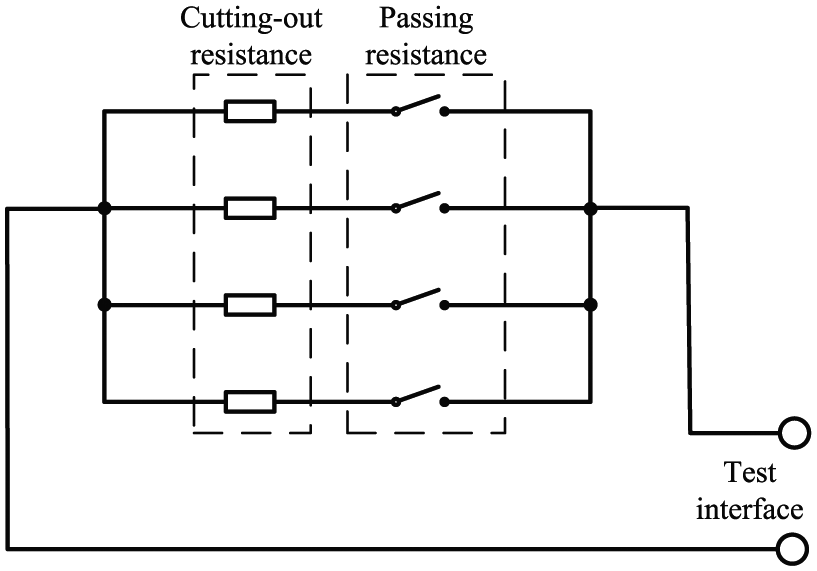
The basic function of BCR.
The test requirements of the BCR system can also be acquired, including the requirements for test signal and test method. The test signal means the delay time in the SSM. When a signal cannot be outputted, the delay time is infinite. When it can be outputted, the delay time is zero. The test method belongs to a measurement class, that is, the test of connectivity.
Analysis of test
To identify the BCR module of Figure 9, the power signal is generated by the solar array simulators (Agilent E4350B). Moreover, the test points are added to the front of the bus voltage regulation circuit to monitor the operation of the four-selection switch circuit. Bus voltage is monitored at the output of the BCR. The test results are shown in Figure 13.
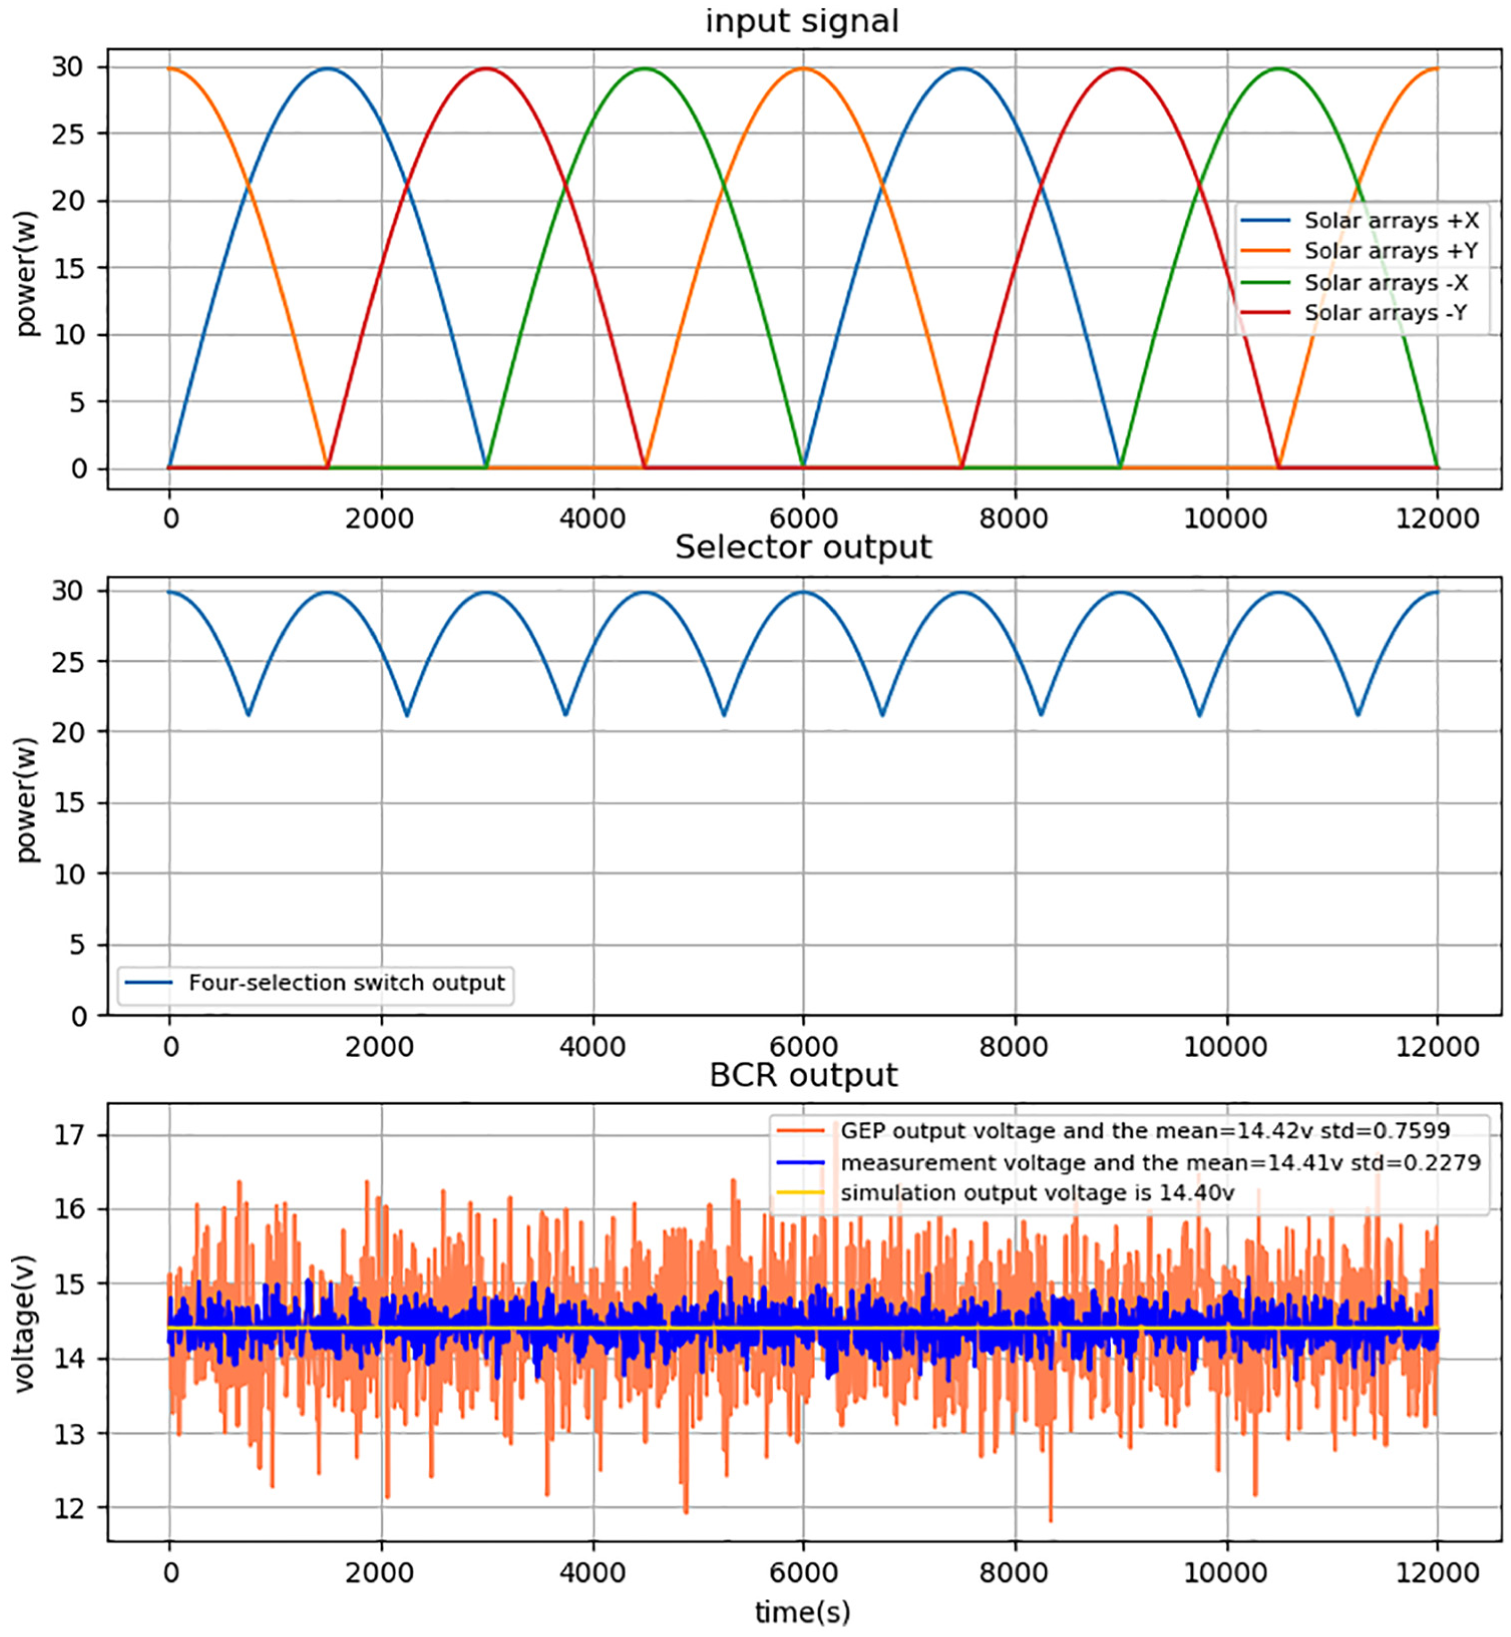
Test results of BCR.
Figure 13 shows the data related to the test. The three subfigures represent the input signals of simulated solar arrays, the output signal of the four-selection switch, and the simulated output of BCR and actual output of BCR, respectively. The yellow line indicates that the theoretical output voltage is 14.4 V; the blue line indicates the actual measured output voltage, with an average of 14.42 V and a variance of 0.2335; and the orange line indicates the GEP calculation with a mean of 14.43 V and a variance of 0.7359.
Conclusion
Aiming at the requirement for unified testing models in signal-oriented automatic testing system and due to the shortage of current testing theories, the SSM based on IEEE 1641 standard is proposed. The general contour of the SSM is presented through the introduction of its definition, classification, features, and identification methods, which extend the connotation and denotation of ATS, and the advantages of signal model in ATS supremacy are embodied.
In the development process of modern small satellites, the functions and compositions of small satellites are becoming more and more complicated due to the increasing requirements of various performance indicators. Moreover, due to the extensive use of commercial off-the-shelf (COTS) products and highly integrated components, the testers are less familiar with the internal working mechanism of each subsystem, and so a more efficient method is needed to identify the system. In addition, the pursuit of test efficiency is constantly strengthening. In addition, the test cycle duration has been decreasing, while the requirements for test parameters have been increasing. Therefore, a more effective identification method is necessary. The system identification method based on GEP algorithm proposed in this paper is a preliminary attempt to achieve this goal.
However, because IEEE 1641 cannot yet cover all types of signals and the assessment criteria of identification theories in the SSM are not perfect, the building method of test system signal model calls for further development, particularly in the summing up of the model classes and the introduction of the estimation criterion.
Footnotes
Declaration of conflicting interests
The author(s) declared no potential conflicts of interest with respect to the research, authorship, and/or publication of this article.
Funding
This work is supported by the National Key Research and Development Program of China under the grant No.2016YFB0500900.