
Abstract
Experimental study on dry sliding wear properties of aluminum alloy 6026 were performed utilizing pin-on-disk wear testing machine, considering the wear parameters like the applied load on the pin and the rotational and track diameter of disk. Wear of the pin, coefficient of friction and frictional force were observed during the test procedure for analysis. The experimental trials were designed by L16 Orthogonal Array based on Taguchi’s design of experiments and a hybrid approach of gray relational analysis combined with response surface methodology was applied for optimizing the output responses. The optimum conditions obtained for lower wear, coefficient of friction and frictional force were 35.21 N load, 376 r/min speed of disk and 111.53 mm disk track diameter, respectively. Scanning electron microscopy image of specimens taken after testing shows that abrasive wear mechanism is the predominant mechanism of wear. Experiment of confirmation with optimum conditions shows that the result was nearer to the predicted results.
Keywords
Introduction
Aluminum and aluminum alloys reside the third locale amid the commercially utilized engineering materials. Among commercial aluminum casting alloys, the most common alloys are Al-Si base alloys, remarkably owing to very attractive attributes likewise good workability, high strength-to-weight ratio, excellent castability, corrosion resistance and good thermal conductivity. Aluminum alloys were extensively used in automotive and aerospace applications due to reducing of overall weight, thereby increasing the fuel efficiency of the automobiles. Aluminum alloys were classified into seven series, in which 6000 series has medium strength, good machinability, weldability and formability, corrosion resistant and heat treatable which is most extensively used in automotive and aircraft industries.
Impact of wear parameters on AA7075 alloy such as applied load, sliding speed and contact distance was investigated by Bhatia et al. 1 for wet (lubricating) and dry conditions and found that sliding distance has the highest influence followed by load and sliding speed, and wear rate was high in dry conditions than in wet conditions. The tribological properties of aluminum as-cast alloy sample, that is, aluminum alloy and pure aluminum were studied by Roop lal et al., 2 and the amount of wear has been reduced significantly in aluminum alloy comparative to pure aluminum. The wear behavior of Al6063 sporadically reinforced with aluminum oxide and graphite composite was studied by Kumar et al. 3 and the acquired result revealed that when compared to Al 6063-6% Al2O3 mono-reinforced composite, Al 6063-6% Al2O3-1% Gr hybrid composite exhibits a higher rate of wear resistance. Using statistical analysis technique, comparison and analysis of wear behavior of as-cast Al6086 T6 and Al6082 were performed by Rana et al. 4 and results show that sliding distance increases the rate of wear to an extent of 800 m and after which it decreases. The influence of Al2O3 on AA7075 metal matrix composite’s (MMC) wear properties was investigated by Baradeswaran et al. 5 using Taguchi’s technique. Al2O3- and B4C-reinforced Al 7075 alloy’s dry sliding wear behavior testing was conducted by Dhanalakshmi et al., 6 and data analysis was performed to determine the optimal parameters by Taguchi’s technique. Investigation of the dry sliding wear behavior of aluminum alloy reinforced with SiC was done by Algur et al. 7 and to receive data in a controlled way; the design of experiment (DoE) approach was enrolled using Taguchi’s method. Taking into consideration of process parameters such as pertinent to two-body abrasive wear behavior and multiple quality attributes of the material, the optimization of hybrid aluminum composites was done by Ghosh et al. 8 using Taguchi’s gray relational analysis (GRA).
Using GRA, optimization of dry sliding wear performances on the varied volume fraction of silicon carbide particles reinforced in Al-6082 MMC was performed. The analysis of variance (ANOVA) shows that the applied load is the most influential control factor among the four dry sliding performance input parameters of Al-SiC. 9 The study carried out to determine the influence of silicon carbide particles on the wear behavior of Al MMC using response surface methodology (RSM) toward optimizing the wear parameters for a minimum wear rate 10 shows that normal load is the most significant factor and sliding speed is the least significant factor which influences the wear rate. Using RSM, dry sliding wear behavior of hybrid MMC’s was investigated by Singh and Goyal 11 and found that hybrid composite’s wear has been affected marginally by weight percentage of reinforcement and maximum by the sliding distance. Using RSM, a parametric study of the dry sliding wear behavior of AA6082-T6/B4C and AA6082-T6/SiC composites was done by Singh et al. 12 and concluded that the wear rate in both composites reduced when there is an increases in the reinforcement content and sliding speed. Using RSM, the investigation of aluminum Al-Si12Cu/TiB2 MMC’s dry sliding wear behavior was done by Radhika and Raghu, 13 and the obtained surface plot implicates that the rate of wear decline with increasing sliding distance and elevates with increasing load at all distances and velocities. Recently, the influence of wear parameters on the surface-modified AZ61 magnesium alloy by employing RSM was performed and found that wear is attributed by speed and load, whereas frictional force is influenced by the load on the pin. 14 Association of wear raises machine downtime and elevates maintenance costs, while friction results in important energy losses. Before subjecting a metal in the practical applications, studying of their wear behavior is an at most important one. AA6026 is a recently developed aluminum alloy meeting the European Environmental Protection Directives: 2000/53/CE-ELV—for the automotive sector. From the literature survey, it is observed that no work has been reported on wear studies of aluminum alloy 6026, which makes us test dry sliding wear on this alloy. Using Taguchi’s DoE, experimental trials have been made and an appropriate L16 orthogonal array (OA) was selected, and the output response has been optimized using hybrid gray relational analysis and response surface methodology (GRA-RSM). GRA is best suited for multi-objective optimization but produces optimum condition among the chosen level values only. RSM is used as a tool for multi-objective optimization and to develop a regression model simultaneously and desirability analysis is applied to obtain the optimum parametric condition from the chosen input range. This hybrid approach combines the advantages of both GRA and RSM methods. A characteristic surface is responded for a set of independent variables. To develop the mathematical models in the form of multiple regression equations, RSM has been applied. The dependent variable is viewed as a surface to which a mathematical model is fitted while applying RSM. Prediction of output response using RSM is carried out by developing a second-order regression model which increases the accuracy in prediction. Therefore, accurate prediction of responses is possible as observed in this work, which is confirmed with performing validation experiments.
Material section
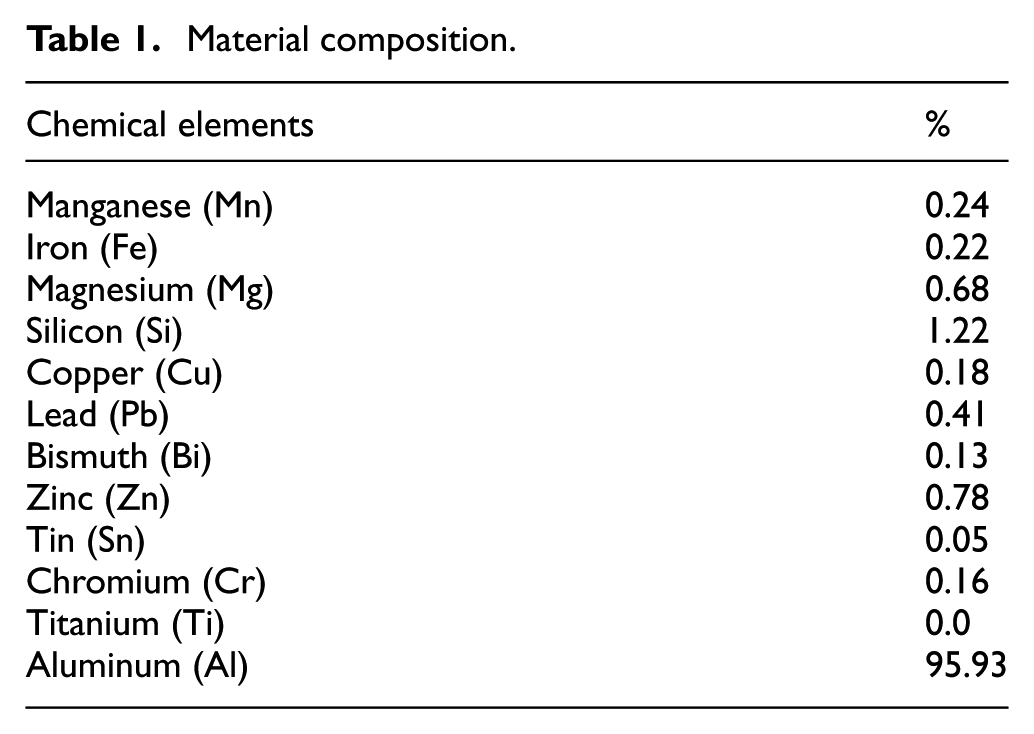
AA6026 is a currently developed aluminum alloy meeting the European Environmental Protection Directives: 2000/53/CE-ELV—for the automotive sector. AA6026 is chosen over other aluminum alloys because it has superior corrosion resistance and higher wear resistance properties. It also has better weldability. It has a density of 2.72 g/cm2, thermal expansion of 23.4 × 10⁻⁶/K, the thermal conductivity of 172 W/m K and modulus of elasticity 69 GPa. It has a tensile strength of minimum 360 MPa and hardness of minimum 95 HB. Alloy 6026 can be used as an alternative for alloys 6081 or 6082, predominantly where the completed parts need substantial machining on machining centers and high-speed automatic lathes. AA6026 is applied to high-speed automatic lathe parts, hot forging, decorative anodizing, electrical and electronic parts, hard anodizing, automotive parts such as brake systems. The composition of this material is shown in Table 1.
Material composition.
Experimental procedure
The AA6026 specimen is first subjected to scanning electron microscopy (SEM) in order to study its topography and composition. Wear test of the as-cast specimen is done using computer-assisted pin-on-disk wear tester. There are various types of wear testing methods, some of which widely used are abrasive wear tester, rolling sliding wear tester and a pin-on-disk wear tester. For pin-on-disk wear testing, specimens were prepared for a dimension of 32-mm height and 8-mm diameter. Acetone was used for cleaning the disk, before and after wear tests. Figure 1 shows the pin-on-disk wear-testing machine setup.
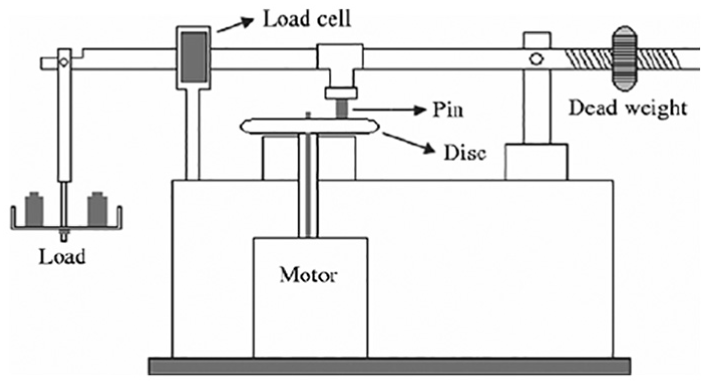
Illustration of pin-on-disk apparatus.
The specimens were placed in the handle bar of the machine for testing against the disk. The parametric readings and graphs can be visualized and were obtained from the computer-assisted data acquisition system, connected to the machine. The experimental trials were designed by L16 OA based on Taguchi’s DoE. For different loads, the rotational speed of pin and track diameter of the disk, as per formulated OA, experiments were conducted and subsequently wear, coefficient of friction and frictional force were observed for each experiment. For each experimental trial, a new pin was used. After which, each tested specimen was subjected to SEM in order to obtain the micrograph of the wear track as a result of the wear test.
Methodology
Dry sliding wear study of AA6026 was being conducted on 16 specimens that were prepared by machining it to a size of 8-mm diameter and 32-mm length. Based on Taguchi’s DoE, the experimental trails were designed by L16 OA. Primary analysis is done by GRA. The outcome of this primary analysis is used as input in the RSM to optimize the output response. The flow chart shown in Figure 2 replicates the procedure involved in the work to be followed.
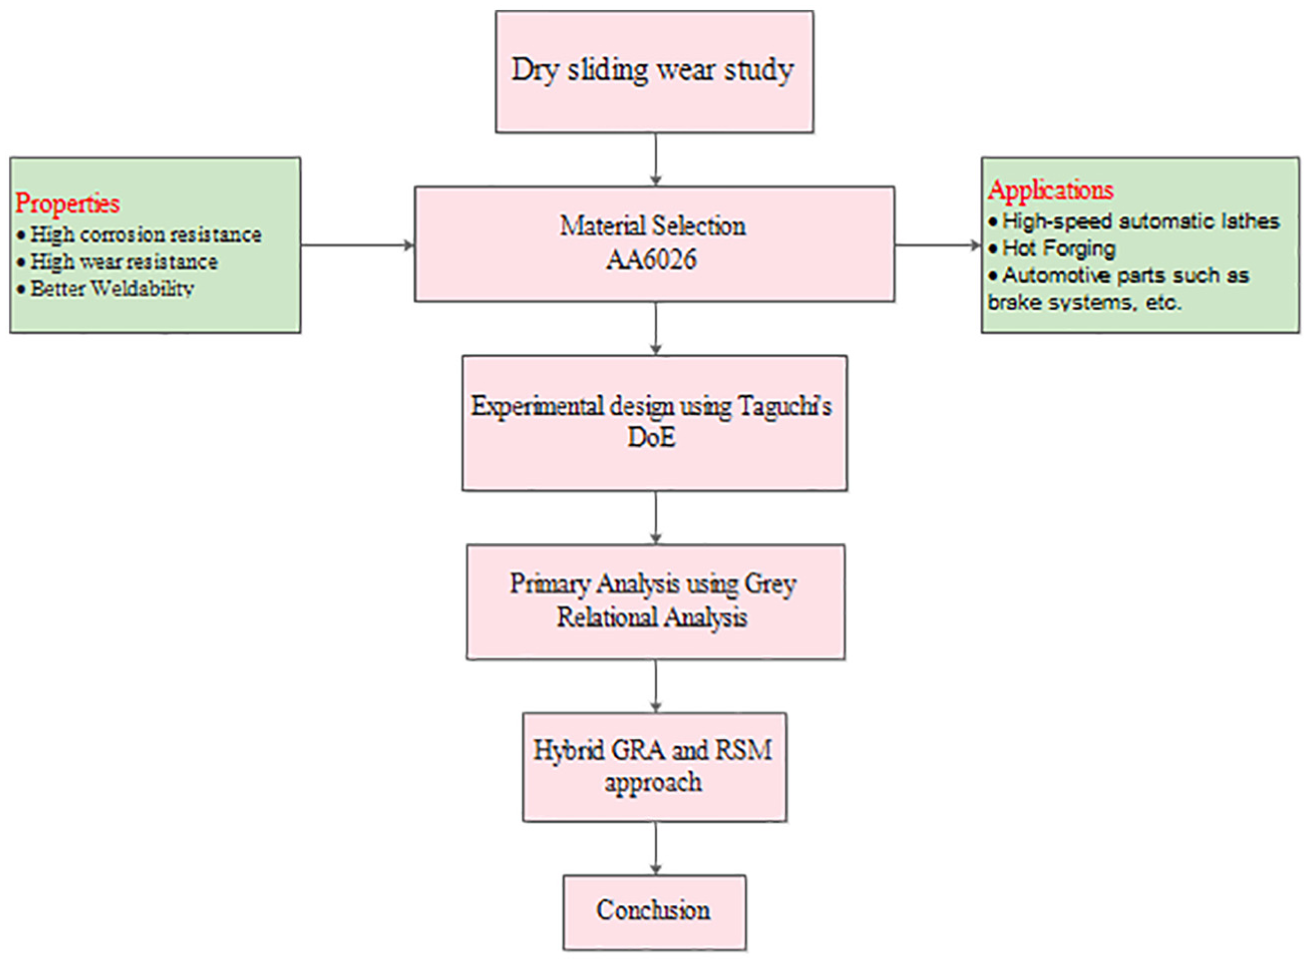
Methodology flow chart.
Taguchi’s DoE
To interpret many factors, a statistical technique is used, called Taguchi’s DoE. 15 Determination of the best factor combination is done by analyzing the outcomes of individual factors on the results. Amid many alternatives, the best design is strived out with the help of this technique when applied to design. 16 This technique is the most powerful tool for quality optimization. Taguchi’s technique makes use of a unique design of OA in order to interpret the quality characteristics through a lesser number of experiments. 17
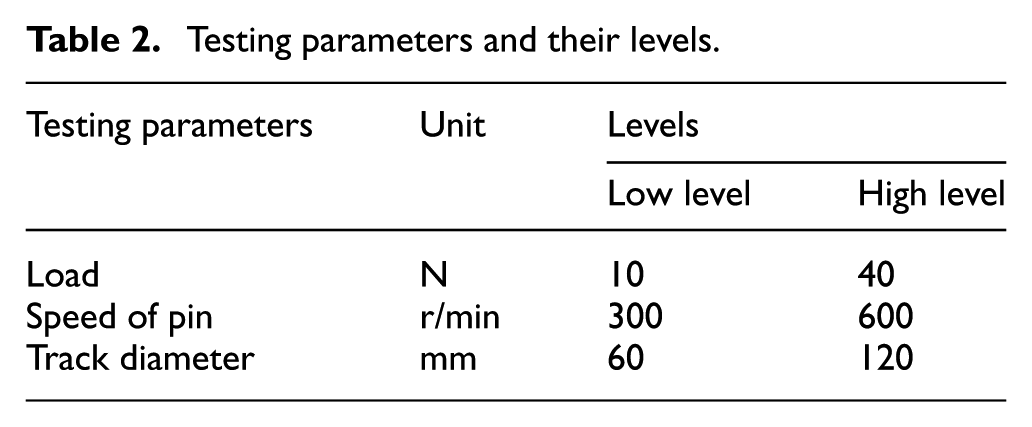
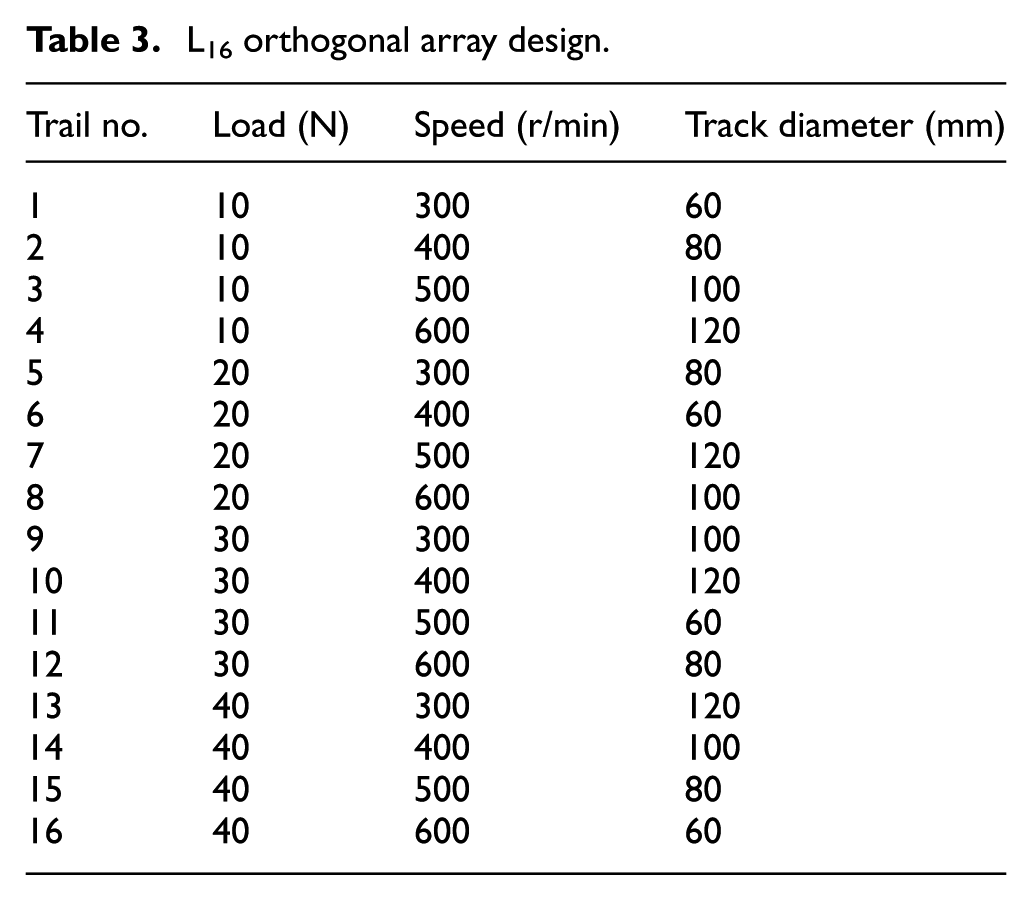
Several testing parameters in dry sliding wear testing were considered by researchers so far as identified from the literature survey. In this work, three parameters were selected for analysis namely, load, rotating speed of disk and track diameter of the disk. This study mainly focuses on analyzing three responses namely wear, coefficient of friction and frictional force. Three factors with four levels were chosen in this study in order to conduct the experiments for multifarious combinations of parameters, and an L16 OA was formulated. The parameters and their levels are shown in Table 2, and the formulated L16 OA design is shown in Table 3.
Testing parameters and their levels.
L16 orthogonal array design.
GRA
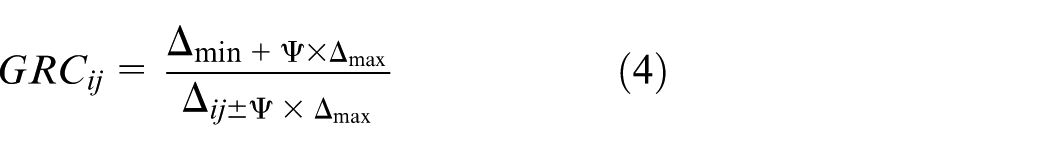
Dr. Deng developed the gray theory. It encloses the prediction, modeling and finally the decision-making of a system in which the information is insufficient or the model is not sure. The inter-relationship among the multiple performing characteristics is being solved by GRA. The unit and range in any one of the data sequence might differ from other data sequences; therefore, data pre-processing is done in GRA. 18 In GRA, the transformation of the results of experiments is in the range between 0 and 1. There are multifarious approaches of data pre-processing obtainable for the GRA which depends on the attributes of the data sequence. Normalization can be done by using the given equations:
(a) For lower-the-better criterion
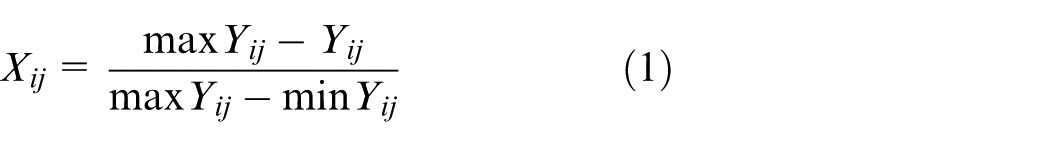
(b) For higher-the-better criterion
where

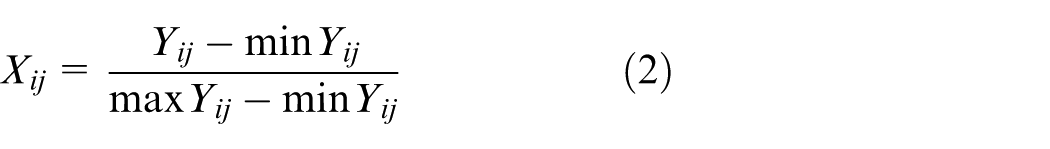
After the step of data pre-processing, calculation of gray relational coefficient (GRC) is done. This gives the relational degree between normalized and ideal experimental results. GRC can be calculated as
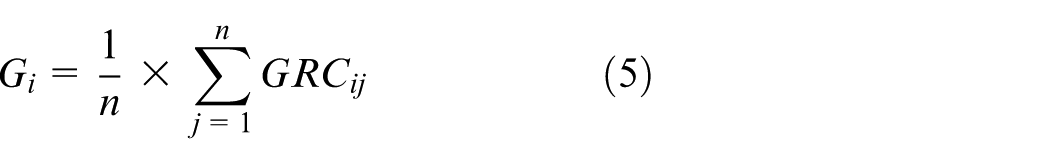
where
RSM
DoE is a scientific approach, which is used to perform the analysis and modeling of the impact of process variables on the responses.
19
In such methods, process variables are treated as design factors.
20
In this study, face-centered central composite design is used in RSM. RSM is a statistical as well as mathematical technique. An acceptable approximation for the true functional relationship between the response of interest ‘
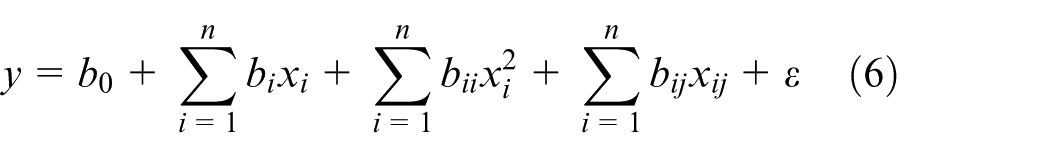
where ε is the error or noise observed in the response
Results and discussion
Metallographic studies have been carried out on AA6026 to perceive the constitutional elements and possible distribution. SEM and energy dispersive X-ray analysis (EDAX) of AA6026 have been taken. Figure 3 is the SEM image of 500× magnification which shows the distribution of grain particles, its size and its grain boundaries. Figure 4 replicates the EDAX graph image that shows the composition of the material AA6026. It consists of aluminum of 95.93%, magnesium of 0.62%, copper of 0.18%, zinc of 0.74%, chromium and ferrous of 0.16%, silicon 1.22%, bismuth 0.13%, manganese 0.04% and remaining others.
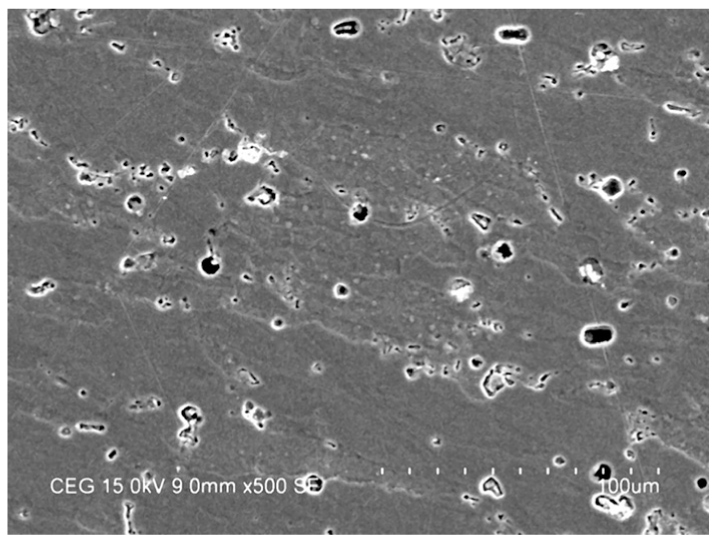
SEM micrograph of AA6026.
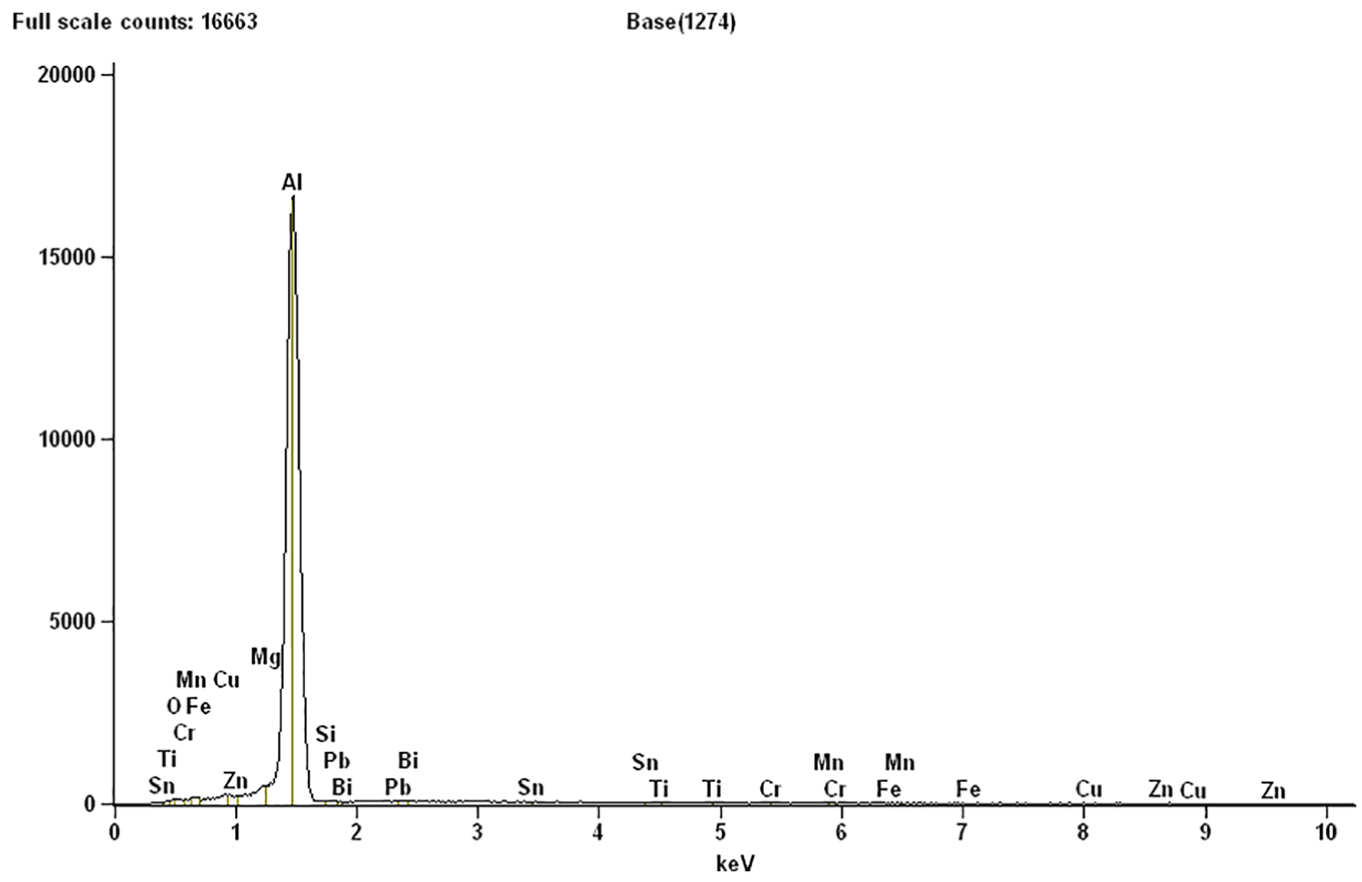
EDAX graph of AA6026.
Experiments have been performed on pin-on-disk apparatus on the basis of the design matrix developed from Taguchi’s DoE and the outputs measured were wear (microns), frictional force (N) and coefficient of friction. Table 4 shows the output of the experiments.
Experiment output table.
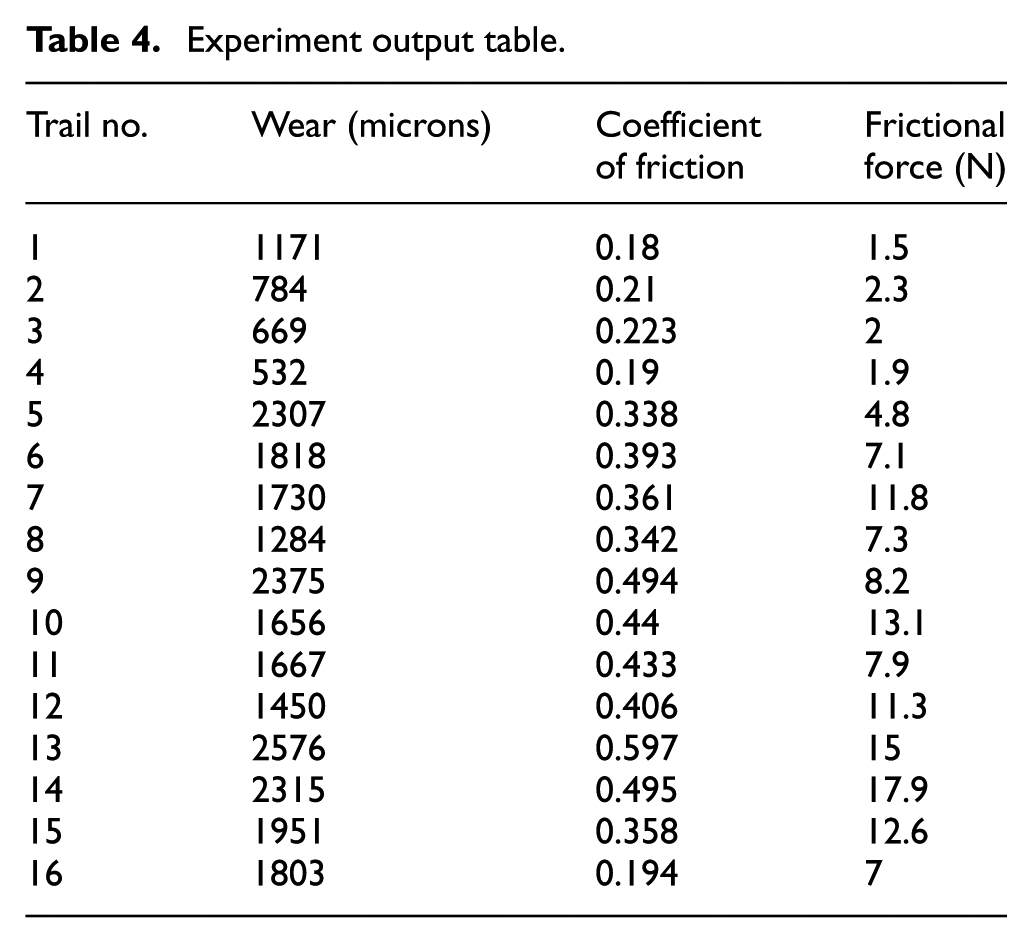
Observations made from the investigation shows that wear increases drastically when the load increased from 10 to 20 N due to the frictional heat generated at the contact surface which reduces the strength of the materials, 22 and then it increases slightly from 20 to 30 N, and then increases a bit higher from 30 to 40 N. Based on speed, the wear decreases drastically when the speed is increased. This happens due to the increased separation between two surfaces which will decrease the real area of contact. The contribution of increased separation at higher speeds results in the reduced time duration of compression of opposite asperities. 23 Based on track diameter, there is no big change in wear rate. Because the track diameter has a negligible effect on the wear, this may be because after a certain point, the surfaces become smooth and also the wear particles from the pin deposit on the disk; hence, the roughness is reduced and causes further negligible wear. The load was very important because it increases the contact area of surfaces, and very high stresses at peaks and valleys of the surface finish result in a higher order of wear rates. 24 Coefficient of friction in relation with load increases drastically when the load is increased from 10 to 30 N, after which it decreases even when the load is increased further. Based on the speed, the coefficient of friction decreases when the speed increases; based on the track diameter, coefficient of friction increases when the track diameter increases; and frictional force increases when the load increases. This is due to the fact that frictional heat is generated at the contact surface which declines the material strength as the load increases. 23 When the speed is increased from 300 to 400 r/min, frictional force increases after the friction force decreases when speed is increased. When track diameter is increased, the frictional force increases. The coefficient of friction does not directly depend on speed and load, but it is influenced by the change in temperature. 25 The load is the dominating parameter that affects wear rate, coefficient of friction and frictional force followed by speed and track diameter. If load increases, the interface temperature increases and softening of material occurs which leads to debonding of grains from the surface which lead to an increase in wear rate. The next dominant parameter is speed, since track diameter has a negligible effect on wear rate. As there is an elevated separation between pin and disk at higher speeds, the wear rate gets decreased at higher speeds which made it as second dominant parameter after load.
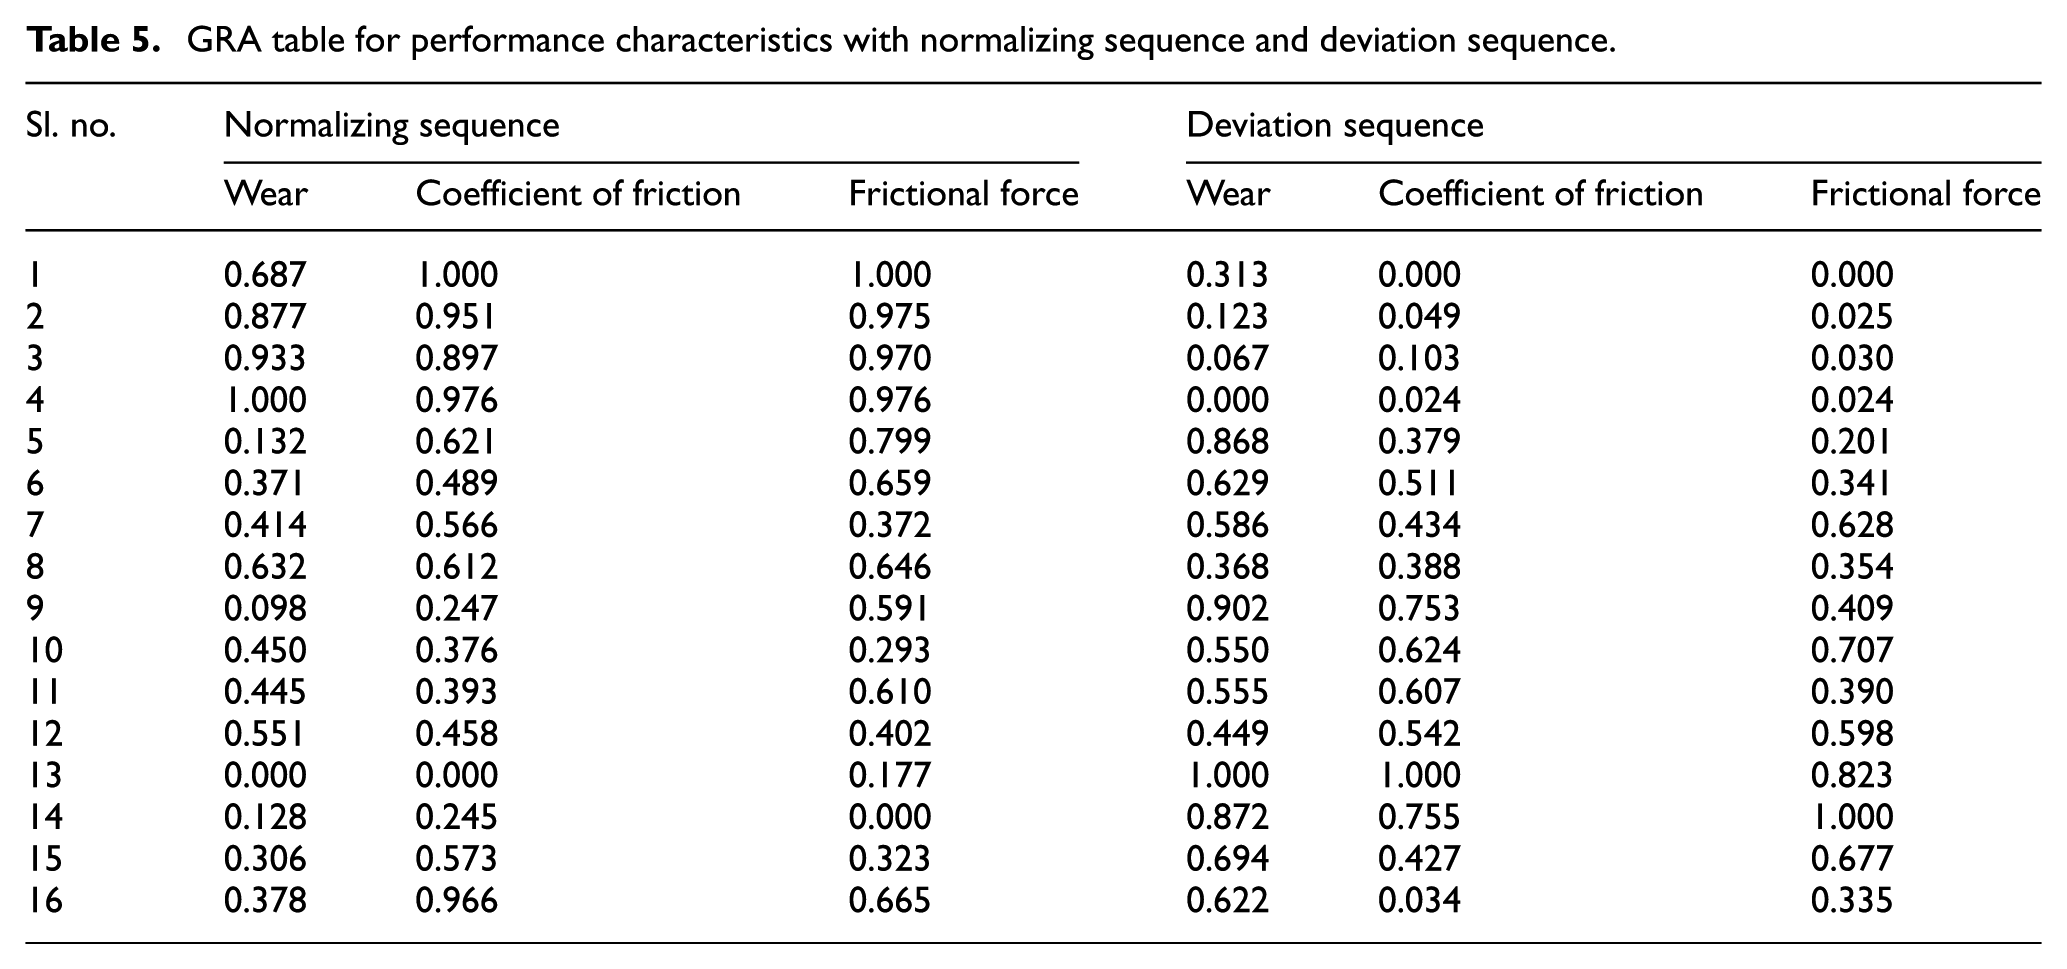
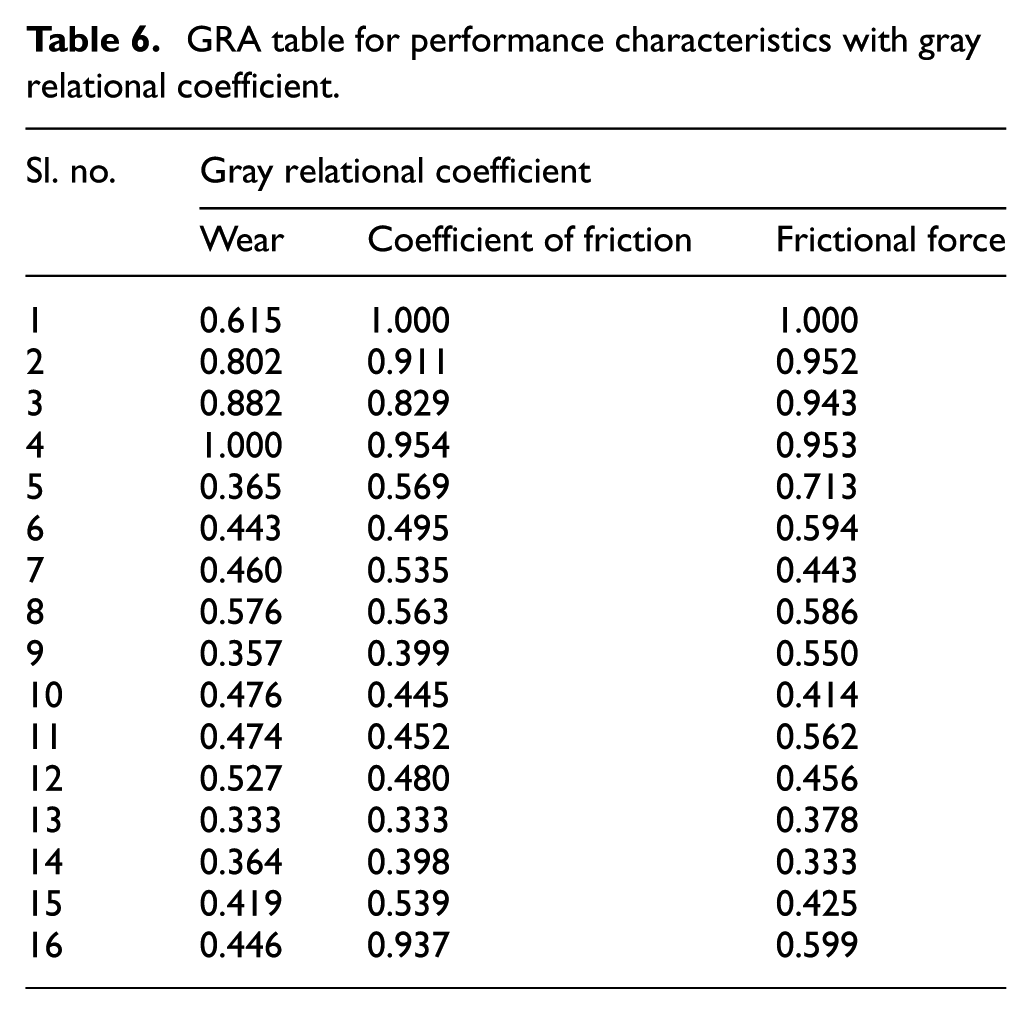
In GRA, the initial procedure is pre-processing of the obtained data. In this case, all the output response indications of “lower-the-better” characteristics are considered. All the original sequences are normalized using equation (1). 26 In the next step, the deviation sequence is calculated using equation (3) and both normalized and deviation sequences, as listed in Table 5. Furthermore, the gray relation coefficient is computed using equation (4), 27 which is in Table 6. This gray relation coefficient is further used as an output response in RSM to finally optimize the outputs.
GRA table for performance characteristics with normalizing sequence and deviation sequence.
GRA table for performance characteristics with gray relational coefficient.
The optimization was done by using RSM in Design-Expert-7.0 software. Method of Central composite design is utilized here for the analysis with alpha value 1. The three responses are kept as minimum, for achieving the better inputs.
Analysis of wear
Analysis of wear for AA6026 is performed for achieving a minimum response. To achieve better performance, the wear at the surface of the aluminum alloy pin should be lower. 28 The ANOVA table for wear is given in Table 7.
Analysis of variance table for wear
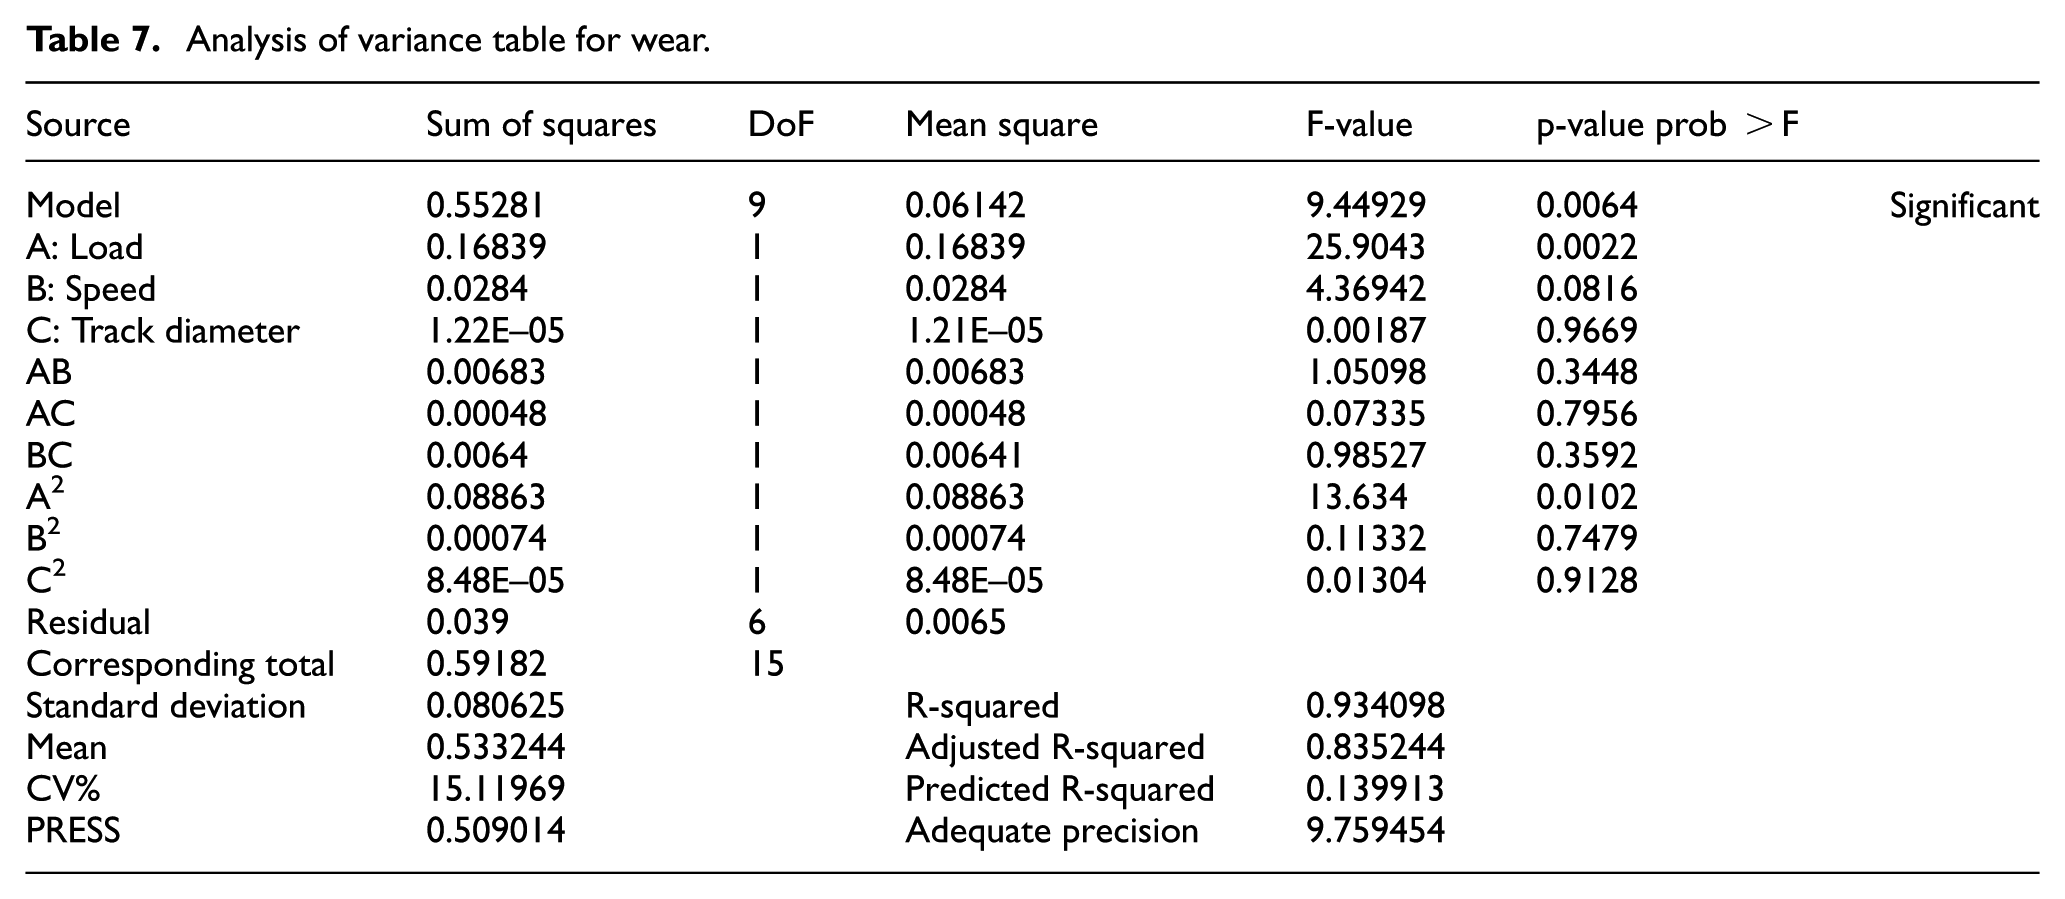
In Table 7, the Model F-value of 9.45 shows that the model is significant. There is only 0.64% prospect, that a larger “Model F-Value” could occur owing to noise. Values of “Prob > F” less than 0.0500 implies model terms are significant. R-squared value 0.934098 seems to be good for the developed model. Final equation in terms of actual factors for output response wear is provided as equation (7)
Figure 5 shows the three-dimensional (3D) inter-relational plot between load, speed and track diameter against the wear shows a decrease in wear when load increases and an exponential curve is obtained. Increase in wear is observed when speed increases and the linear curve is obtained. Wear reduces when the track diameter is reduced, and the linear curve is obtained. The normal probability plot of the residuals is approximately linear where the points are placed nearer to the fitted straight line.
Model graph for effect of load, speed and track diameter on wear.
Analysis of coefficient of friction
During the dry sliding wear experiments, the obtained coefficient of friction is analyzed when the, minimized response is set as a goal, to achieve the reduced friction in between the sliding surfaces, and the coefficient of friction is to be lower. 29 The ANOVA table for the coefficient of friction is given in Table 8.
Analysis of variance table for coefficient of friction
In Table 8, the Model F-value of 38.22 shows the model is significant. There is only 0.01% prospect that a larger “Model F-Value” could occur owing to noise. Values of “Prob > F” less than 0.0500 implies model terms are significant. R-squared value 0.982855 seems to be good for the developed model. Final equation in terms of actual factors for the output response coefficient of friction is given as equation (8)
Figure 6 shows the 3D inter-relational plot between load, speed and track diameter against the coefficient of friction, where there is a decrease in coefficient of friction when load increases, and the exponential curve is obtained. Increase in coefficient of friction is observed when speed increases and the linear curve is obtained. The coefficient of friction reduces as the track diameter increases and the exponential curve is obtained. In the normal probability plot of the residuals, the points are placed closer to the fitted straight line which implies the plot is approximately linear.
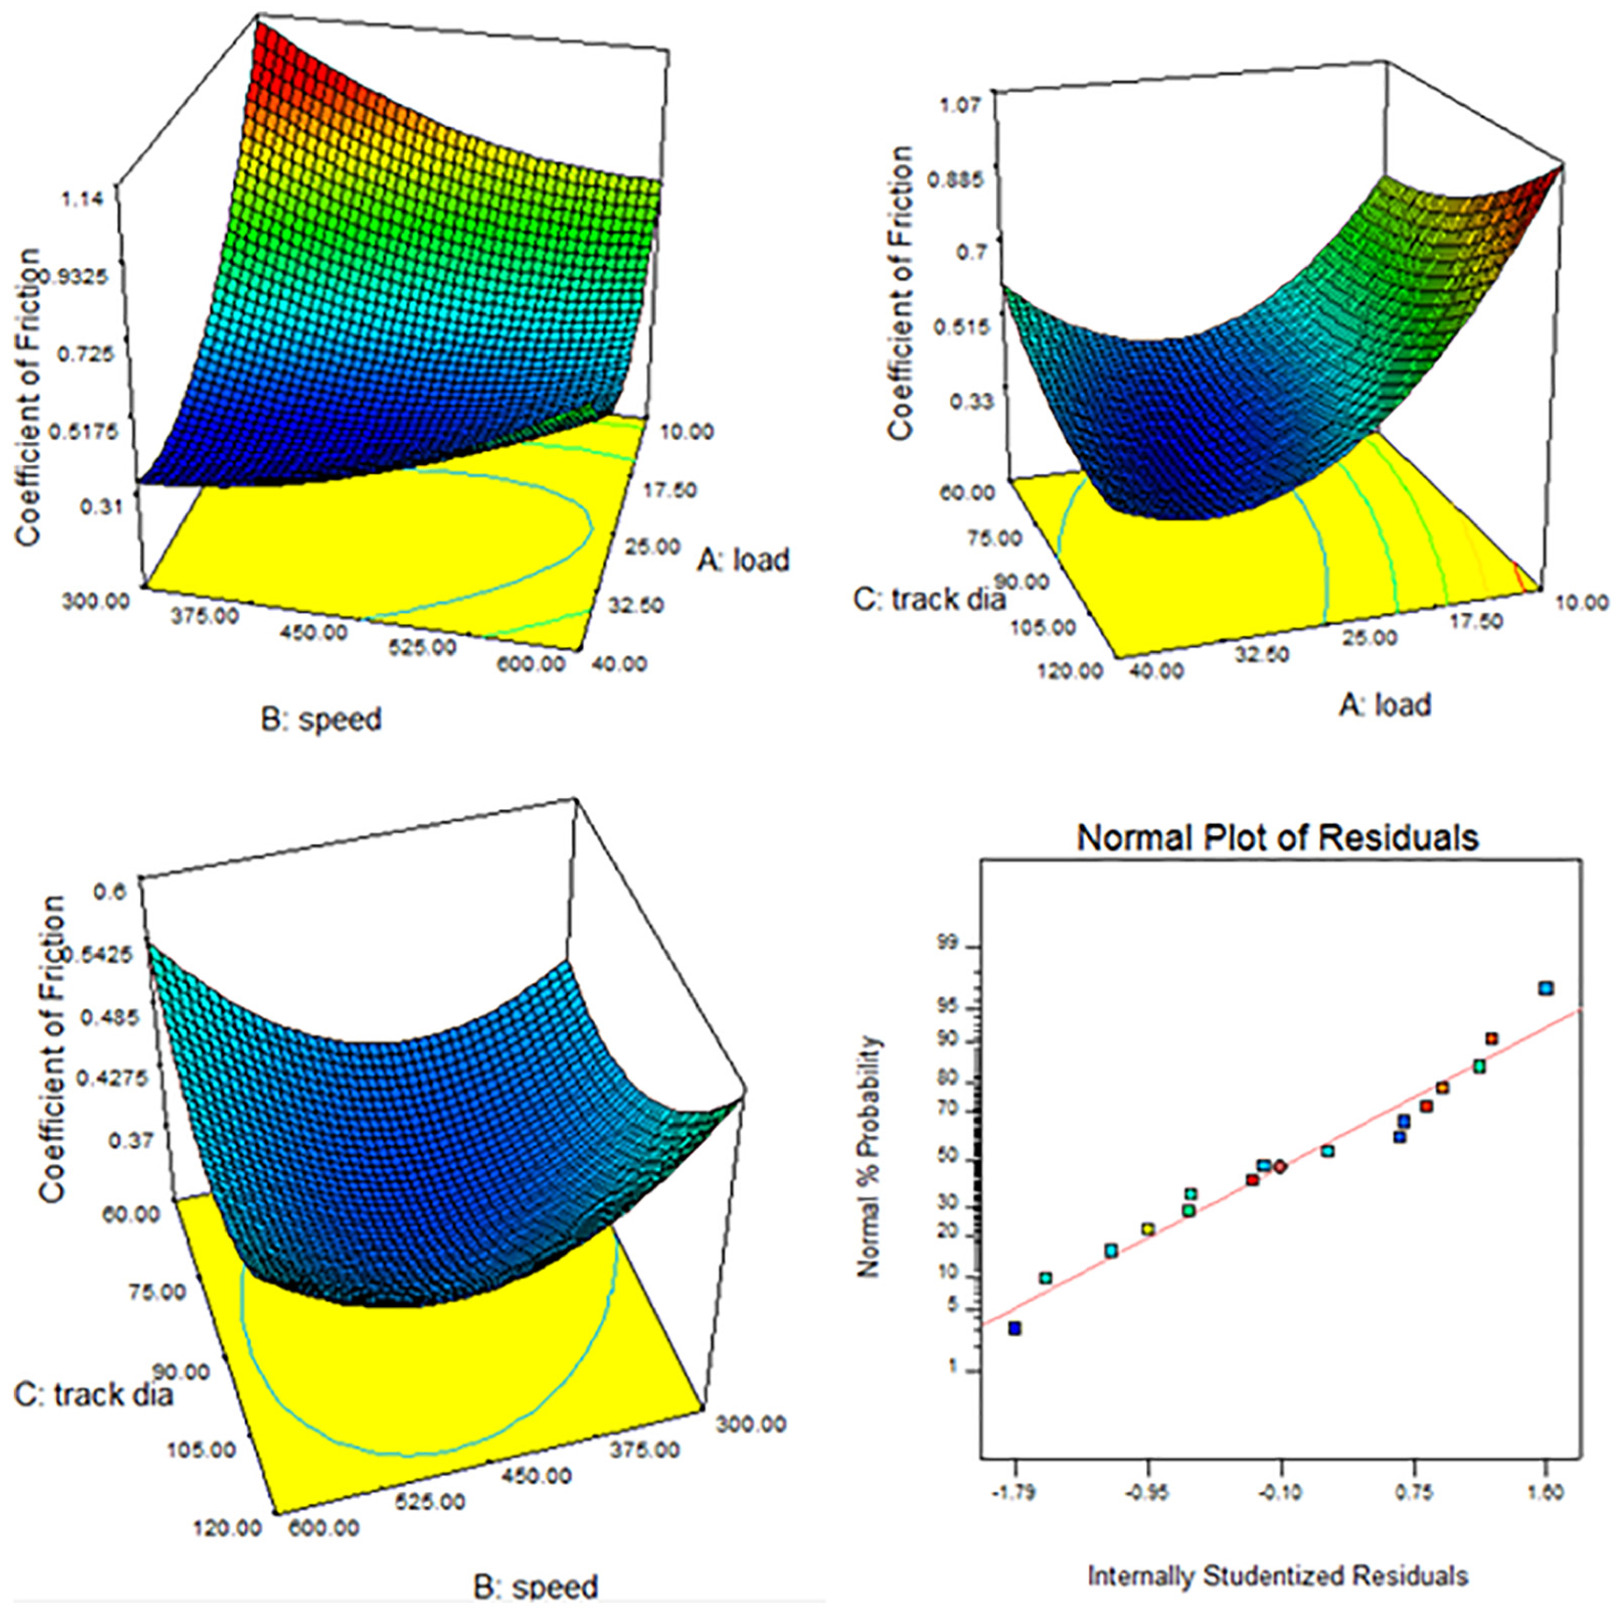
Model graph for effect of load, speed and track diameter on coefficient of friction.
Analysis of frictional force
During the wear test, the frictional force acts on the specimen must be low so that the specimen will not be subjected to wear and tear. Analysis of frictional force is done by setting minimized response as the goal. 30 Table 9 shows the ANOVA table for frictional force.
Analysis of variance table for frictional force
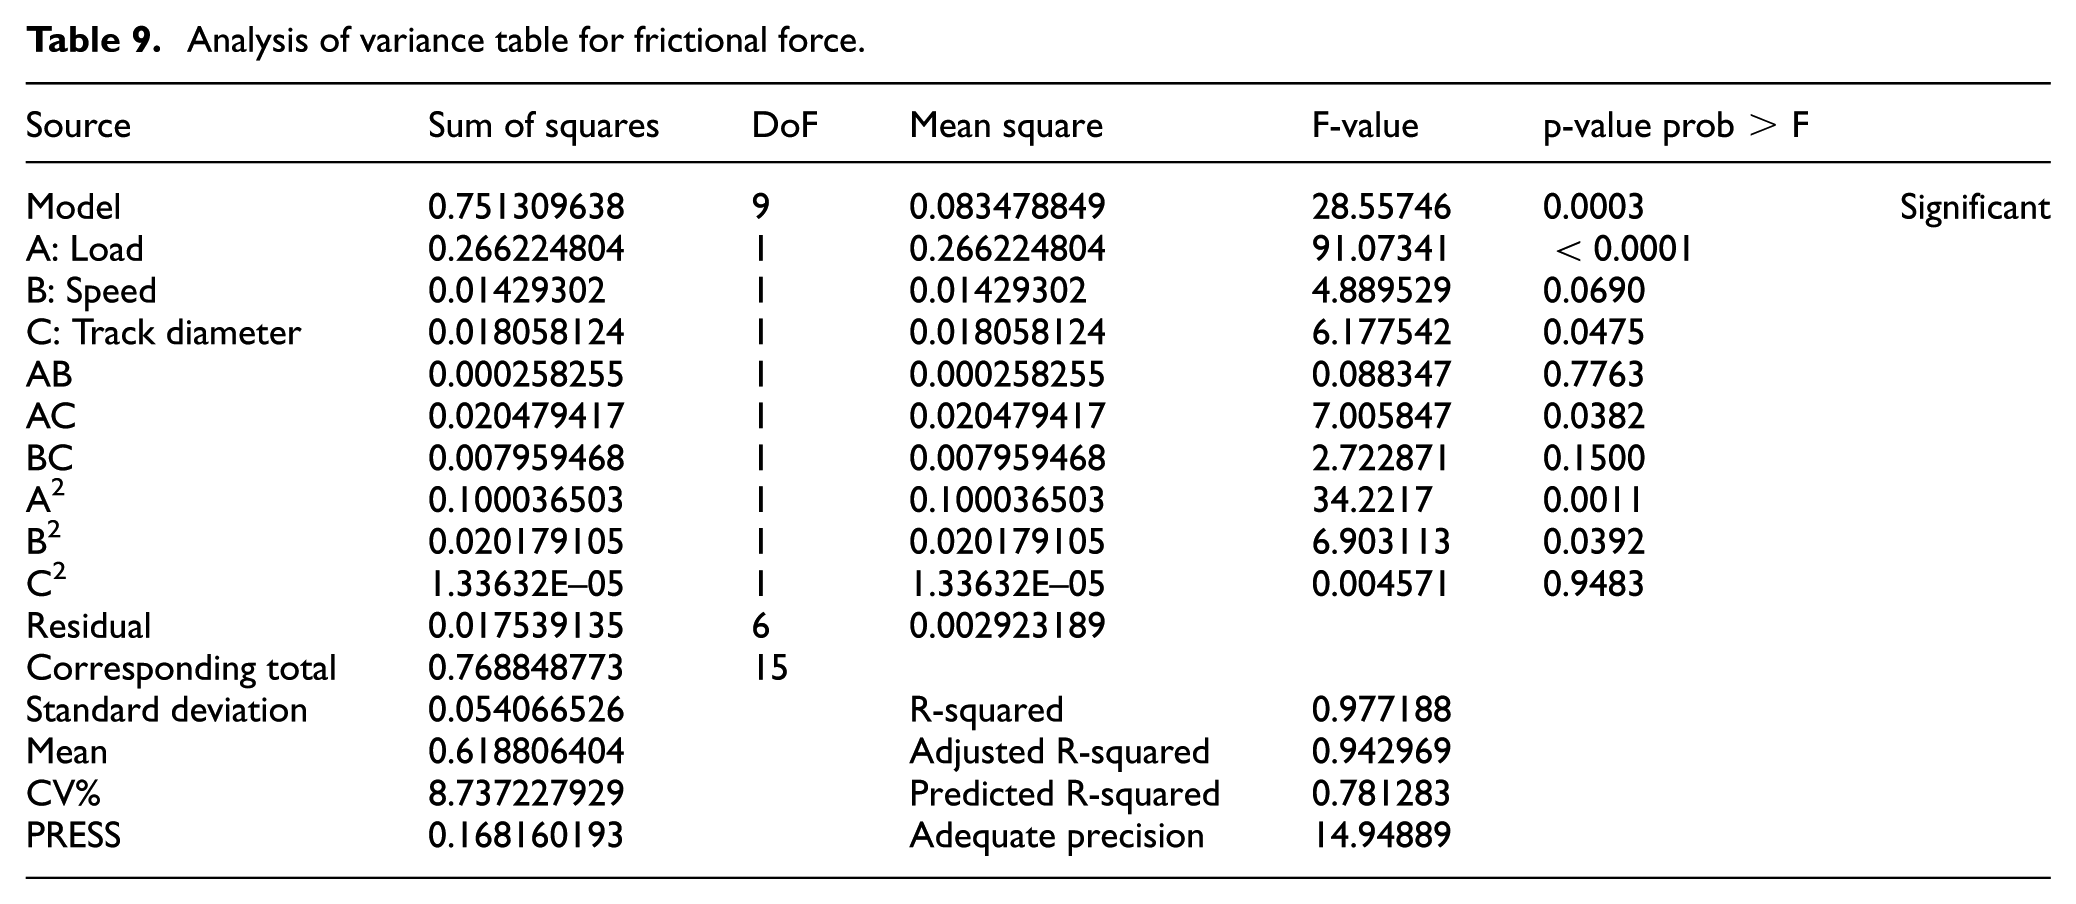
In Table 9, the Model F-value of 28.56 shows the model is significant. There is only a 0.03% prospect that a “Model F-Value” this large could occur due to noise. Values of “Prob > F” less than 0.0500 implies model terms are significant. R-squared value 0.977188 seems to be good for the developed model. Final equation in terms of actual factors for output response frictional force is given as equation (9)
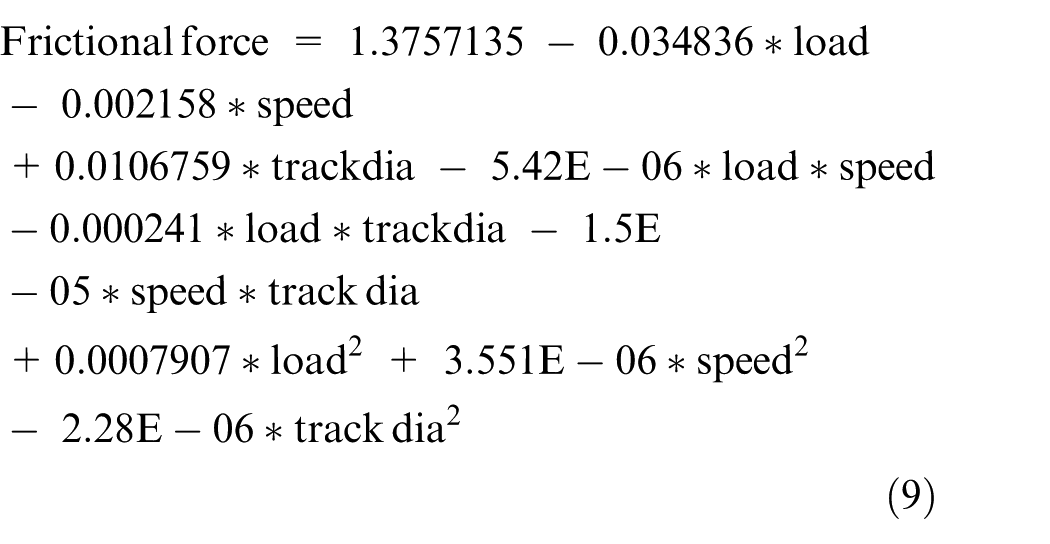
Figure 7 shows the 3D inter-relational plot between load, speed and track diameter against the frictional force, where there is a decrease in frictional force when load increases, and the exponential curve is obtained. The slight decrease in frictional force is observed when speed increases and the linear curve is obtained. Frictional force decreases as the track diameter increases, and the linear curve is obtained. The normal probability plot of the residuals is approximately linear where the points are placed nearer to the fitted straight line.
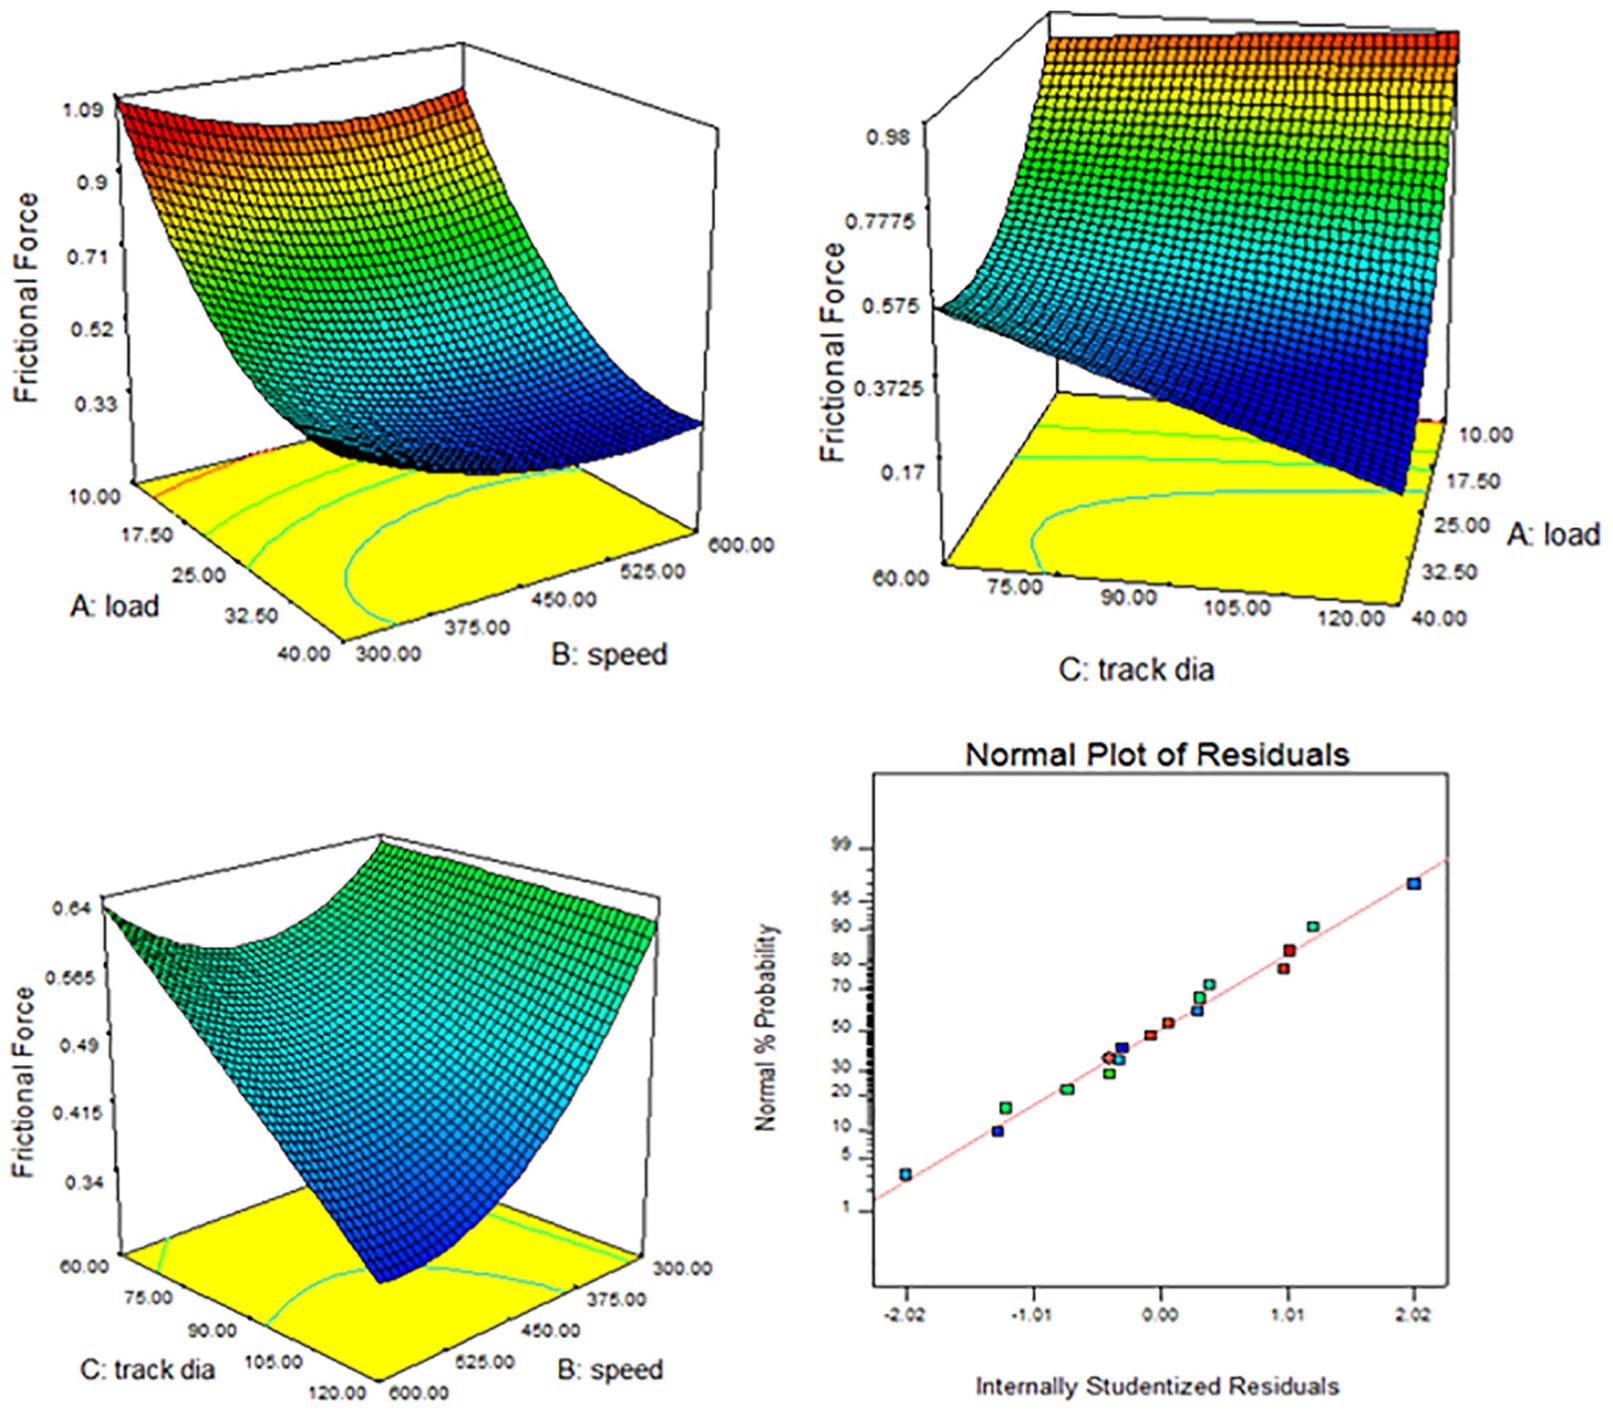
Model graph for effect of load, speed and track diameter on frictional force.
Multi-objective optimization using desirability analysis
Multi-objective optimization using desirability analysis has been done. Table 10 shows the optimized level, high and low level of load, speed and track diameter. It also shows the predicted GRC for output responses values as 0.351 for wear, 0.333 for coefficient of friction and 0.333 for frictional force. Figure 8 shows the graph of optimized; high- and low-level wear, speed and track diameter values and their output response values. Figure 9 shows the desirability values obtained.
Multi-objective optimization using desirability analysis.
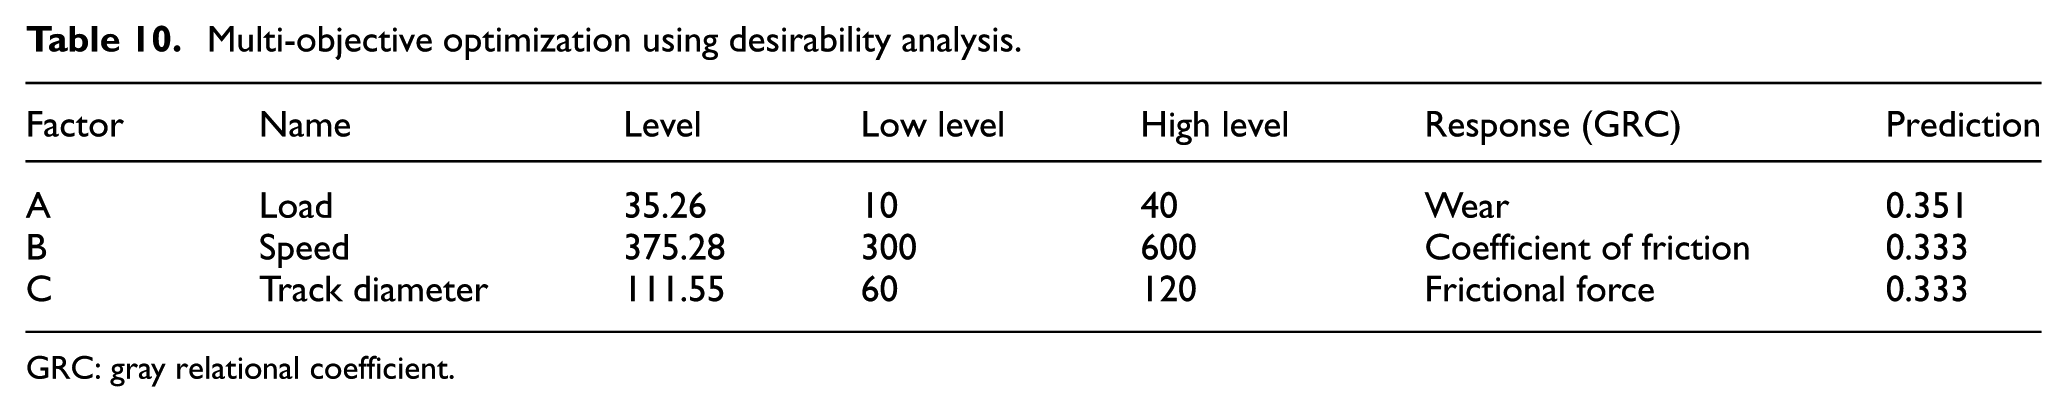
GRC: gray relational coefficient.
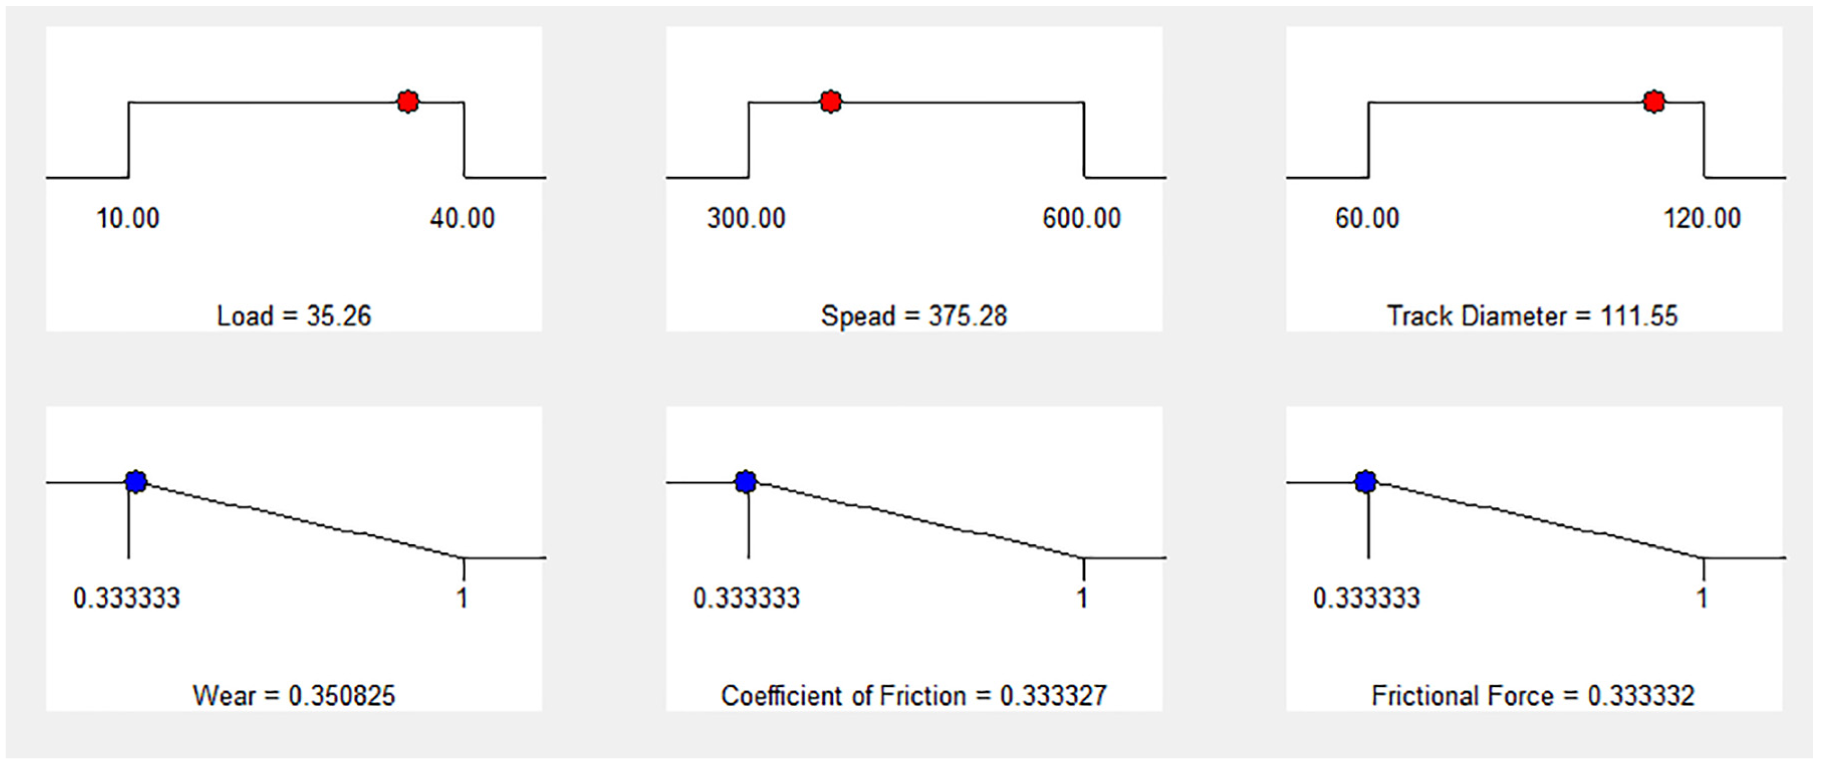
Graph for optimized, high and low-level wear, speed and track diameter values and their output response values.
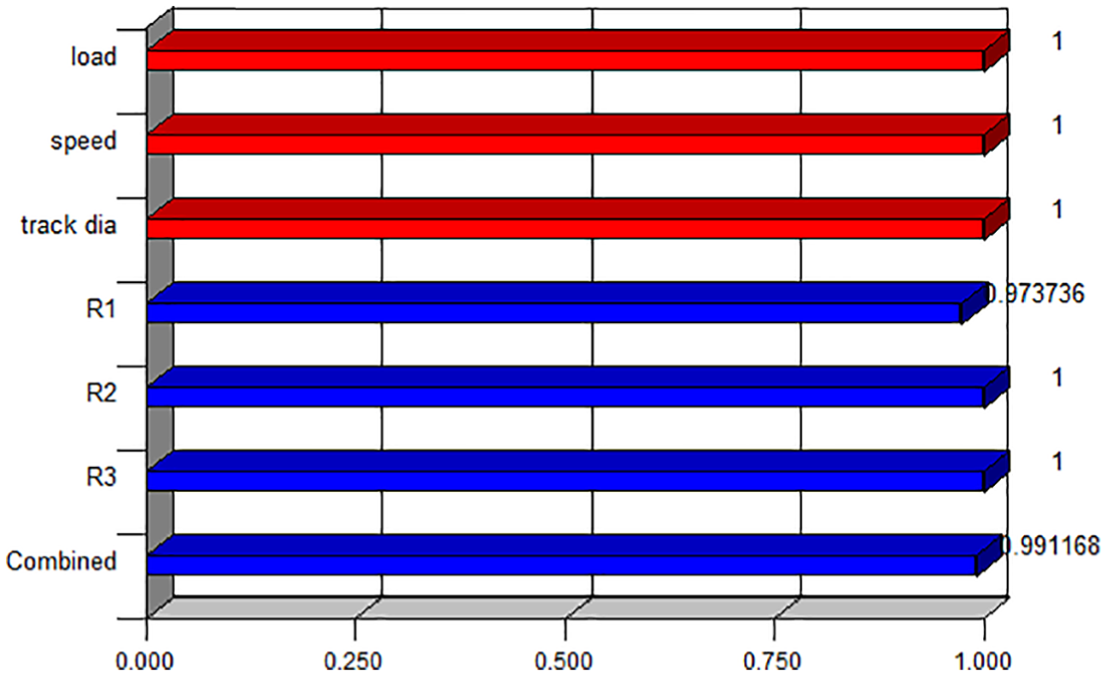
Desirability Bar graph.
For the wear behavior of any materials, the following mechanisms should be identified: abrasion, oxidation, adhesion and thermal softening and melting. These wear mechanism can be identified by performing SEM. Abrasion wear is due to the worn surface filled with grooves which are parallel to sliding direction. Adhesion wear occurs due to the formation of pits, shallows, cracks formed on the worn surface with increased friction. Oxidation occurs when exposed to the atmosphere at a high temperature. Thermal softening and melting occurs due to high temperature. The metallographic study is performed to investigate the wear track on the specimens, which are shown in Figure 10. The wear mechanism indicated in the SEM image implies the abrasive wear mechanism. Wide parallel lines in Figure 10(a) shows the wear track obtained with little plastic deformation which implies the abrasive wear type. On the worn surfaces distinct grooves were observed in micrographs which eventually gets crushed off to become debris. Figure 10(b) also shows the abrasive wear mechanism which indicates the wear track and some particles that got debonded adhere again to the surface. Figure 10(c) implies that the abrasive wear mechanism and the rate of wear is lower than the rate of wear obtained in Figure 10(d). In Figure 10(d), there are some materials which are shifted to the sides of the wear groove. The material is not removed from the surface which indicates the plowing-type abrasive wear mechanism.
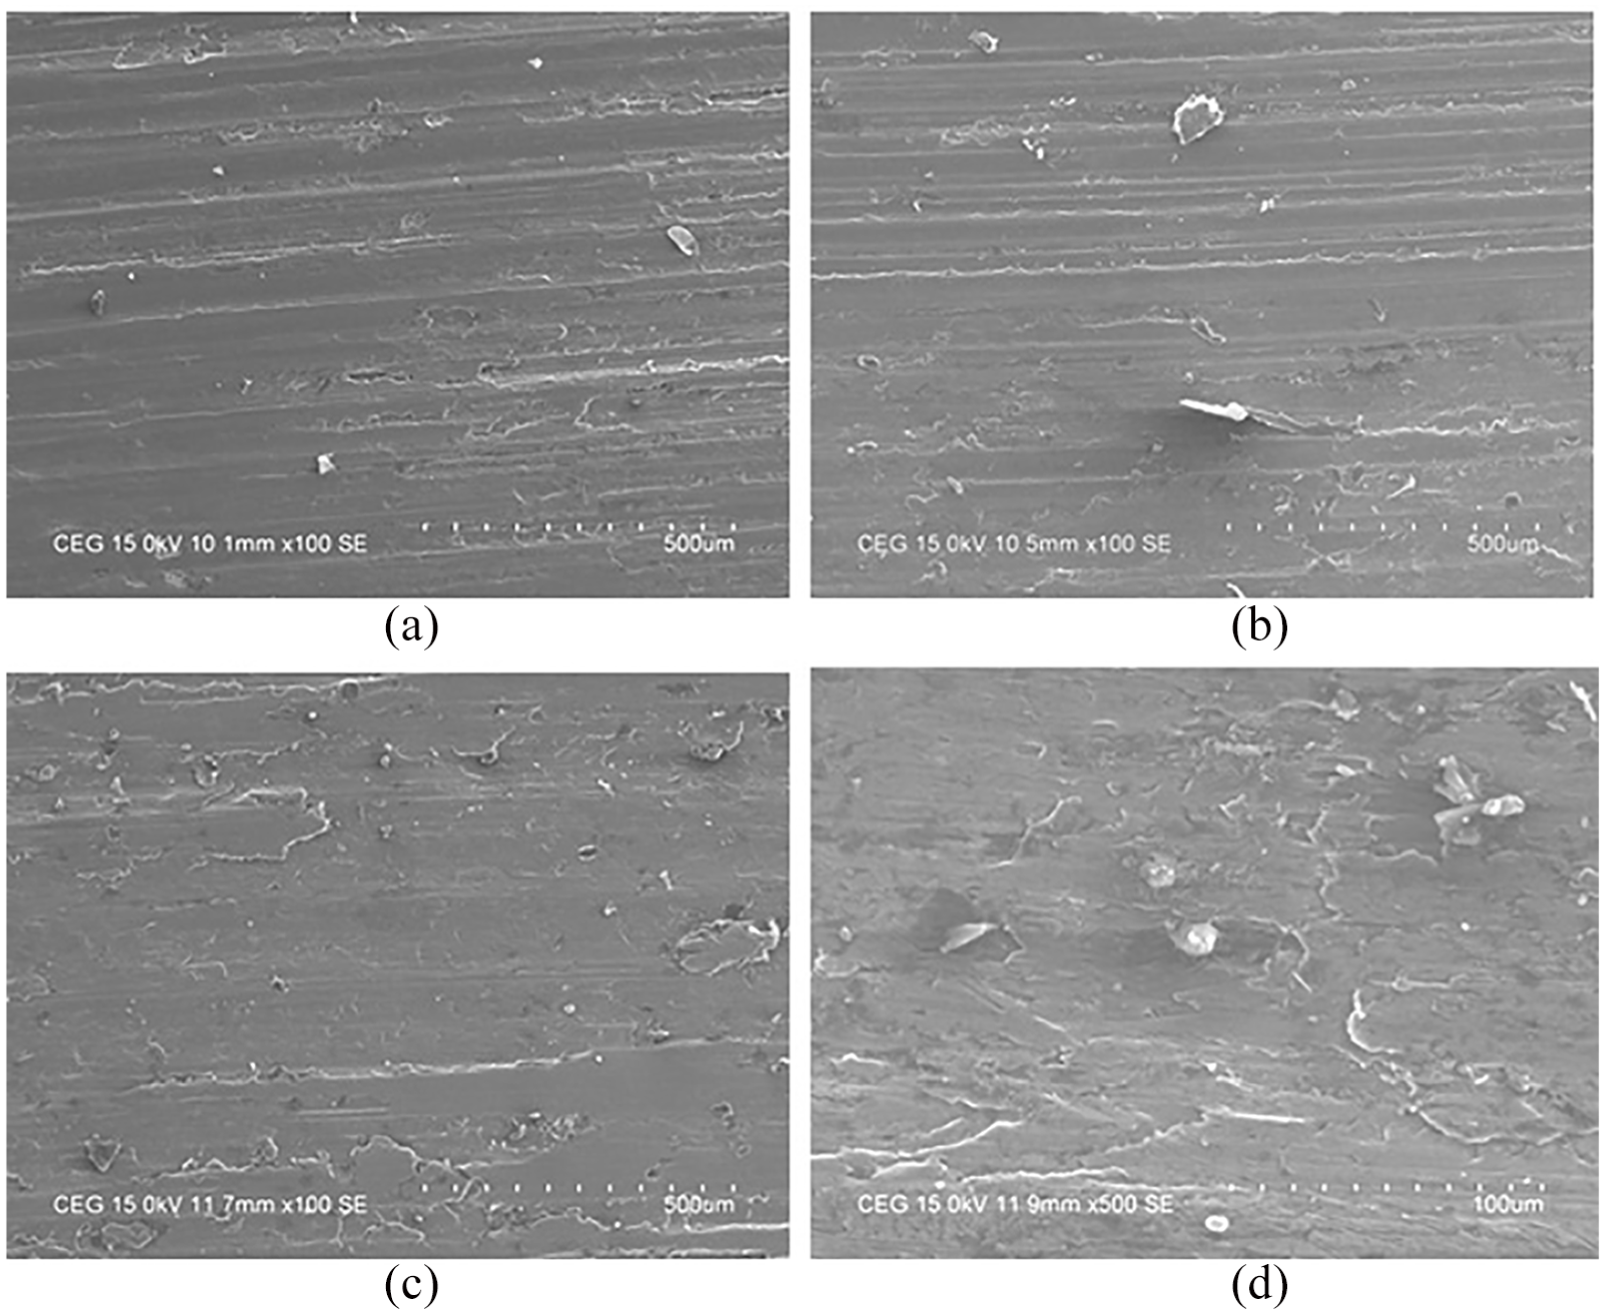
SEM micrograph of Specimens after the wear test: (a) micrograph for load 10 N, speed 600 r/min and track diameter 120 mm, (b) micrograph for load 10 N, speed 300 r/min and track diameter 60 mm, (c) micrograph for load 20 N, speed 400 r/min and track diameter 60 mm, and (d) micrograph for load 40 N, speed 300 r/min and track diameter 120 mm.
Confirmation test
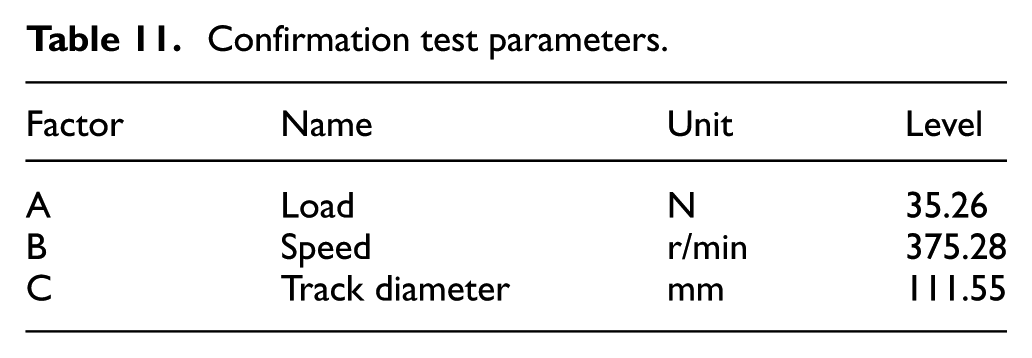
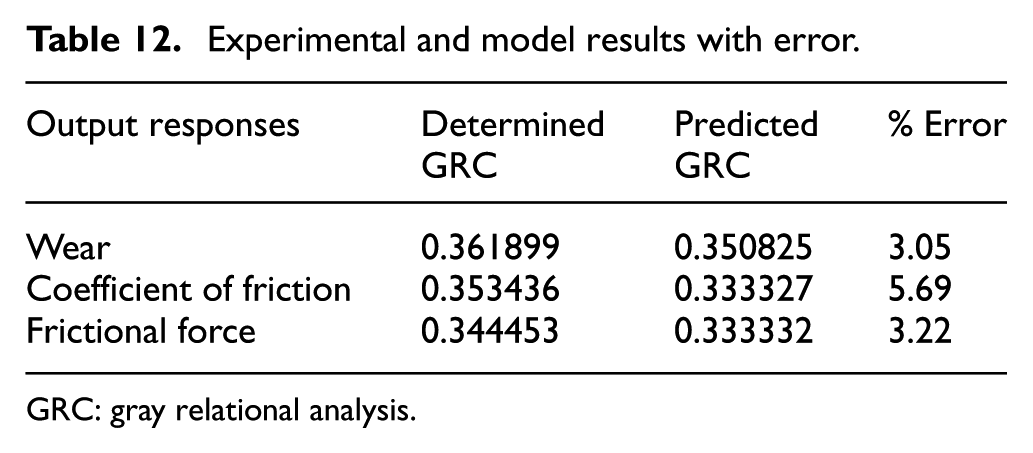
After performing the dry sliding wear analysis of AA6026, it was significant to perform confirmation tests in order to find out the validity of the current model. Confirmation tests were carried out at optimum combinations of process parameters for wear, coefficient of friction and frictional force, which finally gives out the minimum quantity of material removed from the alloy. The optimum combinations of the three process parameters, which were given by the model, were chosen for the tests. Table 11 shows the set of test parameters. The minimal wear was obtained at a load of 35.2058 N, the speed of 375.6539 r/min and track diameter of 111.5318 mm as proposed by the RSM model. Table 12 shows the experimental and model results with error percentage. Figure 11 shows the micrograph of the specimen after the confirmation test which indicates the abrasive wear mechanism.
Confirmation test parameters.
Experimental and model results with error.
GRC: gray relational analysis.
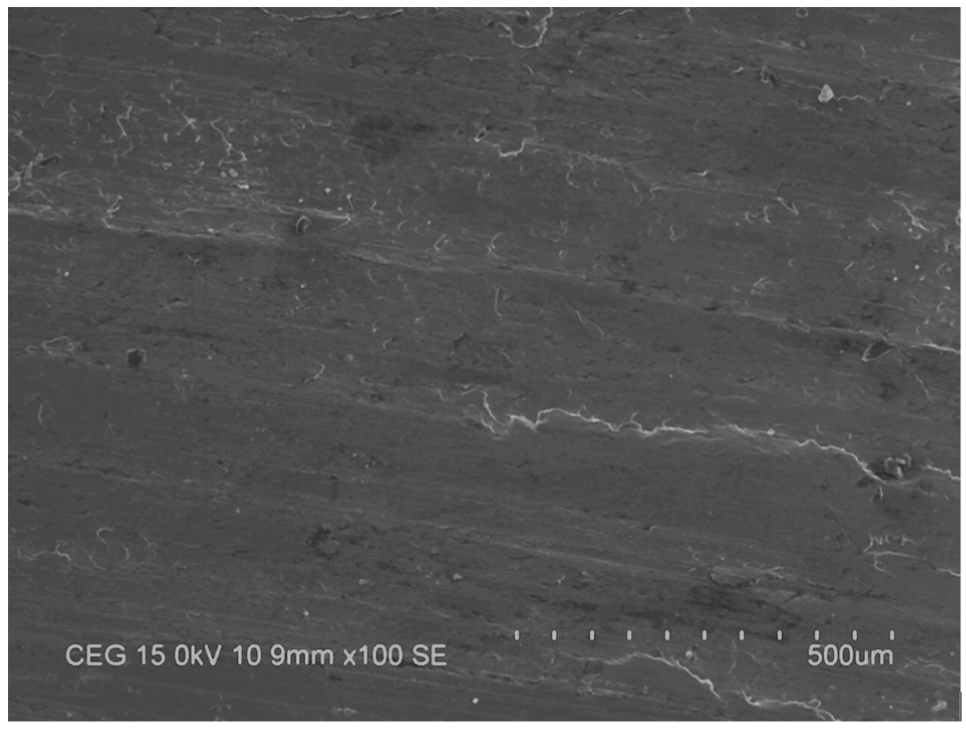
SEM micrograph of specimen after the confirmation wear test.
Conclusion
The dry sliding wear behavior of AA6026 has been studied by utilizing combined GRA and RSM. From the outcomes gained in this analysis, the following conclusions can be drawn:
SEM micrograph of AA6026 shows the distribution of grain particles its size and its grain boundaries, and EDAX graph image shows the composition of the material, which coincides with the chemical composition of AA6026.
Taguchi’s DoE is utilized for experimental design, for three parameters diverse through four levels, an L16 OA is selected.
Experiments were conducted, and the optimum setting for minimal wear suggested by RSM is achieved at a load of 35.21N, the speed of 375.65 r/min and track diameter of 111.53 mm.
The outputs predicted by the current model and gained from the confirmation tests are in close concord, and the errors lie within 3%–6%.
SEM image for specimens after testing were taken, which shows that the abrasive wear mechanism is the predominant mechanism causing wear.
Footnotes
Declaration of conflicting interests
The author(s) declared no potential conflicts of interest with respect to the research, authorship and/or publication of this article.
Funding
The author(s) received no financial support for the research, authorship and/or publication of this article.