
Abstract
The swirl meter (vortex precession flow meter) popularly used in natural gas industry is a kind of velocity flow meter with high turndown ratio and well performance in low flow measurement and other known advantages. In order to further understand the flow pattern of swirl meter to further improve its performance, computational fluid dynamics simulations are used to simulate the flow and predict the coefficient for swirl meter at different flow rates. Using renormalization group k–ε turbulent model and SIMPLEC algorithm, numerical simulations have been performed through commercial codes Fluent, and meter coefficients are also obtained experimentally to validate the numerical results. The simulated velocity and pressure in swirl meter are analyzed in detail, which are time-averaged distributions during a time period based on the transient numerical simulation. It is found that centerline pressure is lowest at the outlet of the swirler and rises gradually along the axial direction. While near-wall pressure presents an opposite variation tendency, it is significantly low at the end of throat due to strong influence of vortex precession. Centerline velocity increases as the flow approaches throat and reaches its maximum at center region of throat, and then it decreases and keeps relatively stable at downstream of divergent section. Both time-averaged pressure and axial velocity distributions are axisymmetric, and pressure variation is small on the cross section at the end of throat, although vortex precession is strong.
Introduction
Custody transfer is an important application for flow measurement. Swirl meter has merits of high turndown ratio and accuracy, stable performance and reliable operation, which are of great importance during custody transfer metering, and has been widely used in natural gas industry. 1
For the flow in swirl meter, vortex is generated through swirler, due to the expansion of flow passage at the downstream of throat, backflow occurs and forces the axis of the vortex into a secondary spiral rotation which is precession. The precessional frequency (f) is proportional to flow rate (Q), and the relationship is shown in the below equation
where K is the meter coefficient, and it is a constant when the structure of swirl meter is fixed.2,3
With the advances in sensors, electronic technology and signal procession,4,5 swirl meter performance, especially low-flow measurement and anti-interference, is enhanced by processing differential signal. 6
At present, computational fluid dynamics (CFD) simulation could reveal flow fields vividly, including flow pattern, velocity and pressure distributions, and predict the meter coefficient, especially for some new geometrical structure and special flow conditions.
Singh and John Tharakan 7 used CFD simulation to determine the discharge coefficients for single and multi-hole orifice flow meter and found that the pressure loss of multi-hole orifice meter was less than that of single hole due to the early reattachment of flow. Shah et al. 8 captured turbulence effect in orifice flow and estimated discharge coefficient and found that the pressure recovery downstream of orifice plate was affected by compressibility nature of the air when flow was under high Reynolds number. Guo et al. 9 have shown that viscosity effects the pressure distributions on the rotor blades and then impacts the performance of turbine flow meter. Reader-Harris et al. 10 experimentally and numerically studied the discharge coefficient of contaminated orifice plates and found that the experiments and CFD results were in good agreements. Hollingshead et al. 11 obtained the relation between Reynolds number and discharge coefficient of differential producer and pointed out that discharge coefficients decreased rapidly with the decreasing Reynolds number for Venturi, V-cone and wedge flow meters.
There are also some attempts in simulating flow in swirl meter,12–14 but the researches are few. The three-dimensional unsteady flow in swirl meter is more complicated than that in differential pressure flow meter like orifice or Venturi meter. In previous studies, we focused on analyzing the transit flow fields. The streamlines, velocity distributions and pressure fluctuations were discussed in detail, the effect of swirler and Venturi-like tube structure on internal flow was studied, and vortex precession motion was numerically observed.15–17 In order to further understand the flow pattern of swirl meter to further improve its performance, numerical simulations have been performed for swirl meters at different flow rates through commercial codes Fluent. In the present paper, numerical physical quantities are processed into time-averaged ones during a time period based on the transient numerical simulation, which is different from that in previous studies. This will obtain some new flow features in swirl meters.
Research models of swirl meter
Swirl meter consists of Venturi-like tube (hereafter abbreviated as tube), swirler and deswirler. Swirler assembled at the inlet of the tube is used to produce vortex flow, and it consists of six helical blades which are fixed to the shaft. During the fluid flow through swirl meter, adequate length at the upstream (10D) and downstream (5D) ensures fully developed turbulent flow. The flow domain including extensions at the inlet and outlet is shown in Figure 1, and the structure parameters of the tube are shown in Table 1.
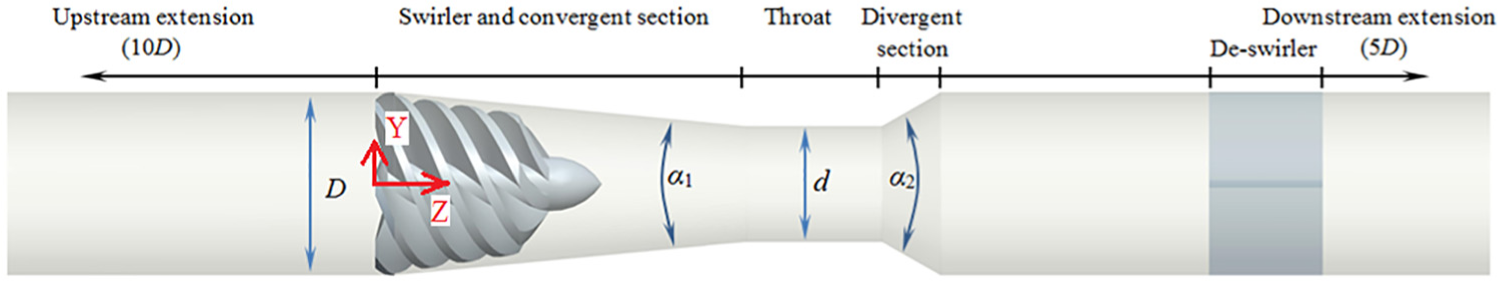
The geometry of swirl meter considered for simulation.
The main structure parameters of the Venturi-like tube.
Numerical procedure
Meshes
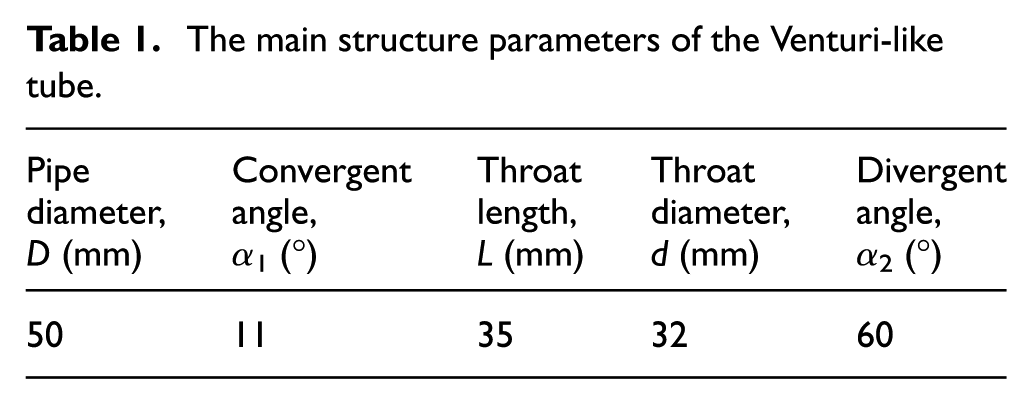
Flow domain of swirl meter including the extensions at upstream and downstream is modeled in Pro/E. The numerical meshes were generated in GAMBIT. As mesh quality governs the accuracy and the stability of the numerical predictions, mesh generation is one of the key aspects in flow simulation. To assure a precise structure and take calculation efficiency into account, both structure and unstructured grids were taken for discretization, and local mesh refined method was adopted for capturing the detailed flow in convergent section and throat. The total number of mesh is over 2 million (Figure 2).
Numerical meshes.
Numerical method and boundary conditions
In order to simulate the unsteady flow in swirl meter, an appropriate turbulent model is acquired. In present work, two-equation renormalization group (RNG) k–ε turbulence model with excellent performance of simulating flows in different flow meters was adopted for closure of the time-averaged governing equations.11,12 The coupling of pressure and velocity was accomplished using the SIMPLEC algorithm. The second-order scheme has been used for discretization. The under relaxation factors were used for the stability of calculation.
For all the simulations, air was taken as the working medium, velocity was set at the inlet of the swirl meter and outflow was set at the outlet. Turbulent intensity (5%) and hydraulic diameter (50 mm) were taken at the inlet for fully developed turbulent flow. 18 No-slip boundary condition was imposed at the solid wall surfaces, and standard wall function was used for regions close to the wall. All the simulations were considered as fully converged when the sum of residuals was less than 10−5.
Experiment test
CFD technique requires reliable experimental data to validate its outcome. Swirl meter was calibrated in sonic nozzle gas flow standard device for its merits of high reliability, simple structure and good repeatability. As the design measurement range of swirl meter is 6–100 m3/h, according to the national standard of swirl meter, 19 experiment was conducted under six flow conditions which are Qmin, 0.15Qmax, 0.25Qmax, 0.4Qmax, 0.7Qmax and Qmax. Figure 3 is the swirl meter under testing.
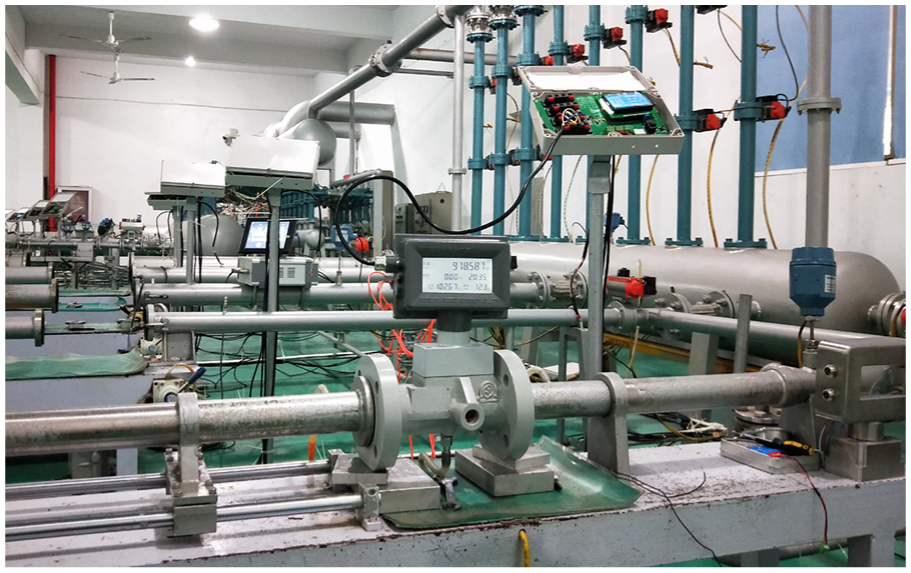
Swirl meter under testing.
The comparison of numerical and experimental results is shown in Figure 4, and the experimental frequency is detected by the piezoelectric sensors placed at the end of throat and the numerical results are based on fast Fourier transform (FFT) results of pressure fluctuation. For both results, the frequency increases with the increasing flow rate and presents a linear relationship—it is the measurement foundation of swirl meter. The pressure loss character is also obtained during the test and is shown in the figure. It is different from the linear increasing of frequency; pressure loss increases faster at larger flow conditions and presents a quadratic curve, and it is non-negligible during large flow rate measurement. In short, except for low flow conditions (Qmin, 0.15Qmax), the calculation error could be as less as 4%; thus, the numerical results are satisfactory.
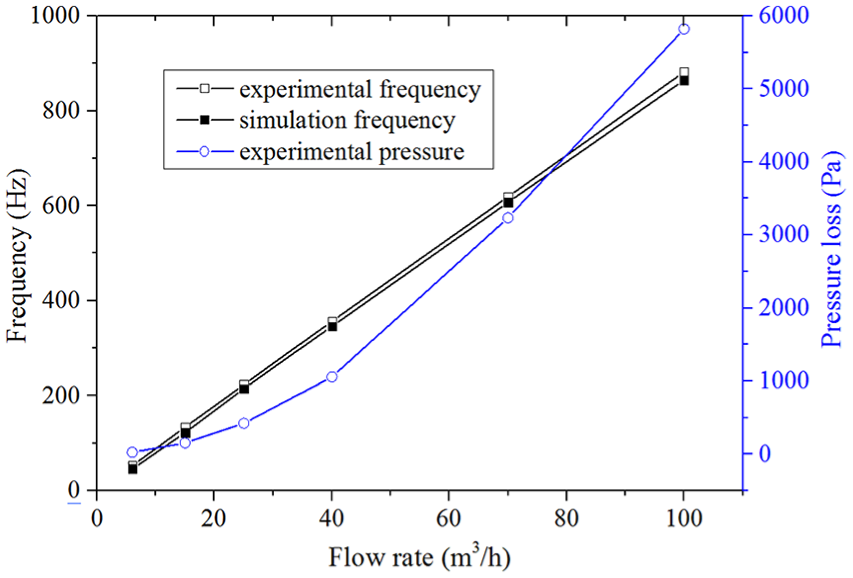
The comparison of simulation and experimental results.
Numerical results and discussions
Streamline and pressure distributions
Flow field distributions inside swirl meter are shown in Figure 5(a), and pressures at different regions and streamlines at vortex core are presented. Cross section Z60 is at the outlet of swirler (Z60 means the section is 60 mm from swirl meter inlet); Z98 and Z131 (the installation location of sensors) are at the inlet and the end region of throat, respectively; and Z160 is at the downstream of divergent section.
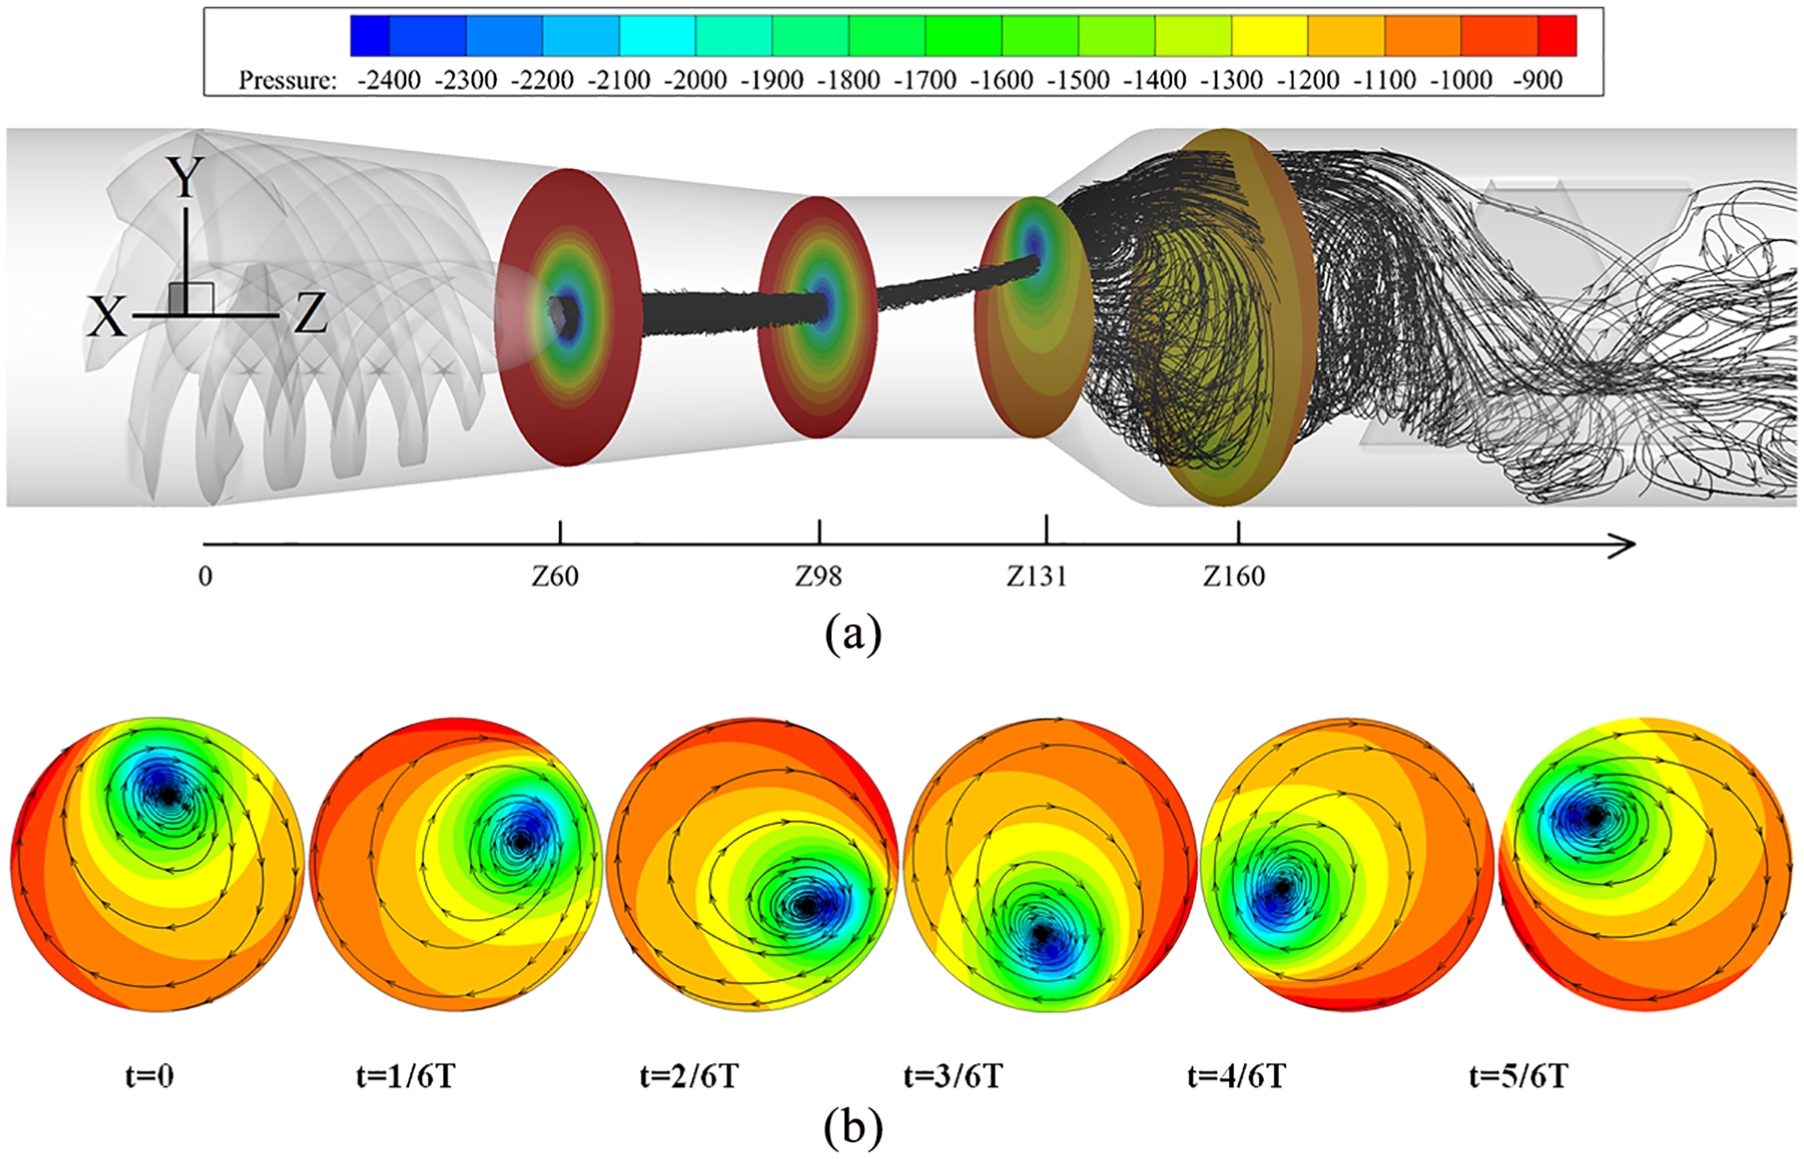
Pressure and streamline distributions in swirl meter. (a) Vortex core streamlines and pressure distributions at t = 0.(b) Pressure distributions at cross section Z131 during a precession cycle.
The distribution shows clearly that after fluid flowing through swirler, pressure at the center of section Z60 is minimal and is much smaller than the near-wall region. It means strong vortex is generated due to the helical structure of swirler and shrinking of flow passage. Reflux is observed at divergent section, reflux forces vortex core moves off-center at the divergent section and then precession motion with regularity appears over time. The two-dimensional (2D) streamlines and pressure at section Z131 are shown in Figure 5(b). There always exists a low-pressure area and the location is in accordance with the vortex core, both are strongly affected by the precession motion and both are periodically distributed.
There exist distinct differences of pressures among these four cross sections, both distributions and quantitative values prove precession motion dominates the flow feature in swirl meter especially at the throat region. Pressure is distributed uniformly in Z60, both vortex core and the low-pressure area are right at the center, and no influence of precession motion is found there. The low-pressure area disappeared along with the disappearance of vortex at downstream of divergent section (Z160), and pressure difference between passage center and solid wall is small. As a whole, pressure at the vortex core is lower than that on the wall. From upstream to downstream, wall pressure decreases while it is opposite at vortex core.
Pressure on the wall
From Figure 5, we know that the flow inside swirl meter is unsteady and flow parameters change over time. Pressure fluctuation at the monitoring point (Z131, Y10, the sensor location) is shown in Figure 6; it also presents the convergence procedure during simulation. It is hard and basically meaningless to analyze the laws at a certain region as they are time-varying. Because the variation is periodic, flow parameters show some special distributions when the data are time-averaged. Therefore, after the simulation was converged (frequency and amplitude are stable), 10 more fluctuation cycles were calculated. The data interested were saved and then transferred to time-averaged results. The detailed discussions of time-averaged velocity and pressure are discussed in the following sections.
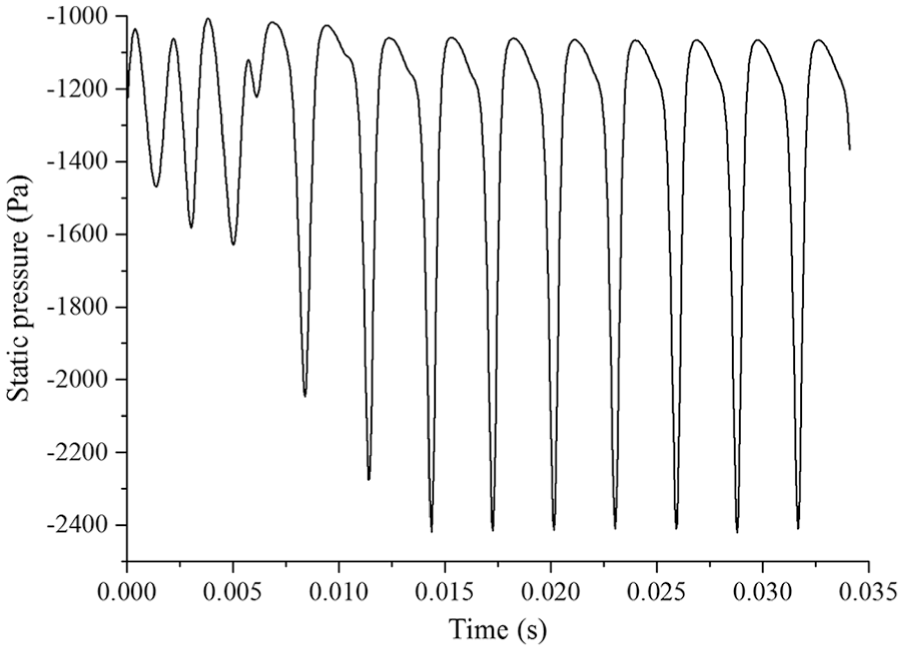
Pressure fluctuation in swirl meter.
The pressure profiles on the wall along Z axis from swirler outlet (Z60) to deswirler (Z190) at flow rate of 40 m3/h are shown in Figure 7. Both time-averaged pressure and transit pressures are presented. For the transit pressures, we chose the moment of t = 0 (Figure 5), and vortex core is closest to the upper wall (position a, shown in Figure 7). Four different wall positions (a, b, c and d) are set evenly along circumference.
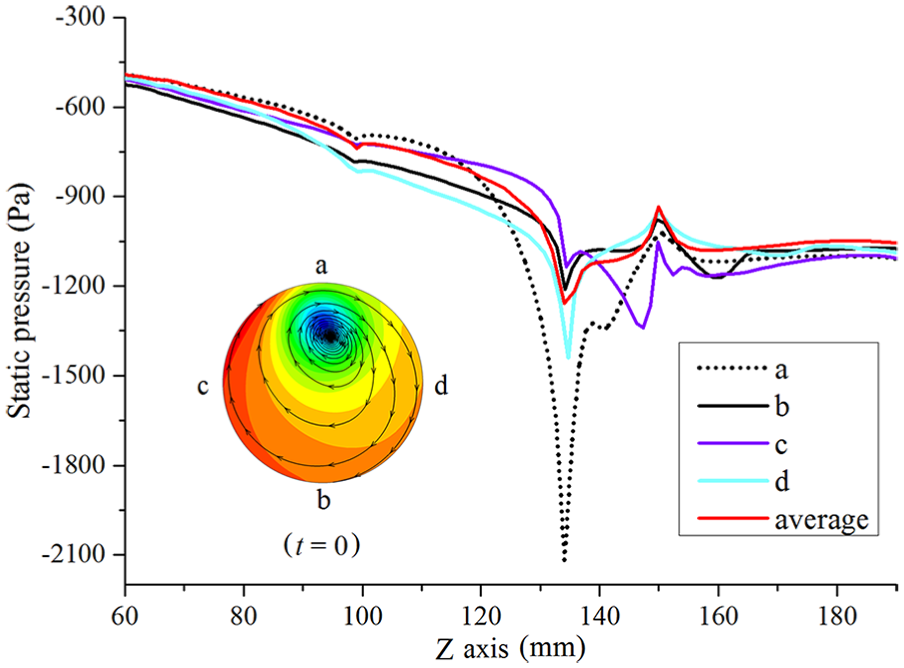
Pressure profile near the wall.
The difference among these pressure lines represents the influence of vortex precession on the internal flow distributions and occurs mainly at the throat region. As a whole, pressure decreases both at convergent section (Z60–Z98) and throat region (Z98–Z135) and reaches the minimum at the end of throat. At convergent region, compared with the time-averaged pressure, pressure along the circumference is unequal but very close to each other. After air flow into throat, although pressure keeps decreasing, the distributions are totally different especially at the end of throat, where the influence of precession motion is strong. Wall pressure varies with the regular rotation of vortex core, and due to the low pressure of vortex core, an extreme low pressure occurs at position a. At divergent section and downstream, pressure increases and keep basically steady along circumference.
Pressure and velocity distributions along Z axis
Pressure distributions, including cross-section-average pressure, wall pressure and centerline pressure, along Z axis from swirler outlet to deswirler are shown in Figure 8 and all three curves are time-averaged results. Due to the vortex flow, pressure on the wall and on the centerline (X = 0, Y = 0) is distributed differently; compared with the cross-section-average pressure, wall pressure shows a similar distribution along Z axis, presenting the process of decreasing and then increasing. Pressure on the wall is always higher than that on the centerline, the largest difference is at the outlet region of swirler (Z60–Z65), and then pressures come with a contrary tendency. Wall pressure keeps decreasing, and meanwhile centerline pressure increases, thus reducing the pressure difference between and reaches the minimum at the end of throat. Centerline pressure has a much larger change from upstream (Z60) to downstream (Z180), and it keeps increasing at divergent section and then becomes stable at downstream. At the downstream which is the inlet region of deswirler, the pressures are still not the same as there exist swirling flow, backflow and other forms of unsteady flows. Deswirl is to eliminate these unsteady flows and reduce the influence of swirl meter on downstream flow, thus reducing the pressure difference. However, deswirler basically has no influence on the vortex precession. Therefore, the discussions in this paper focus on the flow analysis at convergent section, throat and divergent section.
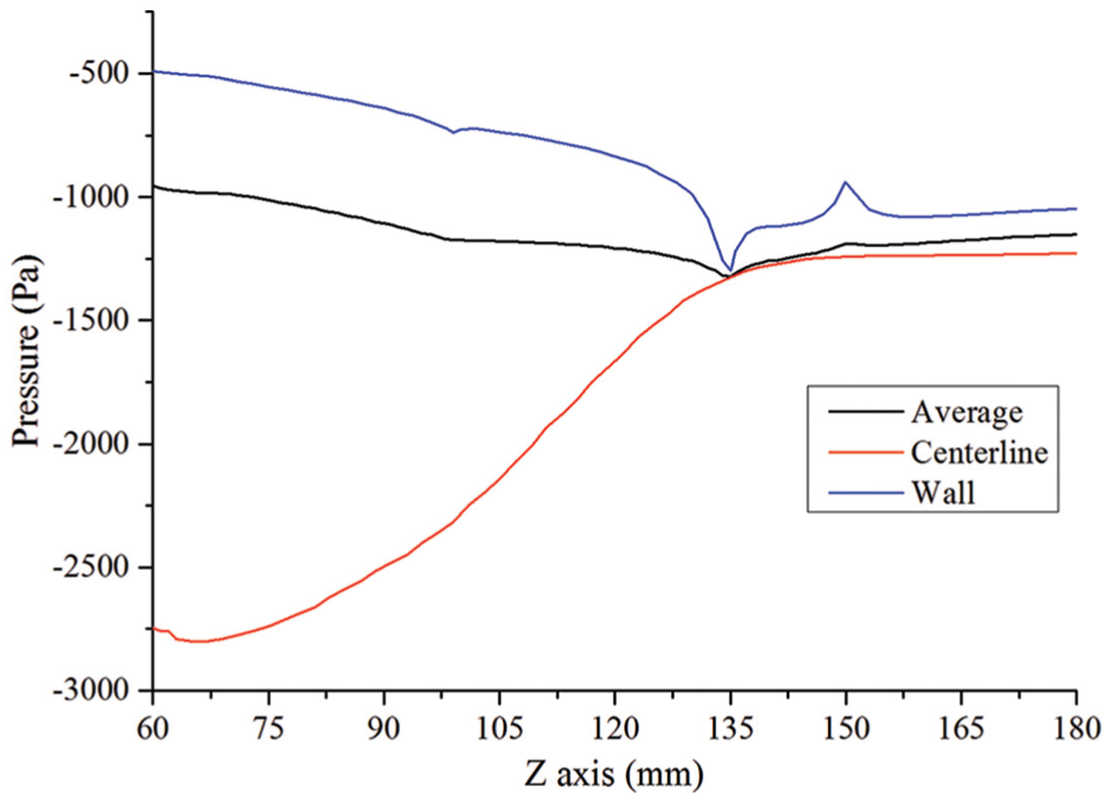
Pressure comparison along Z axis.
The cross-section-average pressure and velocity reveal the overall flow distributions in swirl meter from inlet to outlet, as is shown in Figure 9 (Q = 40 m3/h). Fluid gets accelerated rapidly and reaches at 23.6 m/s when it flows into swirl meter, as the flow rate is 40 m3/h; thus, the incoming velocity is only about 5.66 m/s, and fluid is accelerated by up to four times at the inlet region of swirler, resulting in large energy loss and pressure drops. Acceleration process continues for the whole convergent section (Z0–Z98) and the maximum is over 30 m/s; during the generation of vortex in swirler and convergent section, fluid obtains an acceleration of five times of the incoming velocity which is essential to finally form the strong vortex flow. Velocity starts decreasing and mainly occurs in throat and divergent section (Z98–Z150), and it keeps decreasing and falls back to 5.66 m/s in the end.
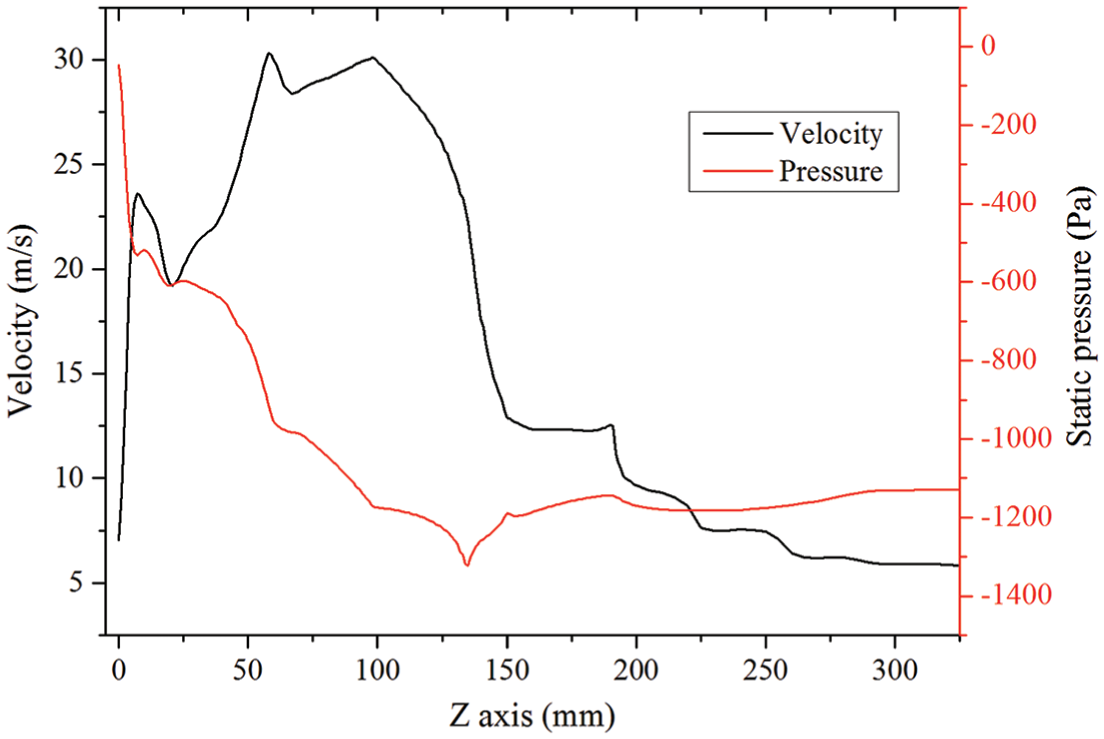
Average velocity and pressure along Z axis.
The pressure keeps decreasing at the upstream of divergent section (Z0–Z135) and the total drop is about 1297 Pa. Decreasing is a component of three stages, swirler region (Z0–Z60), the rest of convergent region (Z60–Z98) and throat (Z98–Z135), and the pressure drop is 931, 216 and 150 Pa, respectively. With a much higher decreasing rate, 71% of drop is at swirler region during the rapid acceleration. Although there is no fluid acceleration at throat region, the pressure keeps decreasing; hence, there is energy loss in vortex precession. As a whole, there exists energy loss during the process of fluid acceleration and precession, and that is the main reason for the pressure drop.
The main flow structure inside is vortex and vortex flow field is effected by the precessional motion, leading to various flow distributions at different regions. Velocity distributions at centerline and near-wall region are shown in Figure 10 and also made a comparison with the cross-section-average velocity. Both centerline velocity and near-wall velocity are smaller than the average.
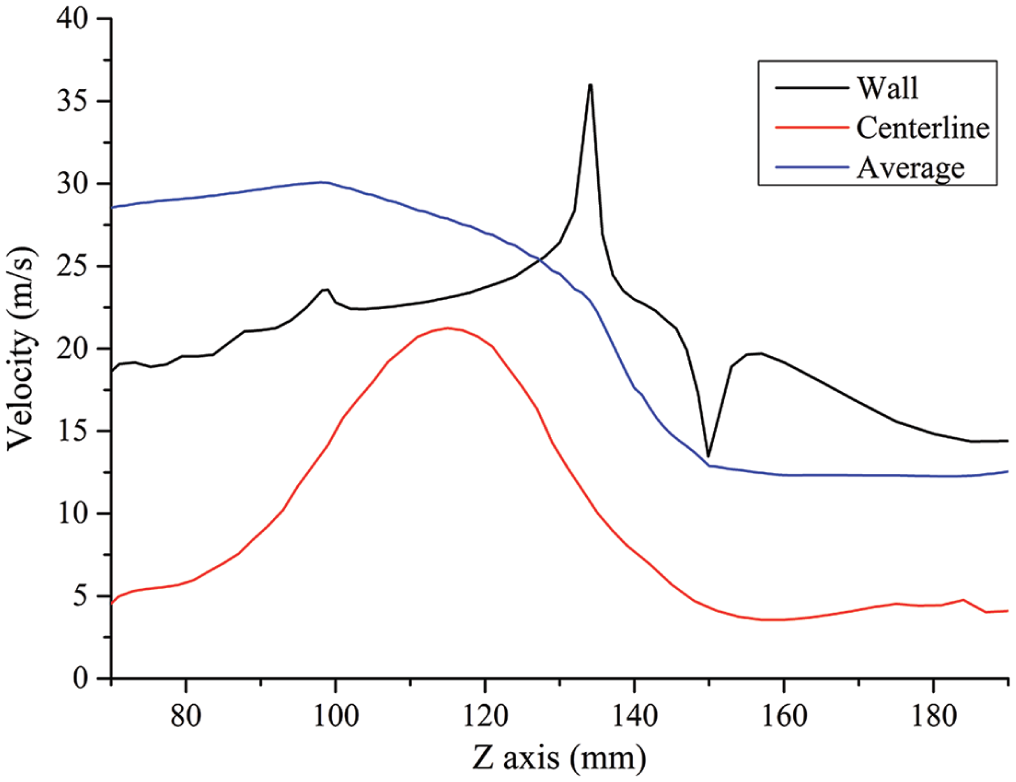
Velocity comparison along Z axis.
Although cross-section-average velocity starts to decrease, near-wall velocity increases at throat region for two causes. The shrinking of flow passage at convergent region leads to acceleration; more importantly, vortex core is off the centerline due to the precessional flow. During the rotation of vortex toward the wall, fluid between vortex core and wall is more likely to be compressed, which results in the fluid acceleration. The precession is strongest at the end of throat, leading to the maximum near-wall velocity. At the outlet of divergent section (Z150), the structural change results in reflux and thus decreases, and as the vortex and reflux disappear, near-wall velocity becomes stable again.
Centerline velocity increases as the flow approaches throat; it further increases and reaches the maximum at center region of throat, and then it decreases and keeps relatively stable at the downstream of divergent section. Centerline velocity shows a different changing rule from near-wall velocity, while the decreasing process is similar to average velocity.
Velocity and axial velocity profiles at the centerline under different flow rates are given in Figures 11 and 12. Under different flow conditions, velocities show a same distribution tendency. The maximum velocity is at the center region of throat, while the maximum point moves slightly toward upstream with the increasing flow rate.
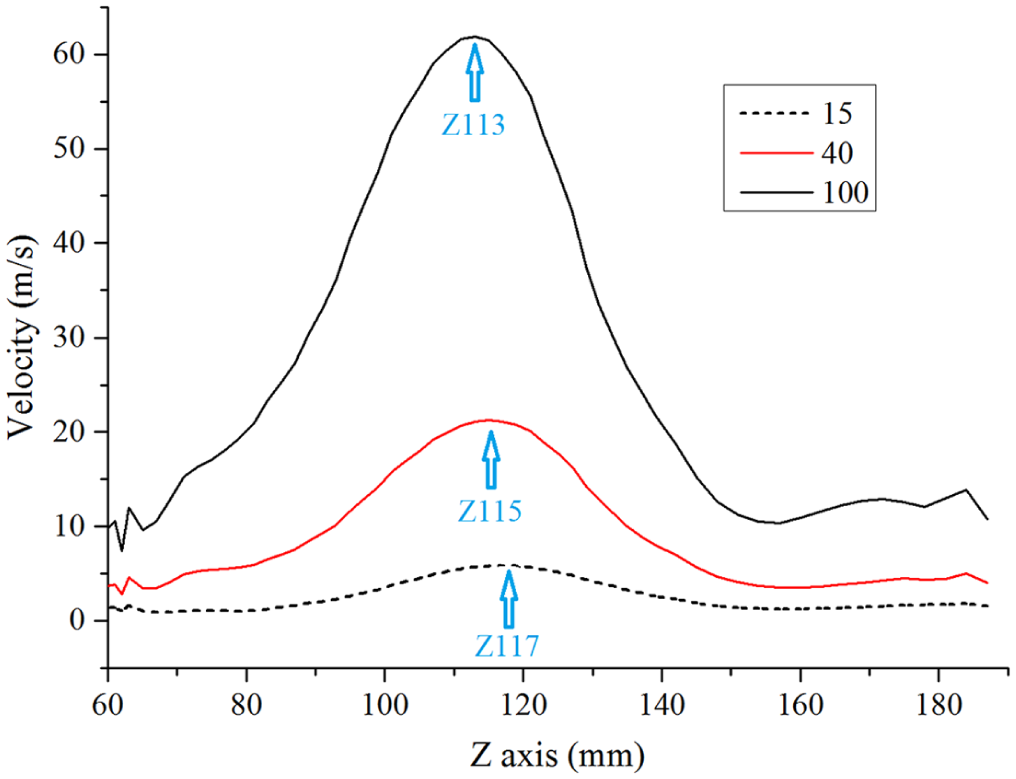
Velocity at the centerline.
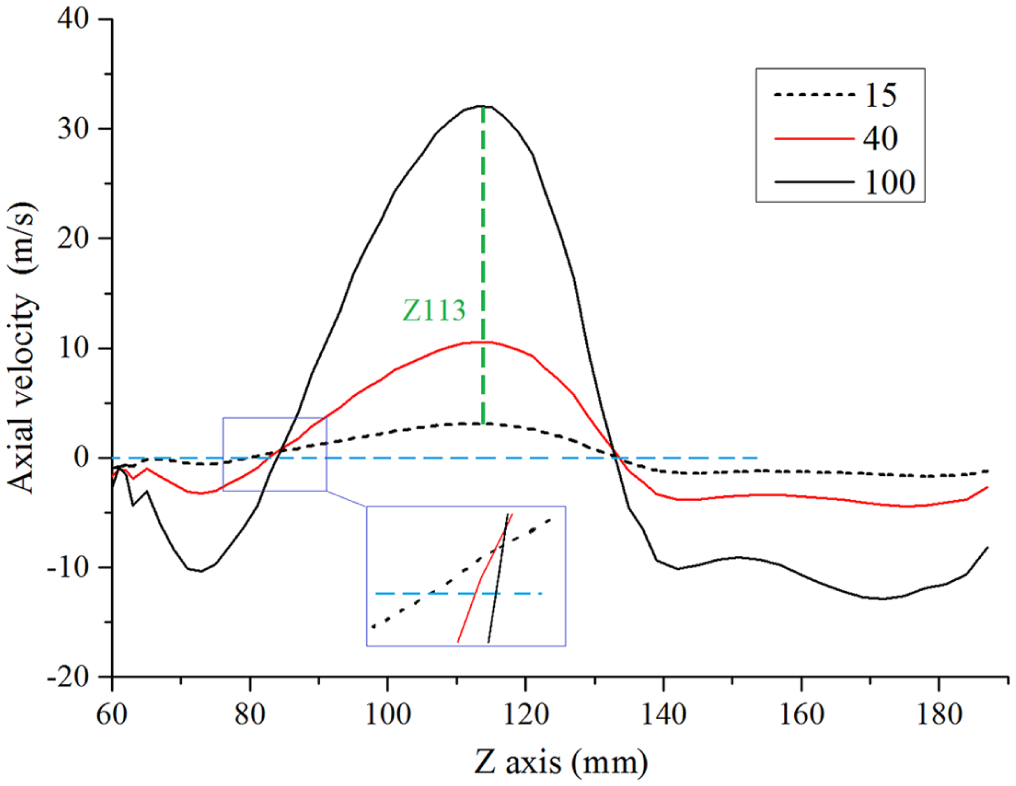
Axial velocity at the centerline.
Axial velocity shows a similar overall distribution, and the maximum value is also at the throat center region. Although flow rates change, the maximum locates at a same point of Z113. There are two reflux areas (where axial velocity is less than zero) near the centerline, which are the outlet of swirler and downstream of throat (including divergent section and its downstream). The reflux area is relatively smaller at outlet of swirler, and it becomes larger with the increasing flow rate. The other reflux starts at the end of throat and expands to the whole area in front of deswirler. The starting point is at the junction of throat and divergent section and is basically the same position for different flow rates. For both areas, the velocity of reflux increases with the increasing flow rate.
Pressure and velocity distribution at cross sections
Time-averaged pressure at different cross sections is shown in Figure 13, cross sections Z70 and Z85 are at convergent region. Z100, Z115 and Z131 are at the inlet, the middle and the end of throat, respectively. As shown in the figure, pressure distributions are symmetric, and it is lower at the center and increases from the center to the wall. For the whole flow fields, the minimum pressure is at the center of section Z = 70, which is the outlet of swirler. As fluid flows toward downstream, the pressure difference at each section gradually decreases. Although the vortex precession is strongest at the end of throat and brings with strong pressure fluctuation, the time-averaged pressure is quite stable especially at center region (−8 < Y < 8). For different flow conditions, the pressure distributions are all the same.
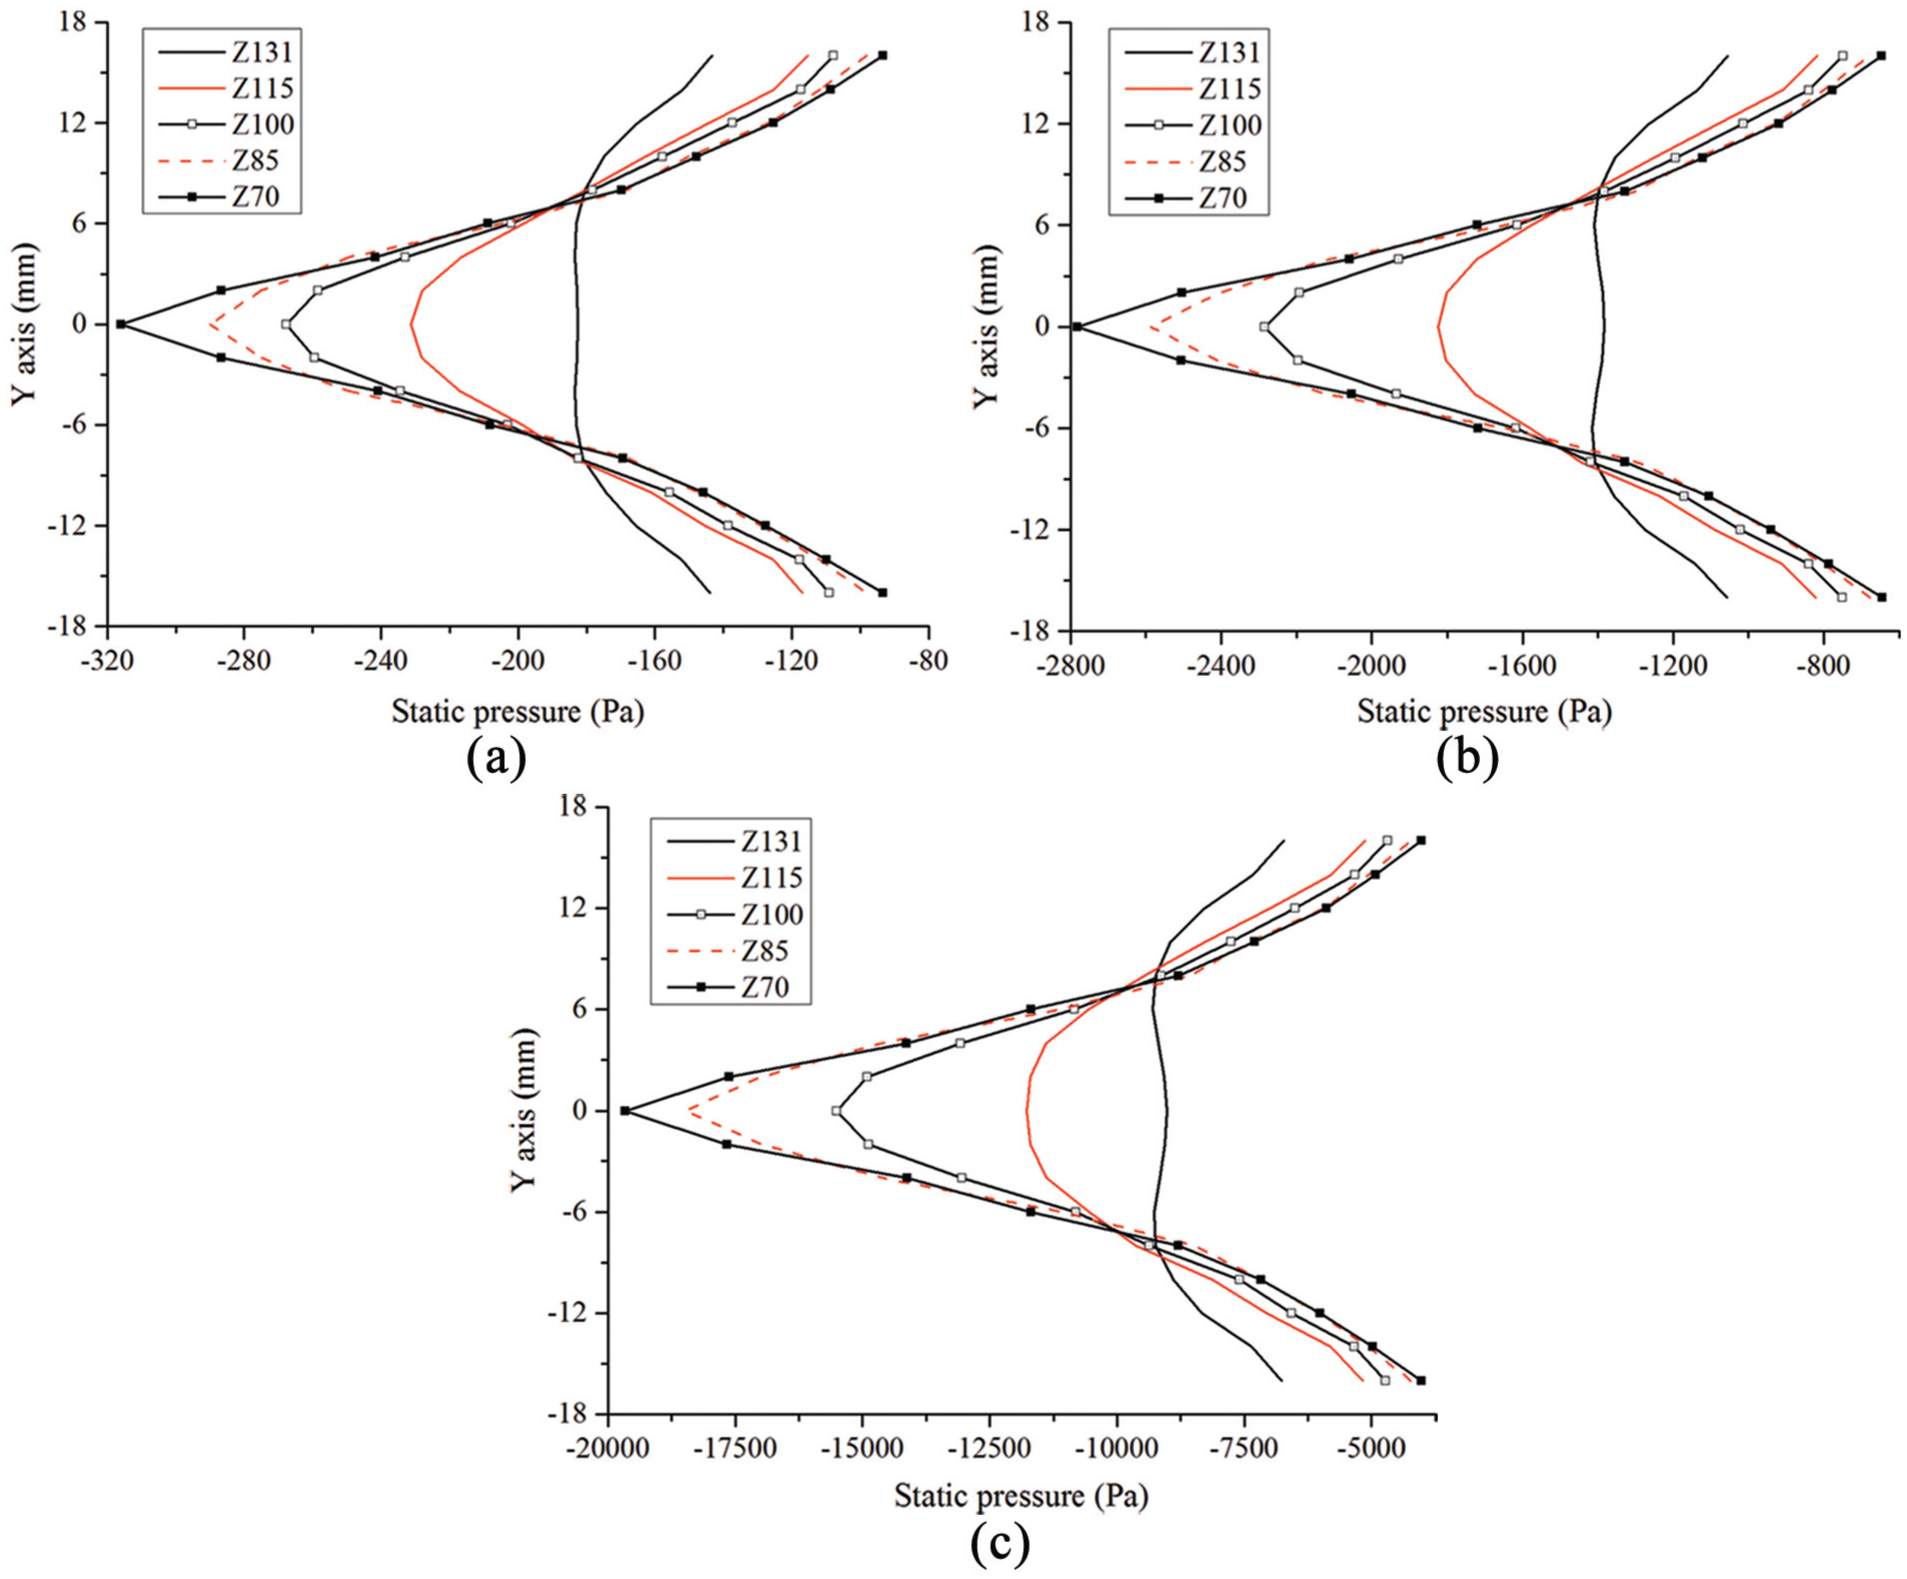
Pressure at different cross sections: (a) Q = 15 m3/h, (b) Q = 40 m3/h and (c) Q = 100 m3/h.
Axial velocity (time-averaged results) at different cross sections is shown in Figure 14. The overall distributions are axisymmetric. Regardless of the flow near the wall, the axial velocity distributions at convergent region show the same tendency, the minimum is at the center (Y0); it increases toward the wall and reaches its maximum (point Y6 for section Z85 and Y8 for section Z70), beyond this point the velocity decreases. For the distribution in section Z131, the minimum is also at the center, but axial velocity keeps increasing to the wall and the variation is smooth at near-center-region (–6 < Y < 6). The velocity gradient at convergent region is much larger than that at throat.
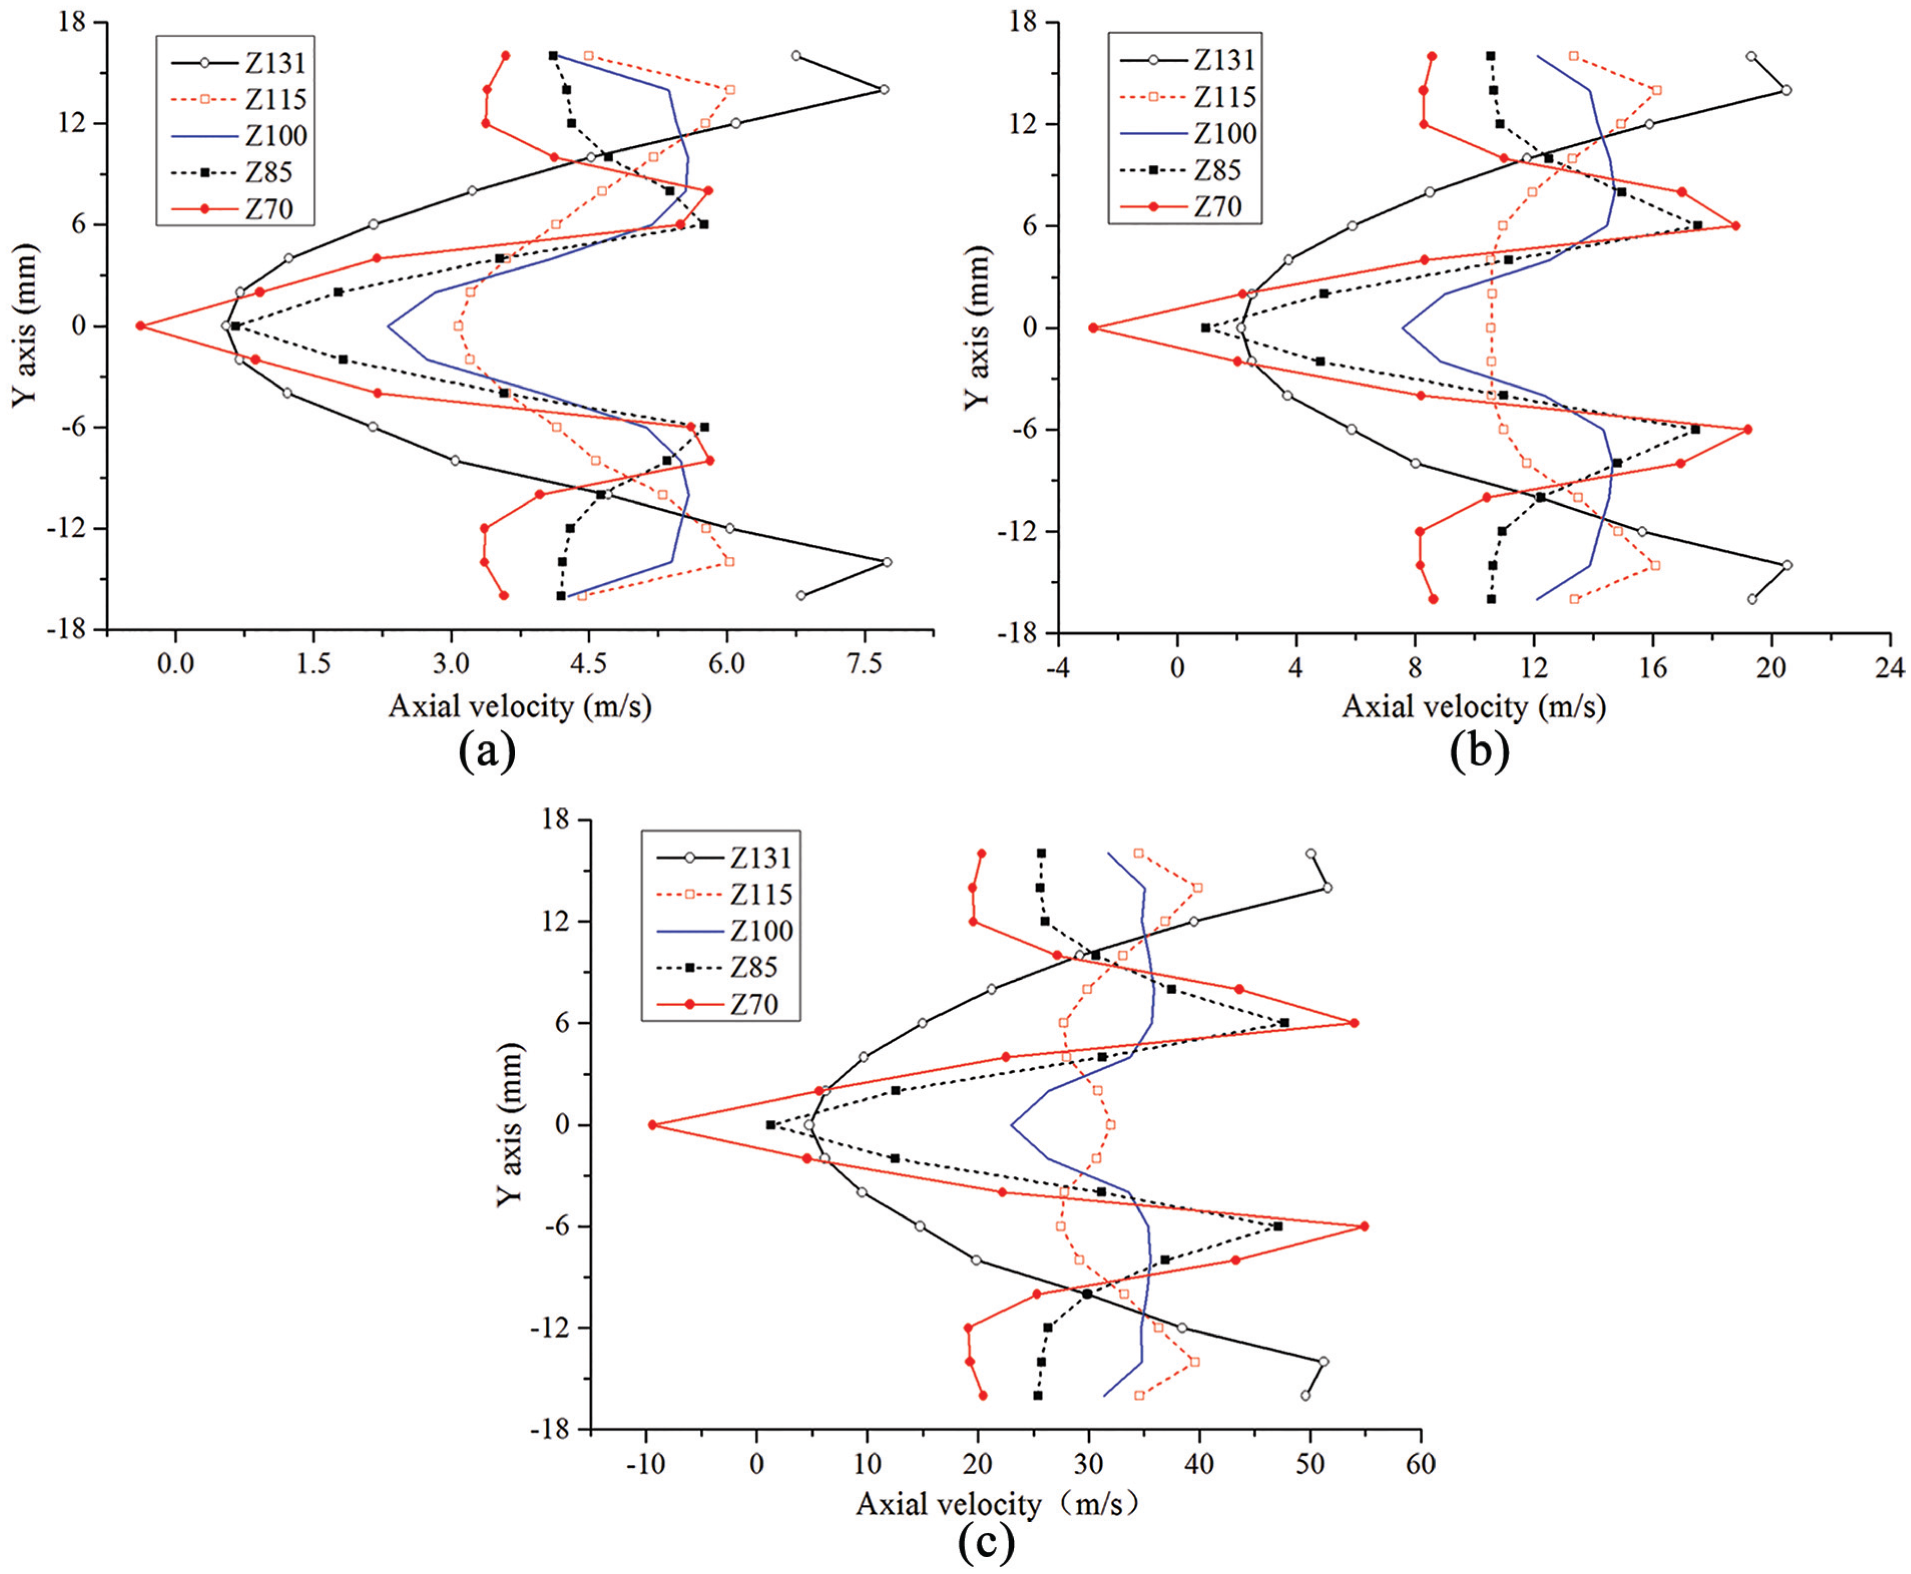
Axial velocity at different cross sections: (a) Q = 15 m3/h, (b) Q = 40 m3/h and (c) Q = 100 m3/h.
For different flow conditions, the main difference is at section Z115, the highest region of centerline axial velocity. With the increase in flow rate, axial velocity at center becomes higher than at the near-center-region (–6 < Y < 6).
Although small difference exists, for the overall distributions of pressure and velocity, the tendency under different flow conditions is all the same. It proves that the flow characteristics inside swirl meter are stable and will not be affected over a certain range.
Conclusion
Efforts were made to achieve better explanation for the flow phenomena in swirl meter by combining experiment and CFD simulation; the experimental test proved that the numerical results in this paper are reliable. Vortex is generated due to the helical structure of swirler and shrinking of flow passage, reflux forces vortex core moves off-center at divergent section and then precession motion with regularity appears over time; the flow distribution presents transit characteristics. In order to provide new explanation, time-averaged flow data were analyzed and the results present interesting findings in swirl meter. Combining with the unsteady flow analysis, the flow features expected for swirl meter flow have been observed in the numerical simulations.
At near-wall region, time-averaged pressure presents a decreasing tendency, and the distribution is clearly affected by the vortex precession motion as the minimum pressure appears at the end of throat. While centerline pressure shows a different law, it is minimal at the outlet of swirler and gradually increases along Z axis. The pressure distributions indicate that there exists large pressure difference when the vortex is formed, and it is important to develop strong vortex precession. For velocity distribution, the influence of shrinking flow passage at convergent region and the precessional flow at throat result in the fluid acceleration at near-wall region. For centerline, velocity behave likes a parabola. At convergent and throat regions, time-averaged pressure and axial velocity are symmetrically distributed in cross sections; they are lower at centerline and gradually increase toward the wall and present different characteristics from transit ones. Although the vortex precession is strongest at the end of throat and brings with strong pressure fluctuation, the time-averaged pressure is quite stable especially at the center region.
Based on the detailed analysis of both pressure and velocity, precession motion played a dominate role in determining flow feature in swirl meter, especially at the throat region. For the overall distributions, the tendency of pressure and velocity under different flow conditions is all the same. It proves that the flow characteristics inside swirl meter are stable and will not be affected over a certain range; as a result, it ensures that swirl meter possesses a good measurement performance.
Footnotes
Declaration of conflicting interests
The author(s) declared no potential conflicts of interest with respect to the research, authorship, and/or publication of this article.
Funding
This work was supported by the Joint Project from National Natural Science Foundation of China and Liaoning Province (Grant No. U1608258), National Natural Science Foundation of China (Grant No. 51876103) and the Young Researchers Foundation of Zhejiang Provincial Top Key Academic Discipline of Mechanical Engineering of Zhejiang Sci-Tech University (Grant No. ZSTUME02B03).