
Abstract
Background:
As research on quadruped robots grows, so does the variety of designs available. These designs are often inspired by nature and finalized around various technical, instrumentation-based constraints. However, no systematic methodology of kinematic parameter selection to reach performance specifications is reported so far. Kinematic design optimization with objective functions derived from performance metrics in dynamic tasks is an underexplored, yet promising area.
Methods:
This article proposes to use genetic algorithms to handle the designing process. Given the dynamic tasks of jumping and trotting, body and leg link dimensions are optimized. The performance of a design in genetic algorithm search iterations is evaluated via full-dynamics simulations of the task.
Results:
The article presents comparisons of design results optimized for jumping and trotting separately. Significant dimensional dissimilarities and associated performance differences are observed in this comparison. A combined performance measure for jumping and trotting tasks is studied too. It is discussed how significantly various structural lengths affect dynamic performances in these tasks. Results are compared to a relatively more conventional quadruped design too.
Conclusions:
The task-specific nature of this optimization process improves the performances dramatically. This is a significant advantage of the systematic kinematic parameter optimization over straight mimicking of nature in quadruped designs. The performance improvements obtained by the genetic algorithm optimization with dynamic performance indices indicate that the proposed approach can find application area in the design process of a variety of robots with dynamic tasks.
Introduction
The application of genetic algorithms (GAs) is reported in the field of structural optimization where the problem is geometrical and topological design.1,2 The challenge of designing efficient proportions for individual elements in a complex structure is a multilevel optimization task that has been tackled with GAs.3,4 It is similarly used in optimizing the kinematic arrangement of mechanisms with links and joints 5 and in optimization of robotic manipulator designs.6,7 These robotic applications are limited to fixed-based manipulators, where the aim is to improve the workspace of the end effector. The purpose of this work is to take this a step further and optimize the design for the kinematic structure of a complex free-fall manipulator, a quadruped robot. GAs are used in improving a quadruped design in executing dynamic tasks. The optimization is carried out within a certain scale range and with defined available power via full dynamic simulations. This quadruped robot is planned to be used as a research platform for experimenting on tasks such as walking and running while mostly focusing on jumping. Although there are multiple successful quadruped robots that exist in the literature, they use different kinematic structures and the tasks they focus on performing vary.8–10,23 When it comes to the design of these quadrupeds’ kinematic structures, the most common explanation is taking the nature and its quadruped animals as inspiration for these robots’ designs9,11,24. This work aims instead to mimic the way nature came up with these limb structures and arrangements. Using GAs, a process similar to natural selection is achieved. Mimicking the process rather than the result is expected to get more efficient outcomes. In any robot design, there will be tasks that are expected for the robot to undertake that are limited compared to its natural counterpart which handles additional tasks like hunting, resting, eating, climbing and so on. Even if a task is common for the robot and the animal it is mimicking (like walking, running, jumping), the weight of this task as a criterion for the optimization process might differ. The goal in this work is to explore the significance of optimizing a quadruped robot kinematic structure based on the specific tasks it is designed to perform.
GAs build “populations” of solutions/designs and go through iterations by eliminating the individuals in the population unfit for the task at hand and end up with a final population filled with fit individuals (quadruped designs in this case).12,13 The iterations are termed as generations in analogy to living beings. The way the fitness decision is made is by taking each individual through a simulation and evaluating the results using a fitness function.
In this article, the application of GAs is carried out in the context of an ongoing quadruped project (TUBITAK 114E618 “Quadruped Robot Design, Construction and Control”) where the primary objectives include locomotion and high jump altitudes. Hence, the focus was on two tasks: vertical jumping and trotting. The kinematic parameters in the two cases are optimized and results of these optimizations are presented. Quadruped robot design parameters and the use of the algorithms are discussed. The kinematic arrangement of a robot is defined as the relative locations and orientation of the joint axes with respect to each other. A brief parameterization technique of the arrangement is by means of the Denavit–Hartenberg variables. 14 Among the Denavit–Hartenberg variables are the link lengths which are optimized in our work along with quadruped main body dimensions. Hydraulic cylinder actuators, as in the aforementioned TUBITAK project work carried out by the authors, are assumed for all joints.
Design parameters
Design parameters—which define the individuals of the GA—are the variables that the algorithm tries to find optimum values for (a list of these parameters is shown in Table 1). These are different for each individual robot structure in the algorithm. They consist of mostly kinematic properties of the robot and some additional task–based parameters. The optimum result may change as the task at hand is modified or if the desired constraints are altered.
Design parameter value ranges.
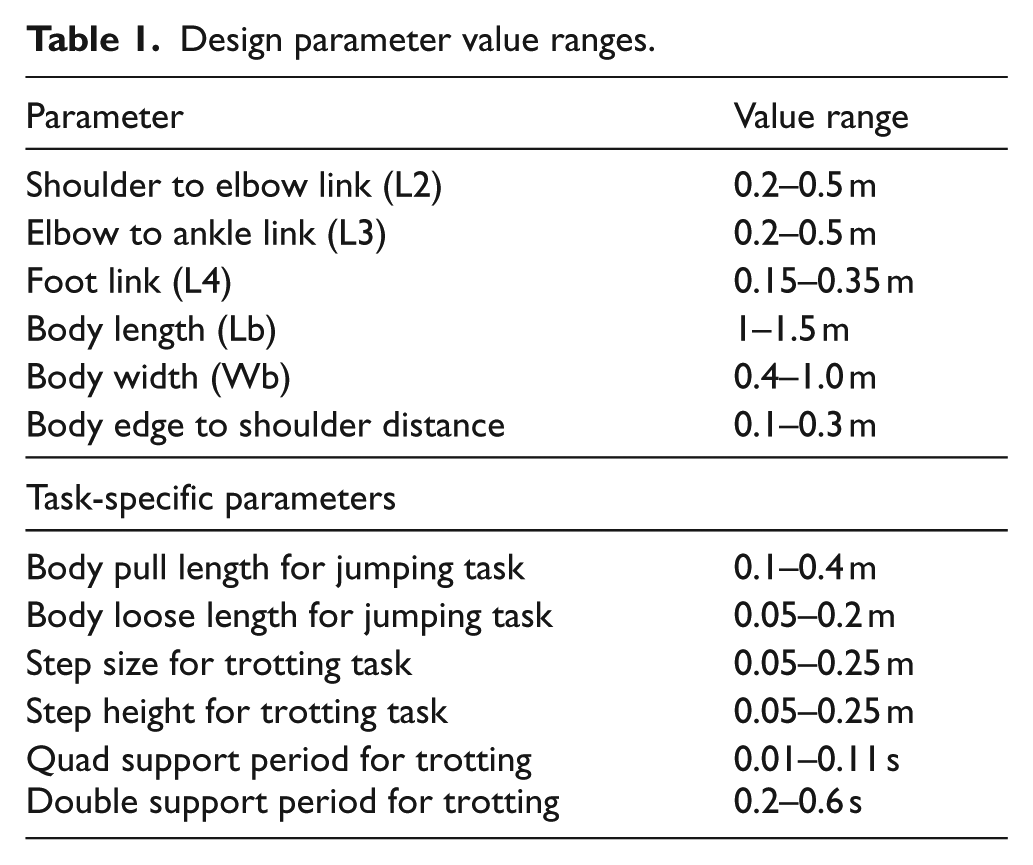
Figure 1(a) shows an example quadruped design. The kinematic parameters are the three link lengths on the legs (L2, L3 and L4 on the figure), the body dimensions (Lb and Wb on the figure) and the shoulder attachment positions on the body. L1 is omitted since it is a link with no length and exists due to our adaptation of Denavit–Hartenberg convention. When changing the lengths of the leg links, it is assumed that their masses scale linearly. Figure 1(b) shows example leg links from our quadruped project. When changing the body dimensions, there is a constraint keeping its volume fixed, since the space required to fit the necessary equipment inside is estimated.
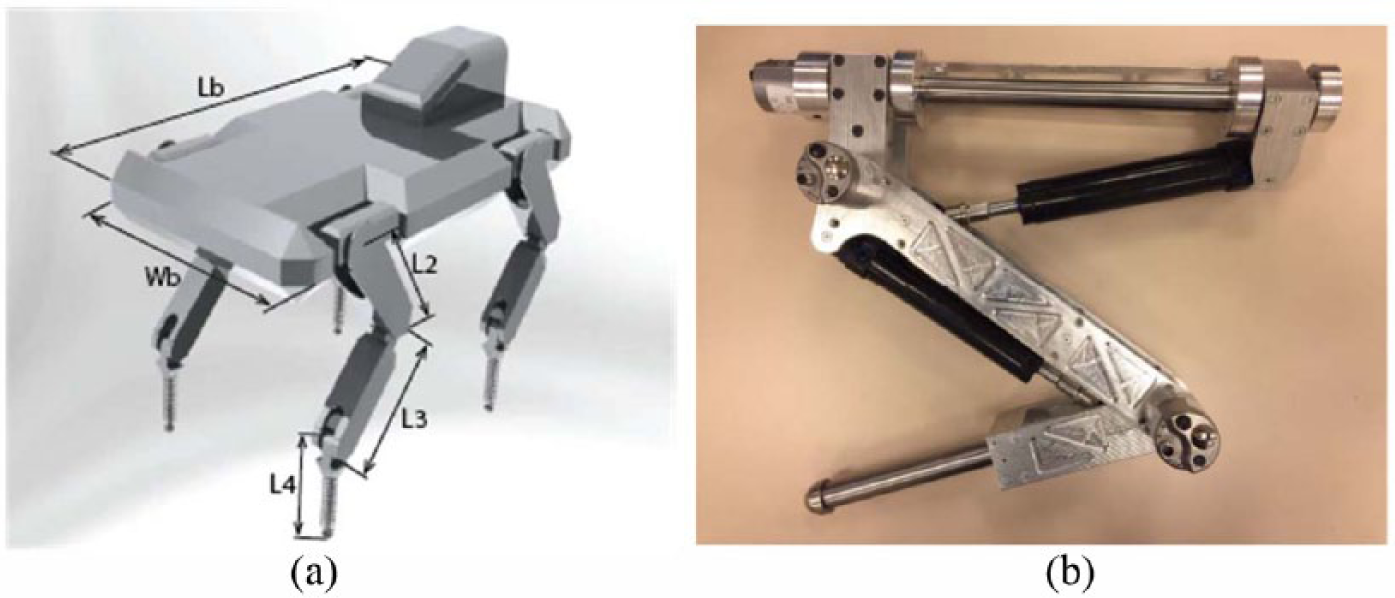
(a) An example quadruped design with link lengths (L2, L3 and L4) and the body dimensions (Lb and Wb) as kinematic parameters displayed. (b) Typical quadruped leg hip and knee hydraulic actuation system. Picture belongs to the quadruped design in the project TUBITAK 114E618.
The first of the two tasks used for the optimization algorithm is vertical jumping. In order to achieve this, motion robot pulls itself down and then pushes the ground rapidly, resulting in a vertical jump as shown in Figure 2. The robot then lands on the ground, gaining its balance. For the purposes of improving the optimization of kinematic variables, some task-specific variables had to be added to the algorithm. These change the distance robot pulls itself down and the distance it pushes itself up as shown in Figure 2. A taller, heavier robot can in exchange afford bigger pull and push distances; therefore, these task-specific variables should also be included in the optimization. The animation visuals are simplified for computational purposes.
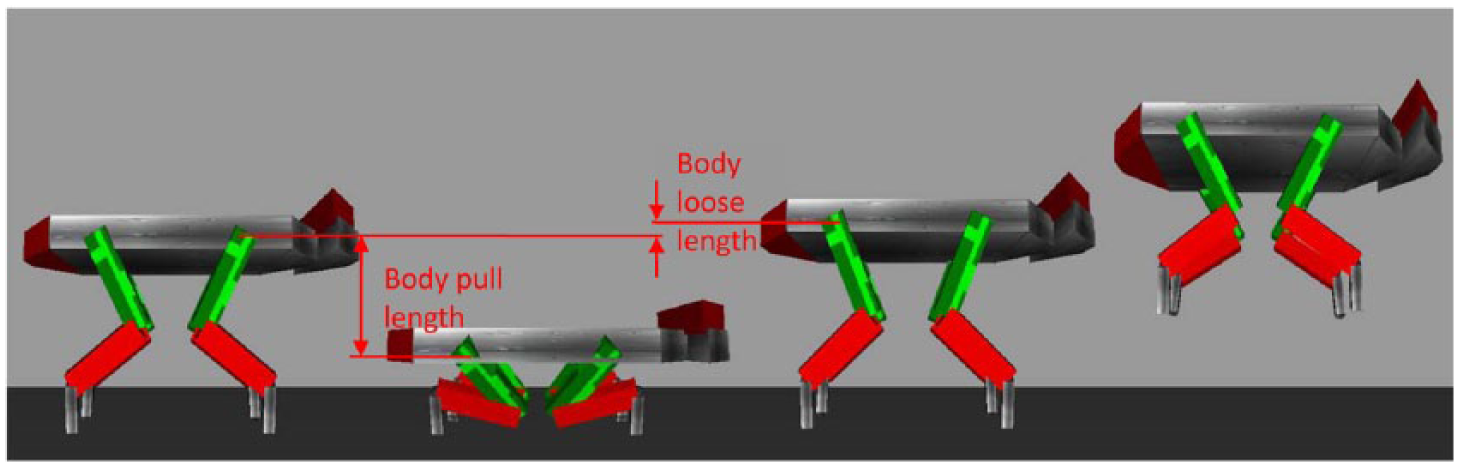
Animation frames showing the task of vertical jump. Task-specific parameters are displayed.
The second task is performing a trotting gait. This starts by the quadruped lifting its left front and right hind feet, moving them forward, landing them (it can also start by the quadruped doing the same with its right front and left hind feet). The robot is then supported by its four feet before the next step. This is then followed by the robot lifting the right front and left hind feet and landing them some distance forward. The motion is planned by using a ZMP (Zero Moment Point)-based trajectory generation. 15 Like with the first task, here it is also assumed that as the lengths and positions of the design change, the optimal trajectory variables change with it. For this reason, task-specific trajectory parameters which are step size, double support period and quad support period are added to the design parameters. Step size is simply the length of each step during trotting, which is the distance a foot covers from lifting off the ground and landing back on it. Double support period determines the time spent on two legs while taking a step. Quad support period determines the time spent on four legs. Table 1 shows the values that each of these parameters can take.
GA parameters
GA is an optimization tool inspired from nature’s natural selection process. It starts by creating random individuals and aims to find the fittest individuals by going through generations. In this work, an individual refers to a quadruped, more specifically a set of design parameters that defines a quadruped. The value of each parameter is converted to binary form. Stringing these back to back forms up a chromosome, which describes an individual quadruped kinematic arrangement. Design parameters displayed in Table 1 are randomized within their value ranges to form multiple individuals. The set of first individuals are the first generation. A generation is also called a population.
After forming up the first population, each individual goes through a simulation and a fitness function assesses the results. For the vertical jump task, fitness value is the peak height of the jump with a potential penalty if the individual does not land properly. An improper landing is when the robot’s leg joints contract more than a certain degree or when the robot simply loses its balance and falls. For the trotting gait task, fitness value is the distance traveled in a certain amount of time (basically equating to velocity) with again a potential penalty if the individual loses its balance during its motion. In order to reach to an individual that is successful in both tasks, the chosen fitness function should incorporate both the vertical jump height and the trot distance into its equation. The fittest individuals are the ones with the highest fitness function values for their given tasks. Running the simulations for each quadruped design in the population results in getting fitness values for all individuals.
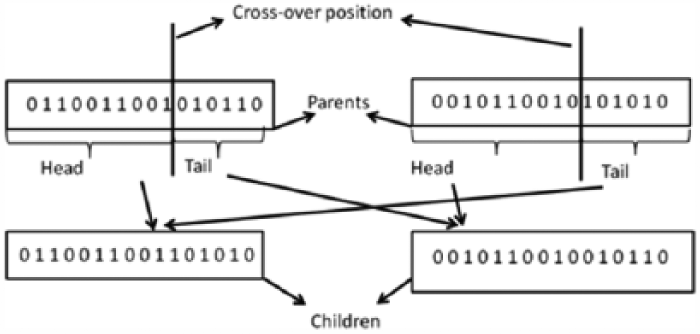
Simulating a population is followed by forming the next population. This process involves multiple steps. The first step is to pick a number of fittest individuals from the current population and directly moving them on to the new population. These are called elite individuals and they have the highest fitness function values of the current population. Then a number of fit individuals are picked and paired up for the cross-over process as shown in Figure 3. In cross-over, each individual in a pair of chromosomes is split into two parts of “head” and “tail.” Then the “head” part of the first individual is combined with the “tail” part of the second individual and vice versa to form up two new chromosomes. The bit where this split happens is chosen randomly for each pair of chromosomes. These new individuals are then added to the new population.
Visual description of the cross-over process.
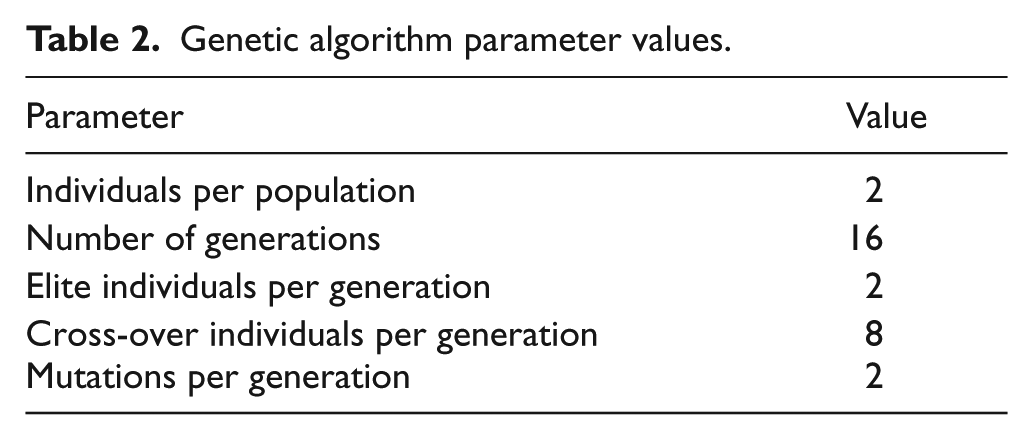
The third step is called mutation. In mutation step, a number of individuals are chosen from the current population and a random bit in their chromosome is changed from “0” to “1” or from “1” to “0,” whichever applies. These individuals are also chosen randomly and after they are mutated they are placed into the new population. This population now has elite individuals, cross-over individuals and mutated individuals in it. The remaining spots are filled with randomized individuals similar to the first population. The values chosen for the mentioned GA parameters are displayed in Table 2. The results of the simulations converge toward a certain individual design by the time the algorithm reaches the final population.
Genetic algorithm parameter values.
The simulation
Every individual of each population needs to be evaluated for their fitness. This is done by a dynamic simulation of the tasks a robot is supposed to perform. The simulation takes the design parameters as inputs and forms the corresponding quadruped body and link dimensions. Then the robot goes through its jumping or trotting task adjusted by the task-specific parameters. Resulting jump height or trot distance goes to the fitness function for the next step of the GA. For these to happen, the simulation needs to be capable of calculating the motion of a quadruped as well as its contact forces with the environment.
The motion of the quadruped is solved by the use of the articulated body method (ABM).16,17 ABM is similar to the Newton–Euler algorithm 18 in the way it recursively calculates the motion of each link, though it is favored in this application due to its less complex computations speeding up the process. In its essence, ABM aims to define a multilinked body by a single inertia matrix (spatial articulated inertia) and a zero-acceleration force vector (spatial articulated zero-acceleration vector). With these two mathematical structures, one can calculate the acceleration of each link on a body from the external forces applied on it.
The calculations for the inertia matrix (I-matrix) and the zero-acceleration force vector (Z-vector) are done in four steps. The first step is a forward recursion that starts from the initial linear and angular velocities of the base link (body of the quadruped) and adds the joint references in order to find the linear and angular velocity information for the rest of the links. The second step is another forward recursion which calculates the I-matrix and the Z-vector for the case of no external force on the system. This step ignores the forces applied to each link by the other links (to be added in a later computational step), which only leaves gravity and Coriolis forces accounted for. The third step is a backward recursion to calculate the complete I-matrix and Z-vector. Starting from the end links, external forces are added to the calculations and when dealing with the next link the forces on the previous link are also considered. The fourth and final step is to use the I-matrix and the Z-vector to calculate accelerations of each link through another forward recursion. To summarize, the inputs of the algorithm are the initial velocities, external forces, joint velocities and mass and kinematic properties of the system. The outputs are the acceleration information for all the links.
Output accelerations are then used to find the initial velocities of the system for the next iteration cycle. I-matrices and Z-vectors are dependent on the unique orientation and initial conditions of the system and therefore calculated again for each iteration of the simulation. This is enough to simulate the motion of a quadruped in a free space, but for this work it is also required to model the contact forces.
Equations for the motion of a quadruped involve the ground forces that apply to it, while those ground forces need the motion information to be calculated. It is not possible to use an approximation like a penalty-based method to get around this problem when we are dealing with jumping tasks involving impact forces. An exact contact force method is required.
This method starts with defining the contact points of the body, which for this work are the foot central points of the quadruped. Then ABM algorithm is used to solve the dynamics of the system with the assumption of no contact forces. Acceleration and velocity information gained this way is used to determine whether the contact points are going to be in contact with the ground for the next simulation cycle. Through ABM, we also have access to the I-matrix and the Z-vector which form the equations relating the contact forces to the link accelerations. The dynamics also have physical constraints due to the robot not being able to penetrate into the ground and the friction forces being limited by Coulomb friction. All of these are not satisfactory to have an analytic solution to the problem. Even with the constraints, both the contact forces and the resulting accelerations are partial unknowns in the equations. An iteration-based search method is used to find solutions to this problem.
The particular iteration method used in this work employs a Gauss–Seidel-like method 22 (also implemented in Humanoid Robotics Platform (HRP) 19 ). It works by input of initial estimated values to part of the unknowns in the equations and solves for the rest. The obtained values are then used to solve for the initially estimated ones. The complete solution is then used as an initial estimation for the next iteration. The rate of change of the solutions is calculated at each step to make the convergence decision and thus end the iteration process.
ABM and Gauss–Seidel algorithms are used in conjunction to calculate all the forces and accelerations on the system. This completes the dynamic simulation scheme which is necessary to evaluate the fitness of each individual design processed by the GA.
The work presented in this article employs a joint position control scheme. The joint position references are provided by inverse kinematics routines. Inverse kinematics processes the Cartesian foot reference positions (described in shoulder and hip frames) to produce joint position references. Proportional–integral–derivative (PID) position controllers provide adequate control performance for the robot dynamics in our simulations. The state of art in position control for robotic manipulators is quite mature20,21 and more sophisticated control schemes can be applied in cases with more complicated robot leg dynamics. This implies the applicability of our genetic tuning algorithm to a wide range of robotic systems.
Results
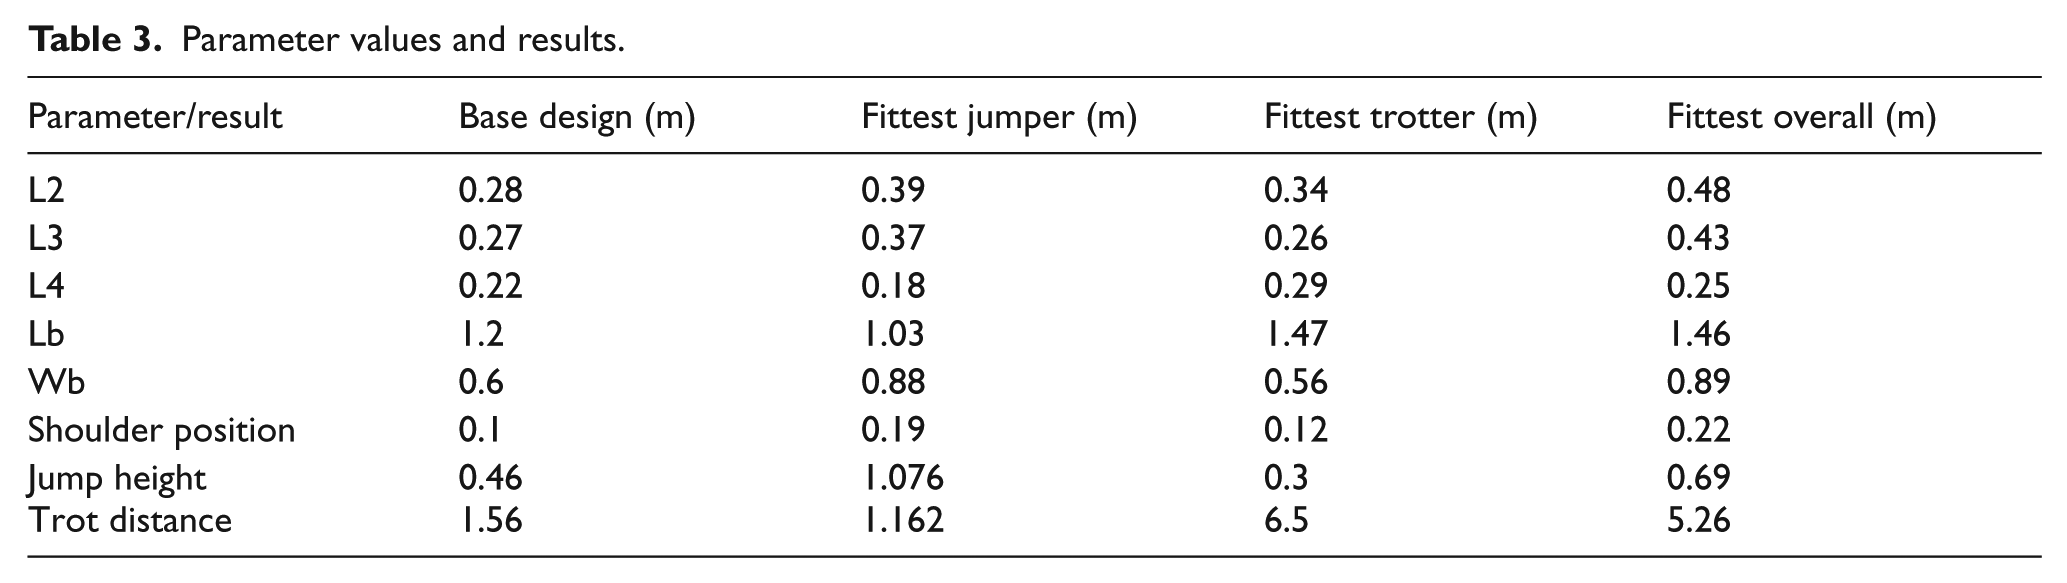
An initial robot design was obtained without optimization in our previous research. The design guidelines were inspiration from the nature and considerations of the sizes of various equipments to be housed by the robot body. This design was used in tests of our simulation environment and it was successful in simulation at performing both tasks at hand. Its results can be used as a means of comparison for our current research of kinematic arrangement optimization presented in this article. We are terming this initial design as the base design. Considering that without the GA tests this design would be the final design, success of the algorithm can be evaluated by comparing its fittest individuals to this one. The kinematic parameter values and the corresponding vertical jump and trot results for the base design (all the dimensions are taken from the quadruped prototype manufactured for project TUBITAK 114E618), the GA result for the first task (fittest jumper), the GA result for the second task (fittest trotter) and the GA result for both tasks optimized together (fittest overall) are displayed in Table 3. These four designs’ looks on the animation platform are shown on Figure 4.
Parameter values and results.
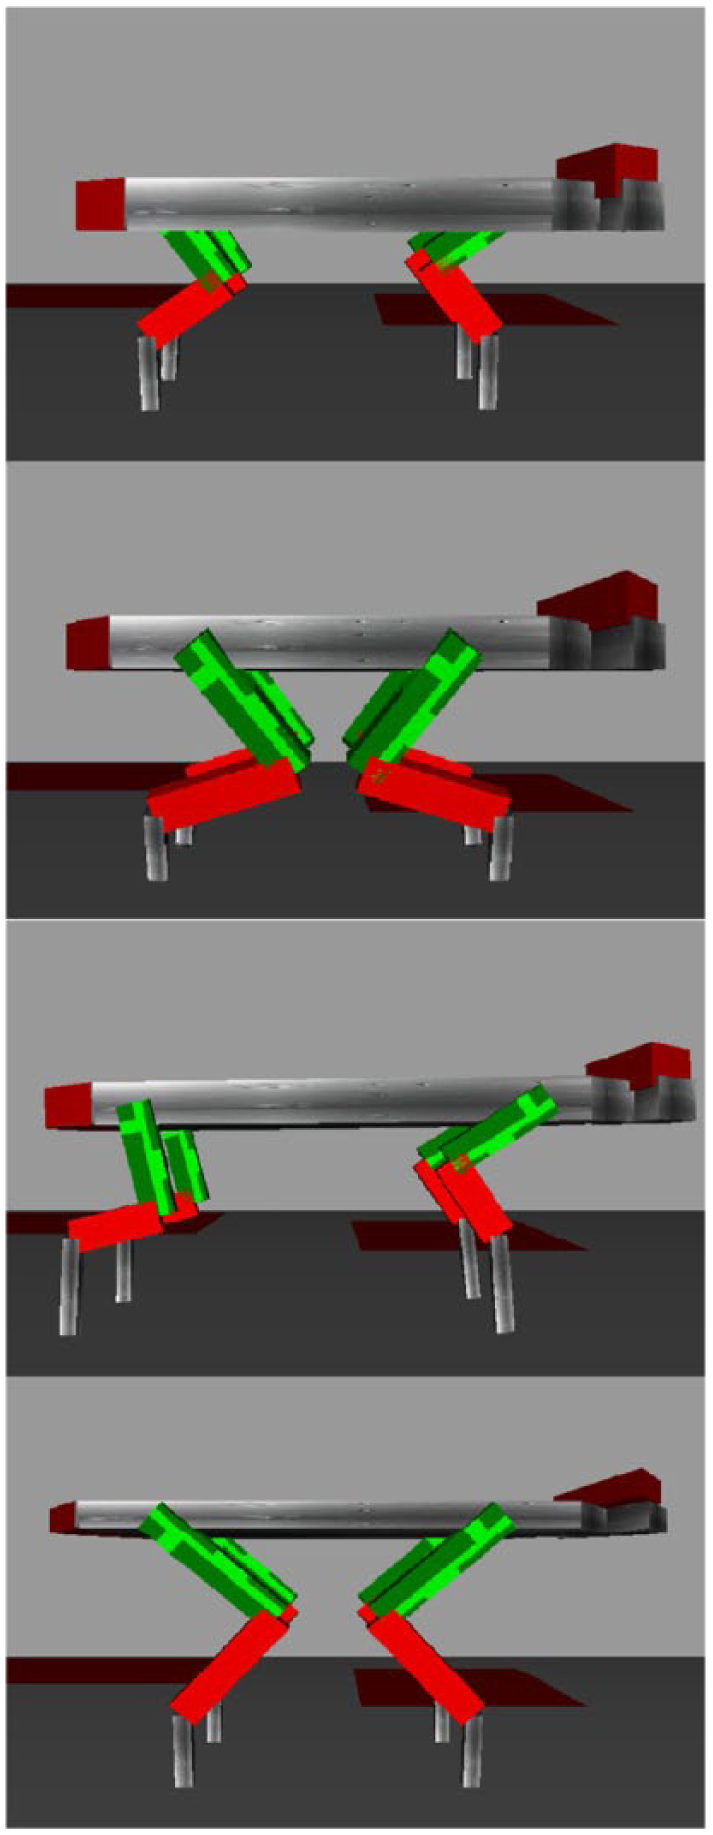
Animation platform look of the designs in order; base design, fittest jumper, fittest trotter and fittest overall.
The fittest jumper is the result of running the GA multiple times with a fitness function that evaluates the first task only. The higher the peak jump height gets for an individual, the fitter they are. When approaching logically to this problem, it can be assumed that the robot having longer legs will result in a higher jump peak. However, the power that is available for the robot is limited as a result of power budget considerations. As the legs get longer they also get heavier, turning this into a proper optimization task.
Similarly, the fittest trotter is the result of the GA with a fitness function that evaluates the second task. The locomotion distance covered in 5 s while trotting in a straight line and staying in balance determines how fit an individual is. The power constraints are valid in this evaluation as well. Therefore, the robot cannot just be infinitely tall with infinitely big steps.
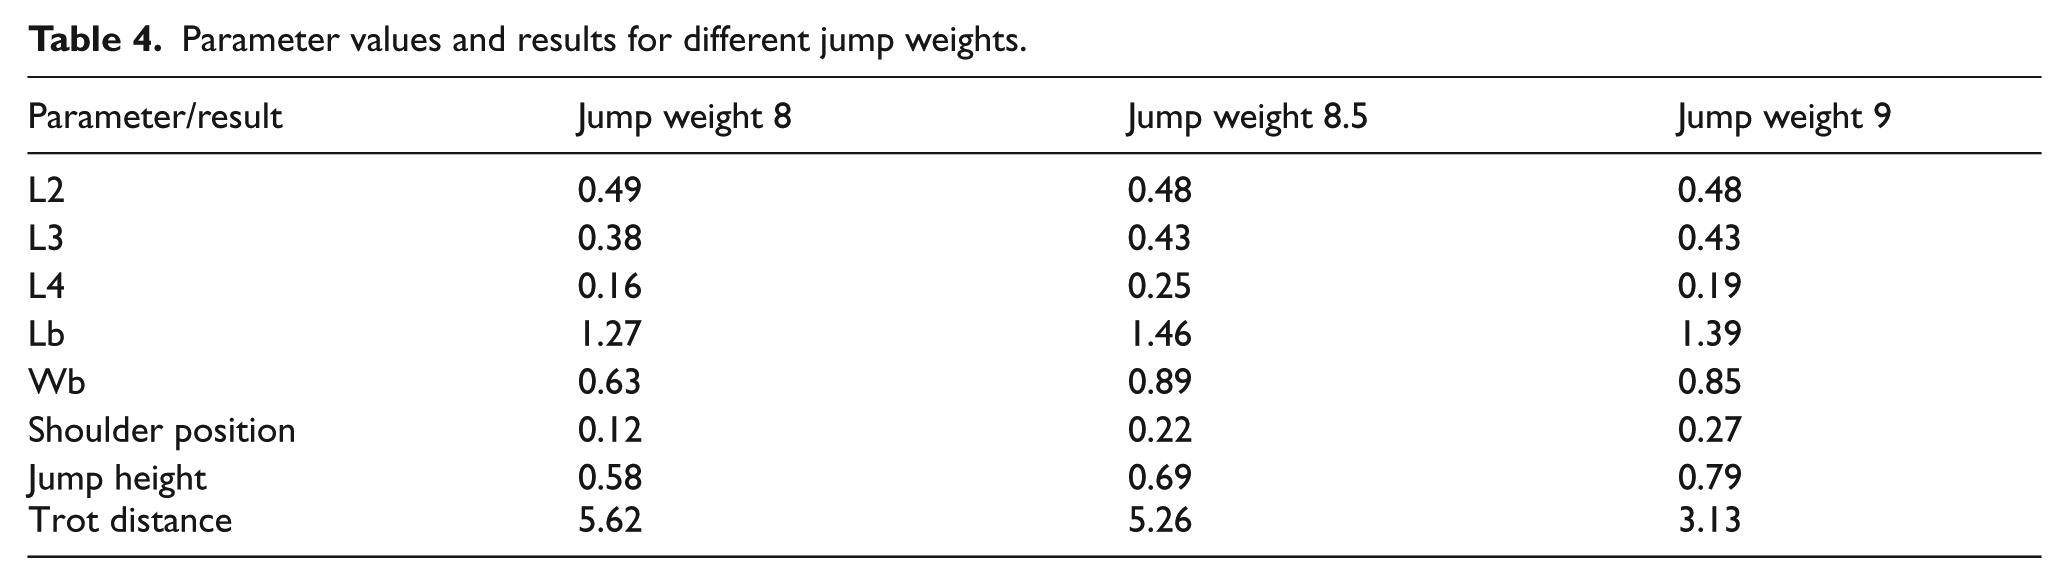
For the fittest overall design, the fitness function for the GA adds the peak vertical jump height to the trot distance traveled. The values need to be weighted since jumping 1 m high is fitter compared to trotting 1 m long. For the result on Table 3, the jump height was weighted by 8.5 relative to trot distance. Increasing this weight will result in individuals who jump higher but trot slower, while decreasing it will result in individuals who jump lower but trot faster. Three examples of this are displayed in Table 4.
Parameter values and results for different jump weights.
The GA for each optimization problem should be run multiple times to get a reliable result. This makes it safer because there is a chance for the algorithm to converge to a local maximum and the result changes depending on factors like the initial random population, random cross-over cutoffs and mutations.
The results in Table 3 show a significant performance difference between the base design and the optimized designs. In the case of the fittest jumper and the fittest trotter, the significant performance increase in one task comes with the cost of performance degradation in the second task. The fittest overall design, on the contrary, performs better in both tasks compared to the base design. The considerable difference between the kinematic parameter results for the jumper and the trotter robots, supplemented by Table 4 data that show how weighting the importance of a certain task shifts the design parameters, makes it evident that any quadruped robot with a clear purpose will benefit from an optimization process for its kinematic structure.
Analysis of the results
In this section, the kinematic structures of the final quadruped designs are discussed and the intermediate and final results of the optimization process are analyzed in order to explore the working principles and success of the search algorithm. All the design parameter data in Table 3 contain information which can help to isolate the properties making a quadruped kinematic design efficient in the given tasks.
Comparing the fittest jumper design to the base design, we see longer upper leg link lengths, shorter and wider body dimensions, and front and hind legs positioned closer to each other on the fittest jumper. Longer link lengths increase the amount the body can coil downward before pushing itself upward, increasing the power of the jump. The data show that upper two links have a higher priority in this than the foot link, resulting in longer L2 and L3 dimensions compared to L4. Body dimensions converge toward a square-like shape to make the system more balanced, since the motion is symmetrical in the walking and lateral directions.
Doing the same analysis for the fittest trotter shows that it has longer L2 and L4 link lengths and a longer body length compared to the base design. Longer link lengths allow longer step height and size which is the main factor in trot speed. The data point toward the foot link (L4) length playing a bigger factor in trotting task compared to vertical jumping. When compared with the base design, the robot body length Lb is longer for the trotter design, without significant change in shoulder positions with respect to body edges. This results in overall greater distances between quadruped legs. The assumption is that having more distance between the front and hind legs results in a more balanced trotting motion. The longer dimension in the x direction translates into a higher moment of inertia about the pitch axis. This is the horizontal axis through the body center of mass perpendicular to the locomotion direction. Large inertia about this axis creates a resisting effect against body pitch angle fluctuations. This enhances the balance of the motion in the locomotion direction and allows higher forward speeds. Off-center mass distribution in the top plane also results from the longer body shape. This creates an effect similar to the one with the pitch angle. The larger inertia about the vertical axis through the robot body center of mass resists yaw motion and this effect also plays a stabilizing role during the forward motion to assist higher locomotion speeds. The body dimension comparison is also interesting when the comparison is made with the fittest jumper. The jumper design has larger Wb and smaller Lb, wider but shorter body. A square shaped body with similar length and width is more suited to a vertical jump where the motion is quite symmetric with respect to horizontal axis compared to the trotting motion which takes place on the axis parallel to body length. The result is to have a wider body for the jumping task and a longer body for the trotting task. These selections would, respectively, add stability to these motions.
Analyzing all the data, the fittest overall design is a compromise of the two fittest jumper and trotter designs. The leg links are longer overall, making the jumping motion more powerful and trotting motion faster. The proportions of the links resemble the fittest jumper, which shows that they are more relevant for that task. The body length looks to be more important for the trotting task thus converges to be long, though the width is still wider. The final shoulder position value is a midway in between the two designs as it is higher than the one for the trotter design but the distance between the front and hind legs end up wider due to the longer body length.
On the analysis of the optimization process, the two criteria we looked for are the performance and convergence of the GA used. We describe a performing algorithm as one which finds fitter individuals on each iteration. We also identify a converging algorithm as one which settles on a fittest individual by the final population.
For gauging performance, the fitness function can be employed. The fitness function assigns a value to each individual in each population. Averaging this number for each population would give us an idea on how the algorithm is performing. Knowing that at each iteration a part of the population is formed at random, using the top 10 individuals’ average gives us clearer results.
Figure 5 shows the performance of a GA run by plotting the top 10 individuals’ mean fitness value in each generation. This one specifically has resulted in fittest overall individual in Table 3. Seeing a steady increase in the performance graph shows that the optimization algorithm is working. The increase does slow down, but from this graph, we cannot tell whether 16 generations are satisfactory to reach a final design. The fact that it just slows down instead of stopping at a point also does not necessarily mean that there is no convergence, since the fittest individual might converge to a set of parameters, while the rest of the population moving toward that design would still keep increasing the mean fitness.
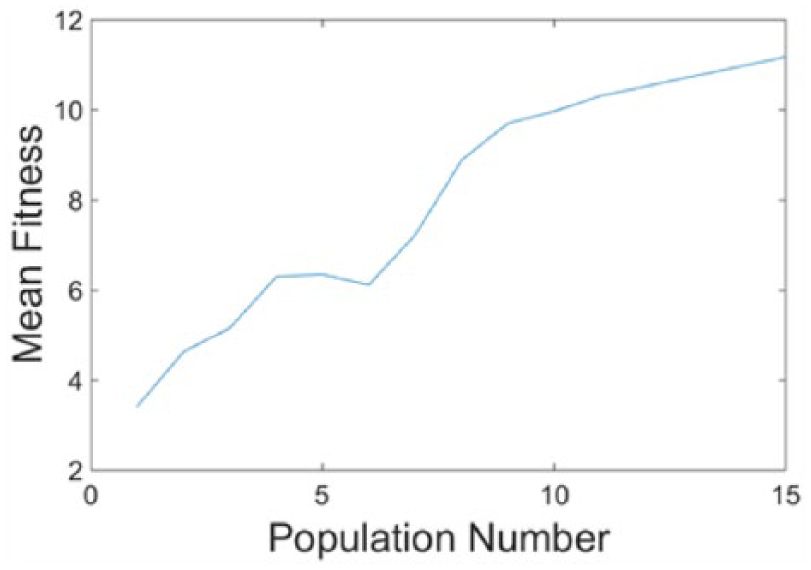
Mean fitness of top 10 population members over generations.
We need to see individuals’ performances to check for convergence. Figure 6 shows fitness plots for the 20 individuals (numbered on x-axis according to their fitness values, the fittest individual receiving number 1) for all 16 populations. The right half of the graph is random since it contains individuals created by mutations and randomizations at each iteration. The left half of the graph is reached through the selection part of the algorithm. Curves with higher values on the left side belong to newer generations with fitter individuals. The convergence of the results can be seen in this plot by the way the left halves of newer populations start making a horizontal line. This line is where the fittest individual design converges to. In fact, the thick curve marking the final population is a horizontal line for the entire left half of the graph, meaning that it has entirely converged on an individual design. A closer look at this is through the fittest individual of each population’s performance.
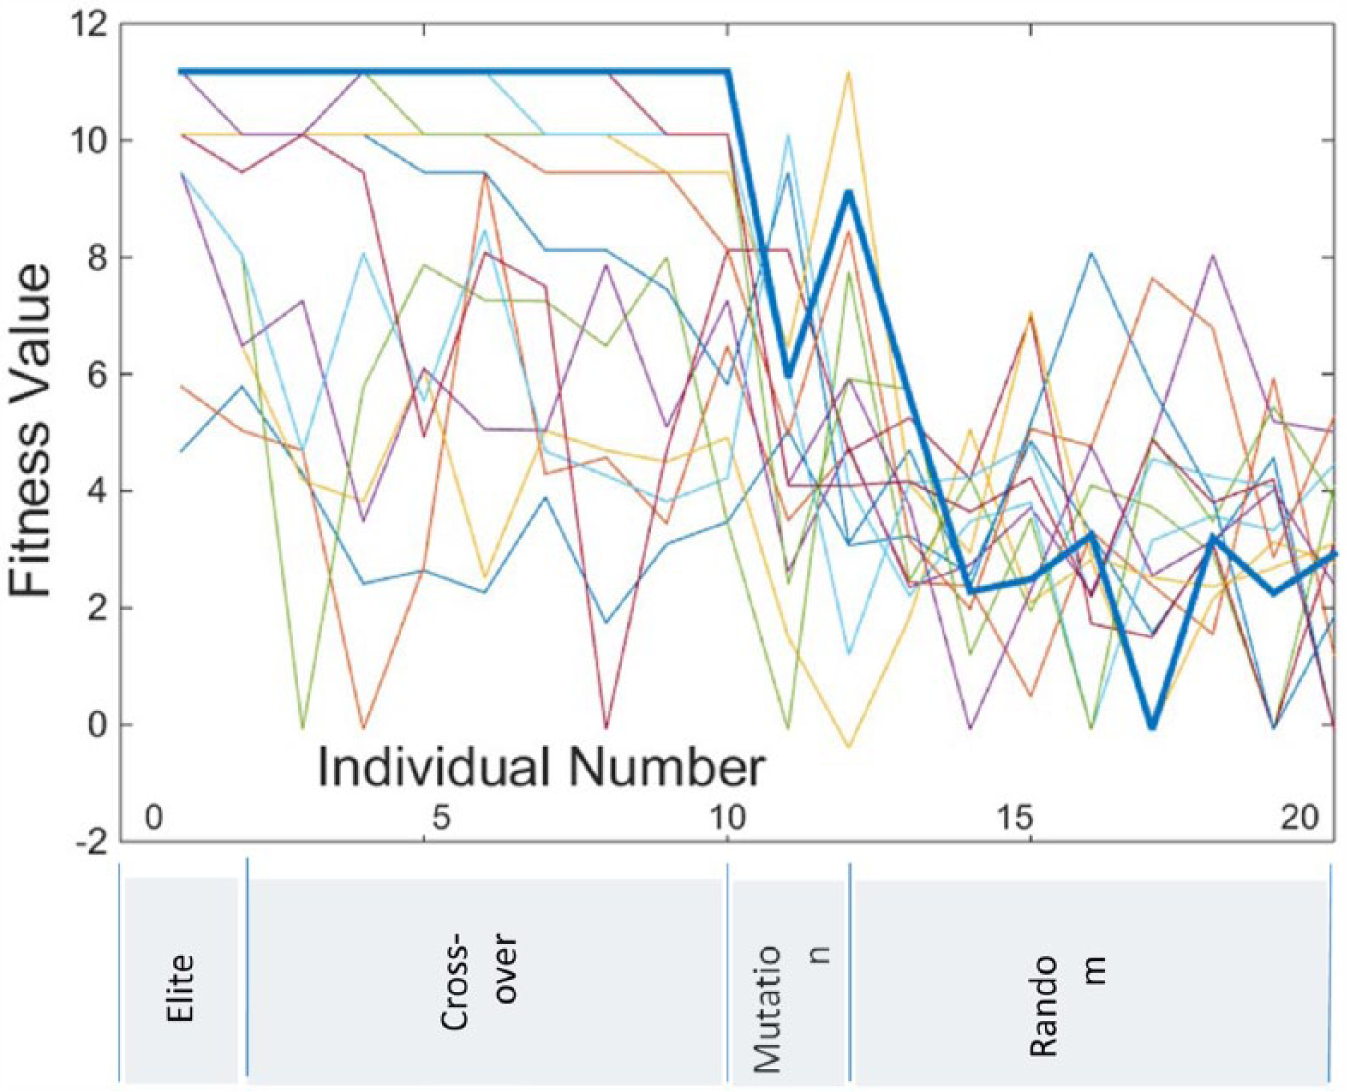
Fitness plot of all populations. Each colored curve is a different generation. The horizontal axis shows elite, cross-over, mutation and random individuals from left to right. The vertical axis displays the fitness values. The thick curve is the last population.
In Figure 7, it is clear that the fittest individual containing the final design parameters is reached at population 11 and stays unchanged till the final population. Fitness function value cannot be improved further by increasing the number of generations after the fittest individual converges. A convergence in fitness can be observed here, but there is also the possibility that multiple individuals with different design parameters can have the same fitness function values. Similar curves to the ones in the performance plots can be drawn for design parameters.
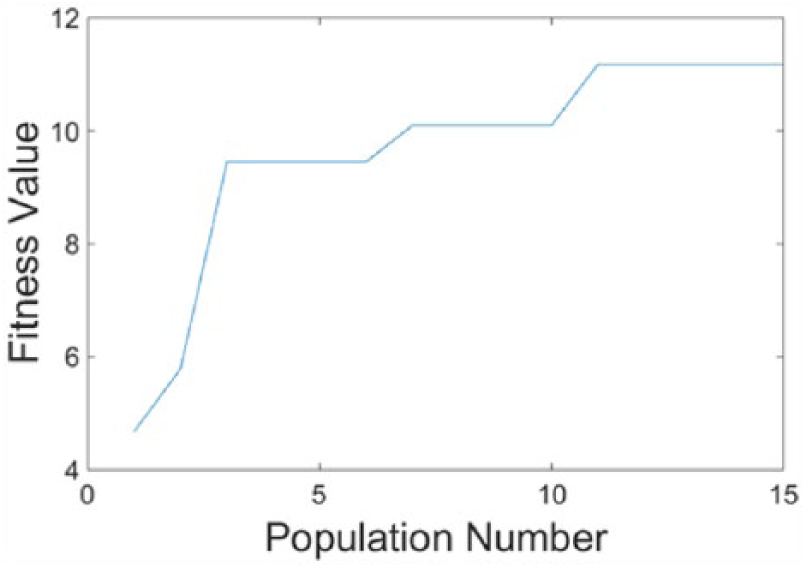
Fitness value of the fittest individual in each population.
In Figure 8, plots for design parameters for every population are displayed (only even numbered populations are shown to make the plots more readable). Similar to Figure 6, the final population curve (thick curve) is a long horizontal line meaning multiple individuals in a population have settled on a value and it is a clear sign of convergence. The difference is that for the fitness plots the converged value would be a maximum, while the design parameters converge to the specific value that gives the maximum fitness. This can also be used to justify the ranges used to limit the values design parameters can take, since they all converge to values in between the boundaries and not at the boundaries themselves. If a design parameter settled at a maximum or minimum of its range, it would justify redefining the boundaries.
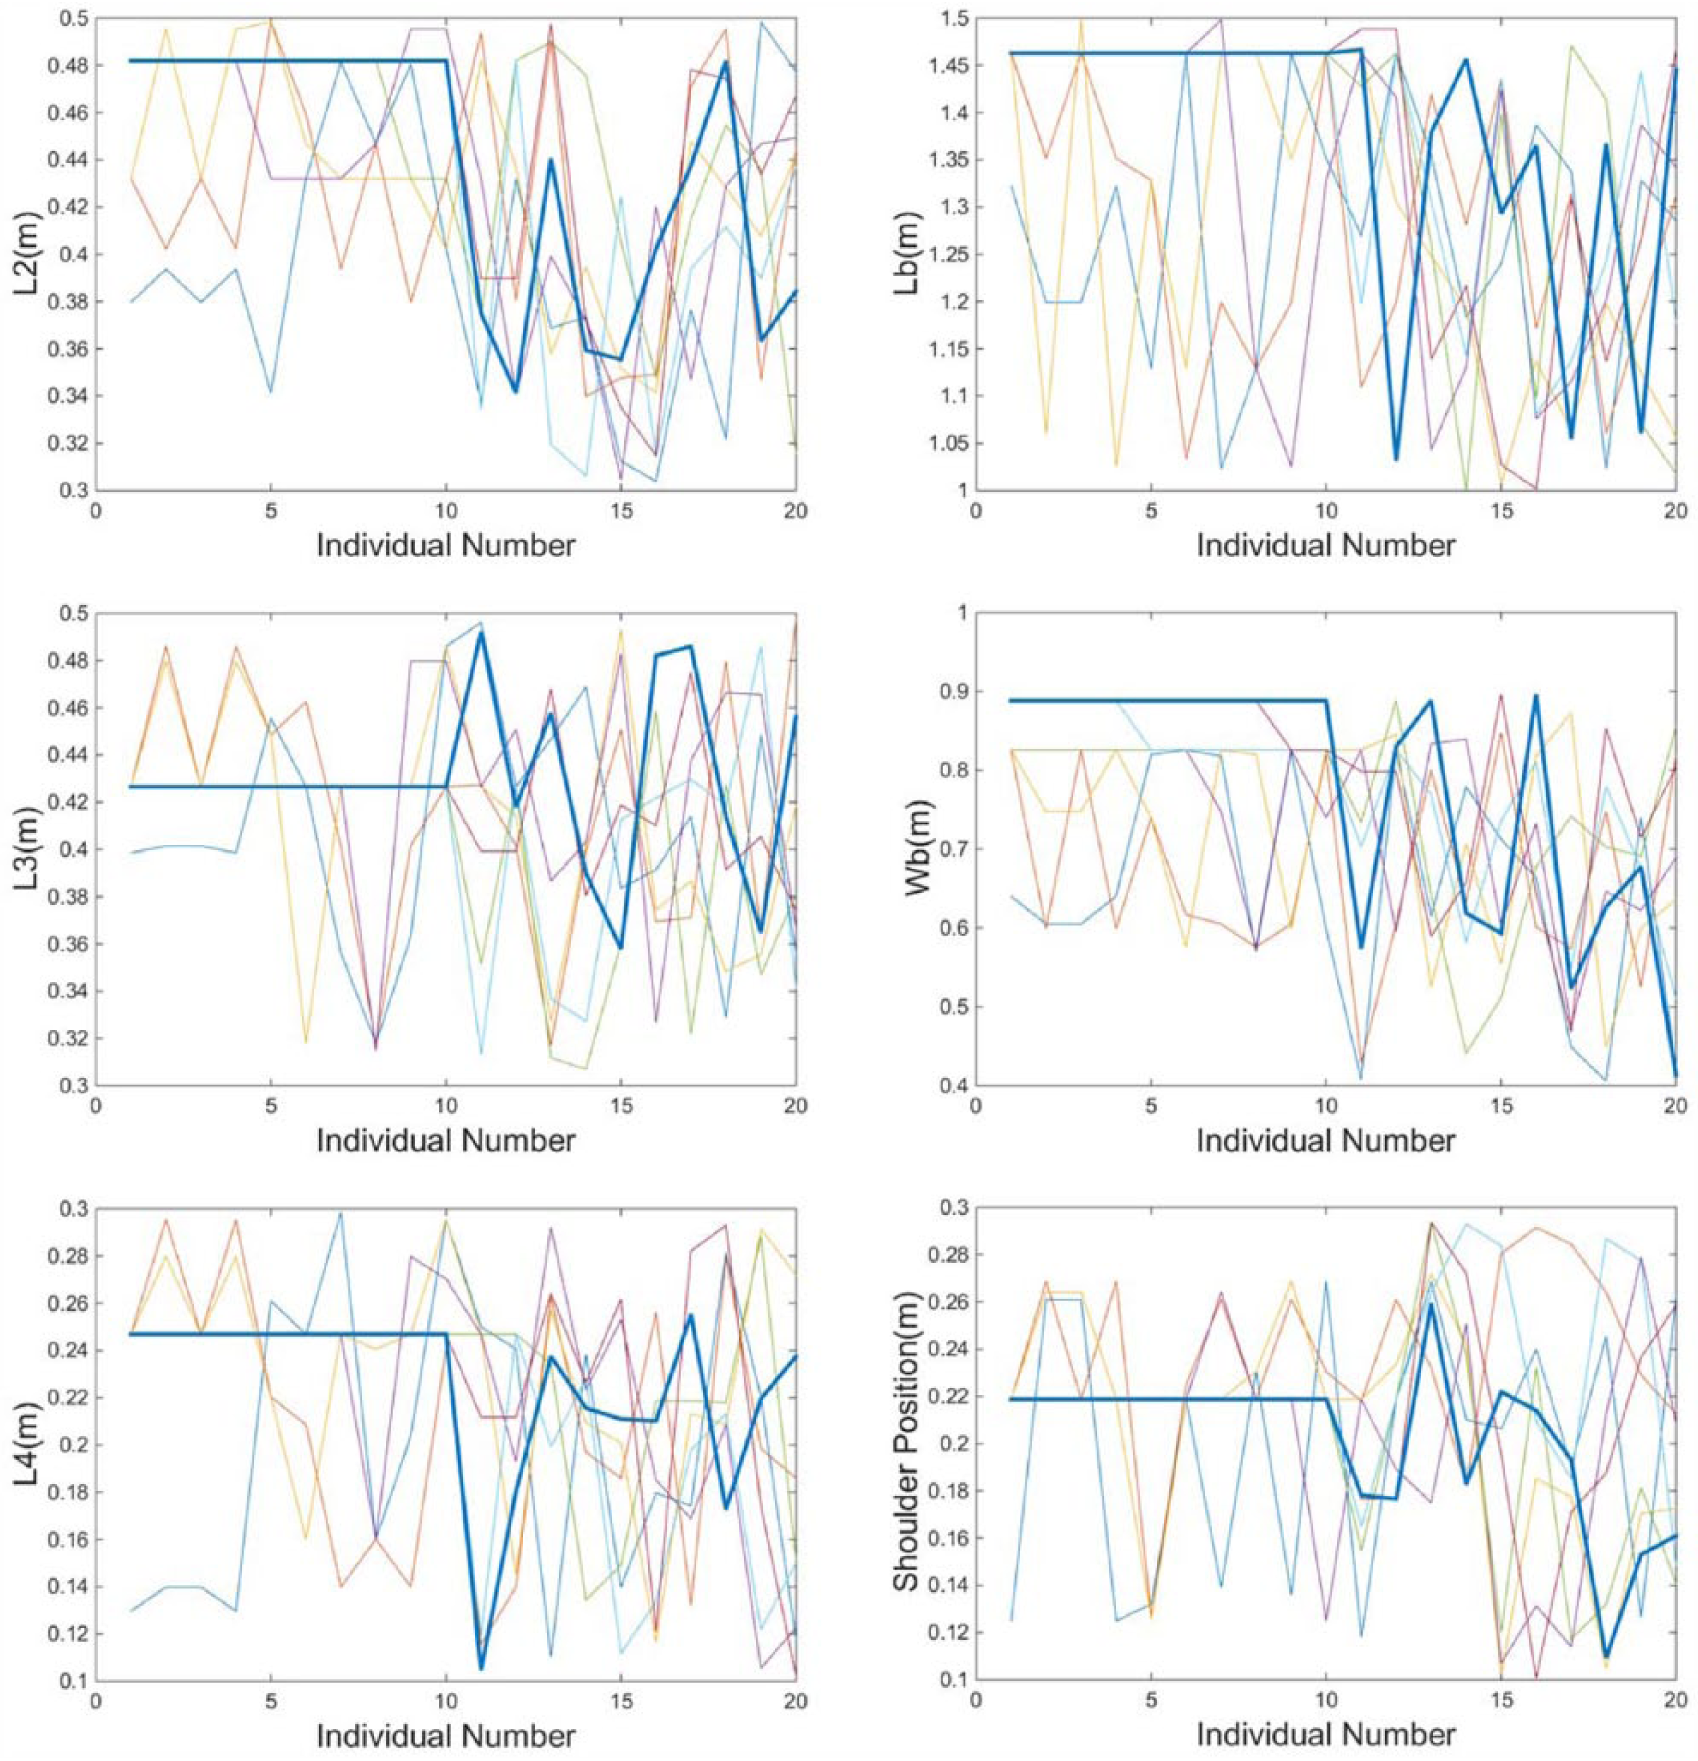
Design parameter plots. Curves are same as Figure 6. Y-axes are values particular parameters take. Thick curves are the final population values.
The data so far are all from a single run. GA has multiple random factors in it like cross over from a random point, mutation and addition of random individuals at every iteration. These are there primarily to avoid converging to a local optimum and exploring further for the global one. This is not perfect however and especially for a complex problem like this multiple test runs with different initial random populations can be favored for a better chance at getting proper results. This multiple-run approach is employed in this article.
In Figure 9, six different results of the GA ran for the jumping task are displayed. Even though the results are close, the algorithm does not always converge at the same peak height value. Separate tests with different initial conditions, which are the randomized starting population individuals, yield slightly different results. Number of tests run should increase the certainty of the optimum result.
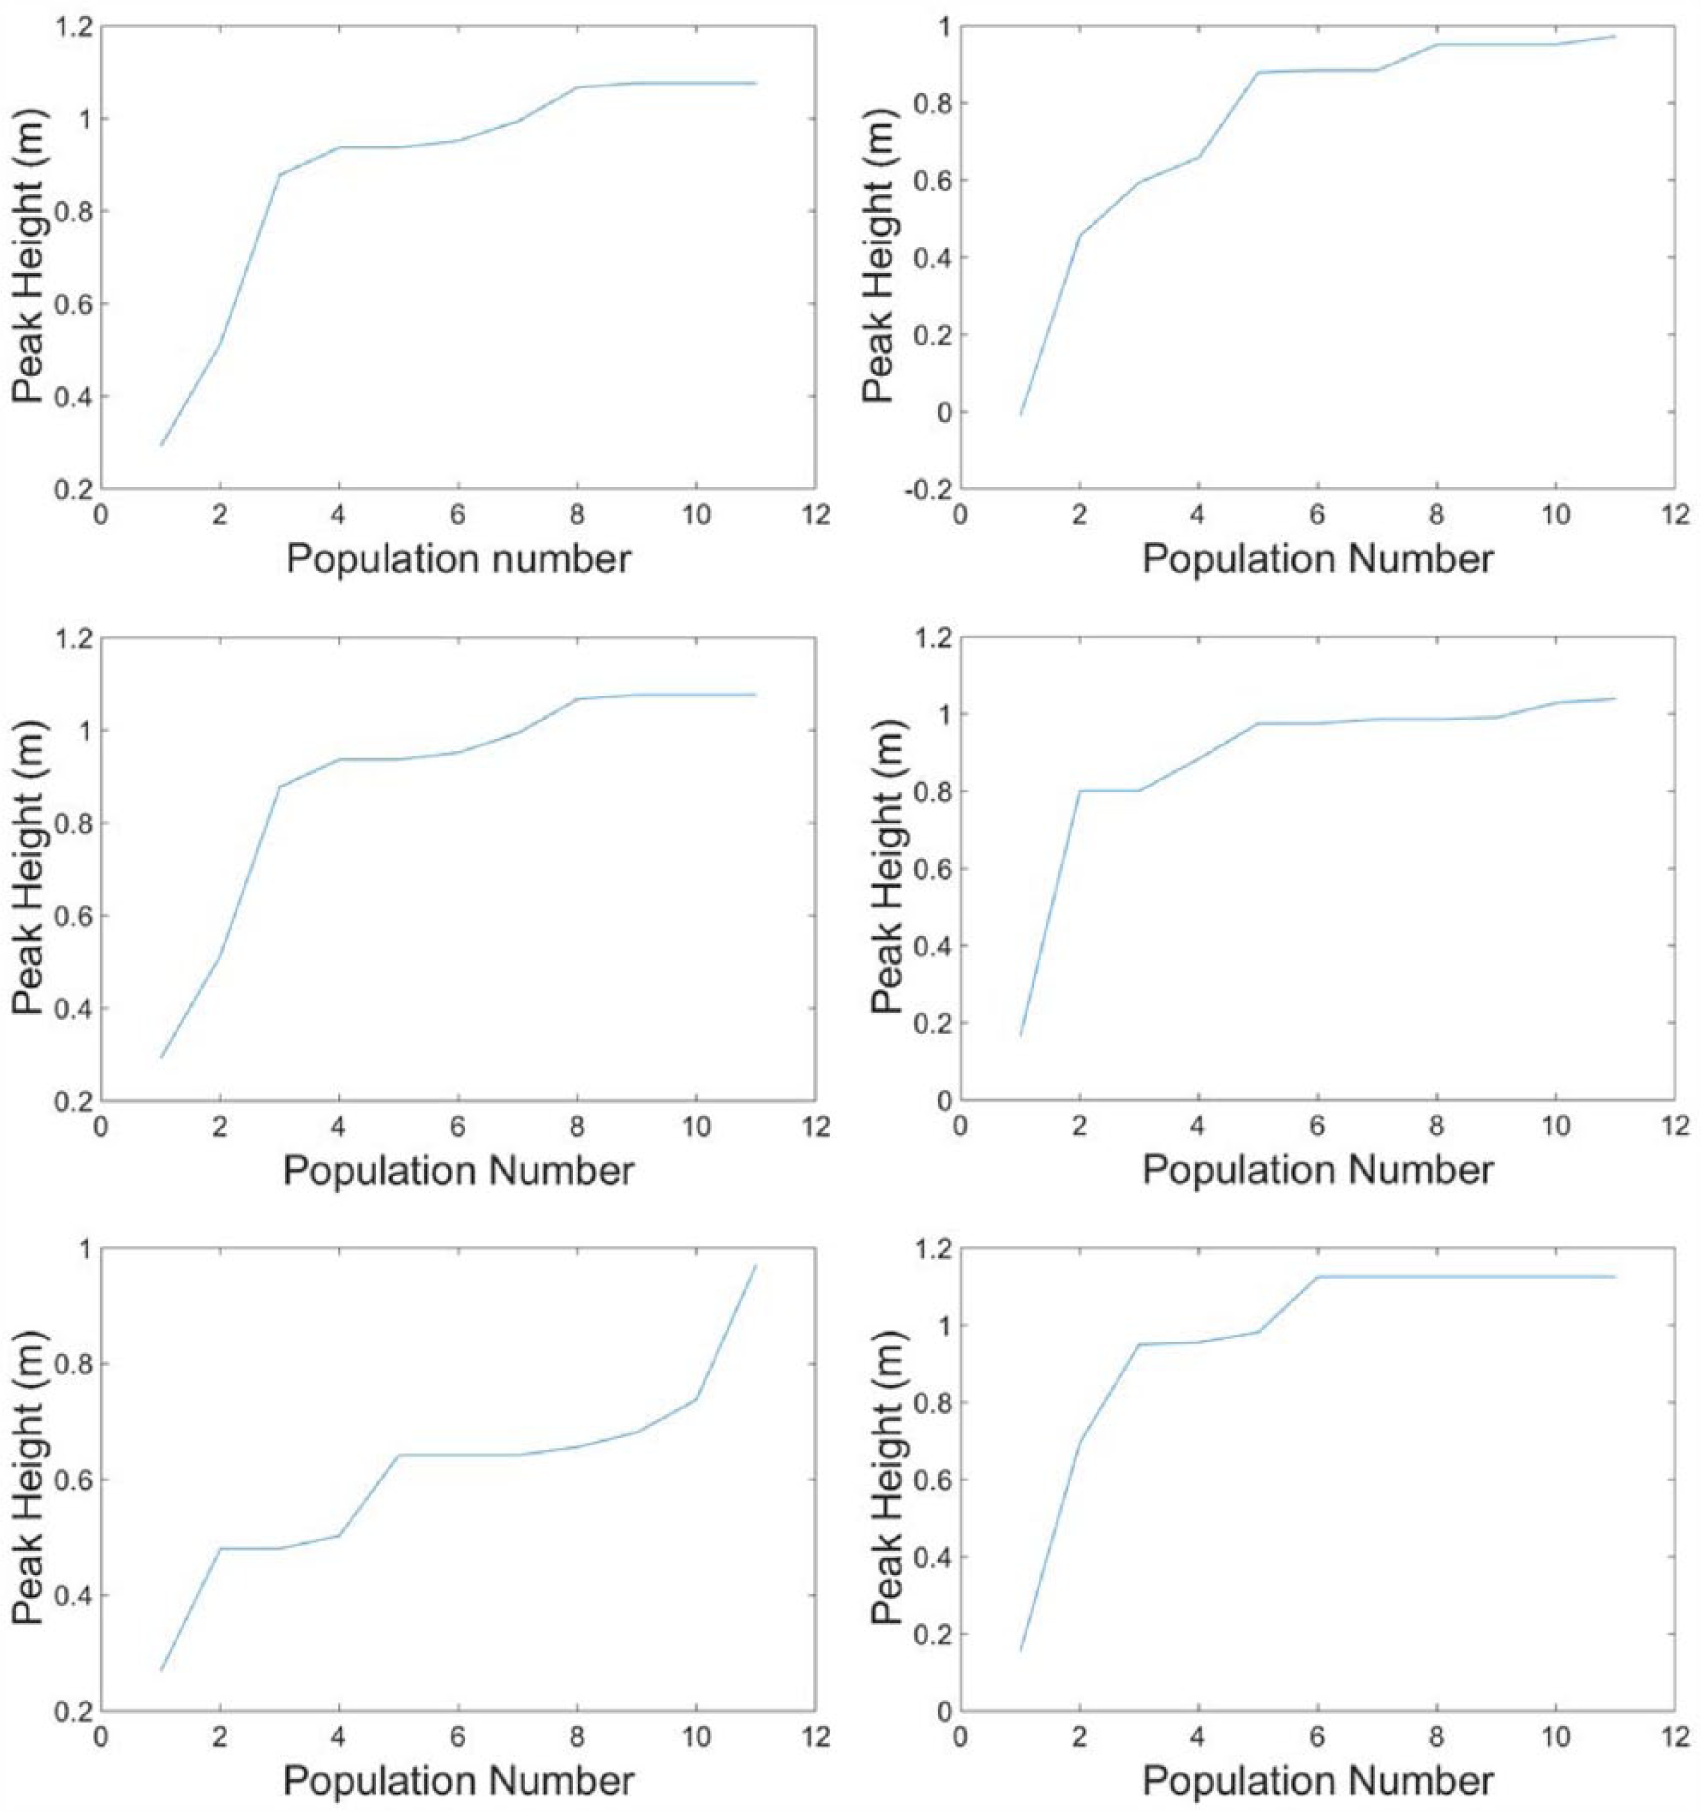
Fittest individual displacement plots for six separate tests.
The analysis indicates that the use of GAs for this problem is a rational approach. The resulting designs are significant themselves too. The implemented GA was successful in finding quadruped designs for the three optimization problems and the difference in both their kinematic structures and their performance in executing the two tasks are visible.
Conclusion
Quadruped robots pose promising structures for tasks on rugged terrain. Highly dynamic motion types like jumping and fast locomotion is studied in recent projects. While kinematic designs including robot body and leg link lengths are inspired from nature, there is the lack of a systematic approach for the selection of these parameters. This article aims to fill this gap by introducing a GA-based kinematic parameter optimization technique. Another point where this quadruped design GA approach contrasts the existing robotics literature is that dynamic task performance metrics are used as optimization objective functions. Obtaining the performance measures is achieved by a full-dynamics simulation method with exact contact force computation. The dynamic tasks jumping and trotting are taken as case studies. These tasks are described by Cartesian and related joint position trajectories. The simulation algorithm is run many times in the GA-based search method for these tasks. Three types of optimizations are carried out: (a) best jumper optimization, (b) best trotter optimization and (c) a weighted combination of jumper and trotter optimization. Jumping height is the objective function in the jumping optimization and the distance covered by locomotion in a certain fixed duration is the one for the trotting optimization. The third optimization employs a weighted combination of these objective functions. The three outcoming designs are compared. A conventional nature inspired model is added to the comparisons too.
Our main findings are as follows:
There is, as hypothesized in this article, a more than significant performance improvement potential of systematic design procedures of quadruped kinematic parameters over straight and ad hoc inspiration thereof from nature.
The task-specific nature of the optimization technique proposed, achieved by the feedback from full-dynamics simulations, creates very notable kinematic parameter dissimilarities and dramatic performance differences between the robots outcoming from the three optimization case studies mentioned above. As an example, the best jumper is very different in its kinematic parameters from the best trotter. It can jump more than three times higher than the best trotter.
It is also shown in this work that task performance measures can be combined and weighted to obtain “hybrids” performing in more than one task.
The extra effort of optimization, over direct inspiration from nature, is well worth spending it. There is a significant potential of performance improvements by proper kinematic parameter value selection. This article proposes a way for systematic design with feedback from dynamics simulations.
To the knowledge of the authors, this work presents the first example of GA-based robot kinematic parameter optimization with performance metrics derived from dynamic tasks. The proposed method is a very good candidate for the kinematics design of dynamically performing robots.
The technique presented and the optimization outputs motivate a number of future research directions. One such direction is toward a configurable robot concept. A robot with on-board resources to change its link lengths or leg attachment points to adapt to different tasks. Another idea is the application of the optimization route for robots which have passive joints in addition to the actuated ones. Parameters of passive joint spring and damper structures can also be optimized together with the kinematic and reference trajectory features presented in this article.
Footnotes
Declaration of conflicting interests
The author(s) declared no potential conflicts of interest with respect to the research, authorship and/or publication of this article.
Funding
This work was supported in part by The Scientific and Technological Research Council of Turkey (TUBITAK) under Project Grant No. 114E618. M.M.G. acknowledges TUBITAK’s support through the 2211 Graduate Scholarship program.