
Abstract
This work presents the operational optimization of a welding operation involving using genetic algorithms. The welding curves correspond to the profile of a blade-shaped Pelton turbine. The procedure involved the development of a series of tests and observation of the parameters that will be controlled during the welding process. After the tests were performed, the samples were prepared for chemical attack, which allowed observation of the penetration, weld area, and dilution. After that, mathematical models were developed that correlate the controllable welding parameters with the aforementioned bead parameters. In those mathematical models, the optimization of the process parameters was performed using genetic algorithms. Specially programmed functions for mutation, reproduction, and initialization processes were written and used in the implemented model. After the optimization process was completed, the results were evaluated through new tests to verify whether the obtained objective functions properly describe the characteristics of the weld. The comparisons showed errors of less than 6%.
Introduction
The continuous use of turbines causes their degradation due to the magnitude of water impact and cavitation. Currently, one of the main problems with cavitation issues in turbines is the associated cost of blade replacement. Therefore, one solution that may lower these costs is fixing the damaged blades. An alternative that partially addresses this issue is the process of material deposition via manual welding in the areas of the blades that are notoriously eroded and subsequent rectification of the blade geometry by grinding of the unnecessary added material. However, this widely used technique still represents a time-consuming process and requires highly qualified operators, thus increasing the costs associated with electricity generation. 1
Inert gas welding of a metal is an arc welding process in which coalescence is produced by heating the area with an electric arc between a consumable electrode and the work metal. The electrode, weld pool, arc, and adjacent areas of the base metal are shielded by an inert gas, which might be argon, helium, hydrogen, nitrogen, or mixtures of these gases, fed through the welding gun.2,3 Because automation of this welding process is common, the operational procedure must ensure that the weld bead is of high quality and is obtained at a minimum cost. It is well accepted that bead geometry is an important factor that determines the mechanical properties and quality of the weld. Hence, the input welding parameters must be carefully defined to obtain a high-quality joint.
Several methods for obtaining the desired weld bead have been proposed via models designed to correlate the input variables with the output variables. The most frequently used method for determining process models is experimental design and regression analysis, 4 and fractional factorial techniques 5 have been used to estimate the weld bead dimensions in automatic submerged arc welding (SAW).
Taguchi method provides an efficient, structured, and reliable method for design optimization for performance, quality, and cost. 6 This technique, in combination with regression analysis, has been applied to define the process parameters of the SAW process. 7
Multiple regression analysis8–11 was used to predict the process parameters for gas metal arc welding. However, application of these techniques is limited due to difficulties in modeling, time consumption, and efficiency.
Because the use of traditional mathematical models is often considered inadequate and inefficient in explaining the nonlinear relationships between the input and output parameters of welding, artificial intelligence–based systems such as fuzzy logic and artificial neural networks (ANNs) have emerged in recent years. ANNs12,13 have been used to predict the weld bead geometry in shielded metal arc welding (SMAW). Although these methods offer several advantages compared with conventional regression models, neural network–based models require a significant number of samples to efficiently train the network.
Optimization using the aforementioned techniques is effective only if the welding process is set near the optimal conditions or within a stable operating range.14,15 To overcome this problem, meta-heuristics were used to find the optimal solution.
Metaheuristics emerged to tackle complex optimization problems in which classical optimization methods failed to be either effective or efficient. These methods are considered the most practical approaches for solving many complex optimization problems, and this is the case for many engineering problems that are combinatorial in nature. The main advantage of meta-heuristics lies in both their effectiveness and applicability. 16
A wide variety of meta-heuristics exist together with several approaches used to classify them. One approach characterizes the type of search strategy, for example, one type of search strategy is an improvement on simple local search algorithms. The other type of search strategy contains a learning component in the search. Another classification dimension is single-solution versus population-based searches. Single-solution approaches focus on modifying and improving a single-candidate solution, population-based approaches maintain and improve multiple-candidate solution (often using population characteristics to guide the search), and population-based meta-heuristics include evolutionary computation, genetic algorithms (GAs), particle swarm optimization (PSO), and others.16–18
The GA was used to optimize the parameters of arc welding14,19 and SAW in the hard-facing process 20 and the weld bead geometry in plasma-transferred-arc hard-faced austenitic stainless steel plates. 21 However, PSO has been used for optimization of the machining parameters for milling operations and optimization of friction welding parameters. 22
This article explores the use of GA to find the optimal set of welding process variables in a second-order rotational model for the estimation of weld bead geometry in robotized arc welding of curved specimens, which describes the profile of a blade-shaped Pelton turbine. The procedure involves the development of a series of tests that depend on the variables that will be controlled during the welding process. Following the tests, the samples for chemical attack were prepared, which allowed observation of the penetration, bead area, and dilution. Height and width measurements of the welding beads were subsequently performed. The latter were used to obtain second-order regression models, which were provided as the objective functions for use in the GA optimization.
This article is organized as follows. Section “Experimental procedure” describes the experimental framework used to represent the operational characteristics under analysis. Section “Research methodology” introduces the methodology applied throughout this work. Section “Data collection” describes the data collected according to the experiment design described in the previous section. In section “Obtaining the mathematical models,” the obtained mathematical models are described. The optimization process via a GA is presented in section “GA-based optimization.” Section “Results validation” reports on the results validation. In section “Effect of the different variables present in the welding process,” the technological aspects of the process are discussed together with the operational parameter estimation using the developed models. Finally, section “Conclusion” presents the conclusions.
Experimental procedure
The base metal used was AISI-SAE 1020 structural steel due to its low cost compared with that of the turbine blade material (AISI 4140). The chemical composition is shown in Table 1. 23
Chemical composition of SAE 1020 steel. 23

The filler material corresponds to an AWS:ER-70S-6/ER-48S-6 electrode with a diameter of 1.2 mm. The metal inert gas (MIG) system uses a mixture of argon and carbon dioxide as a protector gas, with an 80%/20% mix, respectively. 3 The specimens have the curved profile of a blade-shaped Pelton turbine (300 × 50 × 5 mm), as shown in Figure 1, which attains the curved shape via a roll bending machine that sets the segments on a metal base to facilitate welding tests with the robot arm. A KUKA robot arm (model KR 125/2) was used during the process, which incorporates an ESS welding machine (model Pulsarc 350). The experimental setup used in the experiments is shown in Figure 2.

(a) Pelton blade turbine used in this work. (b, c) Examples of eroded areas.
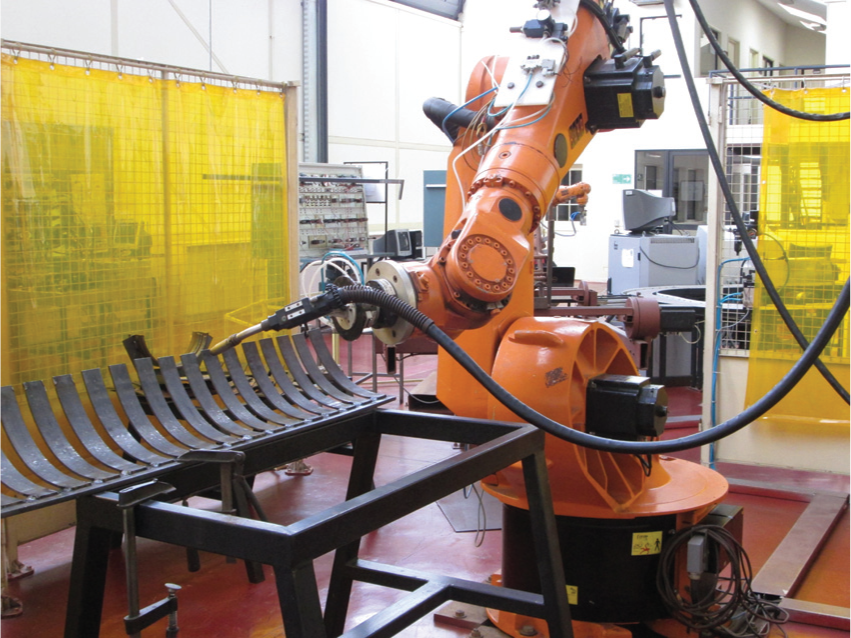
Curved specimens and blade-shaped setting for welding beads.
The robot was programmed using a point-to-point strategy to facilitate the welding torch movement along the curve trajectory of the specimen during the process.
The preparation of the specimens began once the welding beads were completed with all the controlled parameters, which include two stages:
Cutting using a coolant liquid to avoid alterations in the bead structure caused by the temperature.
Metallographic preparation for the chemical attack with 5% Nital, which allows visualization of such characteristics as penetration, bead width, and height. The welding bead area measurements are performed by computer-aided design (CAD) software, thus allowing scaling of the welding bead pictures obtained through a stereoscopic magnifier. The area value is obtained by drawing a poly-line on the welding bead picture. This process also permits calculation of the dilution percentage present in the welding bead.
Research methodology
The independently controllable process parameters were identified based on their effects on the geometry of the weld bead, dilution, and penetration. These parameters are voltage (V), welding speed (S), swinging length (L), wire speed (W), and shielding gas flow rate (R).
The working ranges of each parameter were defined before the tests; the welding bead was divided into three segments (see Figure 3) because the curve slope causes spillage of the deposited material, resulting in poor quality of the bead. Note that segment No. 3 has the highest slope among the three segments. It is worth mentioning that these segments also coincide with the three different observed zones in the welding beads before the optimization (see Figure 16(a))

Segment distribution in the specimen.
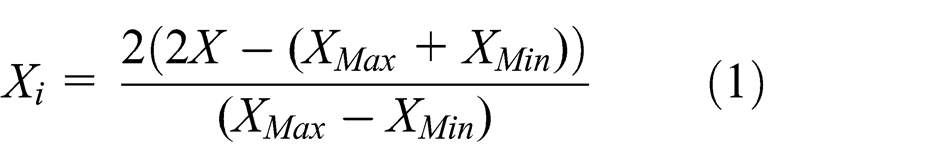
The latter problem was solved by varying the parameters for each segment. The intermediate codification limits and values, shown in Table 2, were defined for each parameter according to the following equation
Limits and codification values of the welding process.

where Xi is the codified value for each parameter; XMax and XMin are the upper and lower limits, respectively; and the X variable adopts the value of each parameter in accordance with the codification. 24 All welding parameters at the intermediate (0) level represent the center points, whereas the combination of each parameter at either its lower value (−2) or its higher value (+2) with the other two parameters at the intermediate level constitutes the star points. 25
Data collection
The data were collected for each tested specimen according to the previously described experimental design matrix. To measure the welding bead characteristics, the following processes were carried out on each one of the specimens: sectioning, polishing, etching, and profile tracing. Every specimen sample was analyzed to determine the penetration, area, dilution, width, and height of the beads, as shown in Figure 4. 25
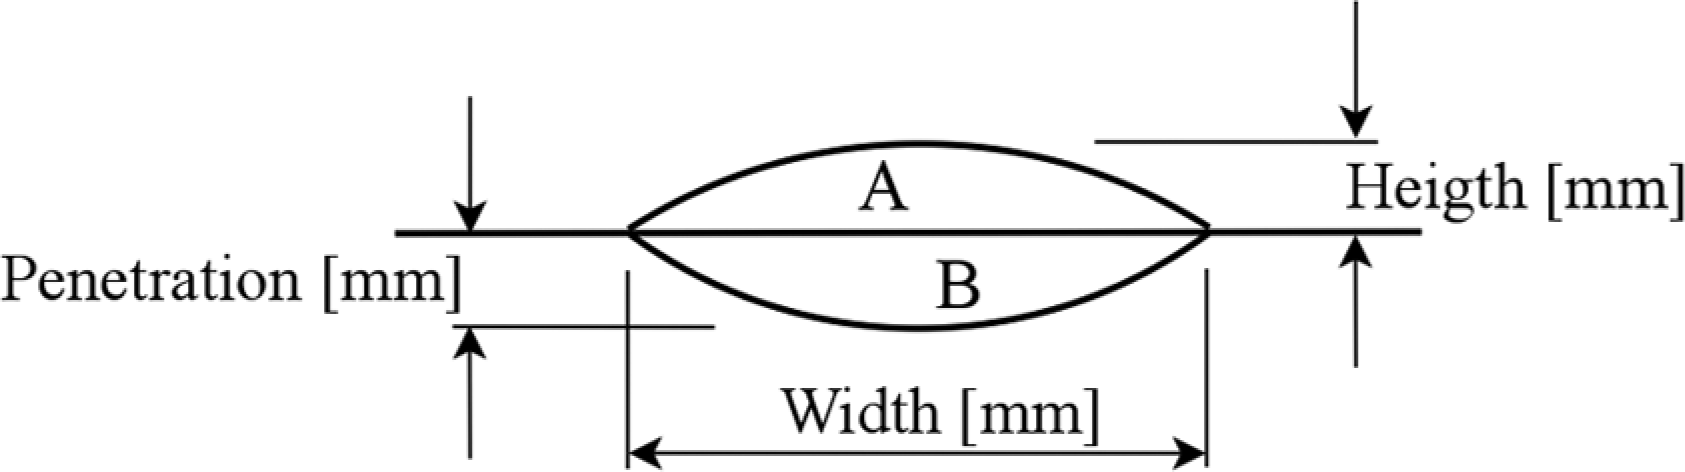
Weld bead–measured characteristics.
The total area was measured in square millimeters, and the dilution was measured as a percentage using the following equations according to Figure 4


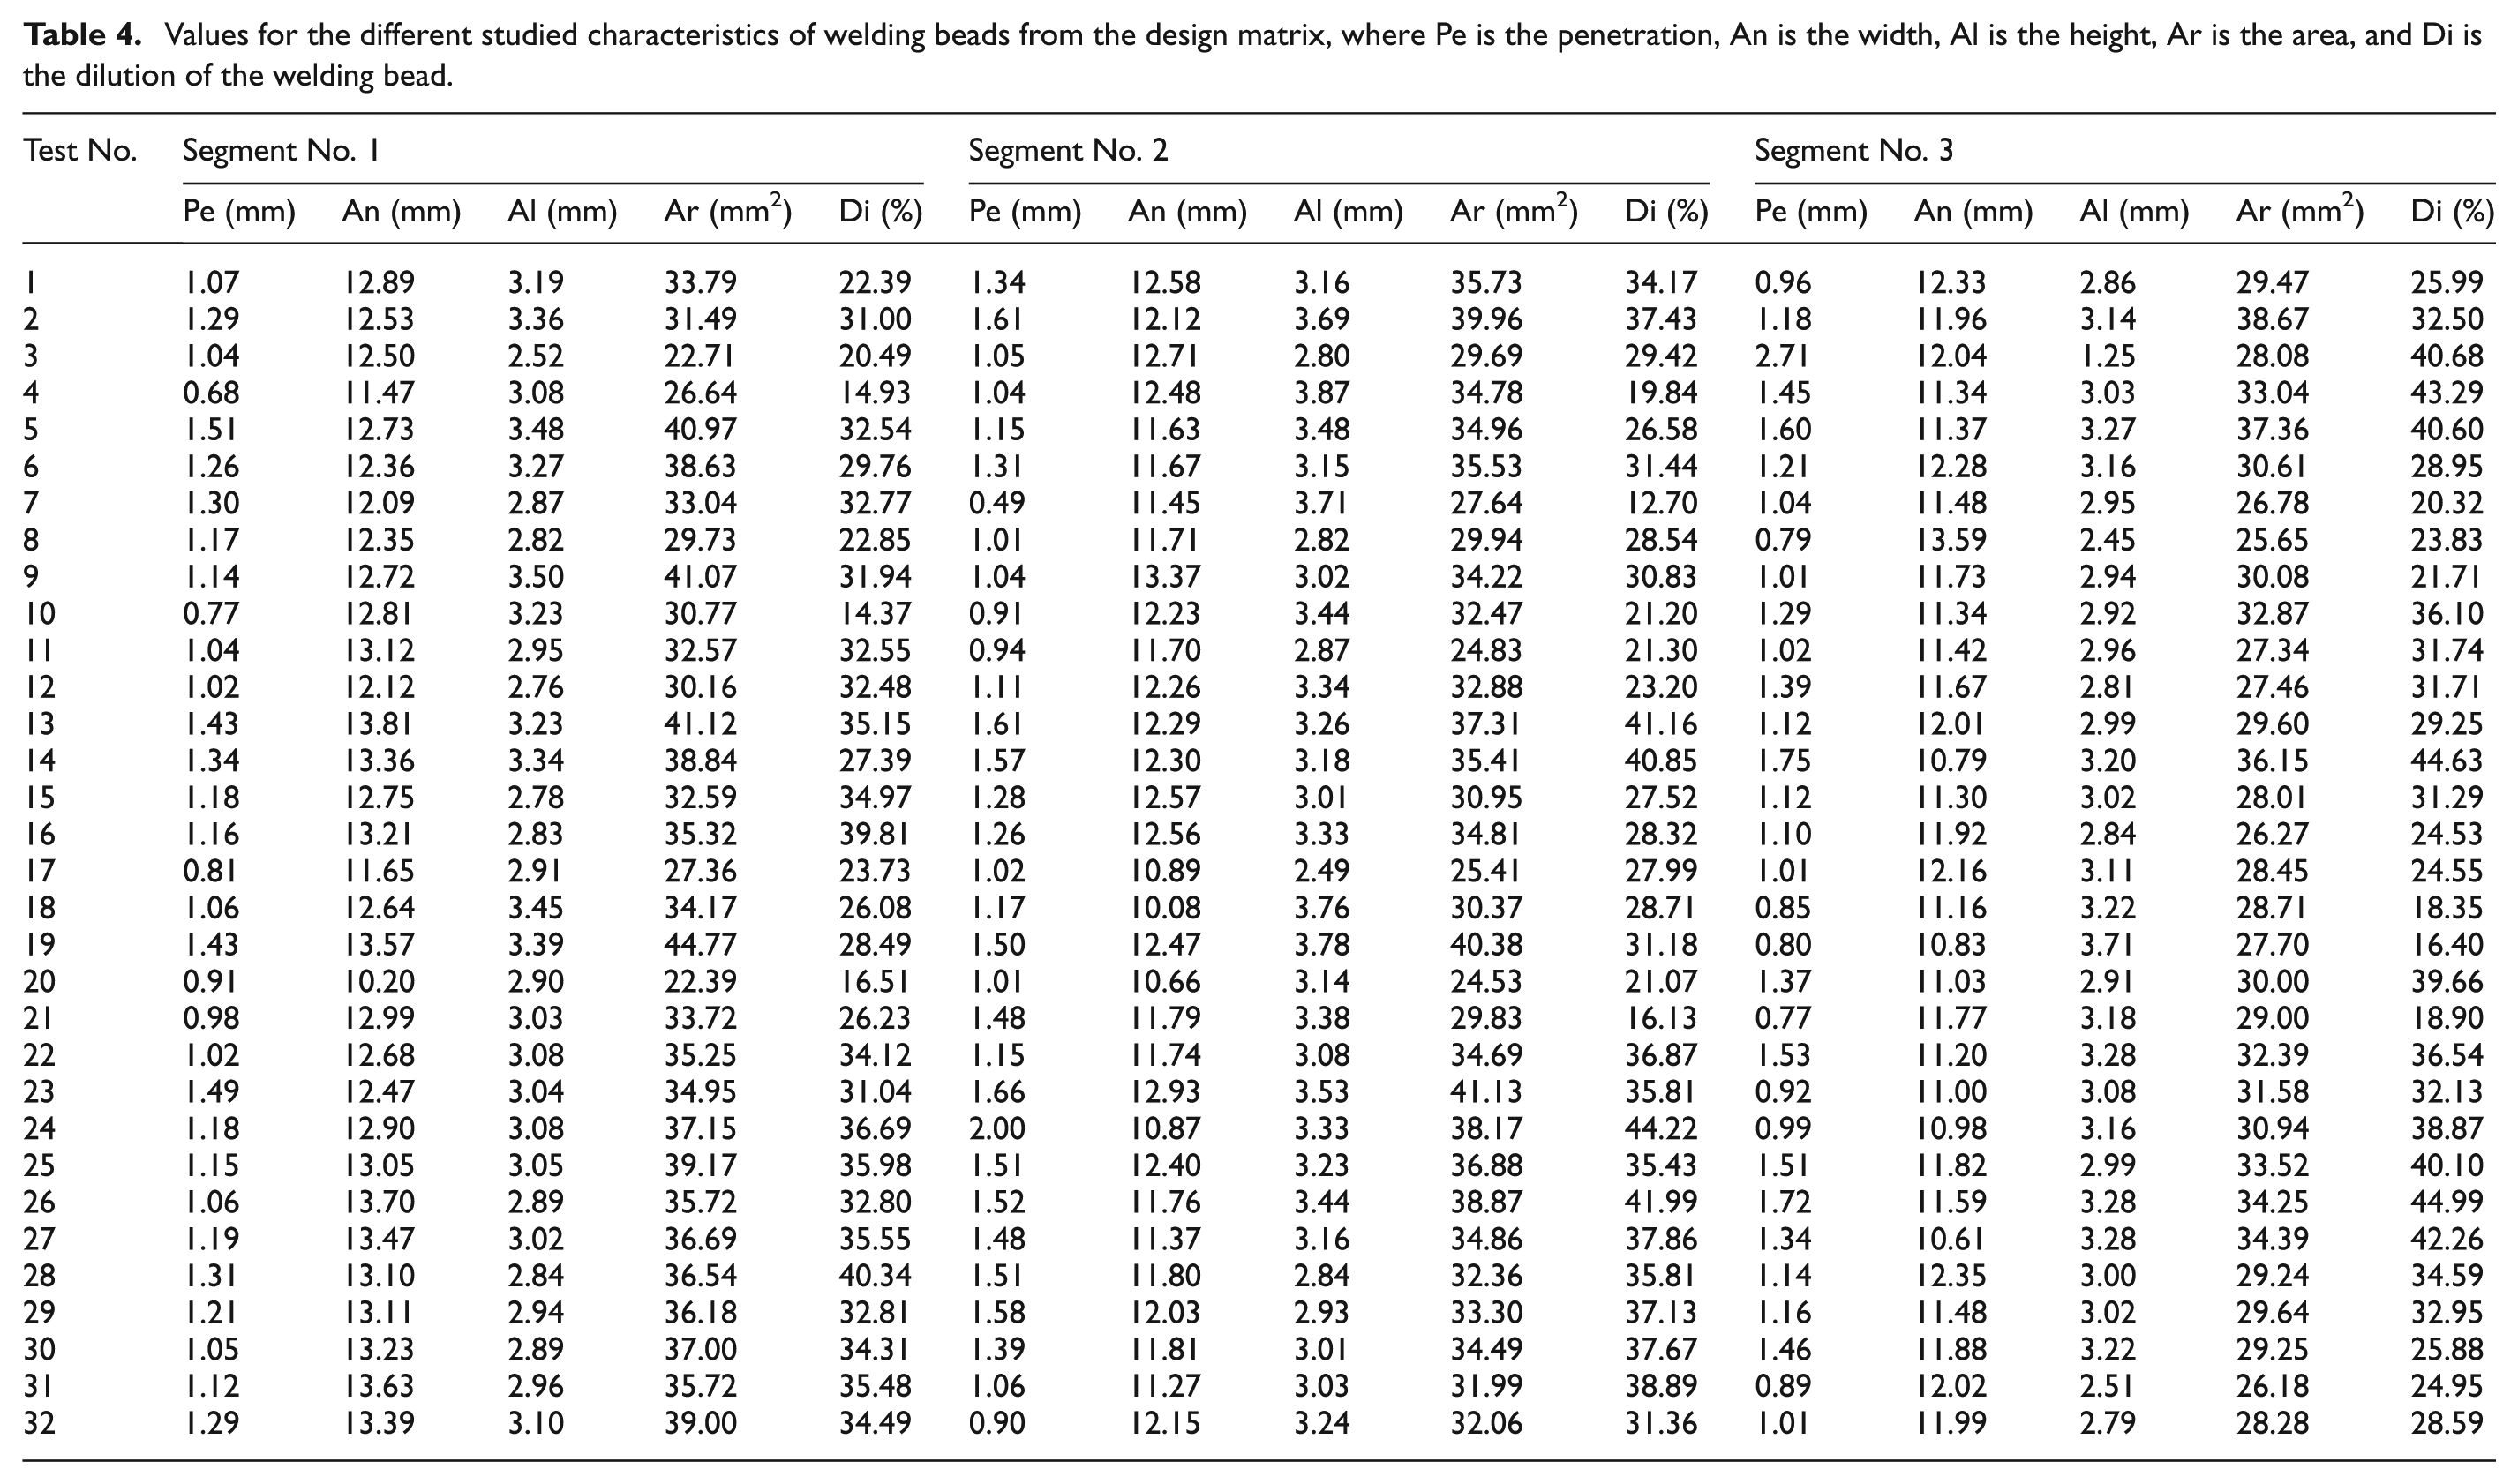
The area determines the dilution, which is the change in the chemical composition of the filler material caused by the mixture with the base metal or the previously deposited welding bead during the process of recovery of a metallic element. The values obtained for the welding bead characteristics in each test of the design matrix in Table 3 are shown in Table 4 according to the corresponding segment.
Design matrix suggested by Cochran and Cox. 25

Values for the different studied characteristics of welding beads from the design matrix, where Pe is the penetration, An is the width, Al is the height, Ar is the area, and Di is the dilution of the welding bead.
Obtaining the mathematical models
A second-order polynomial that represents the response surface for k parameters is given by equation (4). Using the regression procedure, it was possible to develop mathematical models to predict the depth of penetration, bead area, and dilution. Thus, the response function that represents each one of those dependent variables can be expressed as Y = f(V, S, L, W, R)
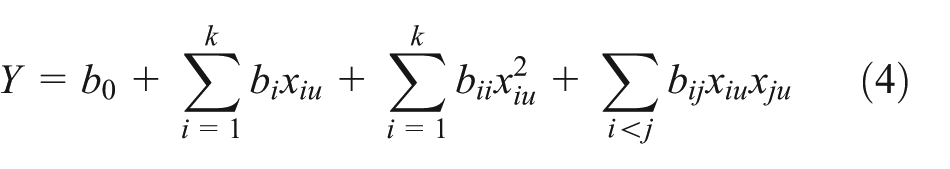
where b 0 is the free term of the regression equation, bi are the linear terms, bii are the quadratic terms, and bij are the interaction terms. The software MATLAB 26 was used to calculate the values of the coefficients. The coefficients from each objective function describing the properties of the weld beads at each location are shown in Table 5.
Coefficients of the objective functions for each segment.

GA-based optimization
The main objective of the optimization phase was to maximize the weld bead characteristics via the use of a specially developed GA. The programming for the optimization incorporates the restrictions of the model to obtain the results and solution vectors that allow the execution of suitable welding beads. Failing to incorporate the restrictions will cause the GA to give incorrect results by not delimiting the optimization process to the codified variables shown in Table 2.
GAs correspond to the evolutionary methods that are used to solve search and optimization problems.16–18 These methods are based on the genetic process carried out by living beings in which generations of a population in nature evolve according to the principles of natural selection and survival of the strongest, as postulated by Charles Darwin. Using an imitation of this process, the GA is able to develop solutions for the real world. The power of GA relies on the fact it is a robust technique that is able to successfully address a wide variety of problems from different areas, including those in which the other methods encounter difficulties. The process begins by randomly generating a group of solutions to the problem. Each solution is codified in such a way that each solution represents a point in the domain of the problem to be solved. Transformation of the individuals occurs through a series of genetic operators. Individuals who participate in the modification via the genetic operators are previously chosen. By applying such operators to the selected solution groups, it is possible to obtain new specimens that inherit the features of their predecessors. To use an algorithm in the solution of an optimization problem, it is necessary to determine a codification method for the possible solutions that the GA will tackle. Thus, three basic types of representations may be considered: real, whole, and binary.
The specific representation scheme was implemented for the initialization, mutation, and intersection processes. The optimization processes were carried out using a cluster involving five interconnected computers in which all distinct characteristics of the GA are maintained by default, except for the population size and initial population, which have the following minimum, maximum, and variation values (Table 6).
Summary of values allowing the modification of different runs of the genetic algorithm.

The optimization values correspond to the average of the results in each run according to the specific segment and optimized characteristics, and these values are approximated to the 100th place. The values of the optimum values of each parameter controlled in the welding process are provided in the same manner and are approximated to a significant value. Table 7 shows the results of the optimization with the codified controlled parameters that may be transformed into the values used in the process according to Table 2.
Optimization process results.

Results’ validation
The developed models were used to estimate the bead characteristics by replacing the respective values of the process parameters. Each optimized characteristic was tested three times to obtain an average of the observed value (AOV) corresponding to the three segments. The percentage error of the prediction model was obtained via the percentage difference between the AOV and predicted value (PV) relative to the experimental value, as shown in equation (5)

The results for each test are shown in Table 8 in which the measurement average for each characteristic is presented together with their PV and error percentage.
Summary of results for the test and error percentages shown by the second-order rotational model for each segment.

None of the PVs exceeds 6% error, except for the error in the area in the third segment, which reaches 10.37%. These results can be considered satisfactory in a recovery process because the welding bead would cover a larger space at the base metal.
The low error percentages show that the resulting functions properly represent the properties of the welding beads, which is crucial to achieving an adequate optimization process. In addition, the low error percentage in the prediction process shows that the modifications performed on the initial population and population size characteristics of the GA successfully achieved the goal of finding the global optimum of the function.
Effect of the different variables present in the welding process
The developed models were implemented and used to predict the bead characteristics. The influence of the operational parameters was predicted by substituting the respective values of the process parameters.
Effect of voltage on the properties of the welding bead
A voltage increase causes an increase in the height in the segments that form the curved specimen, and this becomes evident due to the effect produced by the curve slope among the segments. Due to gravity, the filler material in the liquid state tends to spill, thus producing a concentration of the liquid in the center of the welding bead, which increases the height and causes self-adjustment as the base metal solidifies.
According to the prediction model, the width of the beads will increase as the voltage increases in segment No. 1 because the curve slope is less sharp, thus avoiding spillage of the filler material. In segment No. 2, however, the curve displays an increase in width up to a point after which it begins to decrease. This effect is caused by the voltage increase, which transforms the filler material into a liquid; the spillage of this material induces bead width reduction and promotes increased height as the material concentrates in the center of the bead. Finally, the curve tends toward reduction in segment No. 3 due to the phenomenon described above.
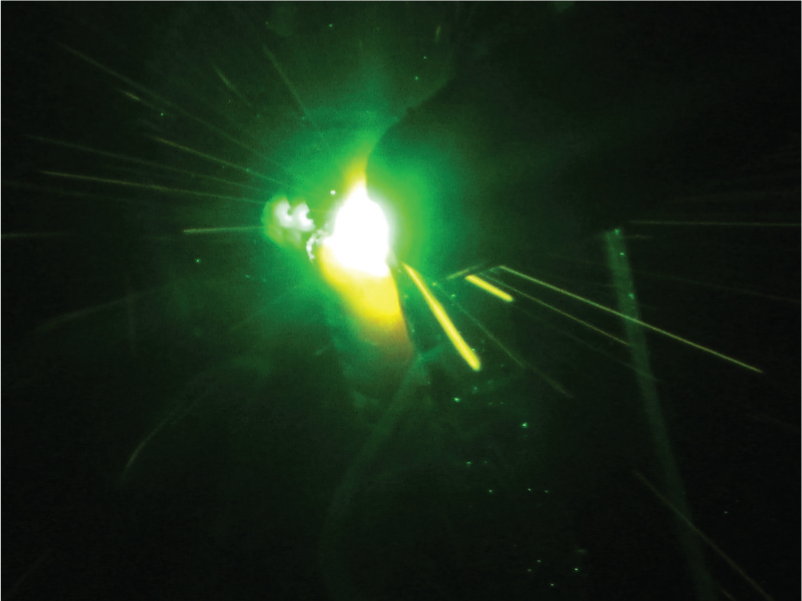
The area in the first two segments performs similarly, as voltage reaches a maximum that subsequently decreases. This is so because in each segment there is a voltage limit where the maximum area is reached; if it is exceeded, however, the filler material spills because of the slope effect, thus reducing the bead area and mainly increasing height. On the other hand, the curve increases in segment No. 3, which increases the area associated with the bead height. When a low voltage is used an unsuitable penetration is produced, see Figure 5.

Test No. 2 corresponding to the curved specimen area. A low penetration is observed in segment No. 3 at the welding bead: (a) segment No. 1, (b) segment No. 2, and (c) segment No. 3.
The dilution curves for the welding beads behave similar to those in the first two segments, increasing to a point at which the voltage produces an equilibrium between the area covered by penetration and height. The curve subsequently decreases due to the spillage provoked by the excess voltage in the curved specimen. The curve is observed to decrease in segment No. 3 because low voltage is applied in this segment, leading to low penetration that produces an associated area much lower in height compared with that of a low dilution. Figure 6 shows the graphs for each segment.

Effect of voltage on the different properties controlled during the optimization process in each segment: (a) segment No. 1, (b) segment No. 2, and (c) segment No. 3.
Effect of welding speed on the welding bead properties
As the welding speed varies, the bead heights in segments No. 1 and No. 2 decrease, reaching the optimum condition at the lower limit of the parameter for both cases. This result occurs because the increase in the welding speed causes the robot to move faster during the programmed trajectory, thus producing a lower material deposit in the bead. In addition, the behavior of the height in segment No. 3 remains practically constant as a result of the effect of gravity on the material. The slope of this segment is far steeper than that of the previous two segments, thus causing adjustment in the base metal.
The bead width and area behave similar to the height parameter when the welding speed is modified and are affected by the same phenomena as the corresponding segments. Figure 7 shows the behavior of the described characteristics.

Effect of high welding speed on beads. A lack of deposition of the filler material can be observed.
Penetration is lost because this parameter increases in the first segment; as the robot moves the concentration of energy to the different points of the curved specimen, the short circuit decreases, thus affecting penetration. Regarding penetration in segment No. 2, this property tends to increase slowly at the beginning of the segment and then decreases in the same manner that those observed in segment No. 1.
In the last segment, however, penetration increases as the parameter increases. This effect is promoted by the action of the curved specimen slope because it allows removal of the caloric energy generated by the welding process, and the filler material deposited above solidifies. Therefore, a higher temperature is maintained for a longer time at each bead segment, thus facilitating the mixture of the base and filler metals and increasing penetration.
The curve describing the dilution behaves similarly to that of the first and third segments’ penetration curves and is affected by the same phenomena. However, segment No. 2 of the curve behaves parabolically, increasing dilution up to the central point and decreasing with the subsequent increase in the welding speed. Segment No. 3 shows the same situation, but the optimum speed does not reach the upper limit of the parameter. Figure 8 shows the curves that describe the behavior of the measured characteristics.

Effect of welding speed on the different properties controlled during the optimization process in each segment: (a) segment No. 1, (b) segment No. 2, and (c) segment No. 3.
An excessive welding speed leads to a filler material deposition deficiency at the base metal, which causes deficient welding beads, as shown in Figure 7. Figure 8 shows the graphs that describe the performance of the welding bead properties with the variation in the welding speed.
Effect of the swinging length on the properties of the welding bead
The height parameter behaved similarly in all segments; however, a small decrease in this property is observed with the increase in the controlled parameter because as the swinging length increases, the filler material in the liquid state is pushed by the action of the electrode at a longer distance. This situation allows the filler material to accumulate more homogeneously in the curve described by the base metal due to the run-off caused by gravity.
The width behaves in an increasing manner in the first and third segments because as the swinging length is increased, the deposited material accumulates due to the pressure applied by the electrode on the liquid state material. This situation is quite favorable for segment No. 3 in which a higher run-off is observed as a consequence of the slope. The second segment shows a tendency toward decrease, as observed in the optimum of the parameter at the lower limit, likely producing the settling of the filler material through the electrode and support of run-off.
The penetration curve in the first segment behaves accordingly with the increase in the parameter because it exhibits a greater movement near the points that form the curve, and these become more significantly affected by the temperature released during the process, which allows better combination of the filler and base material, thus achieving a suitable penetration. Segment No. 2 behaves parabolically, reaching the optimum at a length of 2.5 mm, where it is affected by the run-off of the material cast in the curve, which increases the temperature of the segment and increases penetration when it spills on the solidifying material. If the length exceeds the optimum, excessive spillage will occur, which results in poor quality of the welding beads. Finally, the third segment describes a decreasing curve in which the same phenomenon shown in segment No. 2 is observed such that the optimum value is even lower than the highest slope present in the segment curve. The run-off of the filler material is shown in Figure 9.
Test No. 1 of penetration in which run-off of the filler material is observed in the third segment of the curved specimens.
The area in segment No. 1 shows increasing behavior because the increase in the parameter causes a series of spots that form the curve to be disrupted by the welding process via a short circuit that increases the temperature and favors the area involved in the penetration. The curve corresponding to segment No. 2, in turn, gradually decreases as does the curve from segment No. 3, and both segments are affected by the same phenomenon observed in the second segment of the penetration as a result of the run-off.
The dilution curve increases in the two first segments with the increase in the parameter as a result of the temperature generated by the short circuit in the diverse spots affected by the swinging length. Furthermore, the dilution benefits from the pressure exerted by the electrode on the material in the liquid state, allowing a better combination of the base and filler metals. The curve described by the third segment behaves in a decreasing manner, reaching the optimum near the lower limit of the parameter and promoting the spillage of the filler material that increases the temperature on the material under solidification and the pressure generated by the electrode on the liquid material by its short swinging length to achieve a proper combination of the base and filler materials in the slope of the third segment. The graphs describing the behavior of the properties of the welding bead with the variation in the swinging length are shown in Figure 10.

Effect of the swinging length on the different properties controlled in the optimization process in each segment: (a) segment No. 1, (b) segment No. 2, and (c) segment No. 3.
Effect of the wire effect on the properties of the welding bead
The behavior of the curve that describes the height of the two first segments decreases with the increase in the wire output speed. In turn, the curve slightly increases and subsequently decreases in segment No. 3 because as the parameter increases, more short circuits are produced in a given time. This behavior causes a great increase in the temperature in the welding process, which causes such a great amount of filler material to become liquified that it spills in excess, thus increasing the width and not the height of the bead (Figure 11). The spillage of the material occurs toward the center of the bead in the third segment, and the material settles by itself because the slope is greater, which allows an increase the property, unlike the two first segments.

First segment of test No. 8 of the design matrix; an excess of material spillage is observed. The red ovals show a lack of adherence of the filler material at the edges of the welding bead.
In the first segment, the width is represented by an increasing curve (Figure 13), which reaches a point at which it begins to slowly decrease, where the increase in the wire speed causes the width to grow. This growth of the width results from the higher quantity of short circuits produced, causing the filler material to become more liquid and to consequently run-off. Additionally, an increase in the filler material is present and is attached to the wire. In the second and third segments, the curves tend to decrease as the wire speed increases because the increase in the bead height is generated by the excess of short circuits caused by the spillage of the filler material concentrated in the center of the bead. However, the increase in the parameter causes a deficient appearance of the beads, which shows scours in the edges caused by the excess of energy produced by a larger quantity of short circuits at a given time.
The penetration curves decrease for the three segments with higher wire speeds, except for segment No. 1, which reaches a point at which it begins to increase. The optima in each case are found in the lower limit of each segment because short circuits do not occur consecutively at a lower speed, allowing the electrode to penetrate the base metal in the liquid state to achieve better penetration.
The area in the first two segments behaves in an increasing manner because as the parameter increases, an additional quantity of filler material settles and concentrates in the area of the bead height. In contrast, the curve in the third segment decreases to reach the optimum in the lower limit, causing the same phenomenon as that observed in the penetration with the spillage of the base metal by the effect of slope.
The dilution curve behaves in a decreasing manner in the first segment, whereas in the second, it decreases until it remains nearly constant, with both segments achieving the optimum in the lower limit of each segment corresponding to a speed of 4 m/min because a greater area associated with penetration can be obtained at a lower speed, thus increasing dilution. In turn, the third segment behaves as a parabola, reaching the optimum value at the upper limit, which produces a higher quantity of short circuits that increase temperature, thus causing spillage of the filler and base materials that allow their proper mixture. Subsequently, no excessive spillages are observed, although small scours are observed at the edge of the welding beads, as shown in Figure 12. Figure 13 shows the graphs that describe the behavior of the properties of the welding bead with the variation in the wire speed.

Segment No. 3 of the third dilution test; the red oval shows the scour.

Effect of the wire speed on the different properties controlled in the optimization process in each segment: (a) segment No. 1, (b) segment No. 2, and (c) segment No. 3.
Effect of the gas flow rate in the properties of the welding bead
The curve describing the behavior of the height in the first segment in Figure 15 is decreasing, whereas segments two and three behave in an increasing manner due to the pressure exerted by gas in the welding bead; when it is increased, it produces a dispersion of the filler material toward the edges of the bead because segment No. 1 remains unaffected by a large slope. However, in the other segment, the increase in the gas flow rate causes a greater pressure on the material in a liquid state, causing it to spill easily by the effect of gravity on the slope involved in these segments and to settle in the center of the welding bead, thus achieving a greater height.
The width in the first segment behaves in an increasing manner with the increase in the gas flow rate because it exerts a greater pressure on the liquid state material, thus facilitating its dispersion toward the edges of the bead. In the second segment, the width is reduced with the increase in the gas flow rate, and the opposite occurs for the third segment, where both segments show how the material easily settles at the edges because of the pressure exerted by the gas and the run-off caused by the slope in the filler material (Figure 14).

First segment of tests No. 25 and No. 26 of the design matrix, which were treated with a caudal of protector gas equal to 16 and 20 L/min, respectively. No significant variations can be observed in the penetration of the welding bead: (a) test No. 25 and (a) test No. 26.
The curve representing the bead areas increases in the first segment due to the pressure exerted by the protector gas on the welding bead, thus favoring the width that allows an increase in the bead area; meanwhile, the curve describing the parameter in segments No. 2 and No. 3 behaves in a decreasing manner at the beginning and subsequently increases to reach the optimum in the lower and upper limits, respectively. In both the cases, the pressure exerted by gas and the spillage produced by the slopes allows settling of the filler material to make the most out of the area associated with the bead height.
Penetration and dilution are the properties that are not visually affected by the gas caudal (Figure 14); however, each of these properties has an optimum for each segment, which is described by the curve corresponding to the graphs shown in Figure 15. The penetration in the first and third segments decreases, whereas in the second, it behaves increasingly. The dilution, in contrast, decreases in the first segment and decreases in the other two. In contrast, Figure 16 shows selected examples of welding beads before and after the optimization process.

Effect of the gas flow rate in the different properties controlled in the optimization process in each segment: (a) segment No. 1, (b) segment No. 2, and (c) segment No. 3.

Examples of welding beads: (a) before optimization and (b) optimized.
Conclusion
An operational optimization of a welding process using GAs is presented. The welding curves of the specimens correspond to the profile of a blade-shaped Pelton turbine. A series of mathematical models were developed that correlate the controllable welding parameters with the main bead characteristics. After the optimization process was completed, the results were used to verify whether the obtained objective functions properly describe the characteristics of the weld. The second-order rotational model suggested by Cochran and Cox 25 represents a good tool for obtaining the equations that describe the behavior of the properties of the welding beads.
The main conclusions of the optimization process are the following: the increase in the voltage in the process tends to flatten the welding bead in the low-slope zones, thus increasing the width; zones with more inclined slopes behave in the opposite manner; and the welding heights are increased by run-off. An excessively high voltage can cause porosity, sprinkling, and erosion depending on the inclination in the process. As the welding speed increases, the quantity of thermal energy via the welding length transferred from the arc to the base metal decreases because the arc acts directly on the base metal. In addition, there is a tendency to produce erosion along the edges of the welding bead because there is insufficient filler metal deposition to fill the trajectory cast by the arc. The increase in swinging length allows a reduction in the excessive run-off of the filler material in the liquid state in the areas that present a significant inclination due to the pressure caused by the electrode on the cast metal, which causes the settling of the material in the base metal and promotes the geometry of the welding bead under these conditions. Furthermore, the parameter permits improvement of the penetration and dilution percentage of the beads because movement creates better combination of the base and filler materials in which the optimum value of the swinging length would depend on inclination. An excessive increase in wire speed causes an excess of the filler material, which does not adhere properly to the base metal at the edges of the bead, and an increase in the temperature due to a greater quantity of short circuits is produced in the same time period. Additionally, when suitable regulation of the parameter is obtained, it is possible to improve the penetration in those areas where inclinations are observed because the electrode does not directly touch the casted metal drop because of the gravity effect. The gas flow rate has a positive effect on the bead geometry because the pressure it exerts allows combination with the distribution of the material in the liquid state in the welding bead. All welding performed vertically or in a position involving inclination must be welded from the lower to the upper segment to significantly reduce the filler material run-off in the process because the robot arm does not have the ability of an operator to rework the welding bead to avoid this phenomenon.
In summary, the results of the performed experiments showed that the developed optimization models are able to predict the bead characteristics with high accuracy. This work confirms that both main and interaction effects of the process variables play an important role in determining the bead characteristics and the effect of interaction between the process parameters cannot be neglected. Finally, this work shows the feasibility of application of the GA and the success of the applied methodology in optimizing the weld bead geometry. This observation is confirmed with the optimization of the different functions because errors of less than 6% are found after comparing the welding tests carried out with the optimized parameters and the values given by the GA of each function describing the different properties.
Footnotes
Academic Editor: Yangmin Li
Declaration of conflicting interests
The author(s) declared no potential conflicts of interest with respect to the research, authorship, and/or publication of this article.
Funding
The author(s) disclosed receipt of the following financial support for the research, authorship, and/or publication of this article: L.P.P. acknowledges the financial support from the Chilean Agency CONICYT (FONDECYT project 1140583).