
Abstract
Background:
The energy efficiency of electric storage water heaters is a concern for enterprises and customers because it is beneficial for energy saving. To decrease the workload of testing personnel and improve the testing efficiency, an automatic testing system for evaluating the energy efficiency performance of electric storage water heaters has been designed.
Methods:
The complete testing system includes a water supply subsystem, hot water outlet subsystem, hardware subsystem, and software subsystem. An application program was developed using Visual Basic to acquire the sensor data and transmit it in real time to a database server. The energy efficiency evaluating process was controlled by the application software,by combining the data acquisition technology, communication technology, and program logical control technology.
Results:
The designed system can run automatically and achieve reliable tests, two important parameters including the standing loss per 24 h and the hot water withdrawal rate were obtained.
Conclusion:
This system can be applied to evaluate the energy efficiency grades of electric storage water heaters.
Keywords
Introduction
An electric storage water heater (ESWH) is an appliance that generates hot water in a thermally insulated container where the water temperature can be automatically controlled. 1 Generally, ESWHs can be classified into two types according to their installation method: horizontally mounted or vertically mounted. They can also be classified into single-tank ESWHs and dual-tank ESWHs. In recent years, the number of ESWHs has continuously increased for household purposes in China, and the same is true worldwide.2,3 It is estimated that 15%–20% of the total residential electric energy consumption for an average family in China is used for water heating. The consumption of electrical energy for domestic ESWHs is a concern for the government and customers.
In Europe, IEC 60379:1987 is the standard for testing ESWH energy consumption. 4 In China, GB 21519-2008 is used as the compulsory standard for evaluating ESWH energy efficiency grades; it originated from IEC 60379:1987. 5 According to GB 21519-2008, ESWHs are classified into five energy efficiency grades. Grade 1, the most efficient, means the coefficient of standing loss per 24 h is smaller than 0.6, and the hot water outlet rate is greater than 70%. The energy efficiency grade of an ESWH should be evaluated before it enters the market.
Traditional testing systems only collect the temperature data during the testing period. Testing engineers are needed to manually analyze the testing data and generate the testing report. 6 A highly automated, highly reliable, and highly efficient ESWH energy efficiency testing system is lacking.
To the best of the author’s knowledge, no automatic testing systems for the acquisition, analysis, and management of ESWH energy efficiency data are found in the available literature. The GB21519-2008 standard shows the measurement methods and steps for evaluating the energy efficiency of ESWHs. However, collecting and storing the large volume of sensor data and controlling the measuring process are still challenging.
The object of this study is to design and implement a highly automated testing system for evaluating the energy efficiency of ESWHs. A Visual Basic program not only provides a good user interface (UI) but also has a strong communication function using the computer serial port to conveniently realize the measurement and control. 7 In this work, by combining Microsoft SQL Server 2008, Microsoft Excel 2013, and communication technology in a testing software platform based on Visual Basic 6.0, we propose a novel testing system for evaluating the energy efficiency of water heaters. The testing platform is highly automated, highly efficient, and highly reliable.
The rest of this article is organized as follows. In section “Mathematical model,” the mathematical models for evaluating the energy efficiency of ESWHs are given. Section “Testing system description” describes the testing system. Section “Experimental results and discussion” provides and discusses the experimental results. Finally, Section “Conclusion” concludes the article and provides an outlook to future work.
Mathematical model
Energy efficiency grades
As shown in Table 1, the energy efficiency grade depends on two parameters, the standing loss coefficient per 24 h (ε) and the hot water outlet rate (μ). The customer prefers to choose the ESWH with energy efficiency grade 1 because the ESWH can output more hot water and consume less electrical energy. Figure 1 reveals the relationship between the temperature and the time when determining the above two parameters. The concepts of standing loss per 24 h and hot water outlet rate are discussed in detail in the following sections.
ESWH energy efficiency grades.
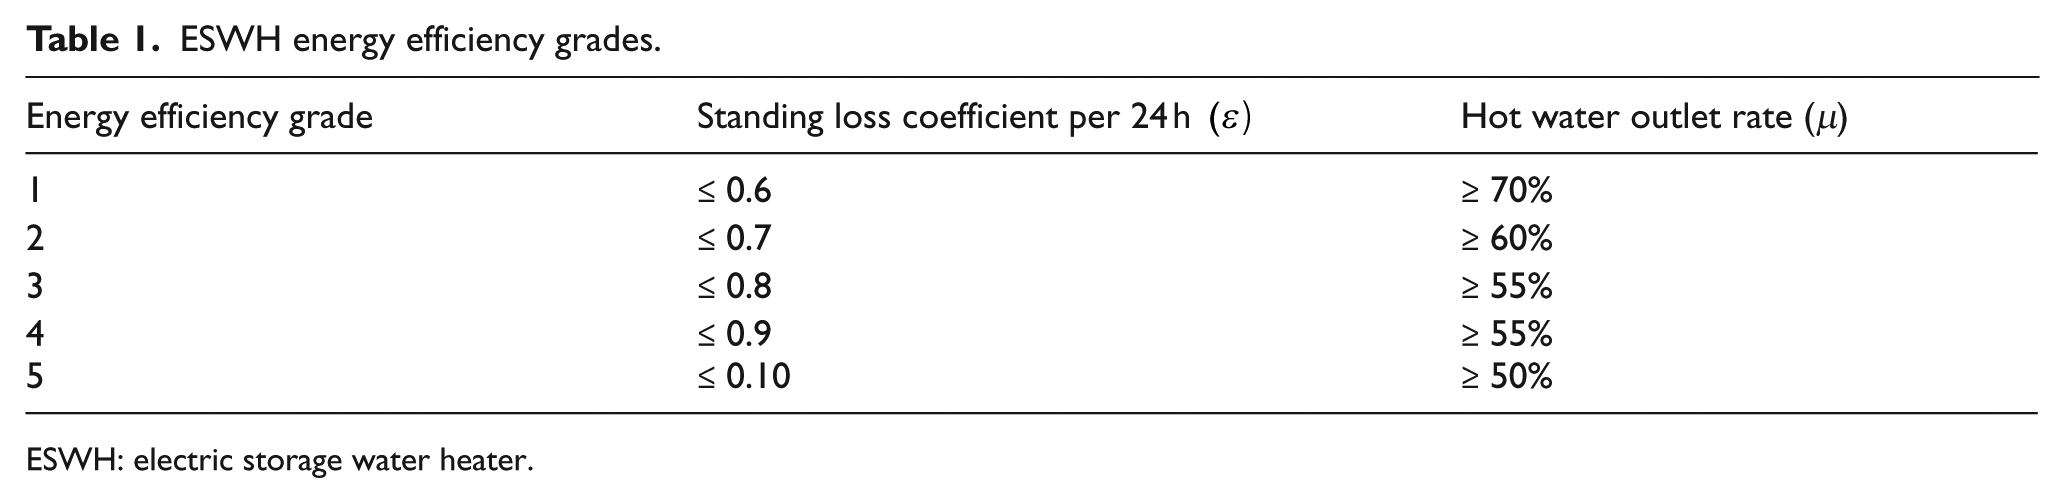
ESWH: electric storage water heater.
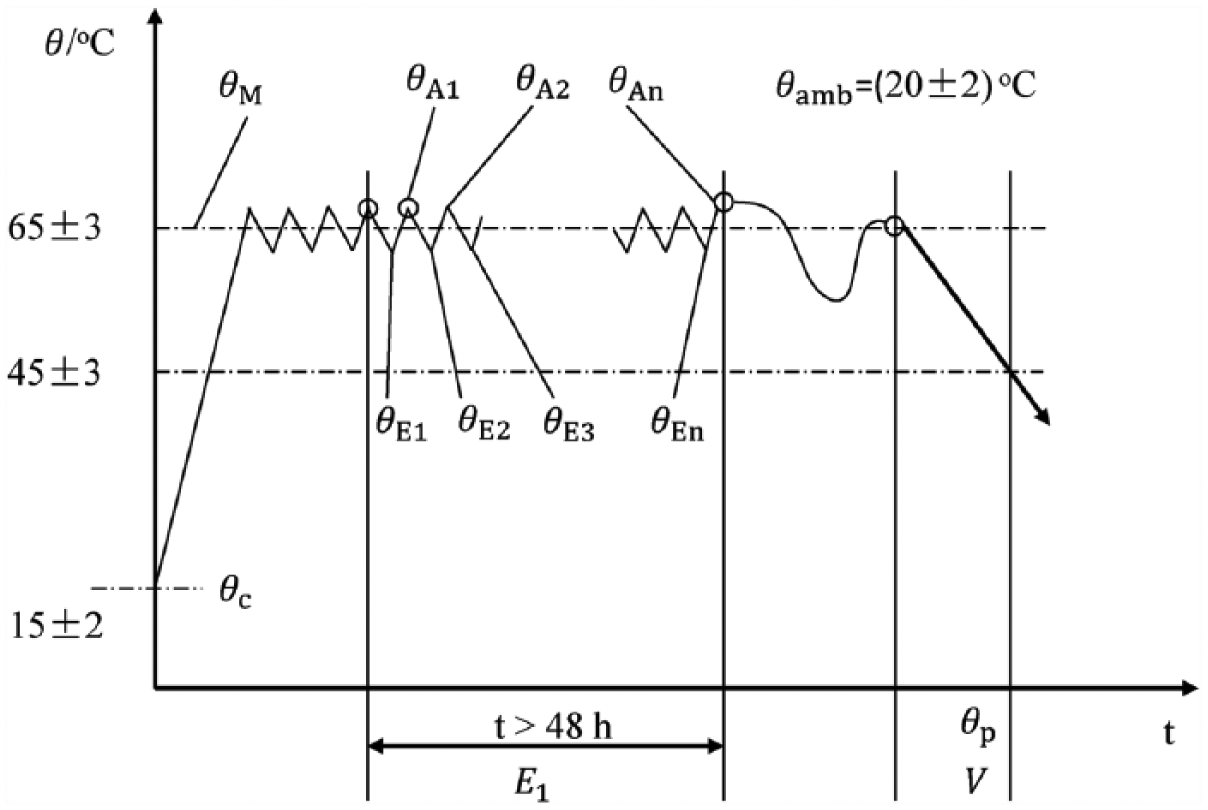
Relationship between the temperature and time during the testing process.
Coefficient of standing loss per 24 h
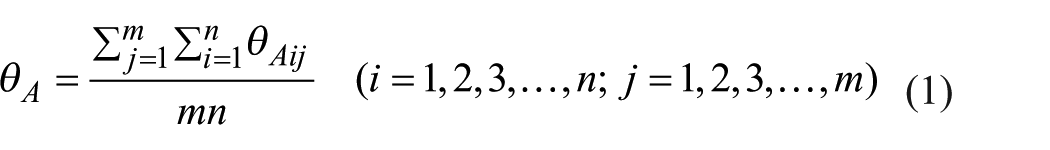
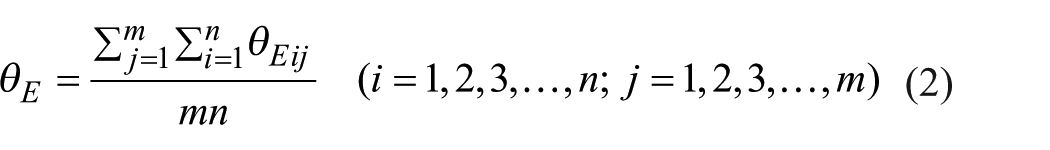
The mean water temperature with no water withdrawn is found by averaging the values from n thermocouple positions (n = 5 for a single tank). In Figure 2, the five red Xs represent the positions of the thermocouples, namely, T1, T2, T3, T4, and T5. The distribution of the five thermocouples was aimed to measure the hot water in the ESWH more correctly.
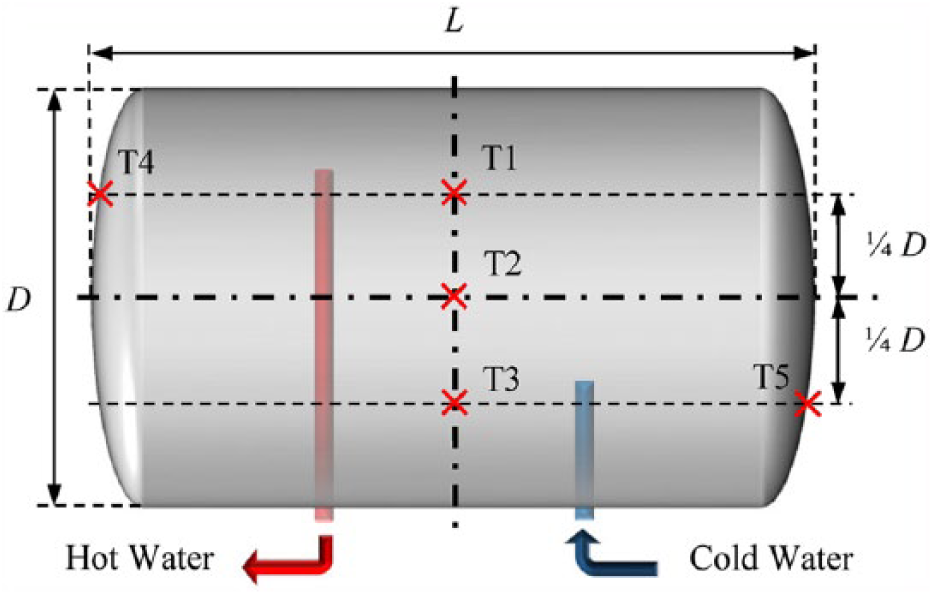
Positions of the five temperature testing points.
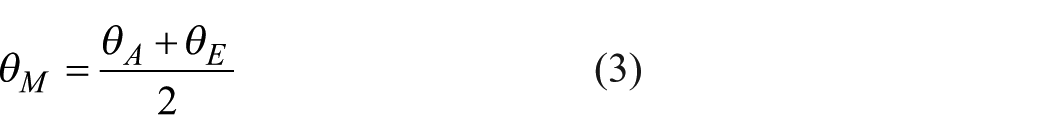
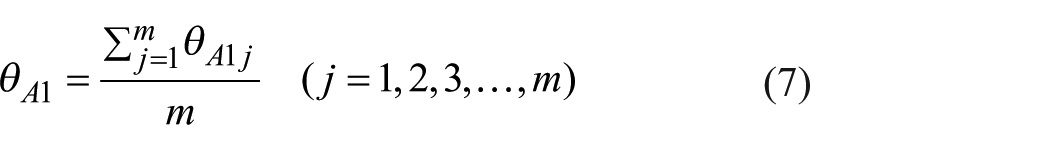
During the test, the mean water temperature
where
where
The energy consumption per 24 h (E) is calculated by Equation (4)
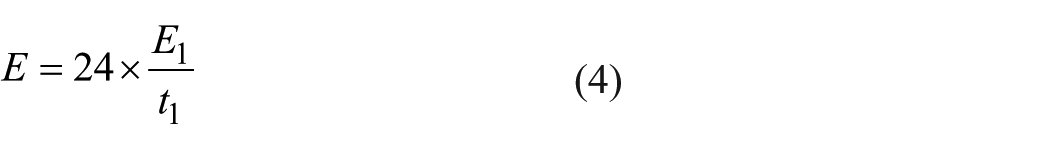
where
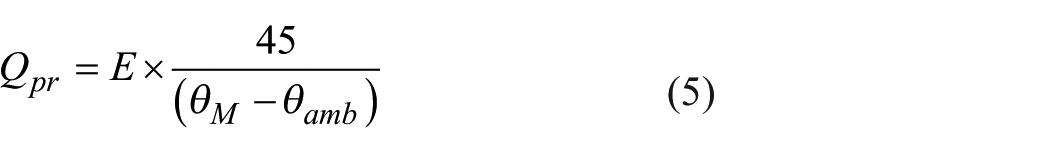
where
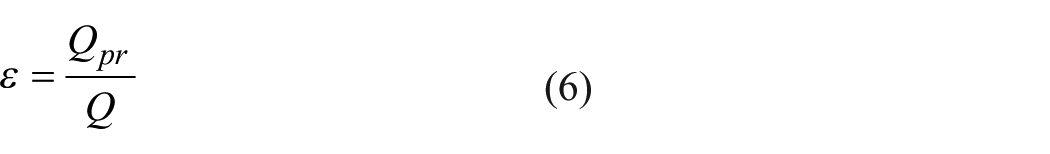
where Q is the standing loss reference value per 24 h; it can be looked up in the standard.
Hot water outlet rate
The hot water outlet rate was measured after finishing the standing loss per 24-h measurement. The water heater switches off once the thermostat cuts out.
where
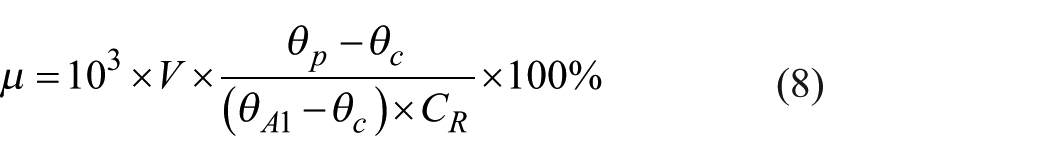
where V is the hot water outlet volume,
Testing system description
Testing conditions
The ESWH energy efficiency measurements should be carried out in the following conditions:
The air speed surrounding the heater in the testing room should not be greater than 0.25 m/s;
The ambient temperature should be kept at (20°C ± 2°C);
The relative humidity should not exceed 85%;
The water heater should work at the specified power; the actual power should not deviate more than ±5% from the rated power;
The inlet water temperature should remain at (15°C ± 2°C);
The water heater should work as in a normal installation; for open-outlet ESWHs, the inlet valve should be closed; for unvented ESWHs, the internal pressure should be kept at 0.28 MPa;
The ESWH thermostat should be adjusted such that the mean water temperature
For the testing system, the accuracy and precision of the measurement instruments should be ensured. The accuracy of electric measurement instruments cannot be lower than ±0.5%; the accuracy of temperature measurement instruments should be within 0.5 K; the accuracy of time measurement instruments should be ±1 s/h; the accuracy of humidity measurement instruments should be ±1%; and the precision of energy measurement instruments should be 0.01 kWh.
System configuration
The system configuration is shown in Figure 3. The complete testing system includes the water supply subsystem, the hot water outlet subsystem, the hardware subsystem, and the software subsystem. The water supply subsystem contains the chiller, solenoid valve, flow meter, pressure meter, and thermocouple, which can provide the water heater with supply water at a given pressure and temperature. The hot water outlet subsystem includes a solenoid valve, a K-type thermocouple, and the hot water storage tank. The thermocouple measures the temperature of the hot water outlet, and the solenoid valve controls the water withdrawal. The hardware subsystem is responsible for data acquisition and device control. The software subsystem is responsible for data monitoring, data storage, and report generation.
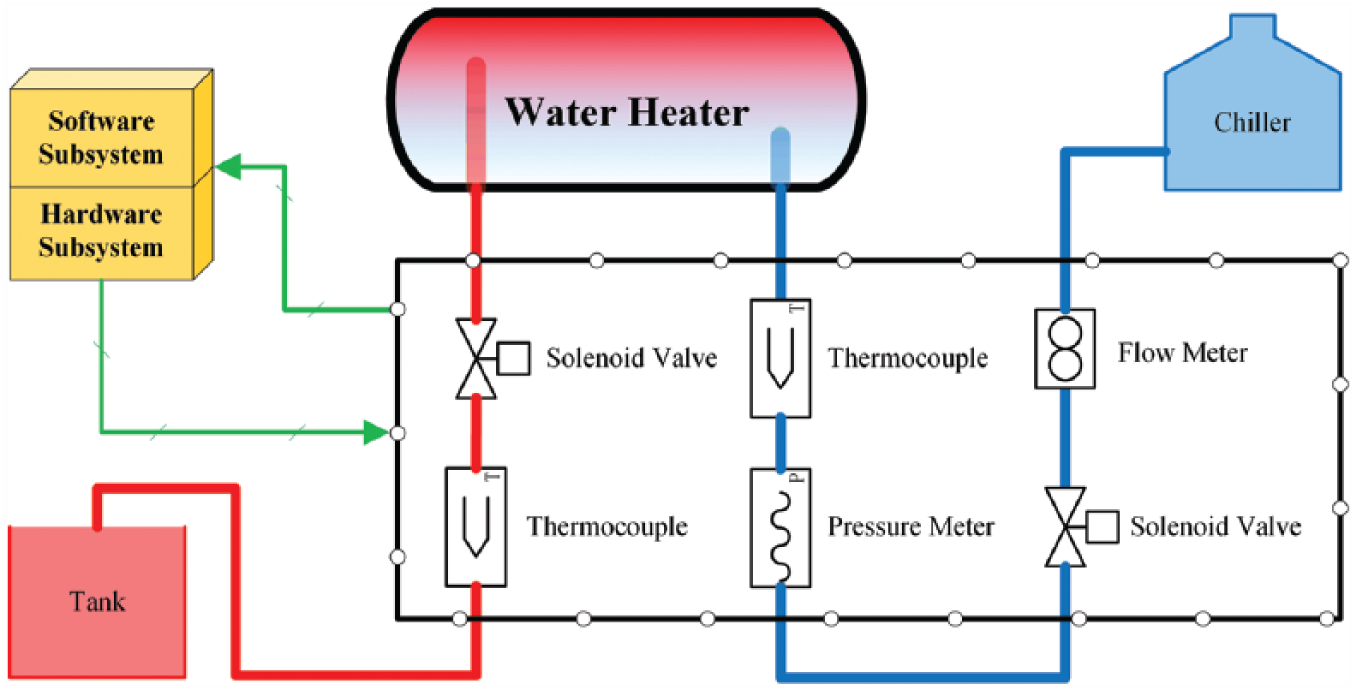
System configuration.
Hardware subsystem
The hardware subsystem is divided into two levels, namely, the control level and the device level (Figure 4). Different types of communication technology are applied among the hardware (Figure 5). For the control level, the industrial personal computer (IPC; IPC-610-L; Advantech Technology Co., Ltd., Suzhou, China) communicates with the programmable logic controller (PLC; CP1H-X40DR-A; Omron Industrial Automation Co., Ltd., Tokyo, Japan) through the RS-232 serial port. 8 The upper computer IPC, which runs the Visual Basic program, communicates with the data acquisition unit and the digital power meter through the TCP/IP Modbus Protocol on a 100-Mbps Ethernet network. 9

Hardware subsystem.
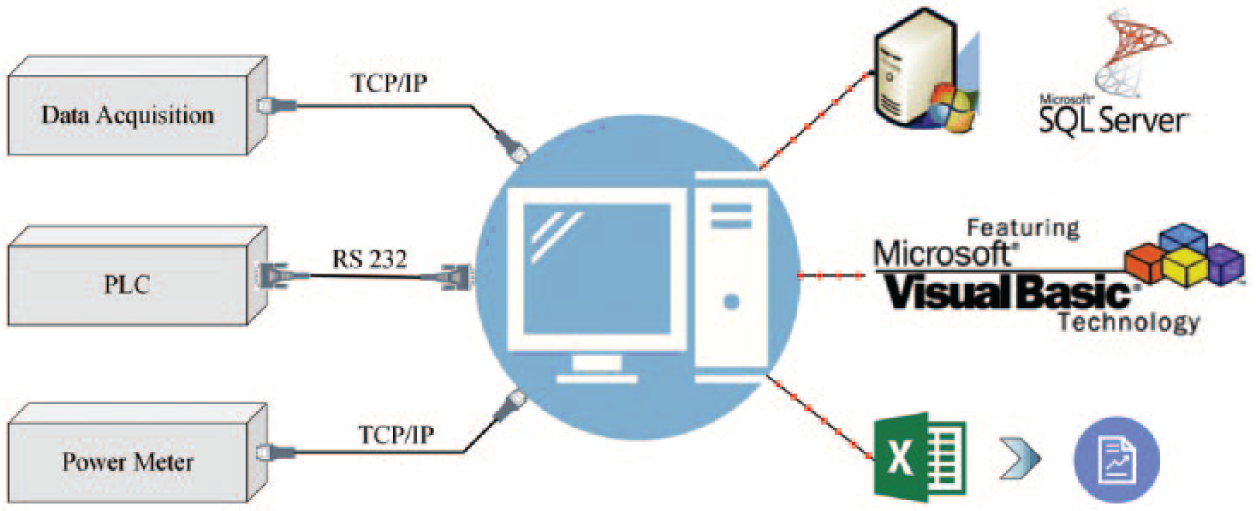
Communication methods among the hardware.
The PLC can control the alternating current (AC) contactor and the solenoid valve through its I/O modules. At the device level, the signals, including the temperatures, pressure, and flow rate, are recorded by the data acquisition unit. The power consumption is measured by the digital power meter. The AC contactor is responsible for the water heater power supply.
Temperature measurement
To acquire temperature data, a multi-channel data acquisition unit (34972A; Keysight Technologies Co., Englewood, CO, USA) was connected with 20 K-type thermocouples. For the single-tank ESWH, seven channels’ temperatures were collected, including five temperature points on the surface of the tank, the inlet water temperature, and the outlet water temperature. The ambient temperature and relative humidity were measured by a multi-functional temperature and humidity display (AS109; Aosong Electronics Co., Ltd., Shenzhen, China).
Power consumption measurement
A digital power meter (WT310E; Yokogawa Co., Tokyo, Japan) was used to measure the voltage, current, power, power factor, energy consumption, and time duration during the tests. Prior to the test, the digital power meter function should be set to measure the energy consumption and time.
Hot water outlet volume
The hot water output flow rate was adjusted to a specified value, according to the standard requirement. The discharging volume of the hot water was measured by an electromagnetic flow meter (LD-15/F; Yuyao Yinhuan Traffic Instrument Co., Ltd., Zhejiang, China).
Control of hot water withdrawal
During the hot water withdrawal test, the solenoid valve installed in the hot water outlet port should be controlled. When the heater works at a stable status, the solenoid valve receives the “on” signal from the PLC and the solenoid valve is switched to the open status. While the temperature difference between the hot water in the outlet and the maximum outlet temperature valve is equal to 20°C, the valve is switched to the closed status, according to the “off” signal from the PLC.
Software subsystem
The software platform was programmed using Visual Basic 6.0. The software was operated with Microsoft SQL Server 2008 and Microsoft Excel 2013. All collected data were stored in the SQL Server database (DB). The Visual Basic program requests the data from SQL Server to generate the test reports with Microsoft Excel.
Software workflow
Figures 6 and 7 show the flow charts for measuring the standing loss per 24 h and the hot water outlet rate, respectively. Before the standing loss per 24-h test, the thermocouples should be fixed on the surface of the water heater, in accordance with the standard requirements. In addition, the digital power meter should be set up to measure the energy consumption. When the preparation work is finished, the software sends a “Start test” signal. The cold water valve is opened and water pours into the ESWH chamber. When the standing loss per 24-h test is finished, the hot water outlet rate test should be conducted. Before the hot water outlet rate is measured, the ESWH should run in a stable state. In Figure 6, the “IR” variable represents the real-time ESWH current value, and “IT” represents the final current value ordered by time in the current table.
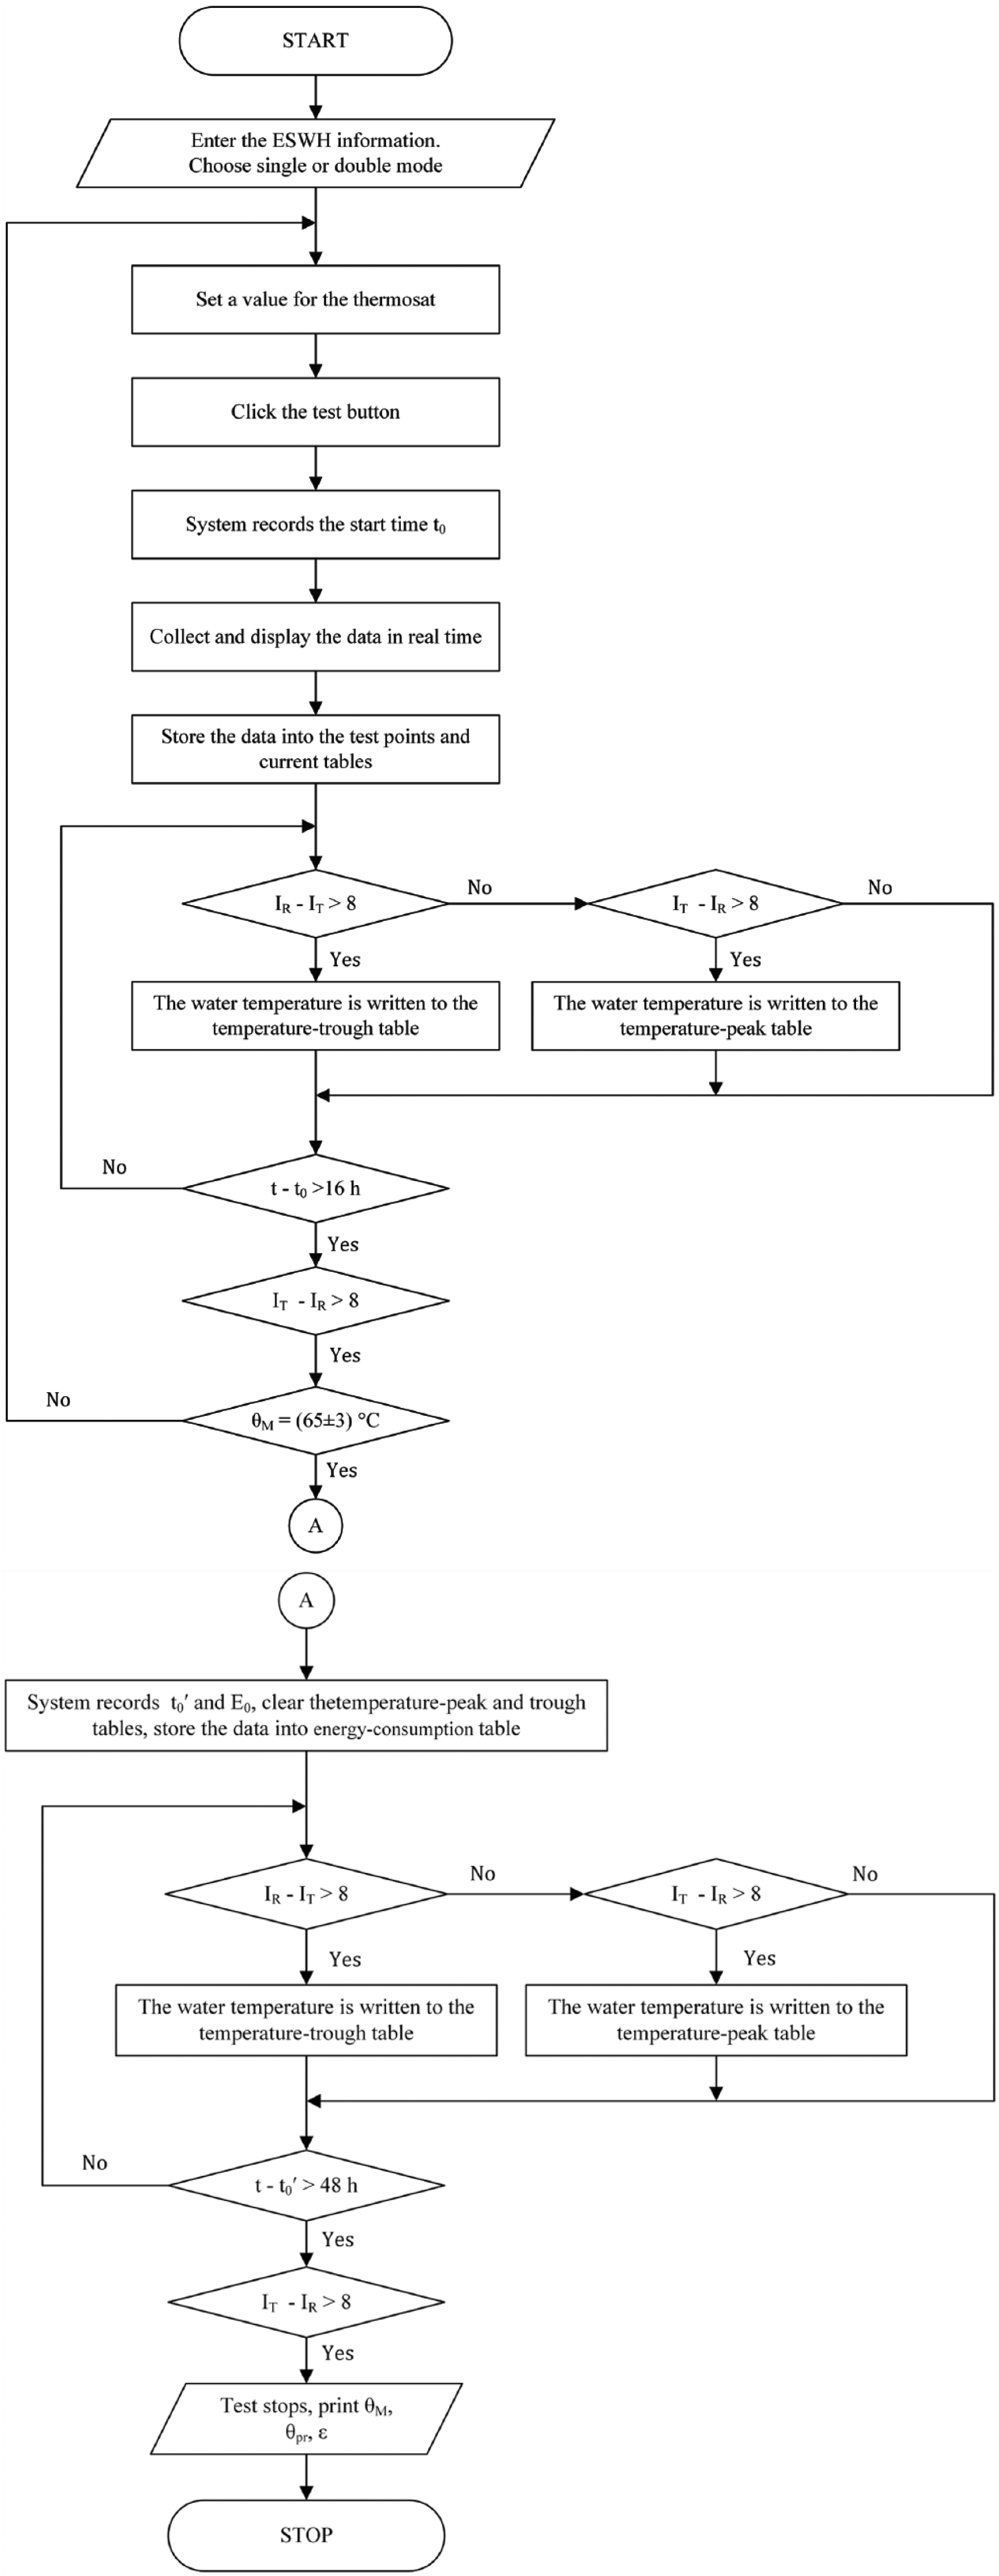
Flow chart for standing loss per 24 h.
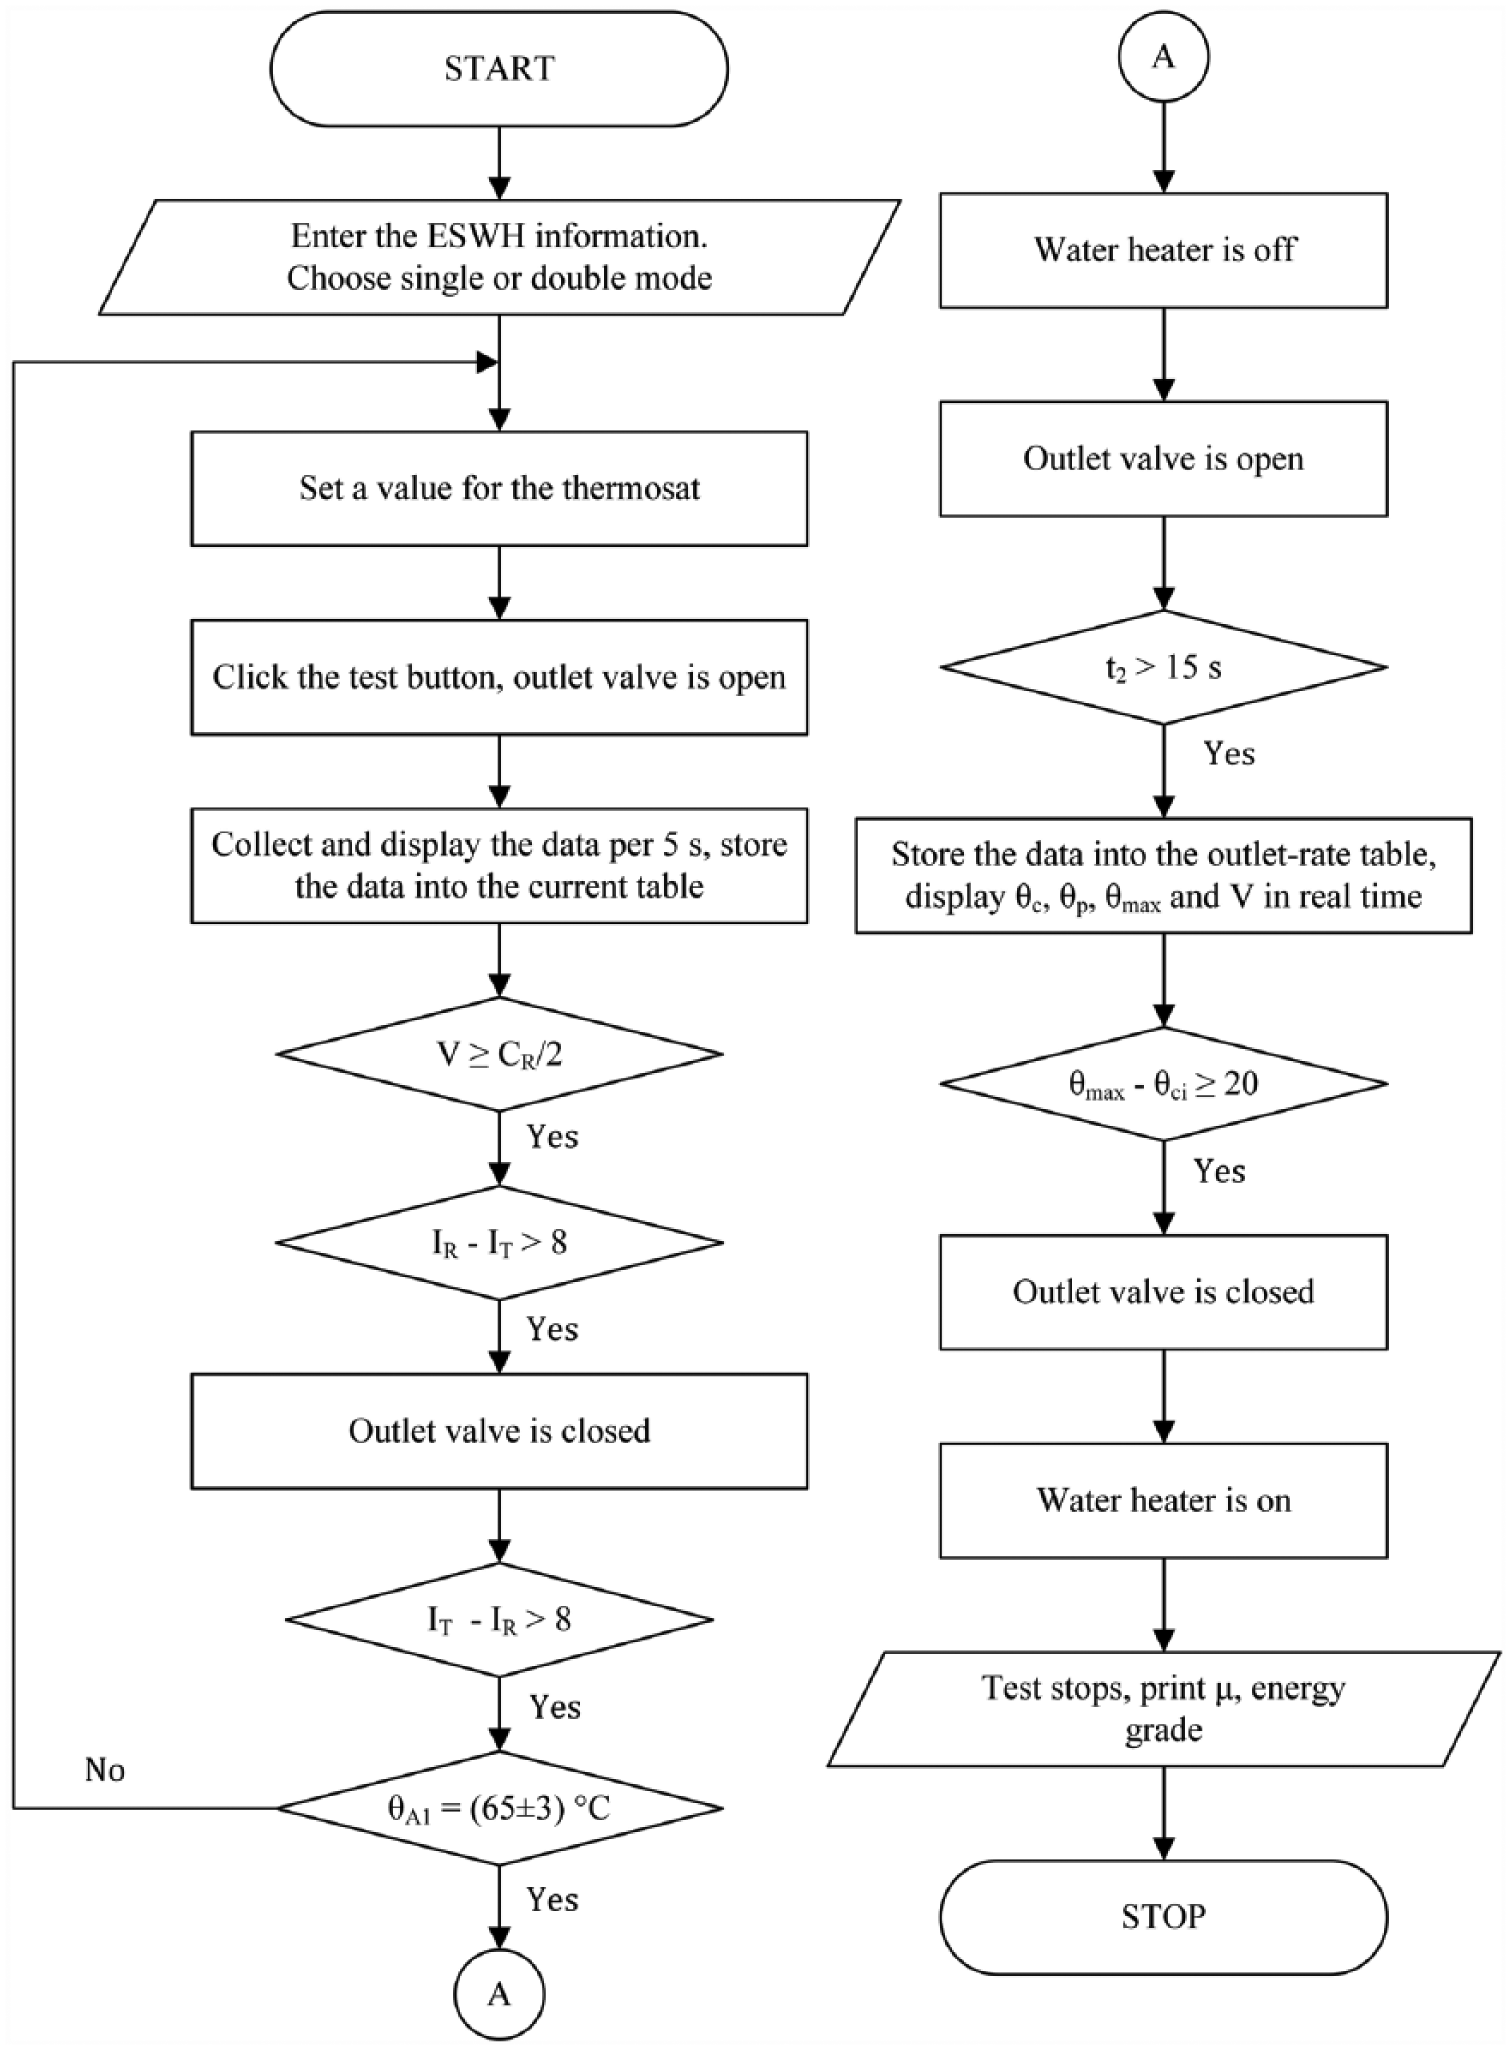
Flow chart for the hot water outlet rate.
IPC software program
A software program written in the Visual Basic 6.0 programming language was developed according to the testing flow charts. The voltage, current, and energy consumption are measured by the digital power meter, and the temperature is measured by the data acquisition unit. The IPC, digital power meter, and data acquisition unit are connected with a switchboard (TL-SF1005; TP-Link Co., Guangdong, China). They can rapidly transmit and receive data through the TCP/IP protocol. The IPC software monitors the digital power meter using a proprietary communication library. IVI-COM instrument drivers were installed in the IPC to guarantee the communication between the IPC and the data acquisition unit. The instructions from the IPC are transmitted by RS-232 to the PLC; then, the electromagnetic valve and the AC contactor can be controlled in real time by the PLC controller.
Figure 8 shows the UI of the testing program. The testing program can be used to evaluate the energy efficiency for both single-tank and dual-tank ESWHs. For example, for a single-tank ESWH, the real-time temperature curve of the five points can be displayed on the UI screen. The ambient temperature, relative humidity, cold water inlet water temperature, hot water outlet water temperature, cold water inlet pressure, hot water outlet flow rate, hot water outlet volume, mean water temperature of the five test points, voltage, current, power factor, power, energy consumption, and test time are measured and stored in real time.
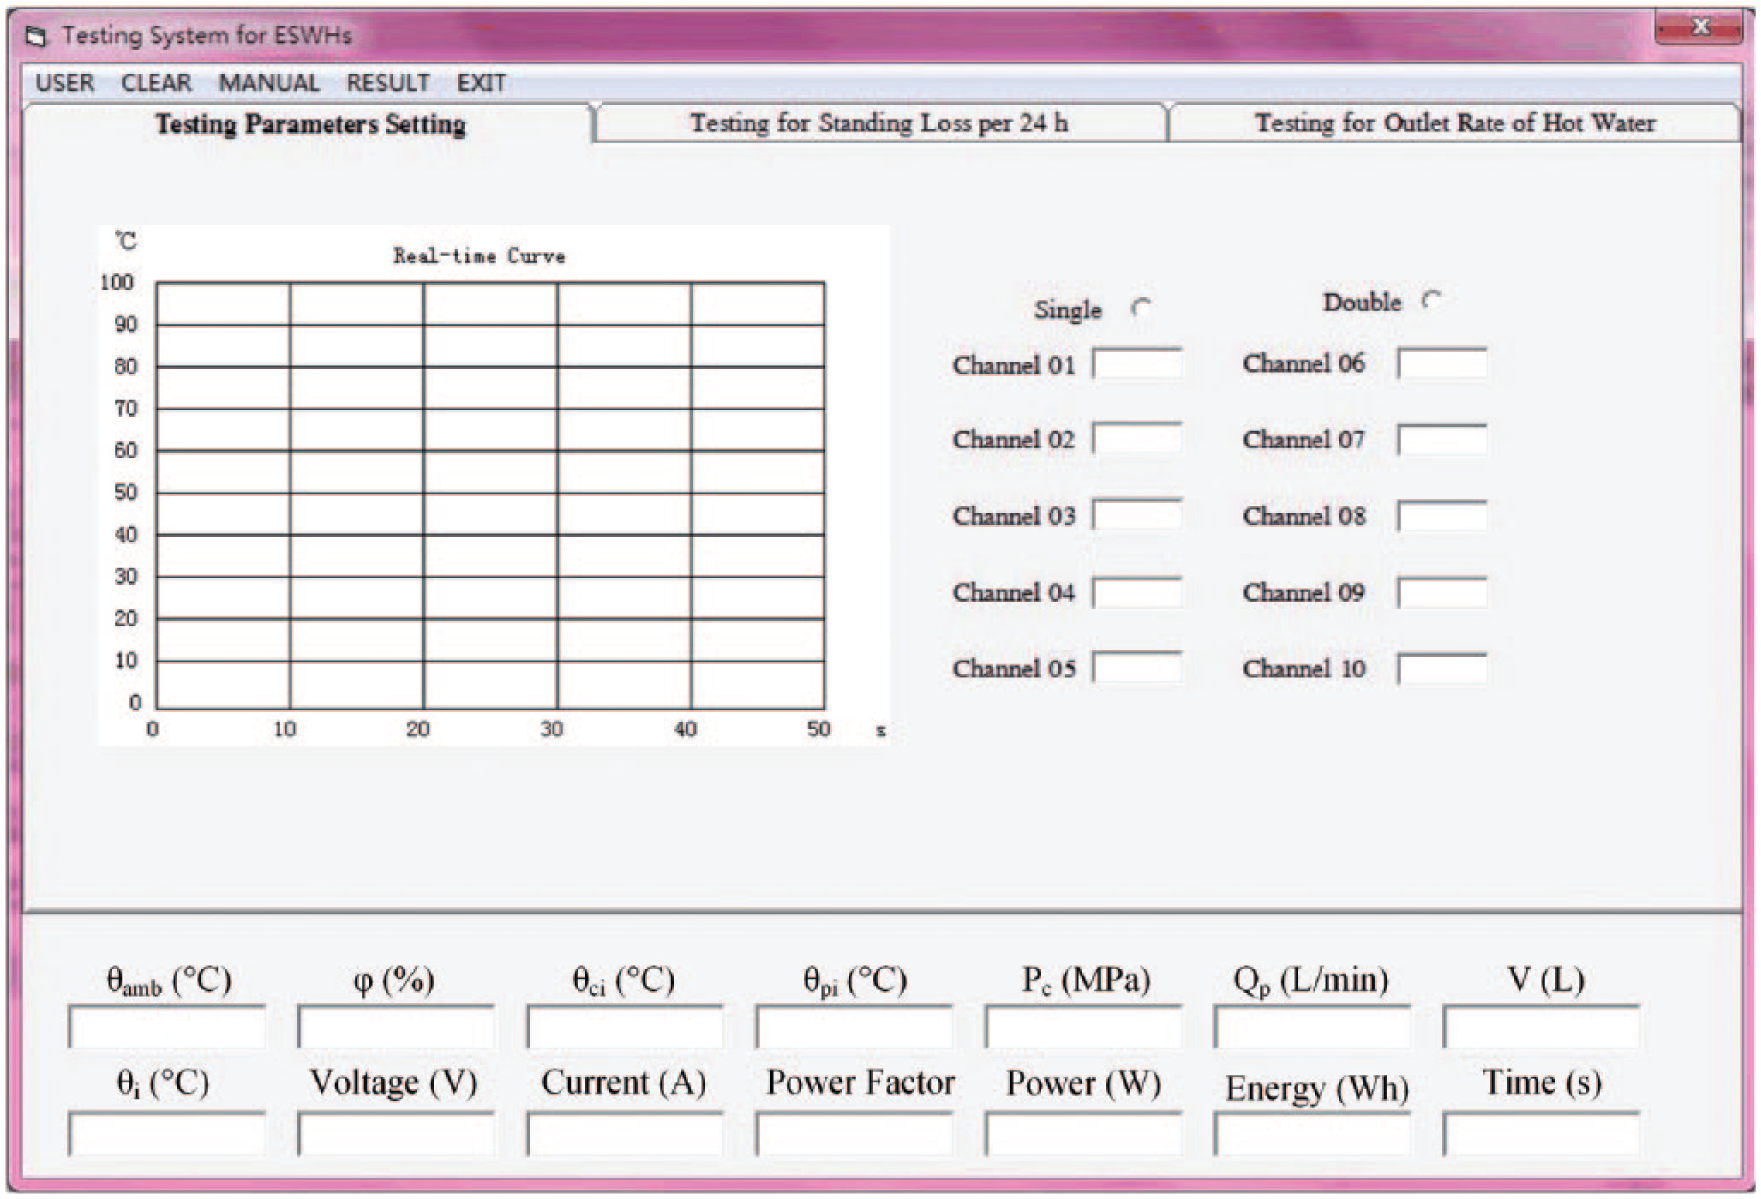
Testing program interface.
DB of acquired data
The system archives the collected data in a Microsoft SQL Server 2008 DB, which can handle DBs containing large volumes of data. Table 2 displays the DB table structures. The data are organized into six tables, including energy consumption, test points, peak temperature, trough temperature, electric current, and hot water outlet rate.
Database table structures.
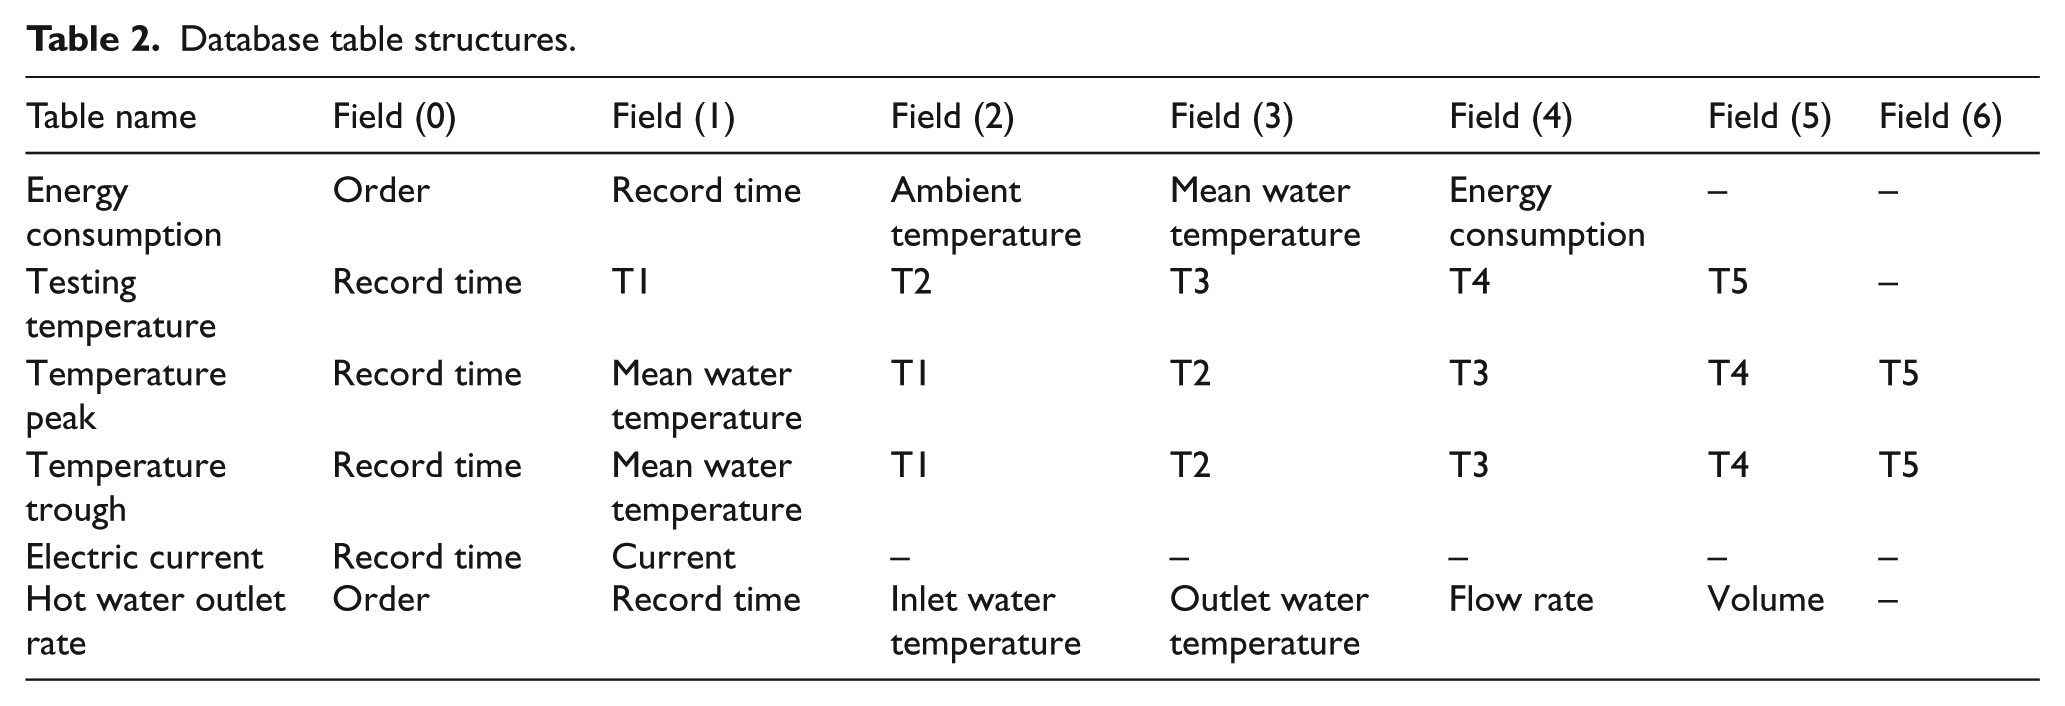
The energy consumption table is responsible for recording the testing data, including the testing time, ambient temperature, mean water temperature, and energy consumption. The five temperature points are stored in the testing temperature table, and real-time temperature curves can be drawn according to their data. The data when the mean water temperature of the five test points is the highest or lowest are stored in the temperature peak or temperature trough tables, respectively.
The electric current table is significant for judging the working status (ON/OFF) of the water heater. The highest and lowest temperatures on the temperature curve are judged by the change in the electric current. For example, if the electric current changes from 0 to 8 A, the lowest temperature is obtained. If the electric current changes from 8 to 0 A, the highest temperature is obtained. The hot water outlet rate table in the DB records the major parameter for the hot water outlet rate test.
PLC program
The upper computer (IPC) sends commands to the auxiliary internal relay of the PLC using Visual Basic–based serial communication technology. The MSComm control is used to communicate between the PLC and the upper computer. The internal I/O area triggers the PLC program; then, the PLC output port sends signals to the electromagnetic valve and the AC contactor to control the ON/OFF status of the hot water outlet and the water heater power supply, respectively. Figure 9 shows an example of ladder diagram programming using the CX-One Programmer Software developed by Omron (Kyoto, Japan).
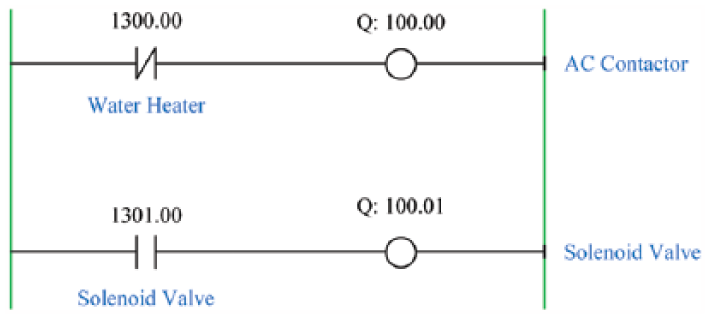
Ladder diagram for controlling the ON/OFF status of the AC contactor and solenoid valve.
Test report generation
The test reports are generated automatically for the automatic testing system. After the testing finishes, two separate test reports on the coefficient of standing loss per 24 h and the hot water outlet rate can be generated. The test report shall include at least the following information.
General information
For the coefficient of standing loss per 24 h and the hot water outlet rate, the project information and ESWH samples are necessary. The nominal parameters, for example, rated capacity, current, voltage, frequency, and power, should be recorded for comparison with the actual parameters. Moreover, the start and end testing times can be automatically recorded in the test report.
Testing results
For the coefficient of standing loss per 24 h, the temperatures of the testing points are the main data when the thermostat cuts out and cuts in. It is not only used for calculating the standing loss per 24 h but can also clearly show the ESWH on–off cycles. For the hot water outlet rate, the inlet and outlet water temperatures are among the most important data. They are combined with the hot water outlet volume to calculate the hot water outlet rate.
Experimental results and discussion
Storage capacity confirmation
Before the testing, the actual capacity of the ESWH should be confirmed. First, the ESWH should be filled as for normal use. In particular, the test condition pressure should be set for the ESWH. The total mass difference between the ESWH filled with water and with no water provides the density of the experimental water. Then, the actual capacity can be expressed in liters, accurate to 0.1 L.
ESWHs
A horizontal electrical storage water heater with a single tank (TME 60S 3QHAG, produced by Wuxi Ariston Thermo Group, Jiangsu, China) was used in the experiments (Figure 10). Small holes were drilled according to the suitable positions shown in Figure 2. The thermocouples were placed in the holes to attach to the outer surface of the container. After mounting the thermocouples, the holes were filled with thermal insulation material.
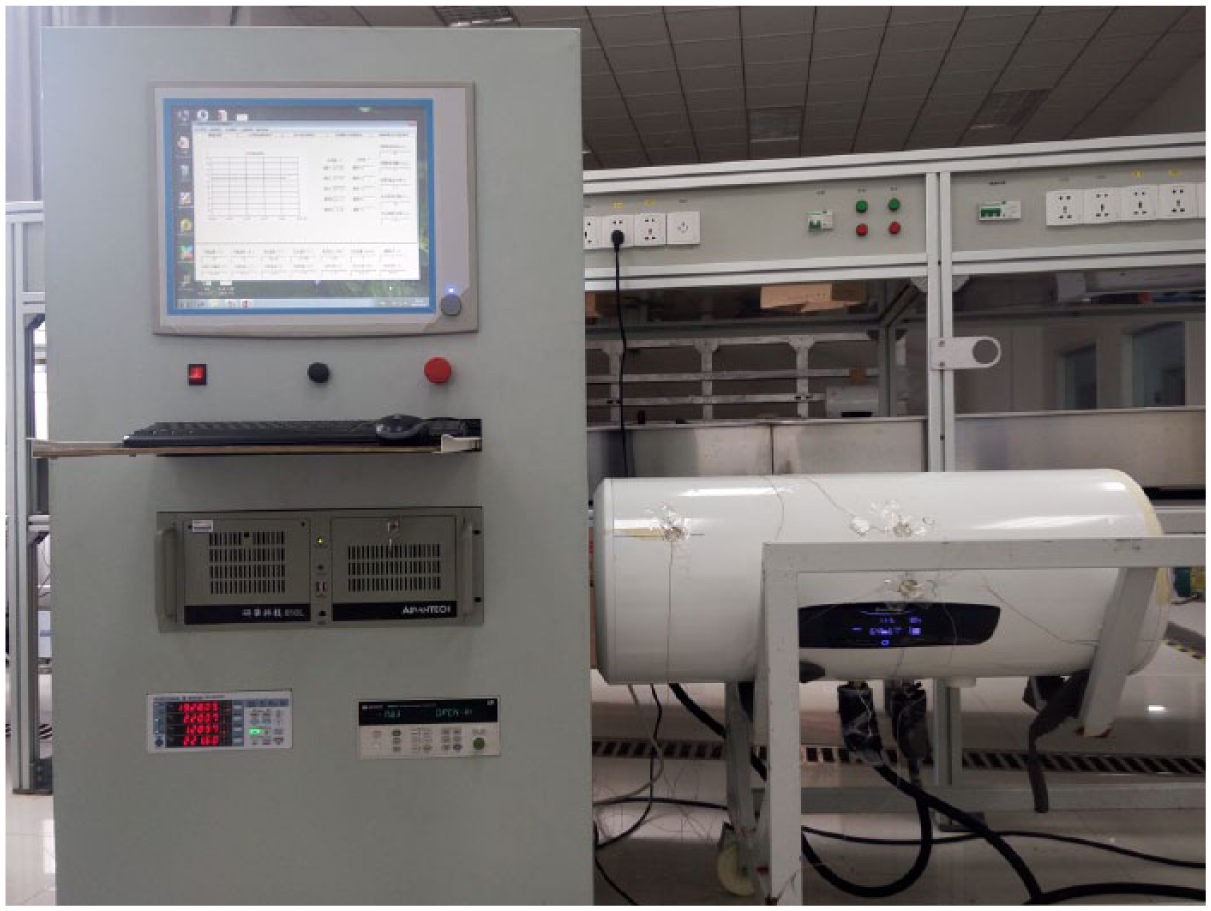
Testing system used in the experiments.
First, the preparation was done. Next, the standing loss per 24 h was measured, and then the hot water outlet rate was measured. Finally, the software analyzed the data, output the energy efficiency grade of the tested heater, and generated the test reports.
System validation
The test results were analyzed by the Visual Basic program and stored in the SQL server, which mainly collected the temperature data and electrical parameters. In the following sections, the results are graphically presented in Figures 11 –14, and a detailed analysis of the results is presented.
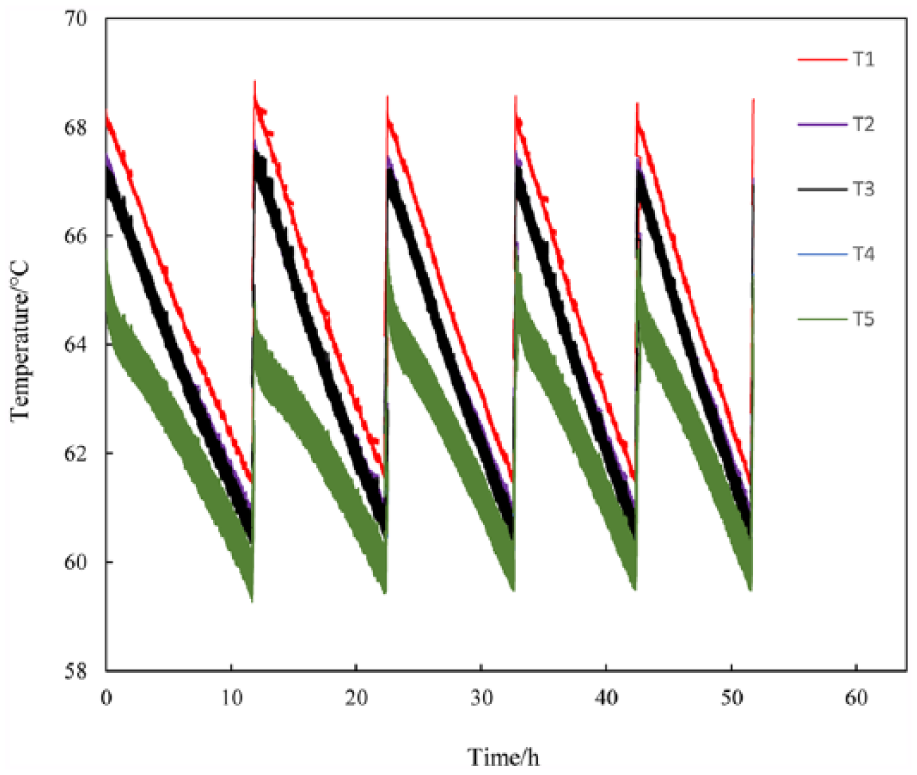
Real-time temperatures of the five testing points.
Average temperature of the five testing points.
Energy consumption during the test.
Inlet and outlet water temperatures.
Standing loss per 24 h
Figure 11 presents an example of the five record temperature points obtained during the measurement of the standing loss per 24 h. In the experiment, the time consumed during the test period was 51.77 h, and the measured temperature values and electrical parameters were recorded at 2-s intervals. T1, T2, T3, T4, and T5 represent the temperature curves of the five points. The temperatures among the five testing points varied according to the thermostat status. The oscillating shapes for all points are similar. T1 indicates the highest temperature among the five points and has the smallest temperature fluctuation. T5 represents the lowest temperature and has the largest fluctuation.
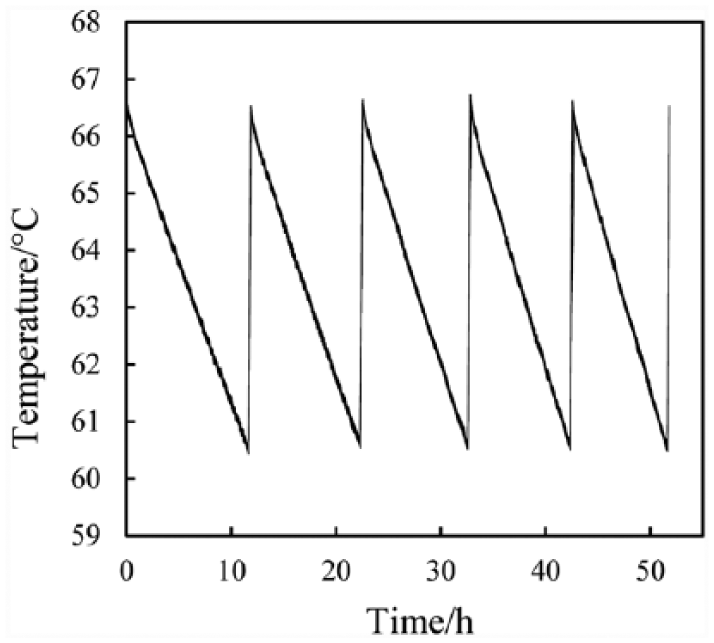
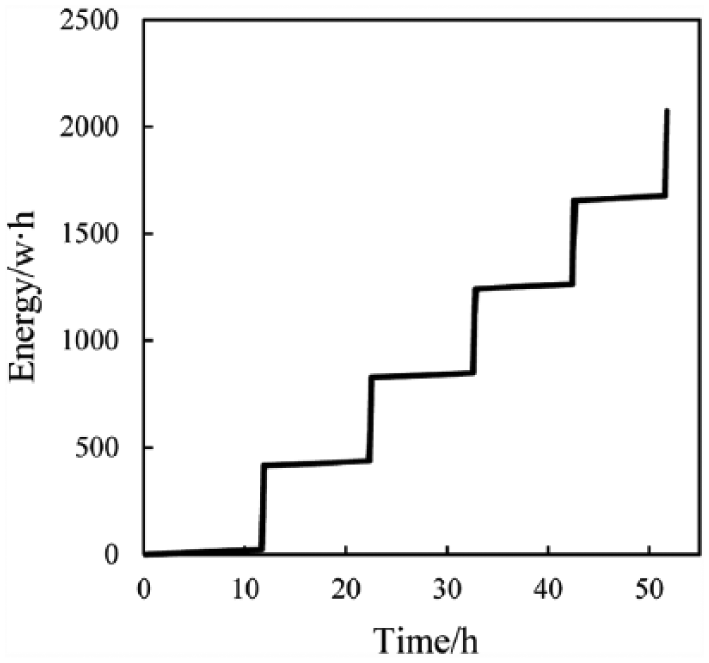
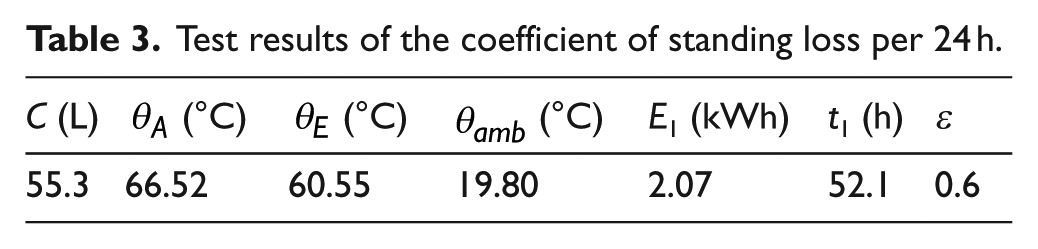
Figure 12 illustrates the average temperature of the five testing points. It can be seen that the temperature oscillates between the peak temperature and the trough temperature as the thermostat cuts out and cuts in. This phenomenon can also be observed in Figure 13. If the energy consumption remains basically unchanged, it means that the thermostat has cut out and the heater is turned off. A standby power of 2.2 W was monitored by the power meter. In contrast, if the energy rapidly increases, the thermostat has cut in and the heater is beginning to work. The heating power for the heater is 1.9 kW. Figure 13 shows the energy consumption variation during the testing process. After the test, the peak and trough temperatures and the energy consumption were used to calculate the coefficient of standing loss per 24 h. The final coefficient of standing loss per 24 h of the heater was 0.6. The test results of the coefficient of standing loss per 24 h are shown in Table 3.
Test results of the coefficient of standing loss per 24 h.
Hot water outlet rate
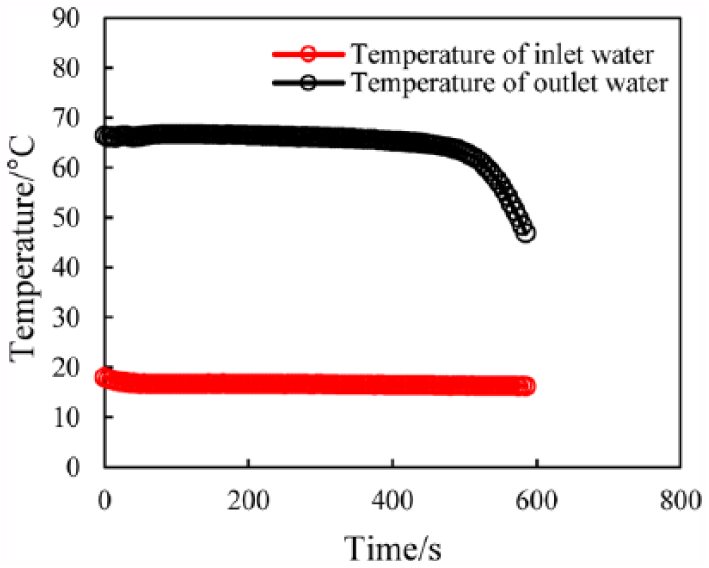
Figure 13 presents the inlet and outlet water temperatures during the hot water outlet rate measurement. The temperatures, volume, and electrical parameters were collected at 5-s intervals. Figure 14 shows that the inlet water temperature stayed between 16°C and 17°C, which satisfies the required temperature of 15°C ± 2°C. The highest outlet water temperature was 66.82°C, and the final outlet water temperature was 45.42°C.
During the testing process, the hot water withdrawal volume was recorded as 47.02 L. After the test, the inlet and outlet water temperatures and the withdrawal volume were used to calculate the hot water outlet rate The final hot water outlet rate was 77.61%. In summary, we can observe that the energy efficiency grade of the tested water heater is grade 1 (Table 1).
Conclusion
In this work, we proposed a novel testing system that combined Microsoft Excel and SQL DB technology with Visual Basic software to evaluate the energy efficiency of ESWHs. The coefficient of standing loss per 24 h and the hot water outlet rate were calculated according to the test results. In the experiments, the energy efficiency grade of the water heater was evaluated successfully. The testing results demonstrated that the testing system was reliable, efficient, and automated.
Footnotes
Appendix 1
Acknowledgements
The authors would like to acknowledge Mr Chunhong Zhao, Mr Jun Dong for their technical assistance in the experiments.
Declaration of conflicting interests
The author(s) declared no potential conflicts of interest with respect to the research, authorship, and/or publication of this article.
Funding
This work was supported by National First-class Discipline Program of Food Science and Technology (under grant JUFSTR20180205) and Jiangsu Key Laboratory of Advanced Food Manufacturing Equipment & Technology (under grant FMZ2018-07). This work is also partially supported by Wuxi Rigid Machinery Limited Company. This work was supported by a scientific research project of the Jiangsu Entry-Exit Inspection and Quarantine Bureau (2016KJ04), the Jiangsu Natural Science Foundation (under grant BK20141114), and the Jiangsu Industry-University Research Strategy Fund (under grant BY2015019-28).