
Abstract
A long-distance natural gas pipeline system consists of considerable equipment and many pipe segments, but the conventional energy efficiency index of a natural gas pipeline is considered as a whole. Because the specific energy consumption of each unit cannot be determined, the index system is not perfect, and evaluating the energy efficiency of a natural gas pipeline system is difficult. The energy efficiency evaluation model for a natural gas pipeline was established using the analytic hierarchy process. A judgment matrix was constructed based on the energy efficiency index system of a long-distance natural gas pipeline, and the weight coefficient was calculated using the characteristic root method. Then, the consistency of the established judgment matrix was verified. The energy efficiency evaluation model successfully quantified the qualitative factors that affect natural gas pipelines. The comprehensive energy efficiency coefficient G of the natural gas pipeline was obtained from the operational data of the natural gas pipeline; then, the equipment or pipe segments with high energy consumption can be identified. The energy efficiency evaluation program of the natural gas pipeline was developed using Visual Basic for Applications, which significantly reduced the evaluation workload. The natural gas pipeline energy efficiency evaluation model is used to evaluate the energy efficiency of a natural gas pipeline, to identify the high energy consumption equipment or pipe segments, and to propose measures to improve the energy efficiency. The results show that the gas pipeline energy efficiency evaluation model and evaluation procedures can identify high energy consumption equipment or pipe sections in complex natural gas pipelines.
Keywords
Introduction
Recently, energy has become the key to national development, and the most effective way to ease energy shortages is to save energy rather than to develop new energy. Energy saving in this sense refers to decreasing energy consumption, and the most important aspect of this is reducing the energy consumption of a unit product, that is, to improve the energy efficiency. The main transportation mode for natural gas is through pipelines. However, considerable energy is consumed and lost in a long-distance natural gas pipeline system. 1 The development of energy management technology for natural gas pipelines is of great significance for the development of China’s natural gas industry. In China, domestic energy management technology and methods for natural gas pipelines are still in their infancy, and it is difficult to identify the energy consumption and energy savings potential of each constituent unit or device in the pipeline system. 2 The energy management tasks of natural gas pipelines fall into two categories: guiding the operation optimization and promoting the optimization of planning and design. The aim of modern energy management is to combine pipeline automation technology, simulation technology, and information technology with optimized energy-saving operational technology and management technology and to use them to improve the energy efficiency of natural gas pipeline systems. 3
After many years of development, various methods have been derived from the analytic hierarchy process (AHP), such as improved analytic hierarchy process (IAHP), fuzzy analytic hierarchy process (FAHP), extended fuzzy analytic hierarchy process (EFAHP), and gray analytic hierarchy process (GAHP). These methods each have their own scope according to the actual situation. AHP is mainly used in the field of safety science and environmental science, especially in oil and natural gas engineering.4,5 Currently, AHP is widely used. Y Han et al. 6 presented a performance analysis and optimal temperature selection method for ethylene cracking furnaces using the data envelopment analysis cross-model (DEACM) integrated AHP. FAHP has been used to accurately evaluate the energy consumption of petrochemical plants based on production data. 7 A novel energy evaluation framework of petrochemical industrial processes based on a data envelopment analysis (DEA)-integrated AHP model has been proposed. This approach was first applied to the energy efficiency analysis of the ethylene production process in petrochemistry to improve the energy efficiency. 8 In this article, the AHP is used to establish a natural gas energy efficiency evaluation model.
In this article, based on the analysis and statistics of a large amount of energy consumption data, an energy efficiency evaluation model of a natural gas pipeline is established. The energy efficiency evaluation index is divided into a measurable parameter index and a comprehensive evaluation index. The measurable parameter index was directly obtained from station equipment, and the comprehensive evaluation index was calculated from the measurable parameter index to comprehensively evaluate each piece of equipment and pipe section. The comprehensive energy efficiency coefficient G of the natural gas pipeline integrates the impact of various energy consumption factors and can identify the pipe or station that the operation and management department need to retrofit first to improve the investment efficiency. 9 Through real-time collection and monitoring of the energy consumption data, the energy efficiency evaluation model can determine the energy consumption of each piece of equipment and pipe section in the natural gas pipeline system and identify any high energy consumption equipment or pipe sections for technological improvements. Considering the energy consumption and pipeline loss, establishing the natural gas pipeline energy efficiency evaluation model is very important for the comprehensive evaluation of each piece of equipment and pipe section.
Energy efficiency evaluation model of a natural gas pipeline based on an AHP
An AHP is a multi-criteria analysis and decision-making method that combines qualitative analysis with quantitative analysis; this method was proposed by T.L. Saaty, an American operational research scientist.10,11 On the basis of expert knowledge and experience, the subjective elements can be eliminated using mathematical methods with strict logic. The experts should be authoritative persons in a particular field, and the required number of experts depends on the circumstances. These experts clarify the ranking of factors that are sensitive to the weights using sensitivity analysis. Based on the relationships among the internal factors of the natural gas pipeline system, the complex problem is decomposed into several hierarchies and several factors. Based on the elements of the upper hierarchy, the importance of each pair of elements in the same hierarchy is compared; then, the judgment matrix is established. Next, the maximum eigenvalues of the judgment matrix and the corresponding eigenvectors are calculated. The reasonableness of the weight values can be verified based on whether the judgment matrix has satisfactory consistency. Thus, the reliability, accuracy, and objective fairness of the evaluation results can be improved. 12
The determination of the energy efficiency index weight of a natural gas pipeline
By ranking the relative importance of the indexes at the same hierarchy level, the degree (numerical importance) of the indexes at each hierarchy, that is, the index weight, is determined. The energy efficiency index weight in a long-distance natural gas pipeline can be determined using the following method.
Establish the hierarchy model
First, the energy efficiency index system of the natural gas pipeline is divided into several hierarchies. Then, the hierarchical structure is established from the top to the bottom in a “dominant” and “being dominated” relationship to calculate each index weight and evaluate the system. The energy efficiency index system of a natural gas pipeline consists of actual object-level indexes (referred to as O-level indexes), intensity-level indexes (referred to as I-level indexes), efficiency-level indexes (referred to as E-level indexes), and index-level indexes (referred to as T-level indexes). O-level indexes include the turnover, volume, energy consumption, power consumption, pressure ratio, electricity consumption, air consumption, loss of throttle, pressure, and power consumption, 13 where the energy consumption includes the production energy consumption and auxiliary energy consumption. The energy efficiency index system of a natural gas pipeline is shown in Figure 1.

The energy efficiency index system of a natural gas pipeline.
The O-level index is the basic data related to the energy consumption index of a natural gas pipeline and provides the basis for calculating the I-level index, the E-level index, and the T-level index. The I-level index is the intensity-level index, which is calculated from the O-level index and the actual operational data of a natural gas pipeline; this index can reflect different aspects of the energy consumption level of the pipeline. The E-level index is the efficiency-level index, which is calculated from the O-level index and the actual operational data of a natural gas pipeline; this index can reflect different aspects of the efficiency, utilization, and loss of the pipeline. The T-level index is a comprehensive index-level index that considers all relevant factors and forms a certain algorithm. The T-level index is calculated from the O-level index, I-level index, and E-level index. The T-level index reflects the level of pipeline energy consumption and can be directly used to evaluate the pipeline energy consumption. The influences of the T-level indexes, E-level indexes, or O-level indexes in a hierarchy on their upper hierarchy target should be compared and analyzed.
Construct the judgment matrix
A pairwise comparison is used to analyze each hierarchy in the energy efficiency index system of a natural gas pipeline. By introducing a relative scale called the proportional scale, the influence of the factors in a hierarchy on their upper hierarchy target is compared and analyzed. Then, the two-by-two judgment matrixes between different hierarchies are constructed. The judgment matrix is given as
Calculate the index weights
Reducing the subjectivity of the weight determination in the energy efficiency evaluation model of a natural gas pipeline has very important significance,
15
especially for improving the accuracy and sensitivity of the energy efficiency evaluation and for improving the quality and credibility of the evaluation results. Based on the judgment matrix
Check the consistency
To determine the reasonableness of the energy efficiency index weights for natural gas pipeline and to ensure consistency in the decision-makers’ thinking, it is necessary to test the consistency of the judgment matrix
The stochastic consistency index.

If it does not satisfy the consistency criterion, the judgment matrix
The calculation of the energy efficiency index of a natural gas pipeline
Based on the established energy efficiency index and production data, the energy efficiency of a long-distance natural gas pipeline can be achieved. To calculate the comprehensive energy efficiency index, dimensionless processing is adopted to calculate the membership degree. 17 As an example to illustrate the method, N factors in a hierarchy are used to calculate the upper hierarchy target in the energy efficiency index system of a long-distance natural gas pipeline. Each factor is calculated based on m basis values. The values of the n factors are C1, C2, C3,…, Cn, and the membership degree is as follows


The energy efficiency coefficient of the upper hierarchy target is as follows

where
We calculate the energy efficiency coefficient of each hierarchy of a natural gas pipeline using the same method and then obtain the comprehensive energy efficiency coefficient G of the natural gas pipeline.
Energy efficiency evaluation program of a natural gas pipeline
Energy efficiency evaluation algorithm process for a natural gas pipeline
Visual Basic for Applications (VBA), as a simple derivative of Visual Basic (VB) programming, is easy to learn, convenient to use, and can quickly execute Office functions. VBA is compatible with Word, Excel, Access, SQL, VFP, and many other data text procedures. 18 VBA code is simple to write and can be generated by recording a macro. 19 VBA has been widely used in the field of oil and gas. Based on the operational basic data of natural gas pipelines and the relevant principles of the AHP, Excel VBA can achieve any of the energy efficiency evaluations of a natural gas pipeline. The energy efficiency evaluation algorithm process for natural gas pipelines is shown in Figure 2.

Energy efficiency evaluation algorithm process for natural gas pipeline.
To improve the readability of the data and to make it convenient for later analysis and processing, the basic data for a natural gas pipeline are input into Excel based on the designed data format. Then, we determine the index weight and check the consistency using the AHP method. Next, we rank the priority of each factor in the energy efficiency index system of the natural gas pipeline according to the weight. Then, the energy efficiency coefficient G of the natural gas pipeline is calculated using the calculation method. The energy consumption of various equipment and pipe sections of the pipeline system could be shown at any time by collecting and monitoring the energy efficiency data of the evaluation index system. High energy consumption equipment or pipe sections can be identified, which is advantageous for adjusting or transforming technology in a timely manner and for saving energy costs. 20
Energy efficiency evaluation VBA operational interfaces of a natural gas pipeline
The natural gas pipeline energy efficiency evaluation program using Excel VBA consists of six interfaces: the basic data, weight calculation, index calculation, energy efficiency evaluation, results output, and operational help. The program is saved as a Microsoft Excel macro-enabled worksheet. The purpose of the energy efficiency evaluation of a natural gas pipeline is to find pipe sections and months with low energy efficiency through analysis and comparison. The pipeline is divided into sections according to certain rules. The measurable parameters of compressor stations, pipelines, and other energy efficiency indexes are recorded from January to December. The basic data input interface is simple and flexible; any data input for a long-distance natural gas pipeline can be used. Figure 3 shows the weight calculation interface of the energy efficiency evaluation in VBA, and Figure 4 shows the index calculation interface of the energy efficiency evaluation in VBA.

The weight calculation interface of the energy efficiency evaluation in VBA.

The index calculation interface of the energy efficiency evaluation in VBA.
The order of the judgment matrix is selected by rotating the button in the VBA weight calculation interface. The “output” button is then clicked to calculate the matrix judgment matrix consistency ratio CR, the maximum eigenvalue, and its eigenvector. The “2” button at the bottom right is selected based on the value of CR. When CR < 0.1, clicking “write” will automatically write to the Excel file. When CR > 0.1, clicking on “adjust” will adjust the matrix and recalculate. When calculating the weight of other indicators, clicking on “clear” will initialize all the values.
In the VBA weight calculation interface, clicking on “output 1” will calculate the corresponding membership based on the basic data and the order of the judgment matrix, and clicking on “output 2” will calculate the energy efficiency coefficient of the upper index. Clicking “write” will automatically write to the Excel file, and clicking “clear” will initialize all the values.
The main difficulties of VBA development are understanding and applying the corresponding object model. 21 The VBA development methods for solving a problem are very flexible. Through VBA programming, the energy efficiency evaluation of a long-distance natural gas pipeline can be successfully achieved, which can free oil and gas industry personnel from a large number of tedious operations. Users need to input only a few values to make modifications and adjustments based on their different needs. Then, the high energy consumption equipment or pipe sections of the natural gas pipeline can be quickly identified.
Application example
Establish a hierarchical model
A long-distance natural gas pipeline is taken as an example for analysis. There is only one compressor station along the pipeline, and the natural gas pipeline uses unheated transport. The total energy supplied by the pipeline system is partly used to compensate for the energy consumption of the compressor station and the heat loss of the air cooler, and the rest of the energy is supplied to overcome the loss from frictional drag along the path, conveying both pressure loss and heat transfer loss. The final residual energy is accompanied by the gas entering the end of the pipe. The energy consumption structure of the natural gas pipeline is shown in Figure 5. Based on the principle of the AHP, to establish the hierarchical structure model, the energy efficiency index system of the long-distance natural gas pipeline is established, as shown in Figure 6.

The energy consumption structure of the natural gas pipeline.

The energy efficiency index system of the natural gas pipeline.
G, M, and C represent the indexes. The index system is divided into three hierarchies. The first hierarchy is the comprehensive influence of all the sub-hierarchies. The three indexes in the second hierarchy are the three main aspects of the pipeline’s energy consumption. The energy efficiency indexes of the compressor station reflect the main energy consuming equipment in the compressor station and reflect the energy efficiency of the compressor station and the entire pipeline from a macro point of view. The comprehensive energy efficiency index of the natural gas pipeline reflects the overall energy consumption of the pipeline. The pipeline loss ratio reflects the overall loss of the natural gas pipeline. During the operation of a natural gas pipeline, factors that affect the energy consumption include the pipe diameter, pipe length, pipe material, pipe insulation, physical properties of natural gas, volume of natural gas, surrounding climate, and heat transfer coefficient of the soil. 22 In addition to the energy consumed during the operation of a natural gas pipeline, losses are caused by pipeline venting and measurement errors. The total loss determines the operation and management of the pipeline.
Determine the index weights
Construct a judgment matrix based on the comprehensive energy efficiency index G of the natural gas pipeline, the energy efficiency index of the compressor station and the loss ratio and energy efficiency index of the pipeline. Another judgment matrix is established based on the energy efficiency coefficient M1 of the compressor station, the polytropic efficiency of the compressor, the air cooler energy efficiency index, and the air cooler pressure drop per volume. A third judgment matrix is established based on the energy efficiency M3 of the pipeline, the pressure drop per length of pipe, and the temperature drop per length of pipe. The largest eigenvalue and the eigenvector of the judgment matrix are calculated, and then the relative weight is determined. After the normalization treatment, the summation of weights for each criteria or sub-criteria will be equal to one. The judgment matrixes and weight values of the three groups are shown in Tables 2–4.
The judgment matrix G–M and weight values.

The judgment matrix M1–C and weight values.

The judgment matrix M3–C and weight values.

The calculations show the following:
The G–M judgment matrix: λmax = 3, w = (0.6000, 0.0667, 0.3333), CR = 0 < 0.1;
The M1–C judgment matrix: λmax = 3, w = (0.5625, 0.3750, 0.0625), CR = 0 < 0.1;
The M3–C judgment matrix: λmax = 2, w = (0.1667, 0.8333), CR = 0 < 0.1.
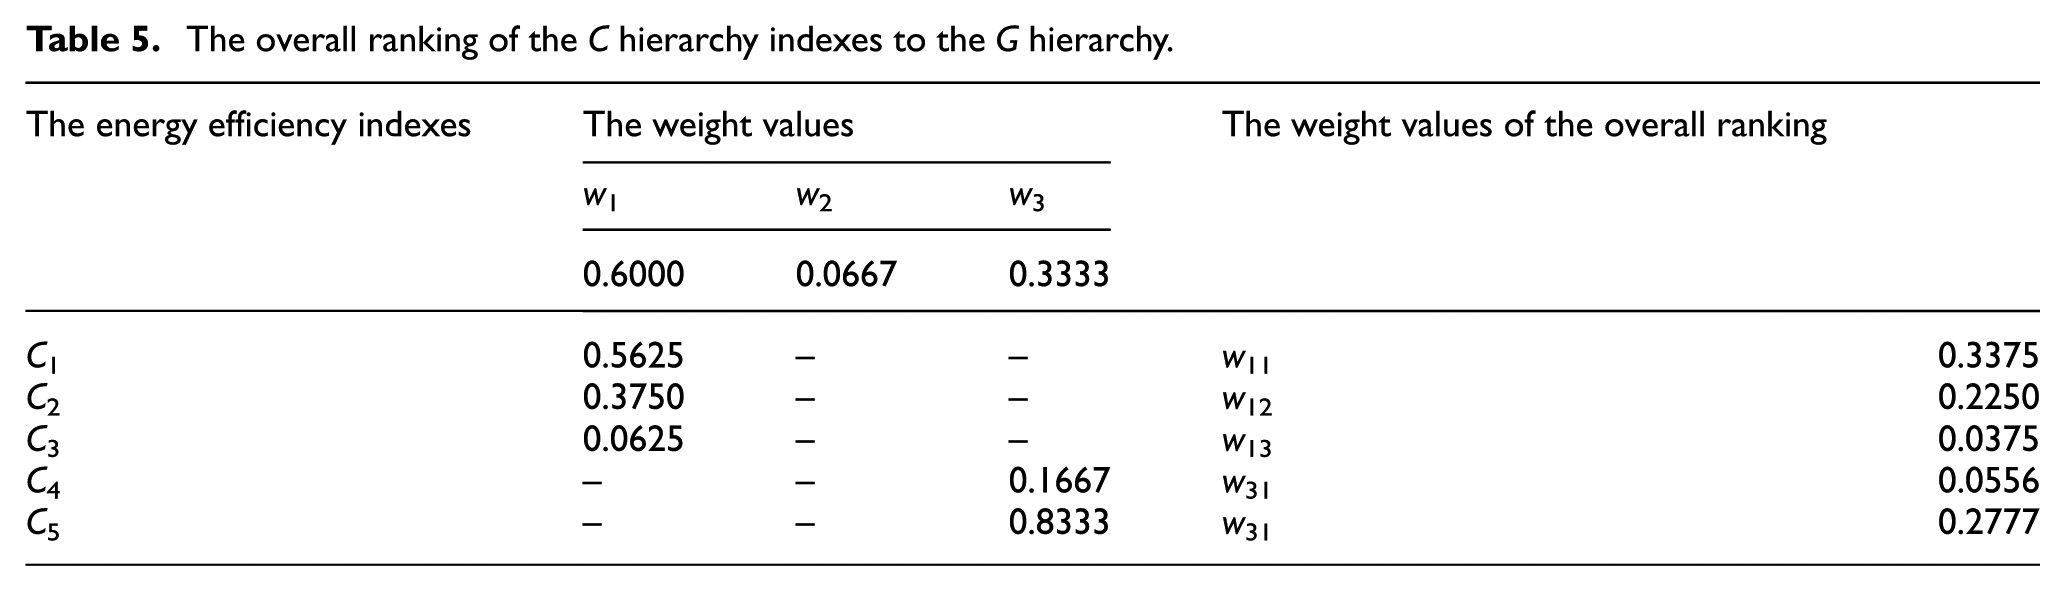
The degree of inconsistency for the matrixes G, M1, and M3 is within the allowable range, so they can be used. Through the calculation and analysis of Tables 2–4, Table 5 shows the overall ranking of the C hierarchy indexes to the G hierarchy.
The overall ranking of the C hierarchy indexes to the G hierarchy.
Calculate the energy efficiency index
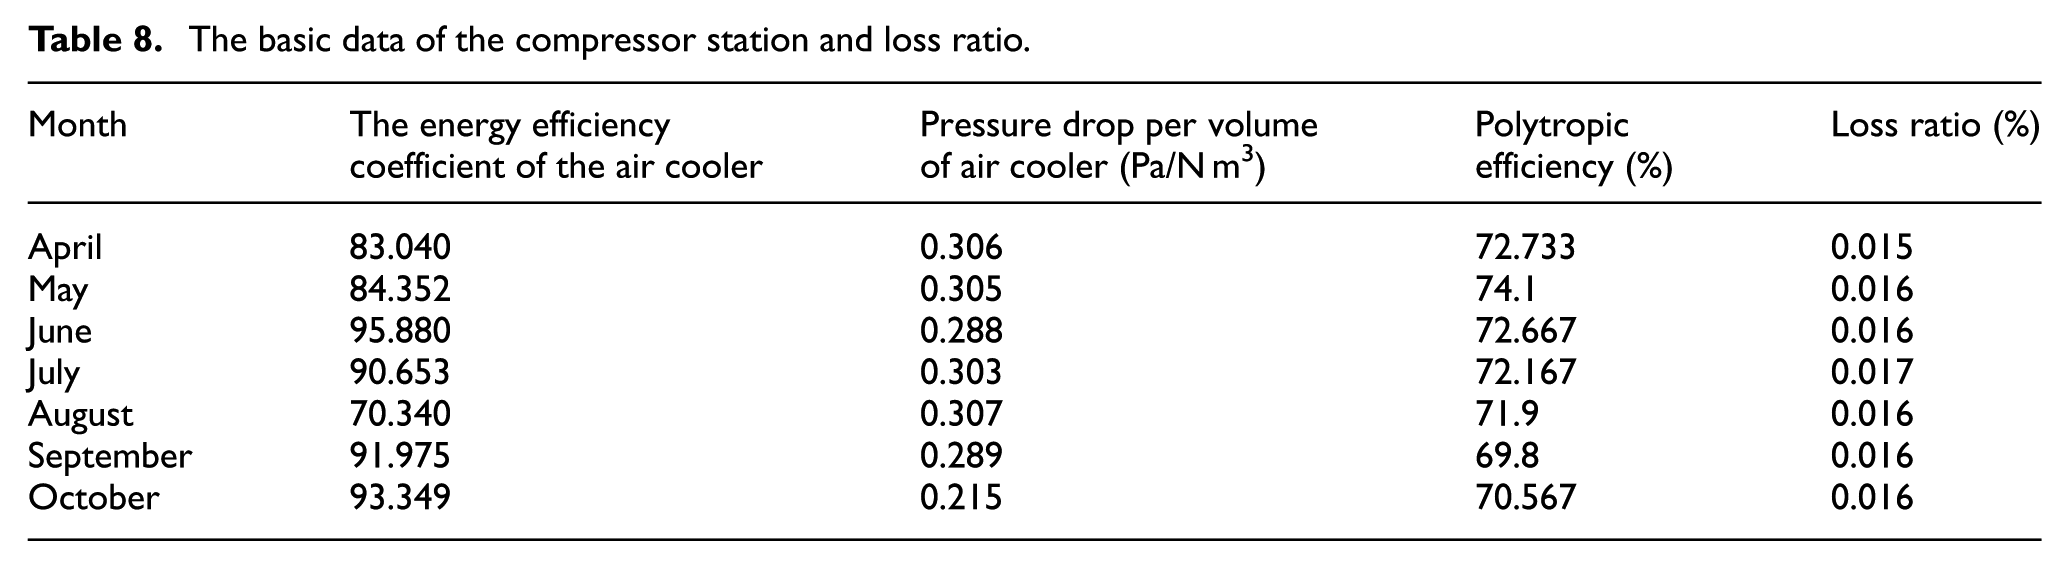
Based on the operational data of the natural gas pipeline, the pipe is divided into 10 sections that are numbered from 1 to 10. The energy efficiency index of the compressor station, the energy efficiency coefficient of the pipe section, and the comprehensive energy efficiency coefficient G of the pipeline are calculated based on the operational base data of the compressor station, air cooler, and pipeline from April to October. The energy efficiency evaluation indexes and calculation methods are shown in Table 6, the basic data of each pipe section of the main line are shown in Table 7, and the basic data of the compressor station and loss ratio are shown in Table 8.
Energy efficiency evaluation indexes and calculation methods.

The basic data of each pipe section of the main line.

The basic data of the compressor station and loss ratio.
Based on the above evaluation analysis method, the comprehensive energy efficiency coefficient of pipe sections No. 1 to No. 10 is calculated, and the comprehensive energy efficiency coefficient of the compressor station and the pipeline is calculated for April to October. The following is a brief introduction to the calculation method of the energy efficiency coefficient M1 of the compressor station. The energy efficiency coefficient M3 of the pipeline and the comprehensive energy efficiency coefficient G of the natural gas pipeline are calculated using the same method.
The calculation method of the energy efficiency coefficient M1 of the compressor station is as follows. The polytropic efficiency C1 of the compressor, the energy efficiency coefficient C2 of the air cooler, the pressure drop C3 per volume of the air cooler, and their membership degrees are as follows


The energy efficiency coefficient M1 of the compressor station is as follows

where
Energy efficiency evaluation and results analysis
The comprehensive energy efficiency coefficients of pipe sections No. 1 to No. 10 are calculated as follows: 0.65, 0.40, 0.73, 0.48, 0.43, 0.58, 0.86, 0.67, 0.44, and 0.46, respectively. The results of the comprehensive energy efficiency evaluation of the natural gas pipeline from April to October are mapped to the analysis, as shown in Figure 7.

The comprehensive energy efficiency evaluation of the natural gas pipeline from April to October.
The energy consumption per turnover of the natural gas pipeline from April to October is shown in Table 9.
Energy consumption per turnover of the natural gas pipeline.

The analysis of the energy efficiency of the long-distance natural gas pipeline, combining Tables 7–9 and Figure 7, is shown in the following:
For the long-distance pipeline, the energy efficiency coefficients of pipe sections No. 2 (0.40), No. 4 (0.48), No. 5 (0.43), No. 9 (0.44), and No. 10 (0.46) are lower than the average value. It would be helpful to strengthen the regulation of these segments during their daily operations, especially in section No. 2, under the current energy management status. From the comprehensive energy efficiency evaluation results, the pressure drop per length for section No. 2 is much higher than that of the other pipe section, which may be caused by ice blocking the inside of the pipe or by sewage accumulation. 23 A regular pipeline cleaning process would reduce the pipeline internal hydrate and impurity deposition and reduce the friction loss along the pipeline. Reducing the friction loss along the pipeline will reduce the pressure drop per pipe length.
For the compressor station, the comprehensive energy efficiency coefficient for June was significantly higher than those for the other months, and the energy efficiency coefficients for August and September were significantly smaller than the average. The reason for a low energy efficiency coefficient is a low polytropic efficiency of the compressor; therefore, the opening number of air coolers and the operating time of the air coolers increase. For the entire pipeline, the comprehensive energy efficiency coefficient of the pipeline in June is the highest, providing more energy savings than other months. The comprehensive energy efficiency coefficient in August is much lower than that in the other months; the reason for this is the lower polytropic efficiency of the compressor and the low energy efficiency coefficient of the air cooler. Energy consumption per turnover was higher in August and September than in other months, which is consistent with the lower efficiency coefficient of the compressors in August and September. The polytropic efficiency of the compressor can be improved by cleaning the compressor regularly and removing fouling from the impeller. The most effective method for improving the energy efficiency coefficient of the air cooler is to reduce the energy consumption of the air cooler. At the compressor station, the air cooler fan motor is recommended to be replaced with a variable frequency motor.
By analyzing the energy efficiency coefficients and operational basic data of different months in natural gas pipelines, the inefficient months and the reason for the inefficiencies can be identified. An effective supervision and management strategy for inefficient months can be formulated and combined with the actual operation of the natural gas pipeline. Then, measures can be taken to improve the energy efficiency in inefficient months, which will have a positive impact on improving the efficiency in other months.
Conclusion
Based on the calculation principle of the AHP, the hierarchical structure of the influencing factors is established. The judgment matrix is constructed, and then, the weight coefficient is calculated using the characteristic root method. Next, the consistency of the judgment matrix is verified. The major factors that affect a long-distance natural gas pipeline are thus determined. The comprehensive energy efficiency coefficient G of a natural gas pipeline was obtained from the operational data of the pipeline. Then, the high energy consumption equipment or pipe segments can be identified by the lower energy efficiency coefficients.
Using the energy efficiency evaluation model and procedure for natural gas pipelines, the major factors that affect a long-distance natural gas pipeline can be determined, and the high energy consumption equipment or pipe segments can be identified. This is conducive to formulating an effective supervision and management strategy for long-distance pipelines. Then, measures can be taken to improve the energy efficiency of the pipeline, and the energy consumption can be optimized, which will increase energy savings.
Footnotes
Academic Editor: Jun Ren
Declaration of conflicting interests
The author(s) declared no potential conflicts of interest with respect to the research, authorship, and/or publication of this article.
Funding
The author(s) disclosed receipt of the following financial support for the research, authorship, and/or publication of this article: This work was supported by Sichuan Provincial Key Discipline Construction Foundation of China (no. SZD0416).