
Abstract
Cities are widely considered to be the engines of economic growth, as they contribute for more than 70% of global economy. However, the haphazard urbanisation trends are today resulting in widespread problems of urban sprawl, pollution, housing, crime and disaster and so on. While India is one of the least urbanised large developing countries of the world, the country is witnessing rapid urbanisation (projected to add 404 million of urban population by 2050). However, the associated problems are impacting the liveability of the cities in India. In light of that, this study aims to evaluate the liveability of Tier-1 cities of India. In reference to the existing literature, eleven key indicators have been identified for the evaluation of liveability. For the ease of analysis, these indicators are broadly clustered under five categories, that is, health, environment, transport, geography and socio-economy. The correlation analysis between the indicators and the number of Covid-19 cases in selected cities of India reveal a significant relationship between the individual categories such as ‘quality of life’ and ‘health index’.
Introduction
As per Creating Livable Cities: Regional Perspectives, the continuing population growth and urbanisation have led to the creation of massive ‘megacities’ and fast-growing ‘small and medium cities’. It is often perceived that urbanisation has been instrumental in bringing opportunities to cities; however, it has parallelly generated serious socio-economic problems of environmental stress, crime, risk of climate change and disaster (Asian Development Bank, 2019; Kovacs-Györi et al., 2019; Kuddus et al., 2020). As per a WHO Report, nearly 1.2 million people worldwide die annually due to cardiovascular and respiratory diseases caused by urban air pollution (WHO, 2021). Also, according to the United Nations’ Report, cities have become the epicentre of coronavirus (Covid-19) as 90% of global Covid-19 cases were found in cities (Mishra et al., 2020a). All these events tend to influence the perceived ‘liveability’ of cites which can be inferred to ‘how well the built environment and the available services fulfil the resident’s needs and requirements’ (Kovacs-Györi et al., 2019).
In this regard, numerous studies have been undertaken by planners and policymakers to understand the impact of liveability on individuals/communities. The existing discourses on liveability ranking system quantifies the urban quality of life (Ruth & Franklin, 2014; Paul & Sen, 2020). At the policy level, the United Nations’ Sustainable Development Goals (SDGs), particularly Goal 11, emphasises on ‘making cities and human settlements inclusive, safe resilient and sustainable’ (Kovacs-Györi et al., 2019). Complementing the SDGs, the New Urban Agenda also seeks to create a mutually reinforcing relationship between urbanisation and development (UN-Habitat, 2016). In lines with these policy guidelines, various organisation have attempted to measure the liveability, for example, the European Commission conducts ‘quality of life’ survey in major European Union cities to know the resident’s satisfaction level. This survey largely includes a question about infrastructure, employment, housing and safety (Cave & Wagner, 2018). Similarly, the Ministry of Housing and Urban Affairs, Government of India, has developed ‘Ease of Living Index’ to assess the condition of cities across three pillars of quality of life, economic ability and sustainability (National Institute of Urban Affair, 2019).
On a similar line, this study aims to evaluate the liveability of selected Tier-1 cities of India, namely, the Greater Mumbai Municipal Corporation, Delhi Municipal Corporation, Bengaluru, Greater Hyderabad Municipal Corporation, Ahmedabad, Chennai, Kolkata, and Pune. The key objective of the study is (a) to measure the liveability of tier-1 cities by assessing the eleven indicators of liveability grouped within five categories and (b) to establish the relationship between the individual and composite indictors of liveability with the number of Covid-19 cases in Tier-1 cities. Herein, the correlation between the indicators of liveability and numbers of Covid-19 cases can help to serve as a useful analytical framework to evaluate the liveability of these cities.
The rest of the paper is structured as follows: Second section furnishes the conceptual understanding of the liveability and its popular indices. Third section gives a brief about the case study Tier-1 cities along with the detailed research methodology adopted for the study. The analysis and result of the study have been presented in the fourth section. Finally, last section summarises the key conclusions and limitations of the study.
Literature Review
Definition and Measurement of Liveability
In recent times, the concept of liveability has received immense importance in planning and public discourse (Ruth & Franklin, 2014). The Cambridge Dictionary (2021) defines liveability as ‘the degree to which a place is suitable for good for living in’. However, the concept still lacks a unified definition and method of measurement due to its multifaceted character (Zanella et al., 2015; Zhan et al., 2018). For instance, liveability is often interchangeably used with the overlapping concept of quality of life, well-being and sustainability, which makes its interpretation little difficult (Kovacs-Györi et al., 2019; Zanella et al., 2015). Still, many scholars have attempted to define the liveability from different perspectives, for example, Pacione (1990) define liveability as a ‘behaviour-related function of the interaction between environmental and personal characteristics’ (Badland et al., 2014). Newman (1999) outline liveability as ‘human requirement for social amenity, health and well-being’, and Chazal (2010) infers it as a ‘desires related to the contentment with life in a particular location of an individual or set of individuals’. However, according to Kumari and Shekhar (2018), majority of these studies associate liveability with effective transportation, social-economic wellbeing and quality of environment. Besides, the major discussion while defining liveability observably lies in identifying the dimensions that constitute a ‘liveable city’.
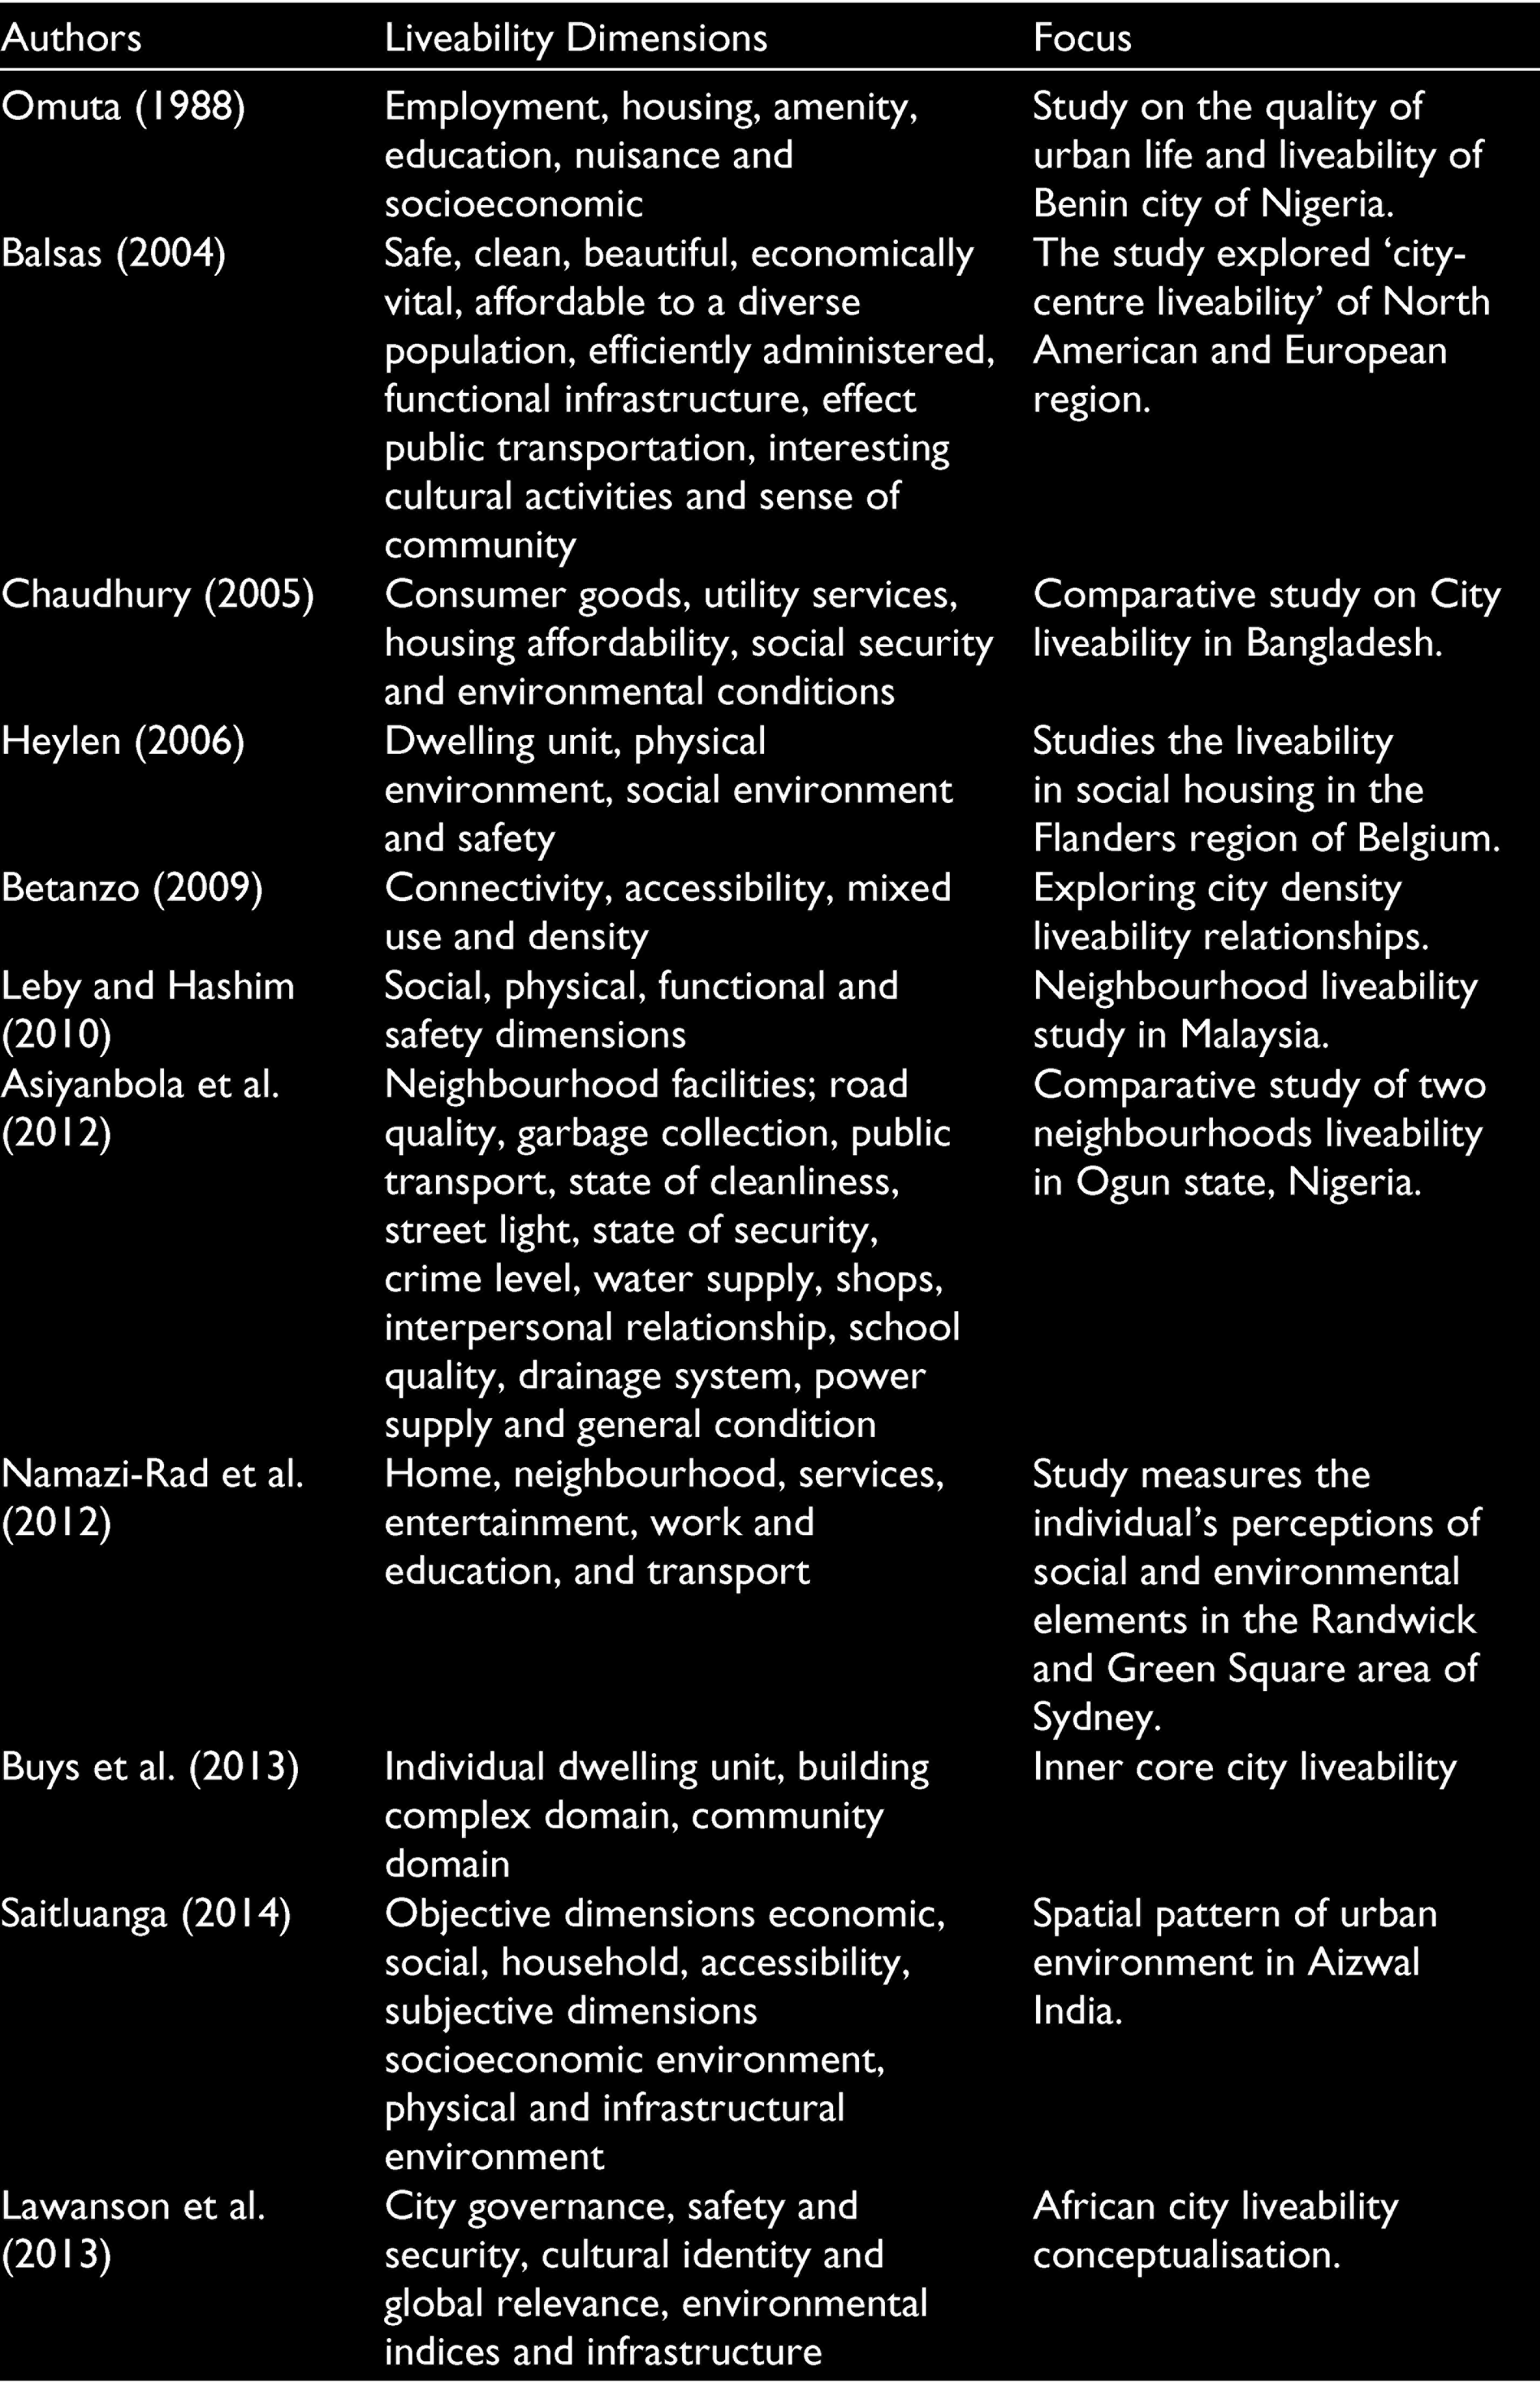
Cave and Wagner (2018), in their work Livable Cities from a Global Perspective, explained about Kevin Lynch’s ‘Theory of Good City Form’ which first attempted to give the dimensions of urban form, that is, ‘vitality’, ‘sense’, ‘fit’, ‘access’ and ‘control’, which contribute to the concept of liveable cities. Herein, the ‘vitality’ implies to the extent a city supports the vital functions, biological requirement and capabilities of the human beings. While ‘sense’ is form of the environment and human processes of perception and cognition, ‘access’ means the degree to which people have access to public services. Further, ‘fit’ refers to match between place and customary behaviour of people in an area and ‘control’ means pervasive phenomena of territorial occupation of space and time for discharging activities (Patil & Patil, 2016). For the context of this study, the authors comprehend the various dimensions associated with the assessment of liveability (in reference to Iyanda & Mohit, 2016), as shown in Table 1.
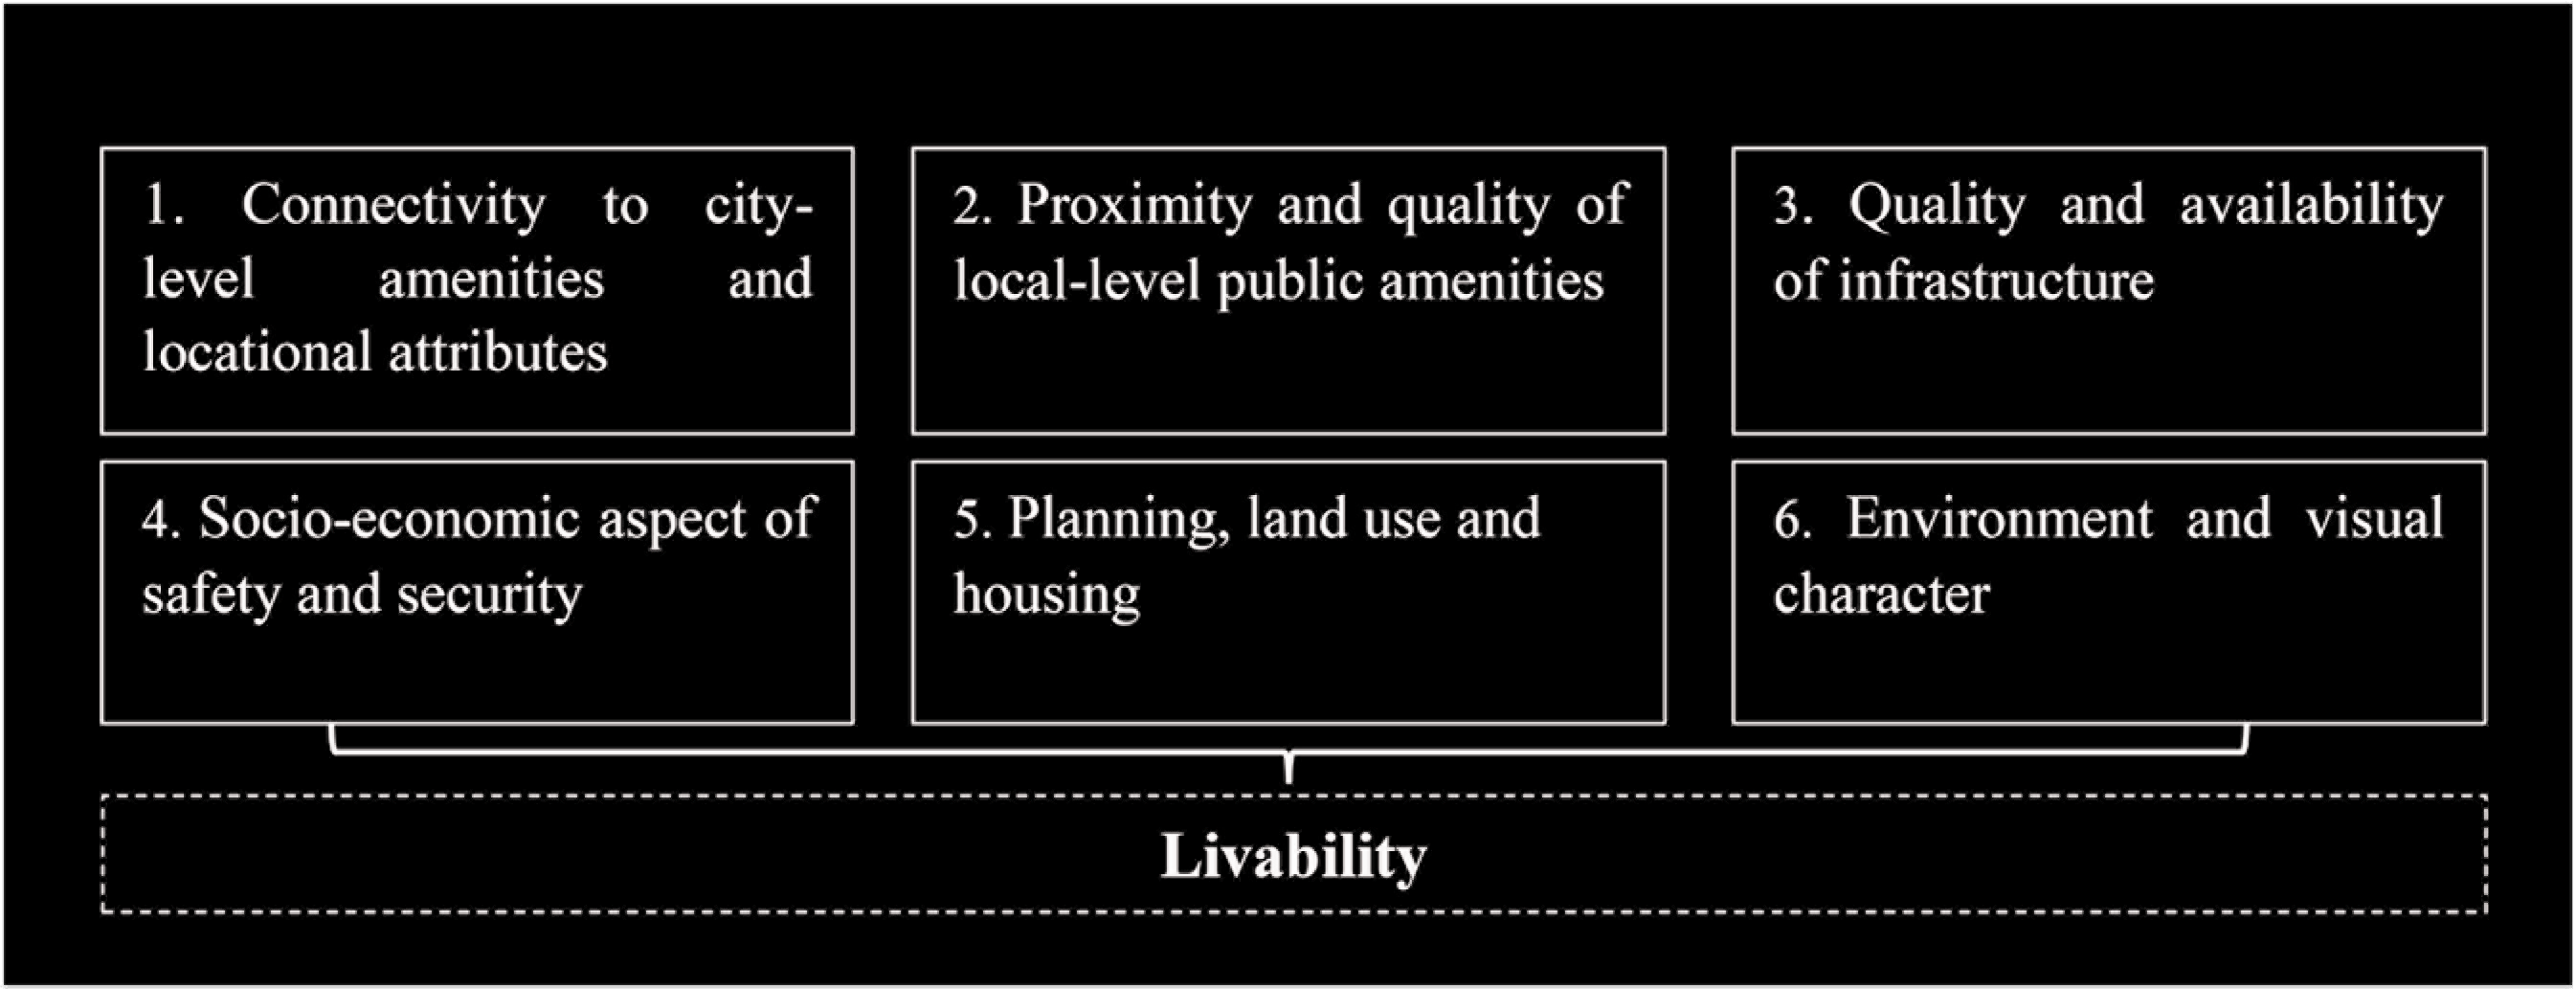
From Table 1, it can be implied that the dimension of the liveability slightly varies based in different regions of the world, but the essence remains the same. As mentioned by (Pacione, 2003; Saitluanga, 2014) liveability is a relative concept, ‘its precise meaning depends on the place, time, and purpose of the assessment and on the value system of the assessor’. For instance, in United States, liveability includes issues relating to ‘quality of life’ while in United Kingdom its focus is on the operational sense like cleaner, safe and greener agenda (Brook Lyndhurst, 2004). For understanding the liveability of Indian cities, Pandey et al. (2013) also conducted a thorough assessment of Bhopal city. The study comprehended the resident’s perception about the liveability into six major categories as shown in Figure 1. The first category here includes ‘connectivity to city level amenities and locational attributes’ which encompasses the aspects of connectivity and proximity to services while second involves ‘proximity and quality of local level public amenities’. The third category involves ‘quality and availability of infrastructure’ which includes availability of utility service and the fourth comprises of ‘socio-economic aspect of safety and security’. ‘Planning, land use and housing’ forms the fifth category whereas ‘environment and visual character’ forms the sixth category of attribute of liveability Pandey et al. (2013).
Dimensions of Liveability by Various Studies.
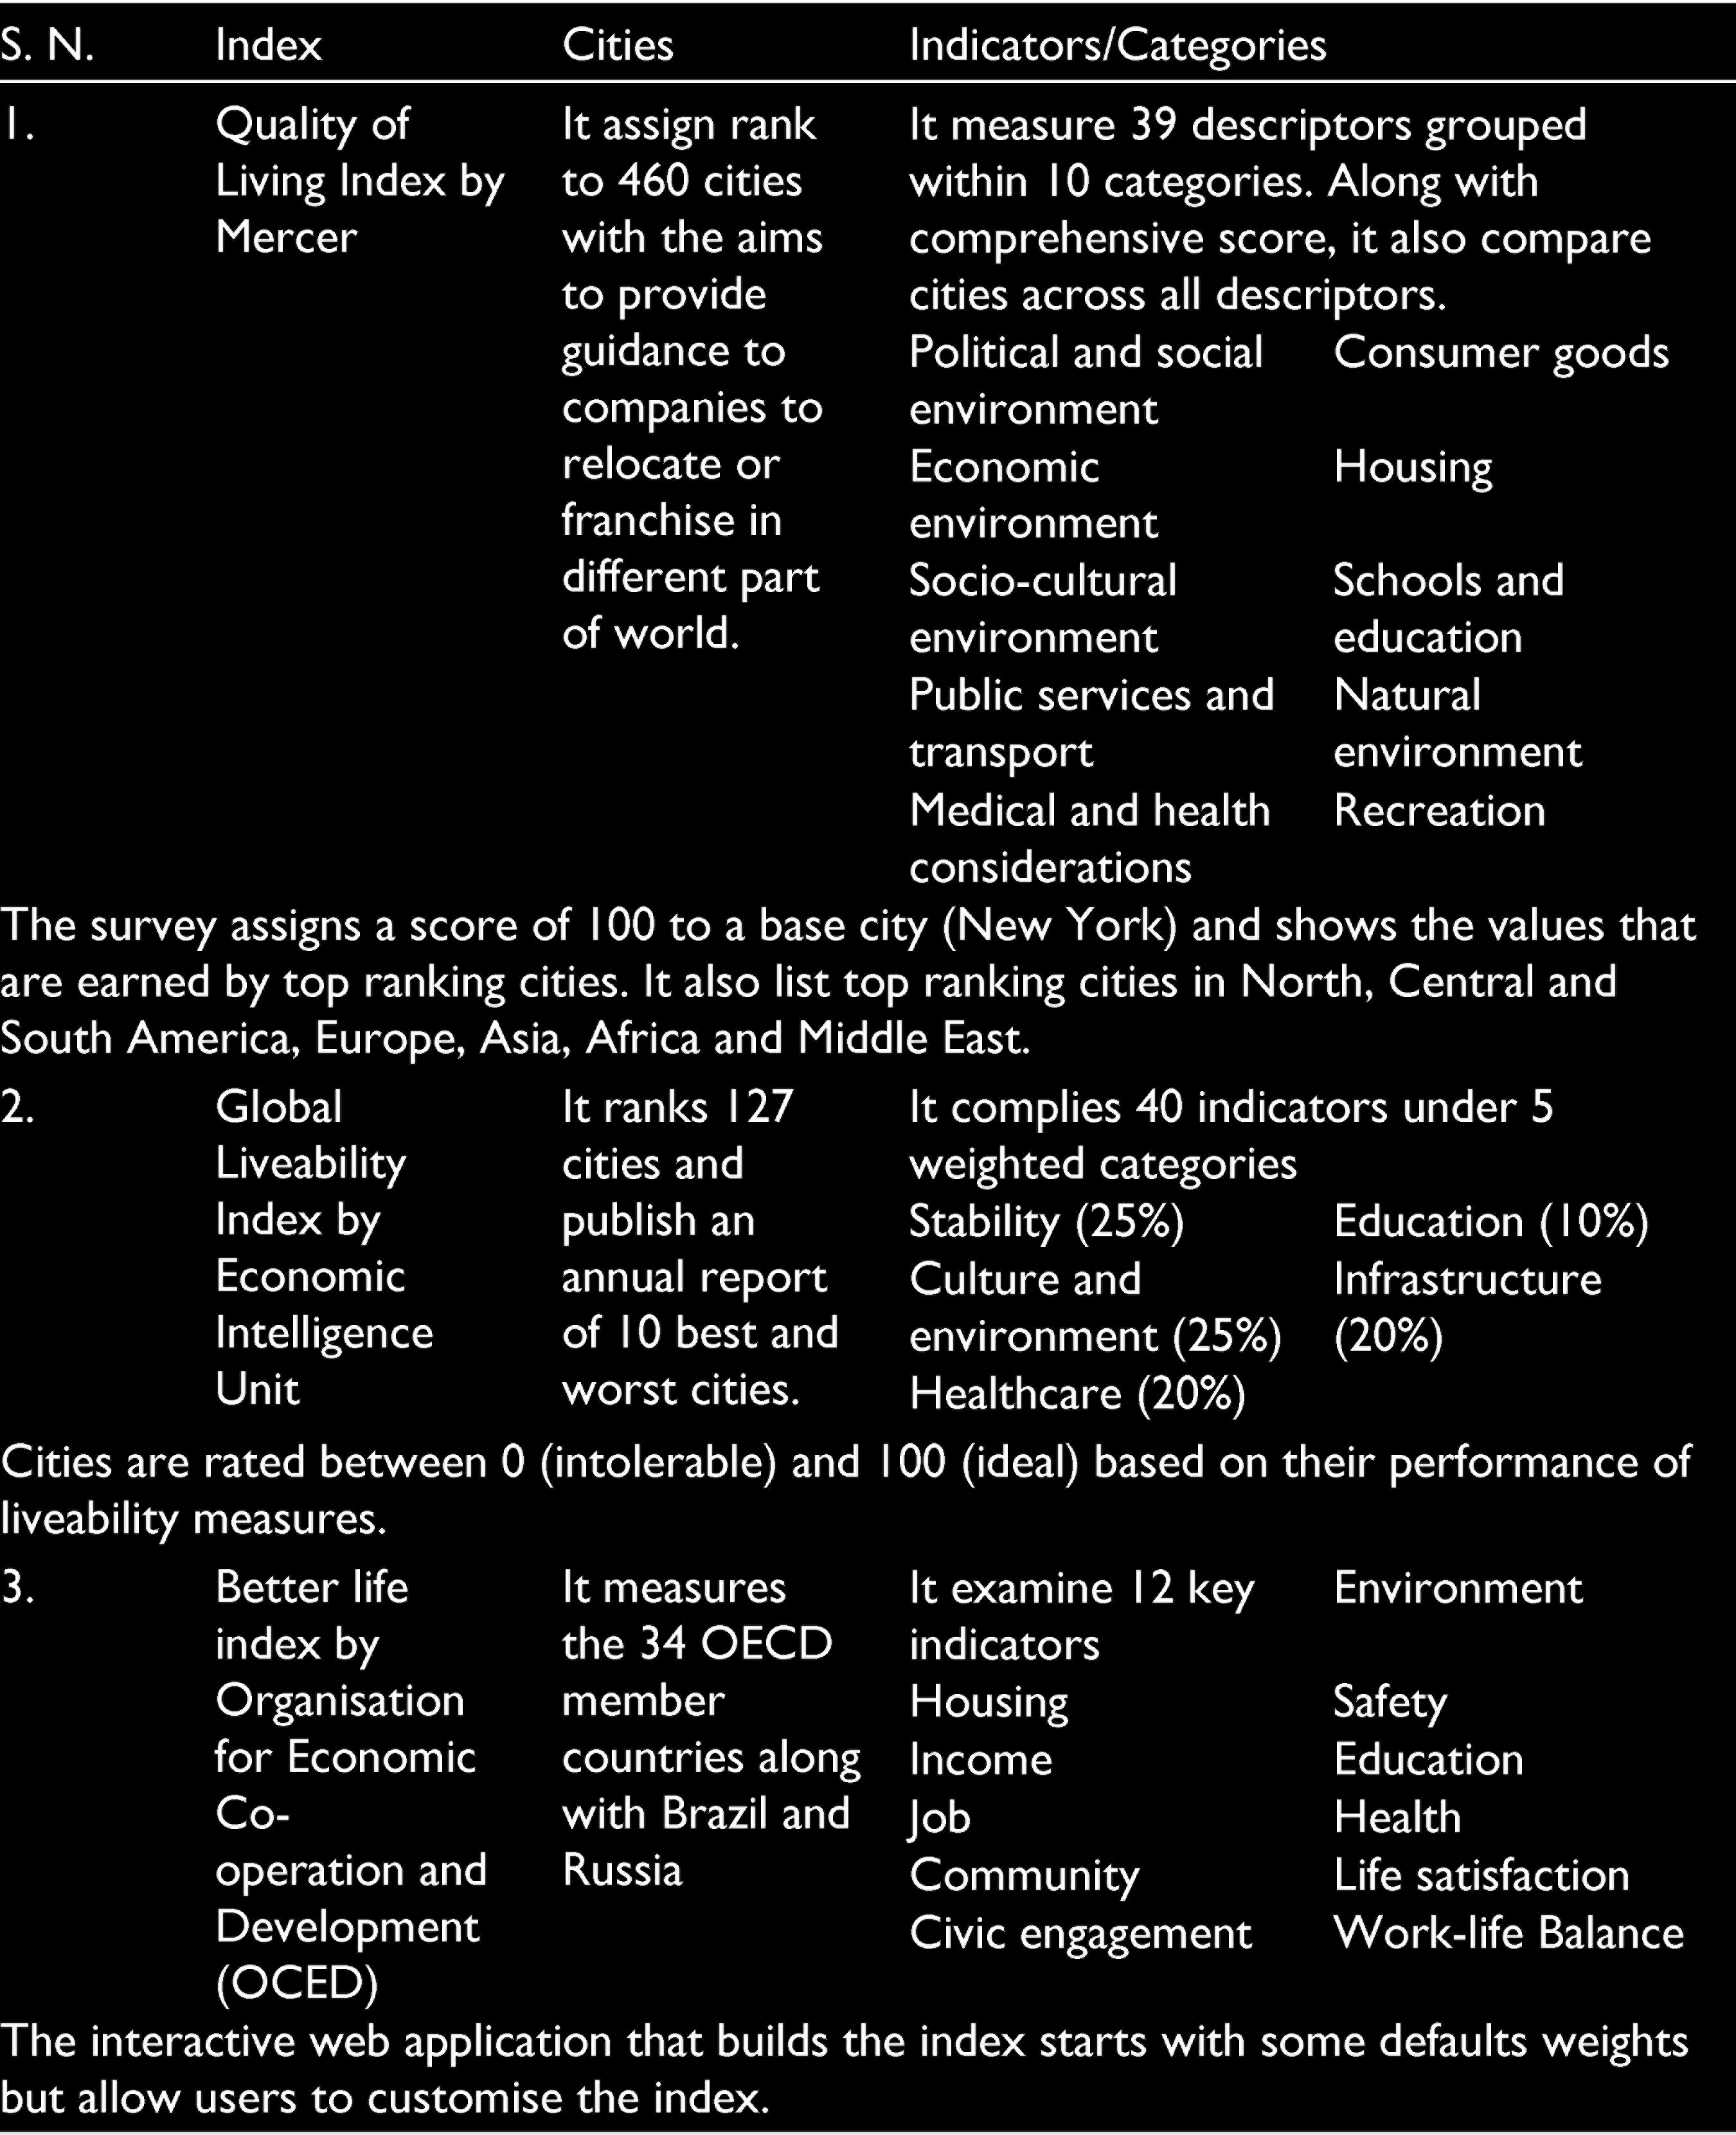
Similar to these, numerous indices and measurement tools were constructed, to rank cities based on the amenities and opportunities provided to its residents and visitors (Kashef, 2016; Marsal-Llacuna et al., 2015). Although various rankings reports have been published annually, the most popular indices are highlighted in Table 3.
Overall, these indices serve as a reference point to planners and policy-makers to facilitate good quality services to its residents, although liveability cannot be applied uniformly. In reference to these indices and dimensions of liveability identified by Pandey et al. (2013), eleven indicators clustered within five categories were identified for the assessment of liveability of Indian Tier-1 cities (elaborated further under ‘Research Methods’). Before the assessment, it is imperative to understand, how urban areas are associated with the Covid-19.
Covid-19 and Urbanisation
The outbreak of Covid-19 disease was first recorded in Wuhan city of China in late 2019 (Hamidi et al., 2020). Since then, within a short span of time, around 1,430 cities in 210 countries have been affected by the pandemic (Mishra et al., 2020b), and over 95% of Covid-19 cases overall are being reported in urban areas (United Nations, 2020). Considering the fast spread of disease and lack of proven treatment, different types of non-pharmaceutical interventions such as travel restrictions, lockdown, quarantine, social distancing and hygienic measure are being imposed by governments worldwide (Aguilar et al., 2020). Based on the past experience of cholera outbreak, plague and Spanish Flu, pandemics are primarily the outcome of urbanisation (Eltarabily & Elgheznawy, 2020). Discussions have therefore now started on enhancing the way our urban areas are designed. On 23 April 2020, the New York Time published an article, stating that Covid-19 virus has found breeding ground in the dense and big cities of America (Hamidi et al., 2020). Also, according to Brizuela et al. (2019) and Lak et al. (2020), urban design regulates the land use (residential, commercial) and thus, influences the travel pattern of population through which diseases are spread. Further studies are now assessing what makes urban areas more susceptible to Covid-19. According to Sharifi and Khavarian-Garmsir (2020), among the various urban forms and design which influences the spread of Covid-19, scholars have different opinions on the density and compactness of urban areas. For instance, as per Hamidi et al. (2020) and Boterman (2020), no significant correlation is observed between the density and Covid-19 cases, while Ren et al. (2020) and Lin et al. (2020) have established significant correlation between the variables. Due to inconclusive evidence and in consonance to the previous findings of other infectious diseases, it is generally believed that the density along with the other factors such as prevention and response measure impact the spread of Covid-19. Further, Moosa and Khatatbeh (2021), also stressed that Covid-19 spread depends upon interplay of various factors such as preparedness, timing, response to the Covid-19. Sharifi and Khavarian-Garmsir (2020) along with Khavarian-Garmsir et al. (2021) identified connectivity as one of the major factors which influence the spread of Covid-19 in the urban areas. It has been observed in case of Tehran that road density has significant impact on the Covid-19 morbidity and mortality rate.
List of Major Global Liveability Rating Indices.
Likewise, several studies have also been undertaken specifically in case of India, for instance, Mishra et al., (2020b), that assess the vulnerability of four major metro cities (Chennai, Delhi, Kolkata and Mumbai) of India by investigating the factors which tend to defeat the motive of precautionary interventions (social distancing and lockdown) to curb the Covid-19. The study devised a ‘Covid Vulnerability Index’, which incorporates variables related to Covid-19 interventions such as population density, no exclusive room, dilapidated room, water outside premises, latrine outside premise and drinking water from untreated source. It has been found in case of Mumbai that the purpose of Covid-19 interventions fails as people go out of their premises for toilet and water service. Pethe and Sharma (2020), in their study, have attempted to assess the connection between the urbanisation, slum and Covid-19 cases by applying the simple statistical tool, wherein a considerable positive correlation was between the three variables. Likewise, Patidar and Chothodi (2020) attempted to highlight how the characteristics of urban India such as population density, urban sprawl, intra urban commuting, problem of water, sanitation and housing and so on associate to the vulnerabilities of Covid 19.
Material and Methods
Study area
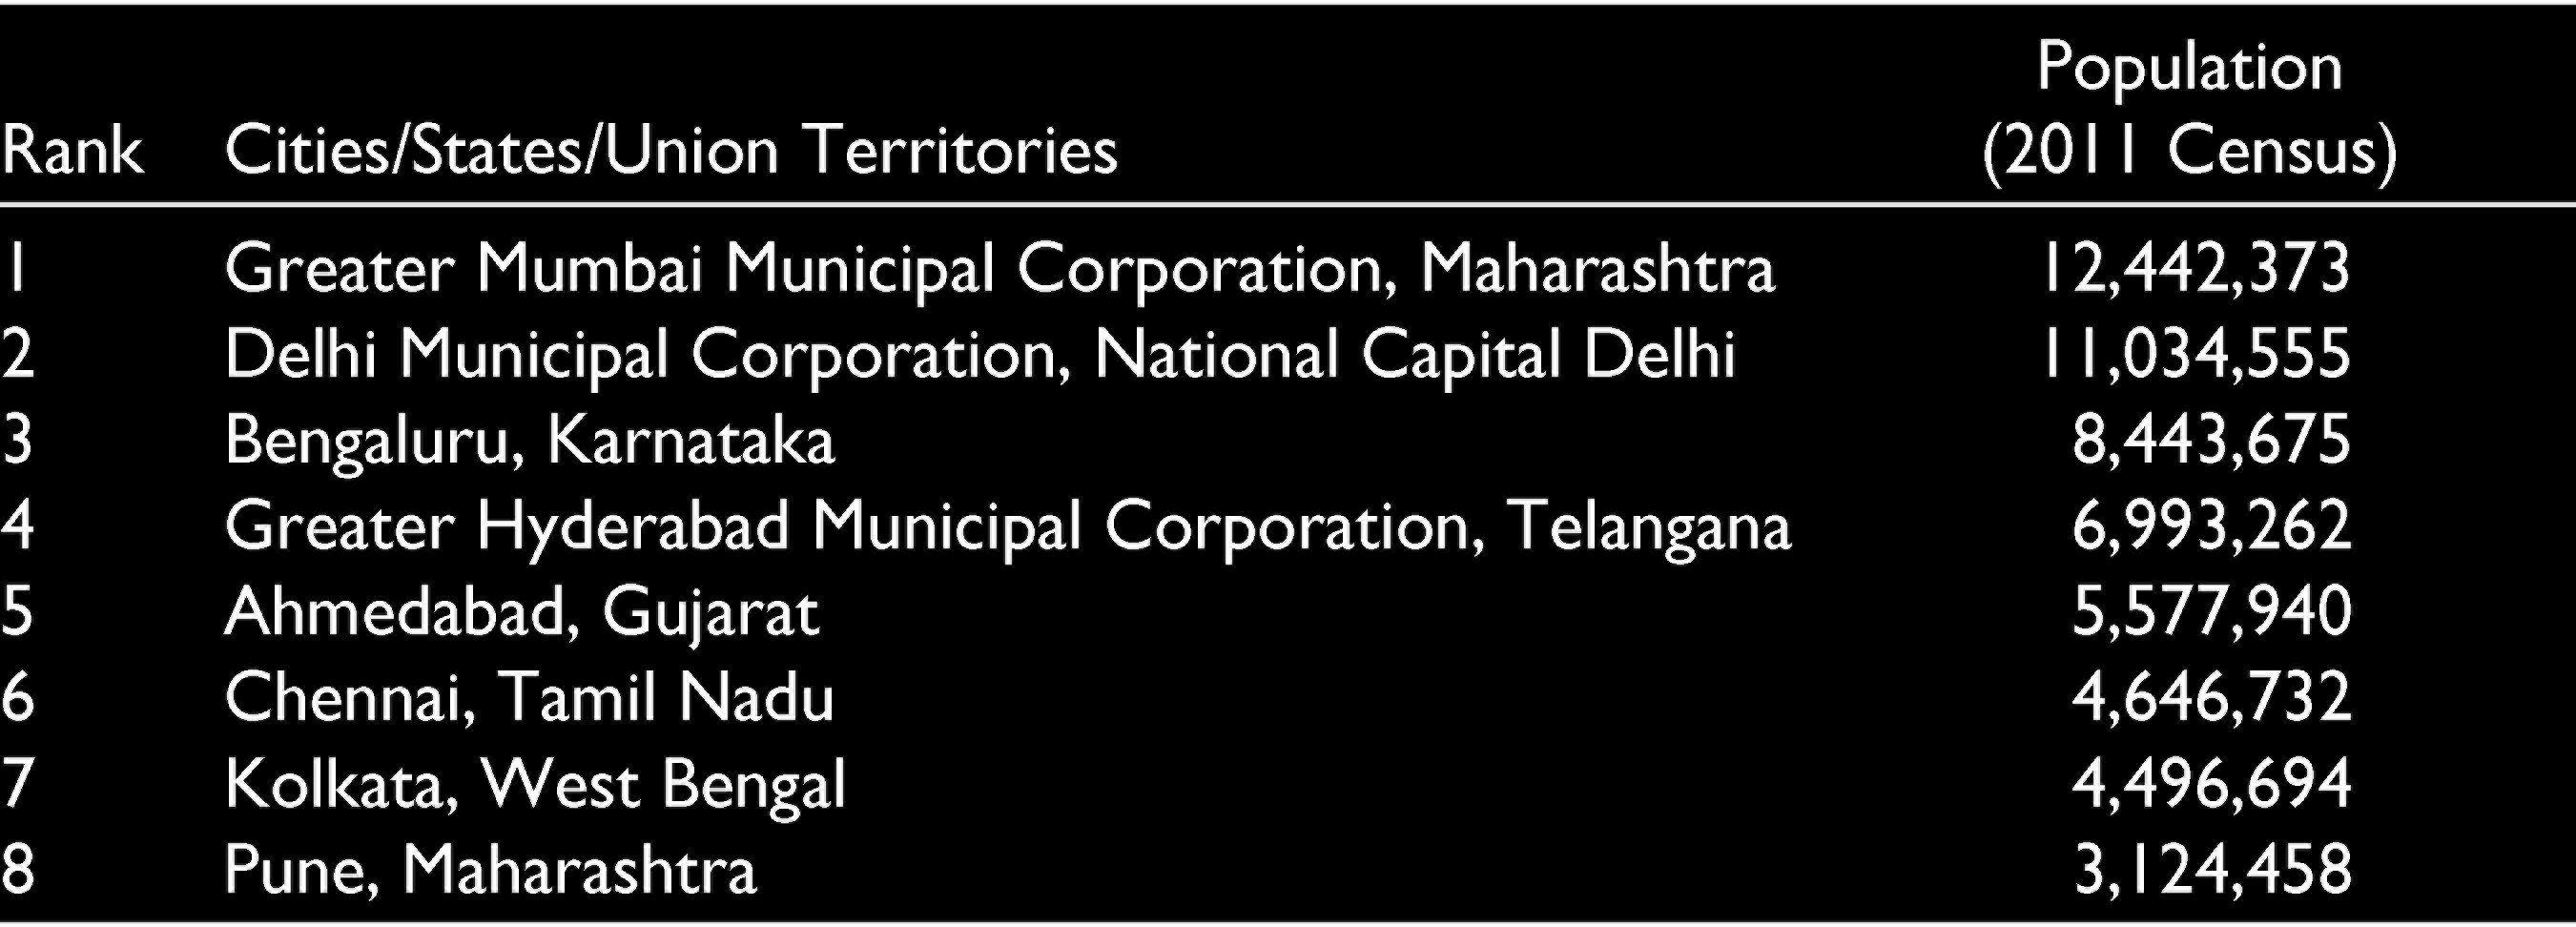
As per United Nations’ 2018 Revision of World Urbanization Prospects, India is estimated to add 416 million urban dwellers by 2050 (UN-DESA, 2018). Major metropolitan cities of India, namely Delhi, Mumbai and Kolkata, rank among world’s top 20 most populous cities (Norzom & Jacob, 2019). While the urbanisation trends in these major metropolitan cities are largely unplanned, the problems of sprawl, poverty, unemployment, sanitation and housing are very eminent (Venkatesham, 2015). To understand the liveability of these cities, based on the size of the population, Tier-1 cities of India are selected for the study (as shown in Table 3) which have a population of more than 100,000 as classified by the Census of India (2011).
Population-wise Rank of Tier-1 Cities of India.
Research Methods
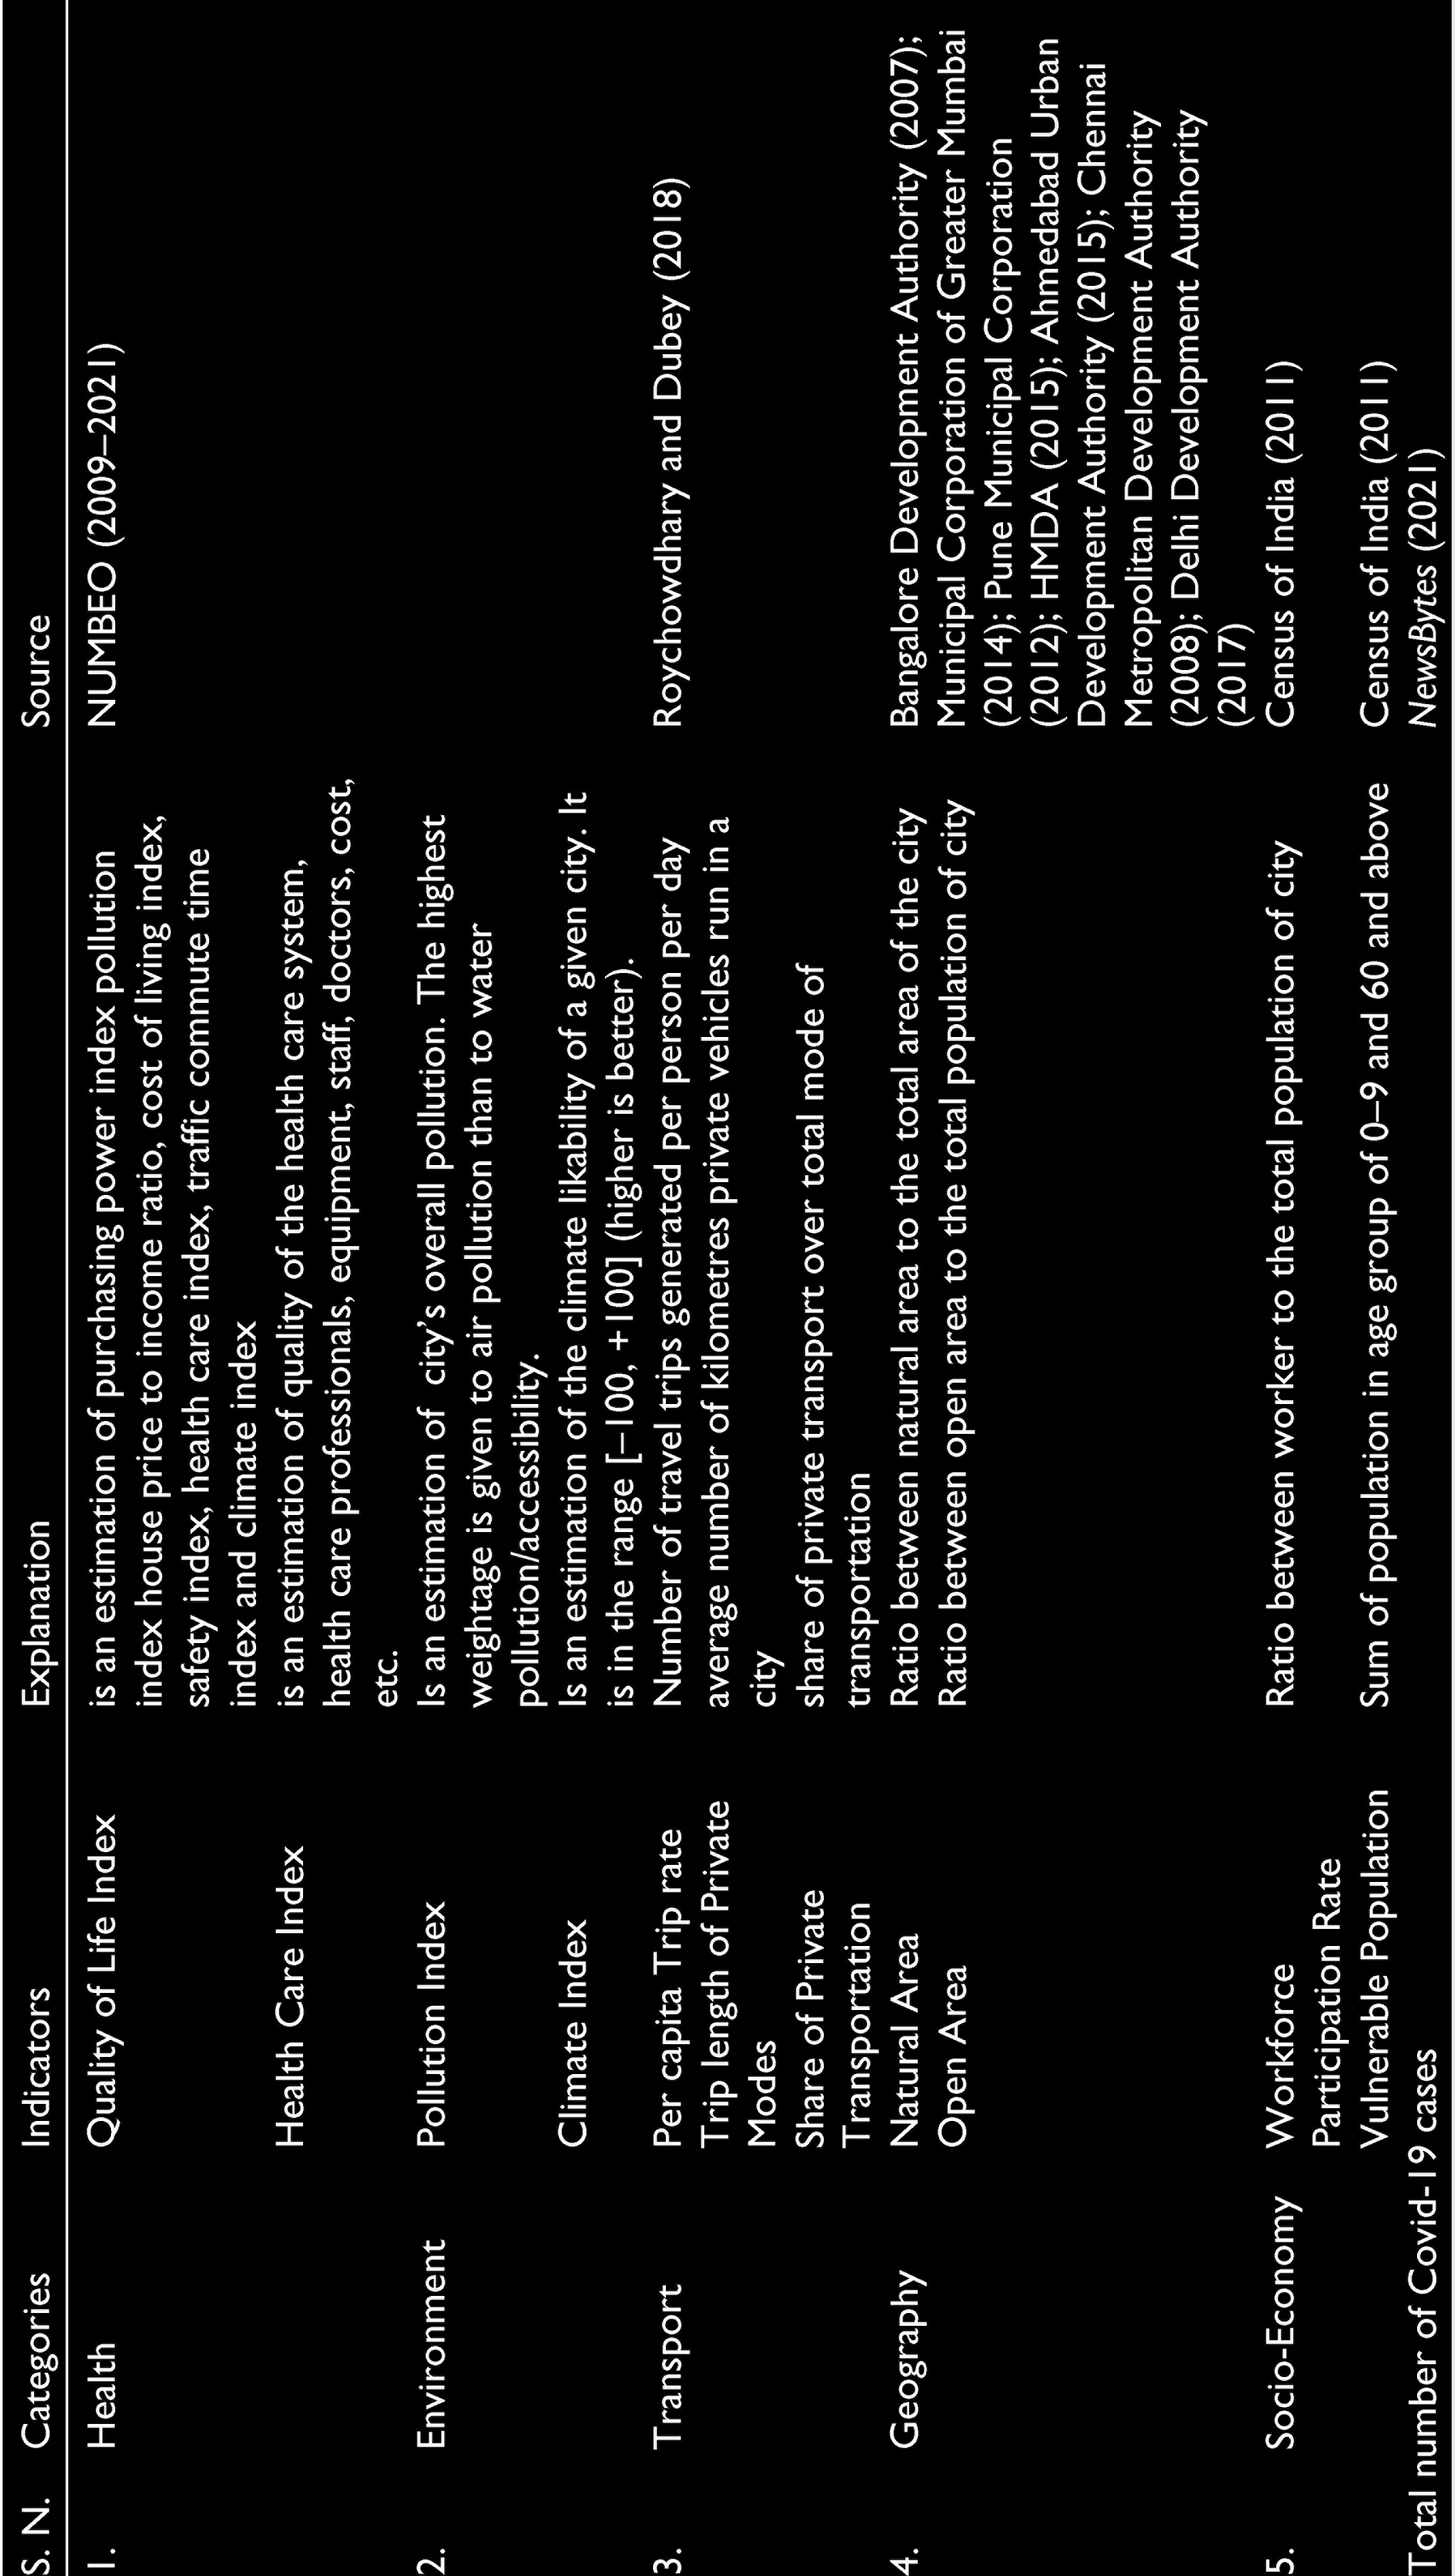
To measure the liveability of identified Tier-1 cities, eleven indicators are grouped within five categories of health, environment, transport, geography and socio-economy, which are identified based on the literature studies as explained in Table 4. Although there are number of indicators to study the liveability of cities (as discussed under ‘Definition and Measurement of Liveability’ in this article), the research was carried out using the following eleven indictors due to availability of data across all the cities, spatially and temporally without the use of proxy indicators or different dataset for same variables.
List of the Categories and Indicators Identified for the Liveability Index.
The calculation of the liveability index primarily involves four steps which are as follows:
Collection and preparation of data: To calculate the liveability index different sets of secondary data are referred to as mentioned in Table 3. Along with a collection of data, this step also involves the arrangement of data into a spreadsheet, with the columns containing the list of indicators and rows includes the details of the identified Tier-1 cities. Further indicators are be arranged in a consistent direction. Standardisation of the indicators: This step is performed to adjust the varying metrics and scales of indicators. Indicator score for each unit is standardised as described in formula
here I is the value of an indicator for a unit; max (I) is the maximum value of I the indicators overall units; min × (I) is the minimum value of I overall units minus a small value or chosen values as discussed below and Is is the computed standardised value of I and will satisfy 0 ≤ Is ≤ 1. The amalgamation of standardised indicators: Once the values of IS are obtained for all indicators, the next step is to amalgamate the IS into a single, composite index. The composite index is calculated by arithmetic mean method of the values of Is for each
Here Correlation: Once the values of Is are derived for all indicators, the next step involves the calculation of correlation of individual Is and composite index with the total number of Covid-19 cases of the Tier-1 cities.


Results
This section of the research discusses the findings obtained through the statistical analysis. The results of the correlation are discussed category wise in Table 5. Herein, the value between 0.5–1 signifies strong positive correlation and the value between 0.3–0.5 signifies weak positive correlation. While values ranging between –0.3 and –0.5 indicate weak correlation and values ranging between –0.5 and –1 show strong negative correlation. While values between 0.3 and –0.3 show no correlation.
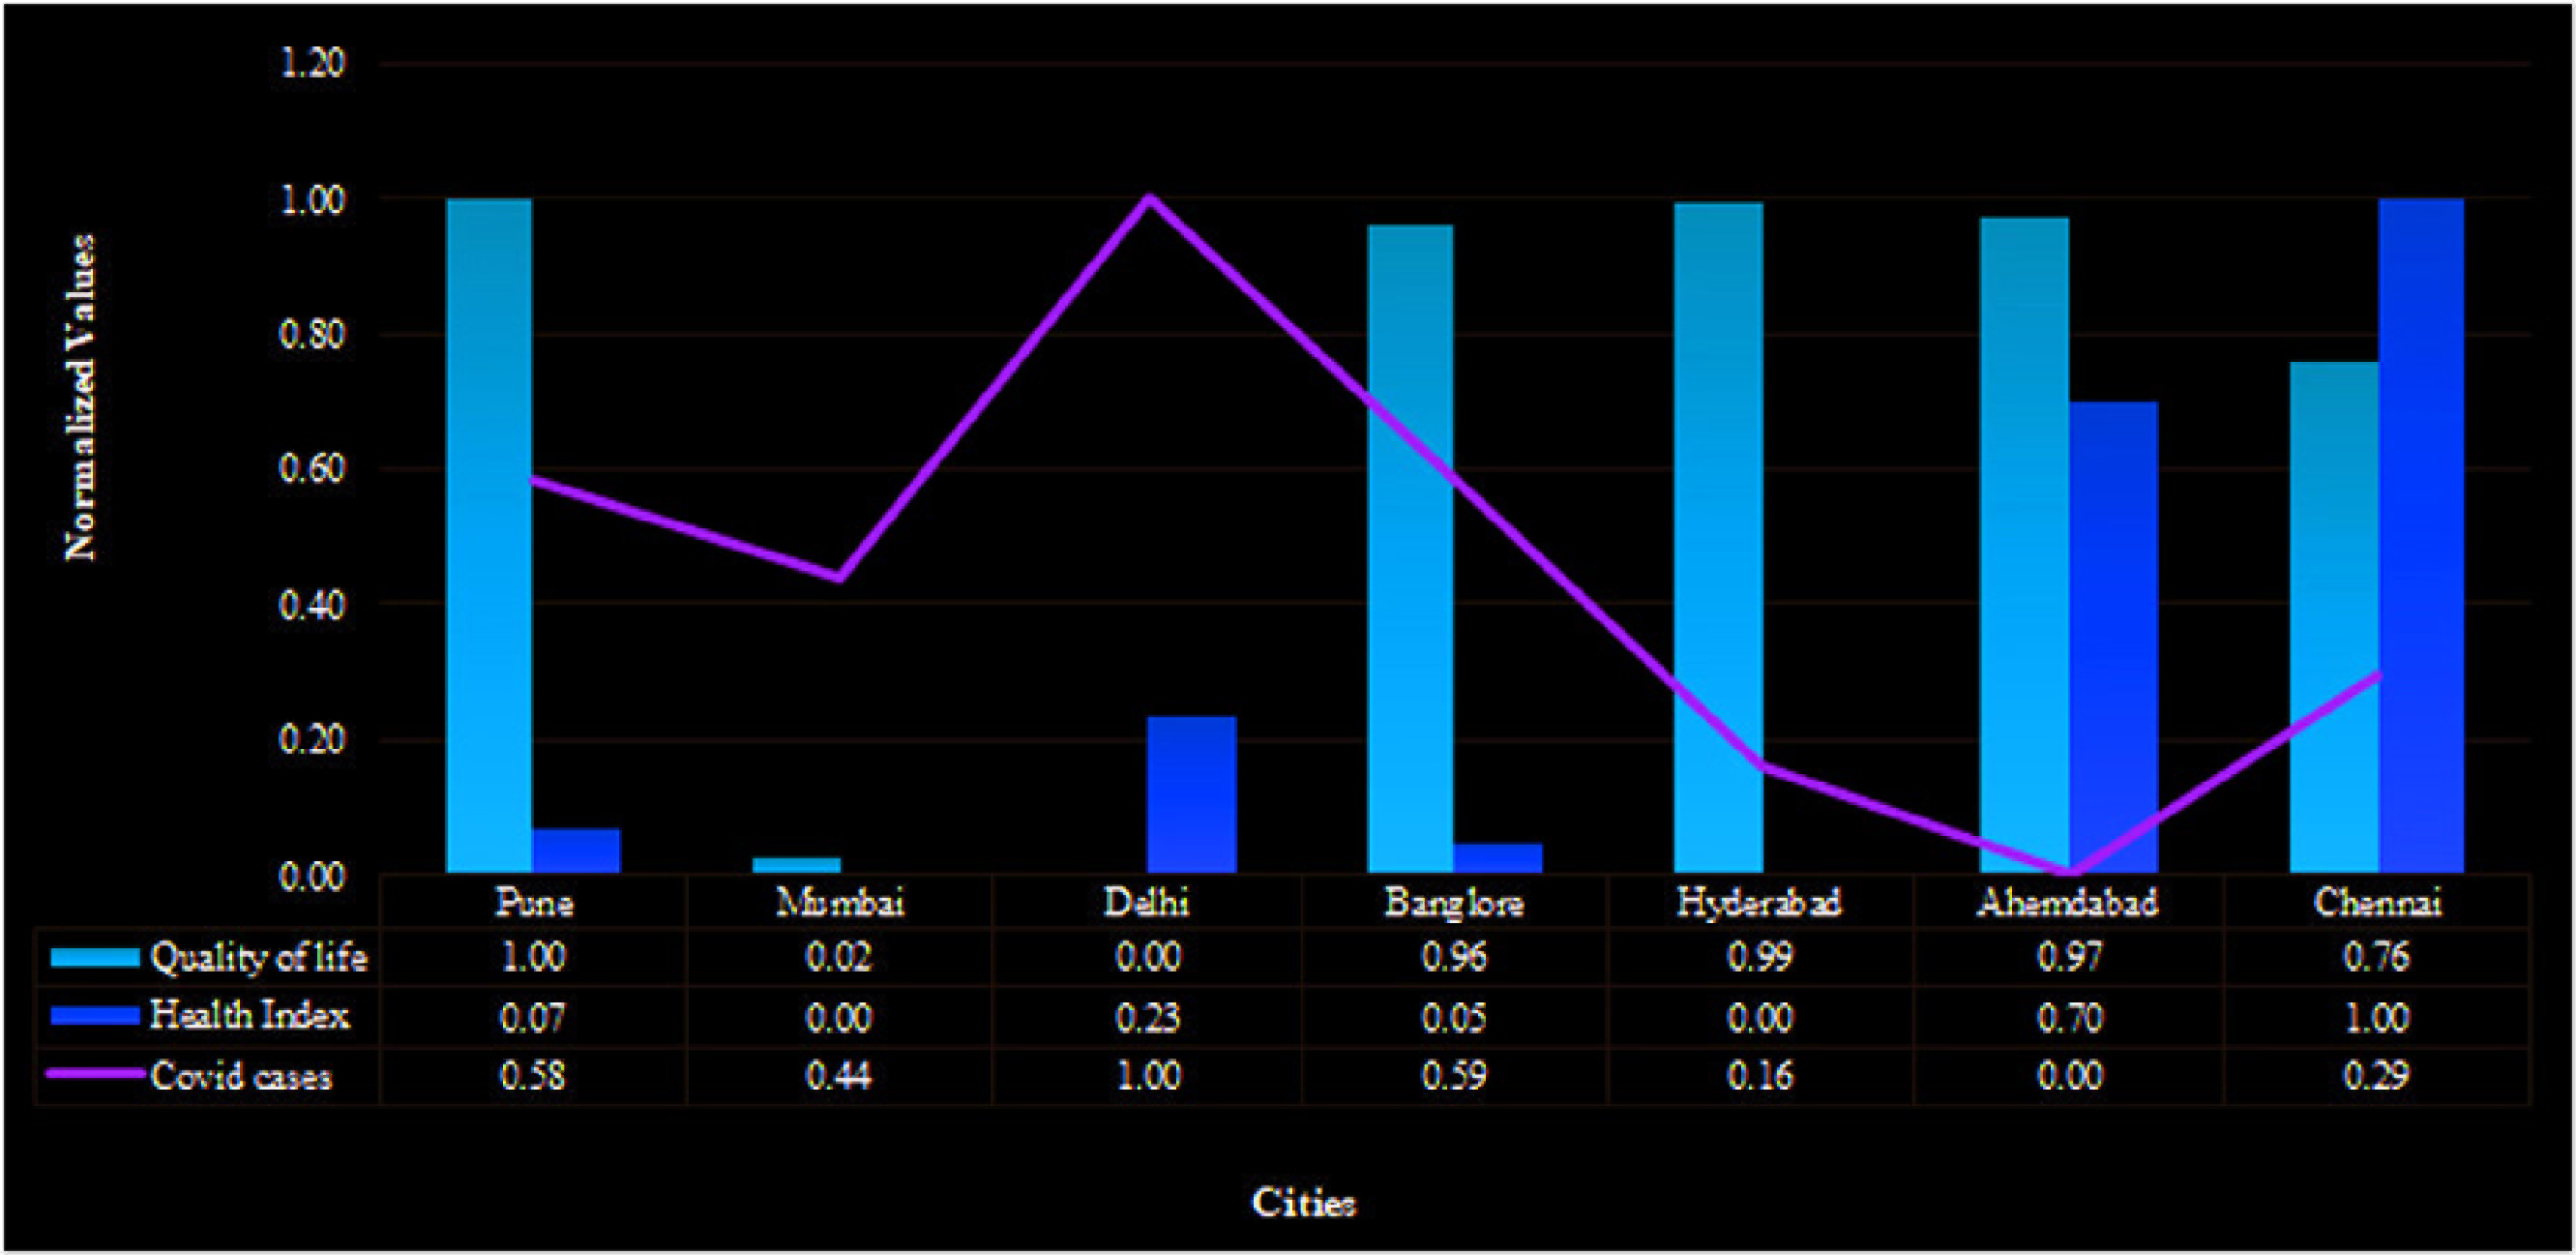
The health category had two indicators studied against their impact on Covid-19 spread. Quality of life index is an estimation of overall quality of life taking into account various factors such as health care, purchasing power, pollution levels, cost of living, safety and climate. It is observed that a negative correlation of –0.58 exists between the quality of life and Covid-19 cases. In other words, better the quality of life in the city, less are the people impacted due to Covid-19. It can be seen that Ahmedabad, Hyderabad and Pune have a good quality of life among the Tier-1 cities while Delhi has the worst. Inter-alia, the Covid-19 cases are highest in Delhi and lowest in Ahmedabad and Hyderabad. Further health care index estimates the overall quality of the health care system, the professionals involved, and their equipment’s and costs. The health care index shows a weak negative correlation of –0.38, indicating the importance of health infrastructure in the control of Covid-19 spread in the city. This indicates that better the health care system in the city, better the cities are able to control the pandemic spread. It can be inferred from Figure 2 that the cities which are performing good in either of the two indicators have lower Covid-19 cases compared to others.
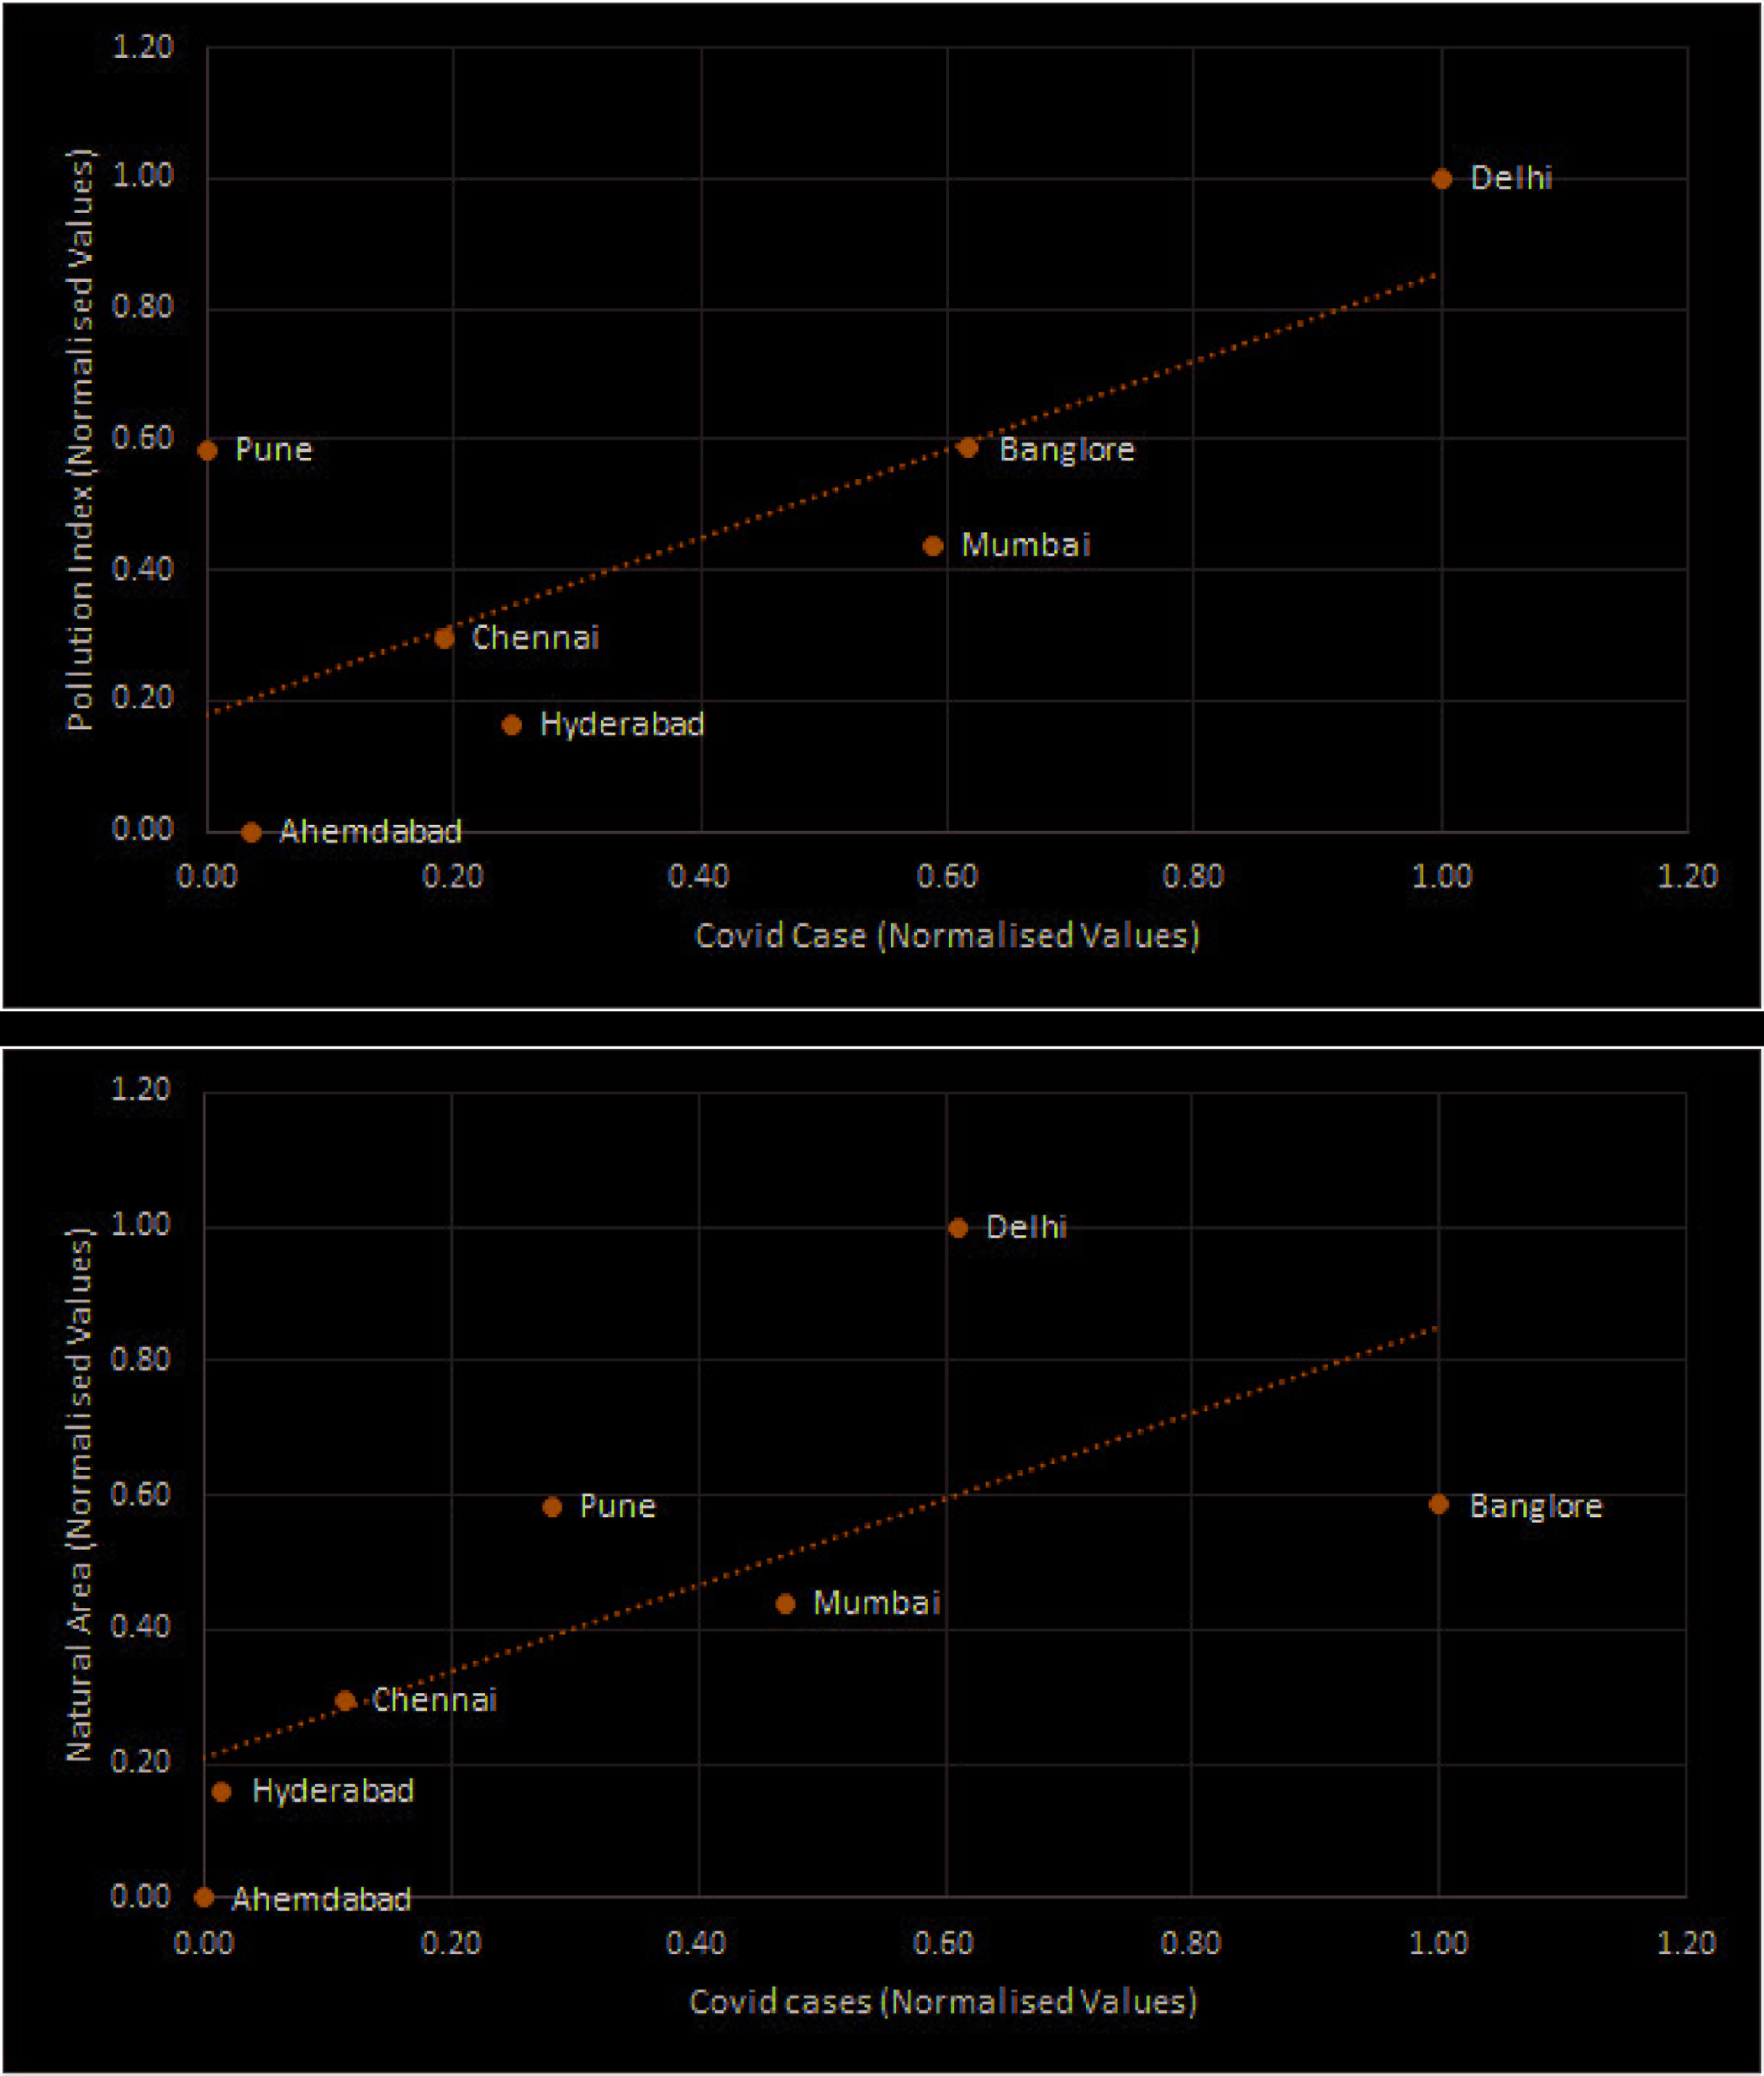
As discussed under ‘Research Methods’ of this study, the pollution index and climate index are taken for analysing the impact of the environment on the Covid-19 spread in cities. Pollution index estimates the overall pollution in the city with the biggest weight given to air pollution, followed by water pollution and then others. It is detected that a very strong positive correlation (0.75) exists between the pollution index and Covid-19 cases, which means that the spread of Covid-19 increases with the pollution levels. This positive correlation in Tier-1 cities of India is in line concurrence with various studies conducted (Ali & Islam, 2020; Copat et al., 2020). Delhi has the highest pollution level amongst the selected cities and least three are Pune, Ahmedabad and Chennai. It is observed in Figure 3a that the Covid-19 cases are less in these cities compared to others, and Delhi has recorded the highest number of cases. Climate index which indicates climate likeability is found to have no correlation with the Covid-19 cases with a correlation value of 0.28, which indicates that the Covid-19 spread may not be related with the climatic conditions of the area. Three indicators are taken under transport majorly indicating the compact nature of the city—per capita trip rate, average trip length and share of public transport—all of which are found to have no correlation with the Covid-19 cases with a value of 0.14, 0.06 and –0.37, respectively (refer Table 5). As per the hypothesis, these indicators must show a strong positive correlation for the spread in Covid-19 cases; however, it has to be noted that the Government of India imposed a nationwide lockdown to contain the spread of virus due to which the transportation trips were at halt. The essential services such as food and medicines are provided to the population at doorsteps. Also, trips for other purposes such as education, work and health were stopped due to restrictions in the movement.
Correlation Between the Number of Covid-19 Cases and Identified Indicators of Liveability.
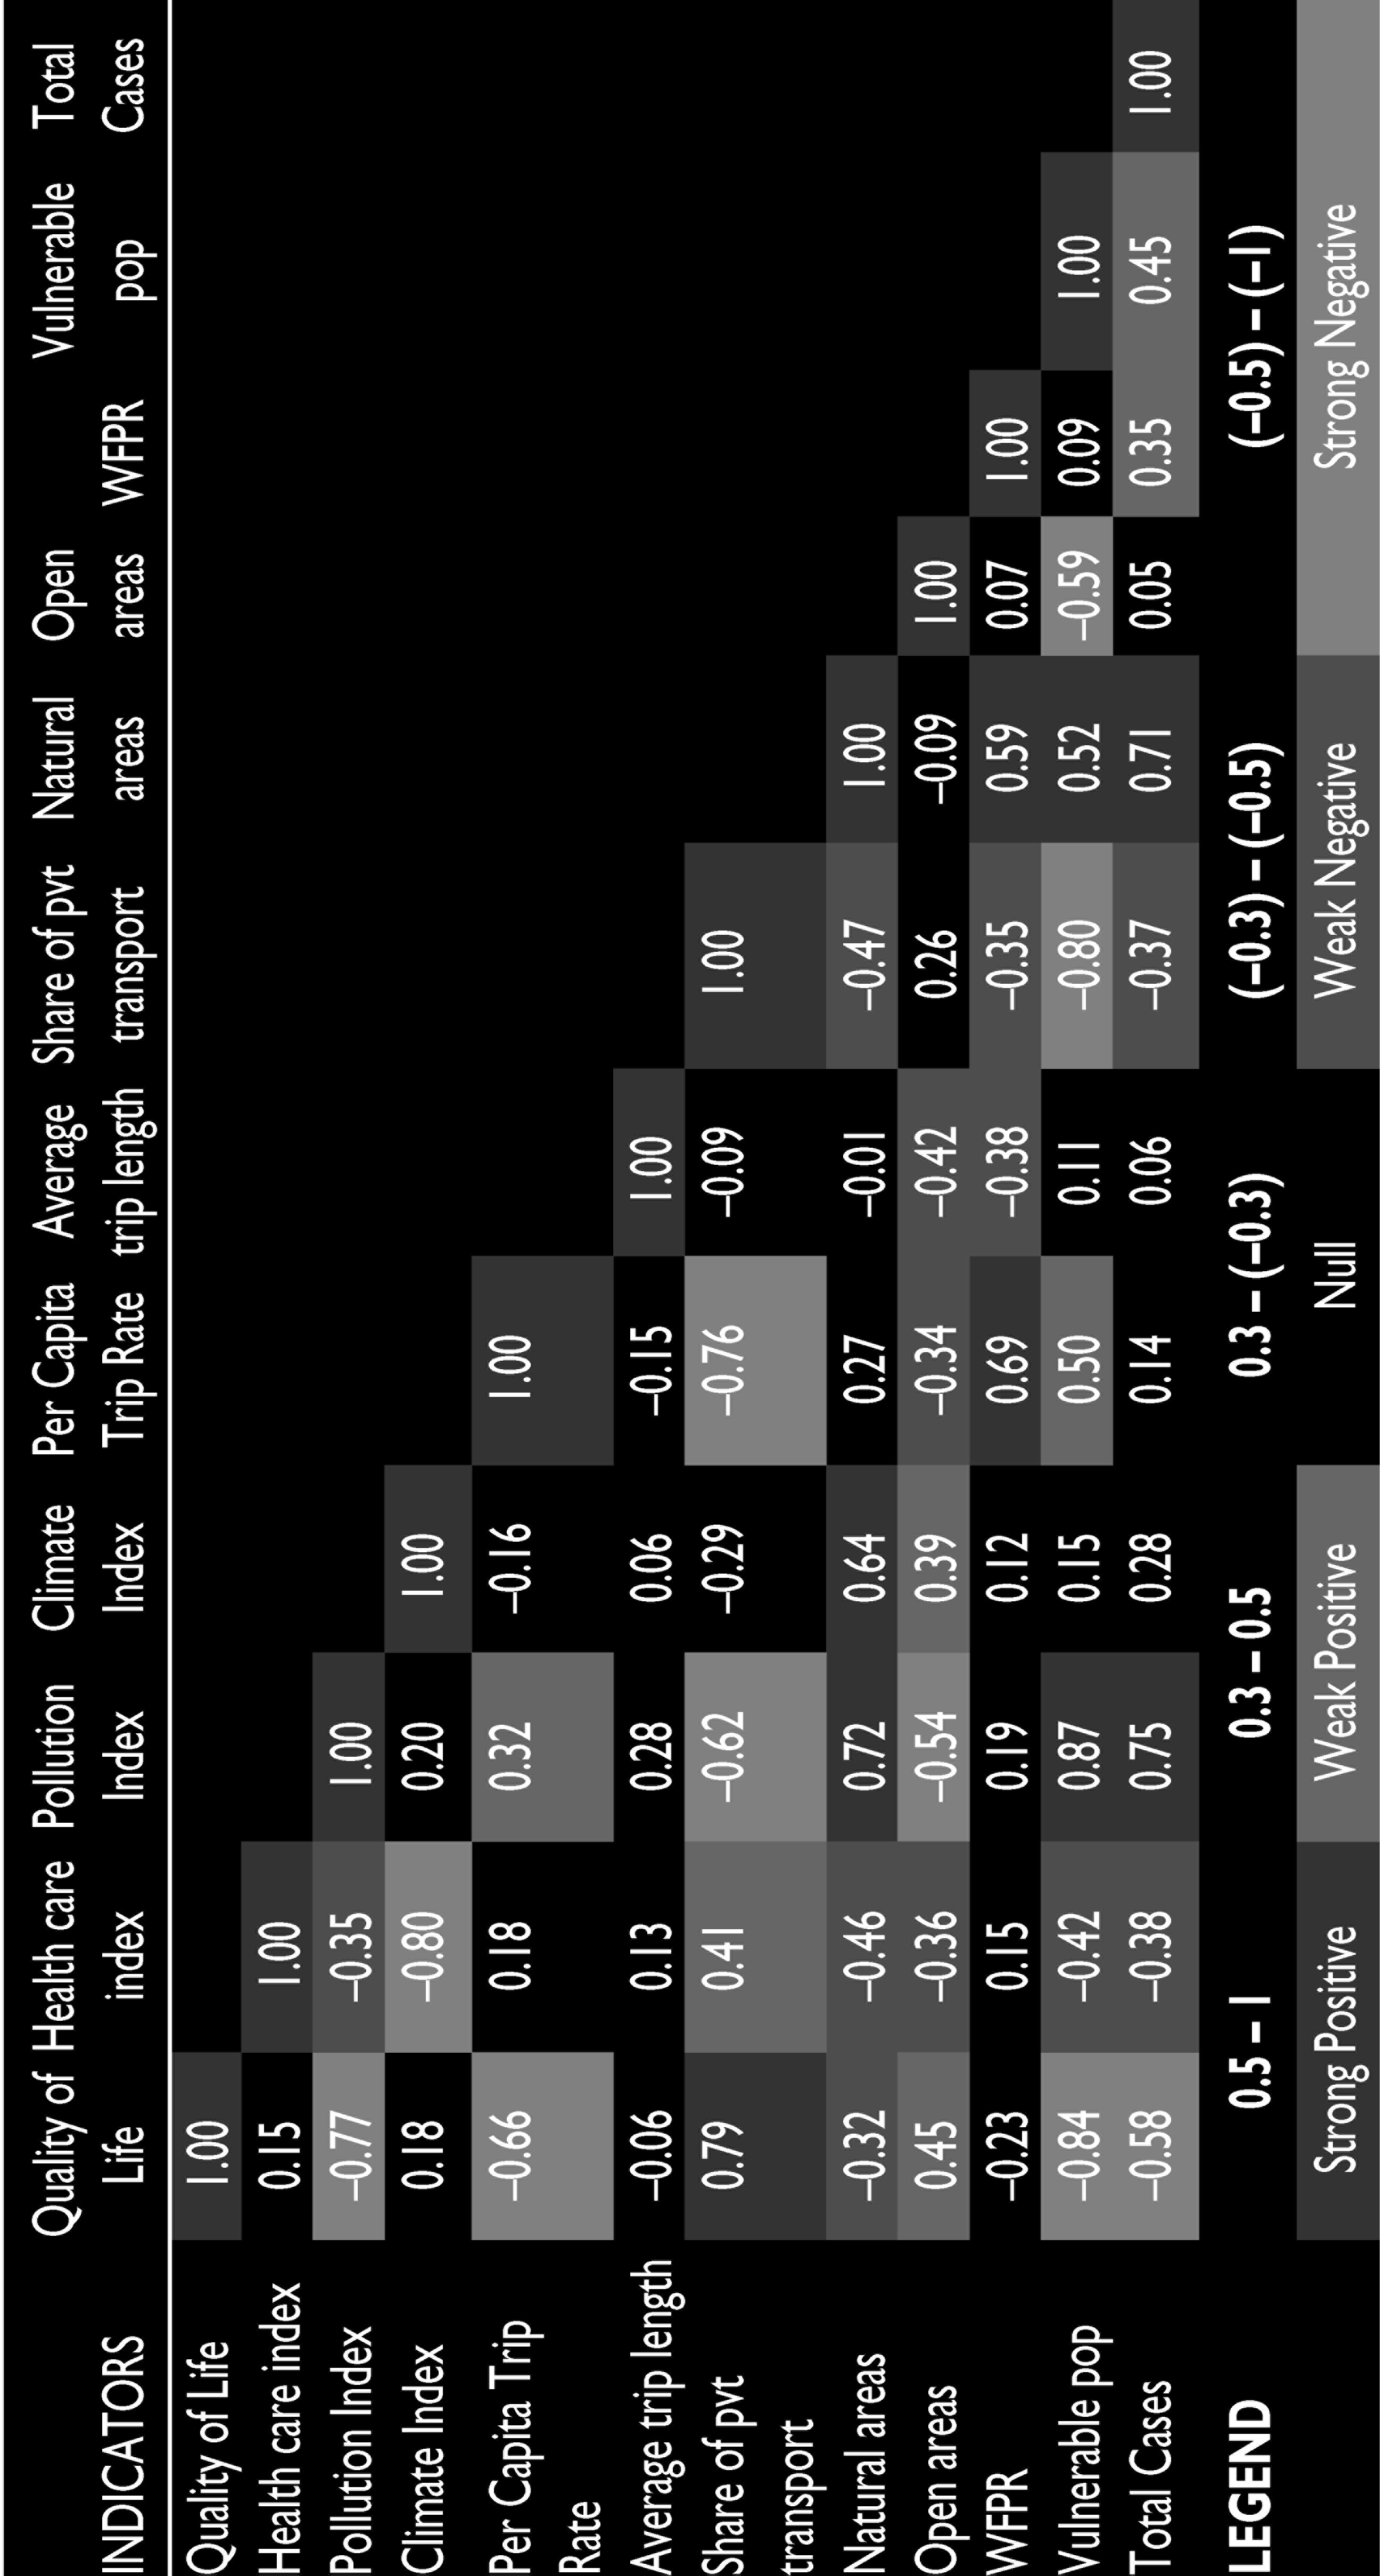
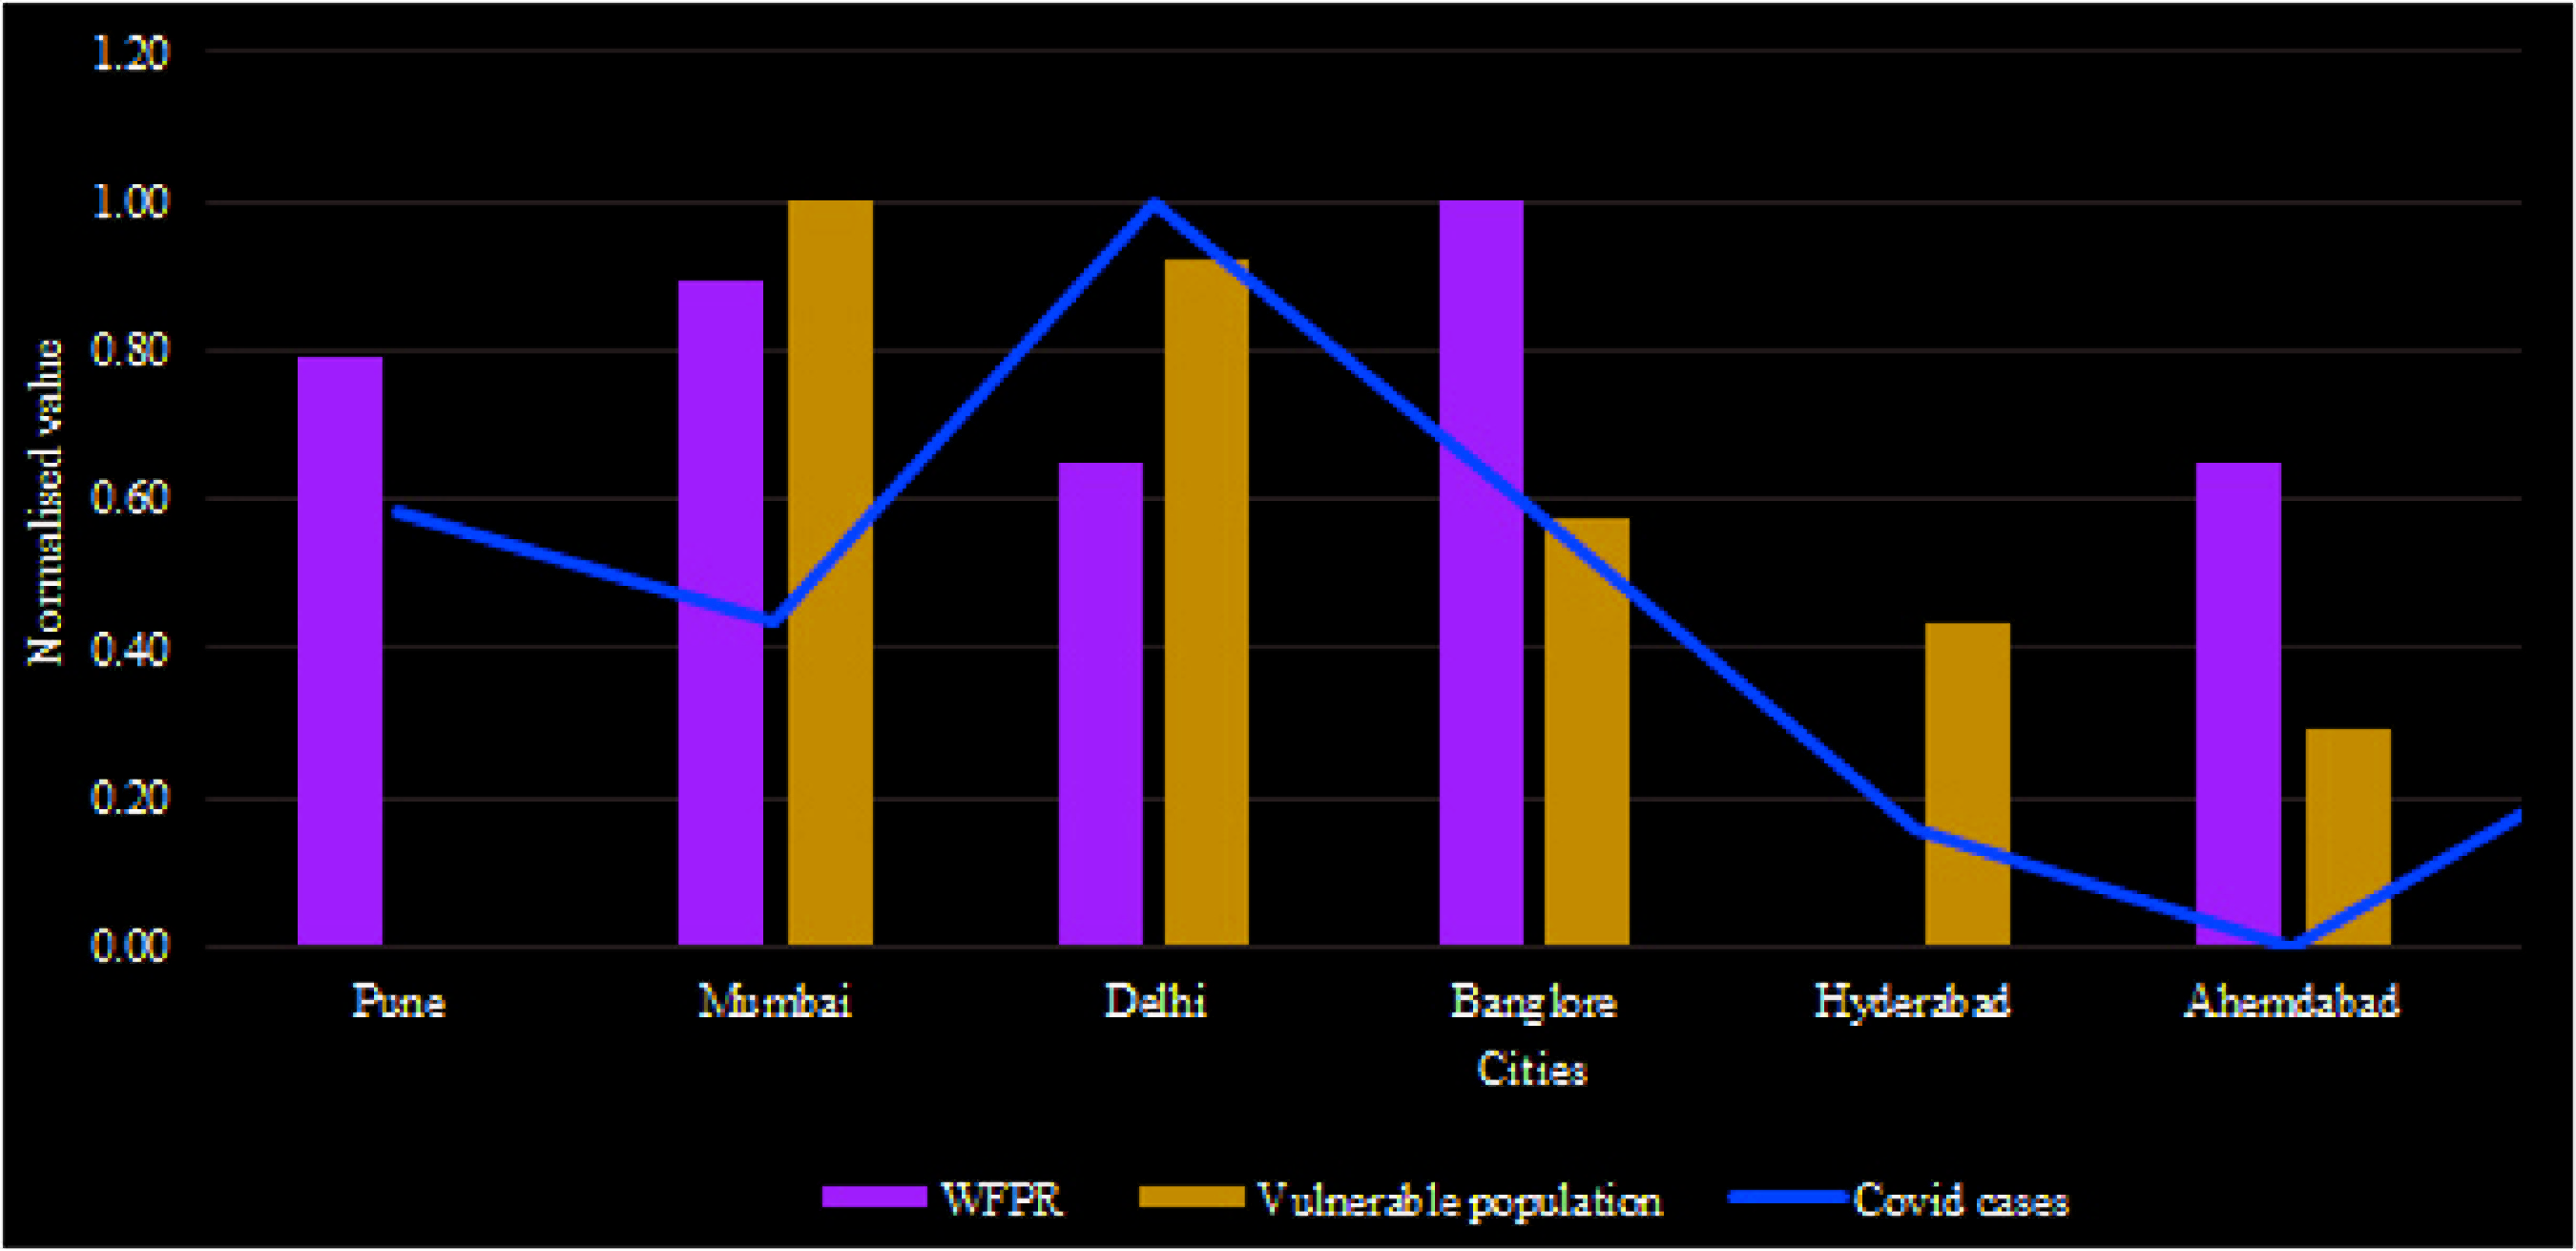
The geographical characteristics of the city deal with its physical attributes. The percentage of natural areas present in the city represents a lesser amount the habitable land available for the people to reside. It is noted that more the percentage of natural area to the total area present in the city, more are the Covid-19 cases, as there occurs a positive correlation of 0.71. This means that those areas where natural spaces occupy more land, due to high urbanisation rates the population density increases as the total city region is the summation of natural areas and habitable areas. This can also be attributed to the fact that the slum areas in the city are also concentrated in and around these natural areas only. Bangalore and Delhi have a high percentage of natural areas as mentioned in Figure 3b, while Ahmedabad and Hyderabad are lowest. As per a WHO (2020) report, the Covid-19 virus spread through the saliva droplets of an infected person. Thus, the research included an important parameter to understand the compact settlement pattern of the city’s neighbourhoods, per capita open spaces but no correlation with the Covid-19 cases was observed with a correlation value of 0.05. The socio-economic characteristics of the population have a direct impact on the Covid-19 spread. As it was highlighted that the most vulnerable groups to the infection are children and old age, the research found that the percentage of vulnerable population to the total population has a strong positive correlation of 0.45 with the Covid-19 cases. This means higher the vulnerable group in terms of age, higher are the active cases in the city. Also, it is observed that the workforce participation rate has a weak positive correlation of 0.35 with active cases. It is observed in Figure 4 that the Hyderabad, Bangalore, Ahmedabad and Chennai had the lower vulnerable population and have less active cases.
Discussion and Conclusion
These research findings provide an important insight that a significant relationship exists between the individual categories of liveability with the number of Covid-19 cases. As noted from the result of correlations analysis, it has been observed that liveability when looked from the perspective of health and environment has less Covid-19 cases. Thus, better quality of life, proper and adequate health infrastructure and fewer pollution levels in a city makes it resistant to the contagious pandemic like Covid-19. From the perspective of transportation, no well-defined correlation could be obtained likely due to the restricted movement during the lockdown and the development of ‘work from home’ scenario. Furthermore, the presence of more natural areas in the city has led to more Covid-19 cases: This can be attributed to the fact that these Tier-1 cities accommodate a large population share within their limits and due to high demand for land the people are living at high densities which leads to spread of more contagious diseases. Based on these findings, major emphasis should be laid on dimension of liveability which can contribute to control the spread of Covid-19 cases in cities.
With the growing impact of unplanned urbanisation, it is imperative to maintain the liveability of cities. By evaluating the liveability of Tier-1 cities of India, this study attempted to understand the dimensions which contribute to the liveability of cities. Through the literature review, the study underlines that the concept of liveability is gaining the prominence in sustainable urbanisation. For the evaluation of liveability, eleven indicators of liveability were identified based on the previous studies of Indian cities. Further correlation has been established between the identified indicators and number of Covid-19 cases of Teir-1 cities. It has been found that significant relationship is existed between the individual categories such as quality of life and health index. The authors further acknowledge that this study has certain limitations and findings may not ne generalised to other context. The identification of the liveability indicators are largely based on the secondary survey with a limited set of indicators. There is further scope of assessing the liveability of Tier-1 cities based on other indicators. However, to the author’s knowledge, it is one of the attempts to evaluate the liveability of Teir-1 cities based on number of Covid-19 cases. It is, therefore, hoped that this study’s findings will provide valuable insight to enhance the liveability of city.
Authors Contribution
All authors were involved in conceptualisation, investigation, visualisation, methodology, review of literature, editing, formal analysis, using software and writing—original draft preparation and validation. All authors have substantially contributed for the development of this manuscript. All quoted authors have read and agreed to the published version of the manuscript.
Footnotes
Declaration of Conflicting Interests
The authors declared no potential conflicts of interest with respect to the research, authorship and/or publication of this article.
Funding
The authors received no financial support for the research, authorship, and/or publication of this article.