
Abstract
We analyzed a population-based cohort (N = 10,922) to investigate the onset and stability of racial and ethnic disparities in advanced (i.e., above the 90th percentile) science and mathematics achievement during elementary school as well as the antecedent, opportunity, and propensity factors that explained these disparities. About 13% to 16% of White students versus 3% to 4% of Black or Hispanic students displayed advanced science or mathematics achievement during kindergarten. The antecedent factor of family socioeconomic status and the propensity factors of student science, mathematics, and reading achievement by kindergarten consistently explained whether students displayed advanced science or mathematics achievement during first, second, third, fourth, or fifth grade. These and additional factors substantially or fully explained initially observed disparities between Black or Hispanic and White students in advanced science or mathematics achievement during elementary school. Economic and educational policies designed to increase racial and ethnic representation in STEM course taking, degree completion, and workforce participation may need to begin by elementary school.
Keywords
Addressing racial and ethnic underrepresentation in the science, technology, engineering, and mathematics (STEM) workforce is a national priority (American Society of Mechanical Engineers, 2021; National Academies of Sciences, Engineering, and Medicine [NASEM], 2011; National Science Foundation [NSF], 2021). Less than 10% of the U.S. STEM workforce is Black or Hispanic 1 (Funk & Parker, 2018; National Science Foundation [NSF], 2019). White or Asian students are more likely to complete STEM college degrees (Steenbergen-Hu & Olszewki-Kubilius, 2017). Less than 1% of those with a bachelor’s degree in science or engineering are American Indian, Native American, or Pacific Islanders (AINAPI). The contrasting percentages for those who are White are 57% and 64% (NSF, 2021). The nation’s economic competitiveness and scientific innovation is constrained by racial and ethnic underrepresentation in the STEM workforce (Bell et al., 2019; NASEM, 2011). The earning potential of high-achieving adults of color is also constrained. High-achieving college students of color majoring in STEM report early career earnings that are 26% to 40% higher than closely matched counterparts majoring in other fields (Melguizo & Wolniak, 2012).
Very high levels of STEM proficiency during adolescence are strongly related to STEM doctoral degree completion and knowledge production (Agarwal & Gaule, 2020). Each additional point scored by high school students participating in the International Mathematical Olympiad predicts a 1 percentage point increase in the likelihood of a doctoral degree in mathematics, a 2.6 percentage point increase in publications, a 4.3 percentage point increase in citations, and a .03 percentage point increase in the likelihood of becoming a Fields medalist in analyses controlling for cohort and country fixed effects (Agarwal & Gaule, 2020). Advanced STEM achievement (e.g., performing above the 90th percentile) by elementary school predicts scientific innovation in adulthood as indicated by being listed as an inventor on a technology patent application (Bell et al., 2019). More than 30% of the gap in later patent rates between high- and low-income children is explained by their mathematics achievement in third grade (Bell et al., 2019). Racial and ethnic disparities in later patent rates are also evident by elementary school. Analyses of life-course data of those attending New York City schools between third and eighth grade indicate that, among White children, 1.6 out of 1,000 later held patents. The contrasting rates for Black and Hispanic children were .05 and .02, respectively (Bell et al., 2019). These rates would be expected to increase to .06 and .03 (and so percentage increases of 20% and 50%, respectively) for Black and Hispanic children displaying the same mathematics achievement as White children (Bell et al., 2019). Yet to what extent Black, Hispanic, or AINAPI students in the United States are already less likely to display advanced STEM achievement during elementary school is currently unknown (Joseph et al., 2017; Rambo-Hernandez et al., 2019).
Understanding and addressing racial and ethnic disparities in advanced STEM achievement during elementary school should advance educational equity. Black and Hispanic families often lack access to private tutoring or other supports and instead are more likely to rely on schools to develop their children’s talents (Plucker & Peters, 2016). Interest in STEM typically declines by middle school as students begin viewing scientists as stereotypically White (Hachey, 2020; Wong, 2015). Western non-White students are less likely to report science-related career aspirations as they age (Sheldrake, 2018). Social support from teachers or friends for a student’s STEM interests also declines after elementary school (Rice et al., 2013). Middle school STEM achievement fully explains racial and ethnic disparities in advanced high school STEM coursework (Ballón, 2008) as well as predicts persistently held STEM career aspirations (Mau, 2003) and college degree completion (Le & Robbins, 2016). Empirical evidence establishing the size and stability of racial and ethnic disparities in advanced STEM achievement during elementary school as well as the explanatory factors for these disparities would inform talent development efforts during a time when academic skills, interests, and feelings of efficacy toward STEM may be especially modifiable (Hachey, 2020; Morgan et al., 2016; Penner & Paret, 2008; Pringle et al., 2012).
Prior Work Examining Racial and Ethnic Disparities in Advanced STEM Achievement
Disparities in STEM achievement occur by elementary school (Fryer & Levitt, 2004; Henry et al., 2020; Morgan et al., 2016; National Assessment of Educational Progress [NAEP], 2015, 2020; Navarro et al., 2012; Reardon & Galindo, 2009; Von Hippel et al., 2018). Racial and ethnic disparities in advanced STEM achievement are increasing in the United States (Plucker et al., 2013; Rambo-Hernandez et al., 2019). Black and Hispanic students are more likely to display lower achievement growth among those who are academically advanced (Wai & Allen, 2019). Analyses of a large sample from 35 states indicate that disparities in advanced mathematics achievement grow between students who are White or Asian and those who are Black or Hispanic across the upper elementary grades (Rambo-Hernandez et al., 2019). Analyses of state-level administrative data indicate that racial and ethnic disparities in advanced mathematics achievement are already large by third grade (Clotfelter et al., 2009).
Yet the field’s understanding of racial and ethnic disparities in advanced STEM achievement during elementary school is currently limited. Relatively few studies of advanced STEM achievement have been conducted, particularly those using elementary school samples and longitudinal designs (Clotfelter et al., 2009; Davis-Kean & Jager, 2014; Gandara, 2005; Rambo-Hernandez et al., 2019). Of these, only two studies have examined racial and ethnic disparities in advanced STEM achievement as early as kindergarten in analyses of nationally representative data (Davis-Kean & Jager, 2014; Gandara, 2005). Neither study reported on explanatory factors for these disparities in adjusted analyses. Existing studies examining advanced STEM achievement have analyzed samples of middle or high school students (e.g., Kotok, 2017; Lubinski et al., 2014; McCoach & Siegle, 2003) or examined gender disparities (e.g., Penner & Paret, 2008; Robinson & Lubienski, 2011). The nationally representative NAEP program only begins academically assessing students in fourth grade. The available longitudinal studies analyzing samples of elementary students often report on achievement disparities based on average performance (Freyer & Levitt, 2004; Kuhfeld et al., 2020; Morgan et al., 2016; Quinn & Cooc, 2015). Yet STEM workforce under representation is most likely explained by achievement disparities at the extreme upper end of the distribution and the explanatory factors for disparities in advanced achievement may differ from those for average achievement (Penner & Paret, 2008).
Universal screening for advanced science and mathematics achievement may be one way to identify and support talented Black, Hispanic, and AINAPI students (Matthews & Rhodes, 2020; Plucker & Peters, 2016). Elementary school teachers may be less likely to recognize academically advanced students of color, resulting in comparatively lower access to enrichment activities and supports (Grissom & Redding, 2016; Irizarry, 2015). Use of universal screening using standardized measures results in significant increases in enrichment program participation by racially and ethnically diverse elementary students (Card & Giuliano, 2016), which then results in greater achievement growth by these students (Card & Giuliano, 2014). Yet the optimal timing of universal screening and talent supports has been unclear due to the lack of studies examining the early onset of racial and ethnic disparities in advanced science and mathematics achievement.
Theoretical Framework for Explaining Racial and Ethnic Disparities in Advanced STEM Achievement During Elementary School
An antecedent-opportunity-propensity framework is a well-validated theory of achievement growth (Byrnes, 2020) hypothesizing that a relatively small set of student, family, and school factors explain racial and ethnic disparities in STEM achievement (Byrnes & Miller, 2007; Byrnes & Wasik, 2009; Wang, 2013). Figure 1 displays a conceptual model of the study’s antecedent-opportunity-propensity framework. Antecedent factors help to explain why some students experience greater learning opportunities including in their homes and schools (Byrnes & Miller-Cotto, 2016). Antecedent factors include a family’s socioeconomic status (SES), the language spoken in the home, and the student’s disability status (Byrnes, 2020; Byrnes & Miller-Cotto, 2016; Curran, 2017; Ribner et al., 2019). Black, Hispanic, and AINAPI students are more likely to experience concentrated poverty that results in fewer learning opportunities and corresponding racial and ethnic achievement disparities during school because of historically racialized policies and practices as well as ongoing residential and community segregation (Reardon et al., 2021). About 30% of Black, 24% of Hispanic, and 29% of American Indian or Alaskan Native students experience poverty in the United States. The contrasting percentage for White students is 9% (Children’s Defense Fund, 2020). The greater likelihood of experiencing poverty disproportionately exposes Black, Hispanic, and AINAPI children to preterm birth, lead poisoning, environmental pollutants, and other gestational and environmental factors that increase their risks of disabilities and other health conditions (Mehta et al., 2013; Morgan et al., 2015; Turney, 2020). Being raised in less-resourced homes and having disabilities are associated with relatively lower academic achievement (Curran, 2017; NAEP, 2020; Saçkes et al., 2013). Hispanic students are more likely to grow up in homes where a language other than English is primarily spoken (U.S. Department of Education, 2020). Being an emergent bilingual is associated with lower academic achievement in unadjusted analyses (NAEP, 2020).
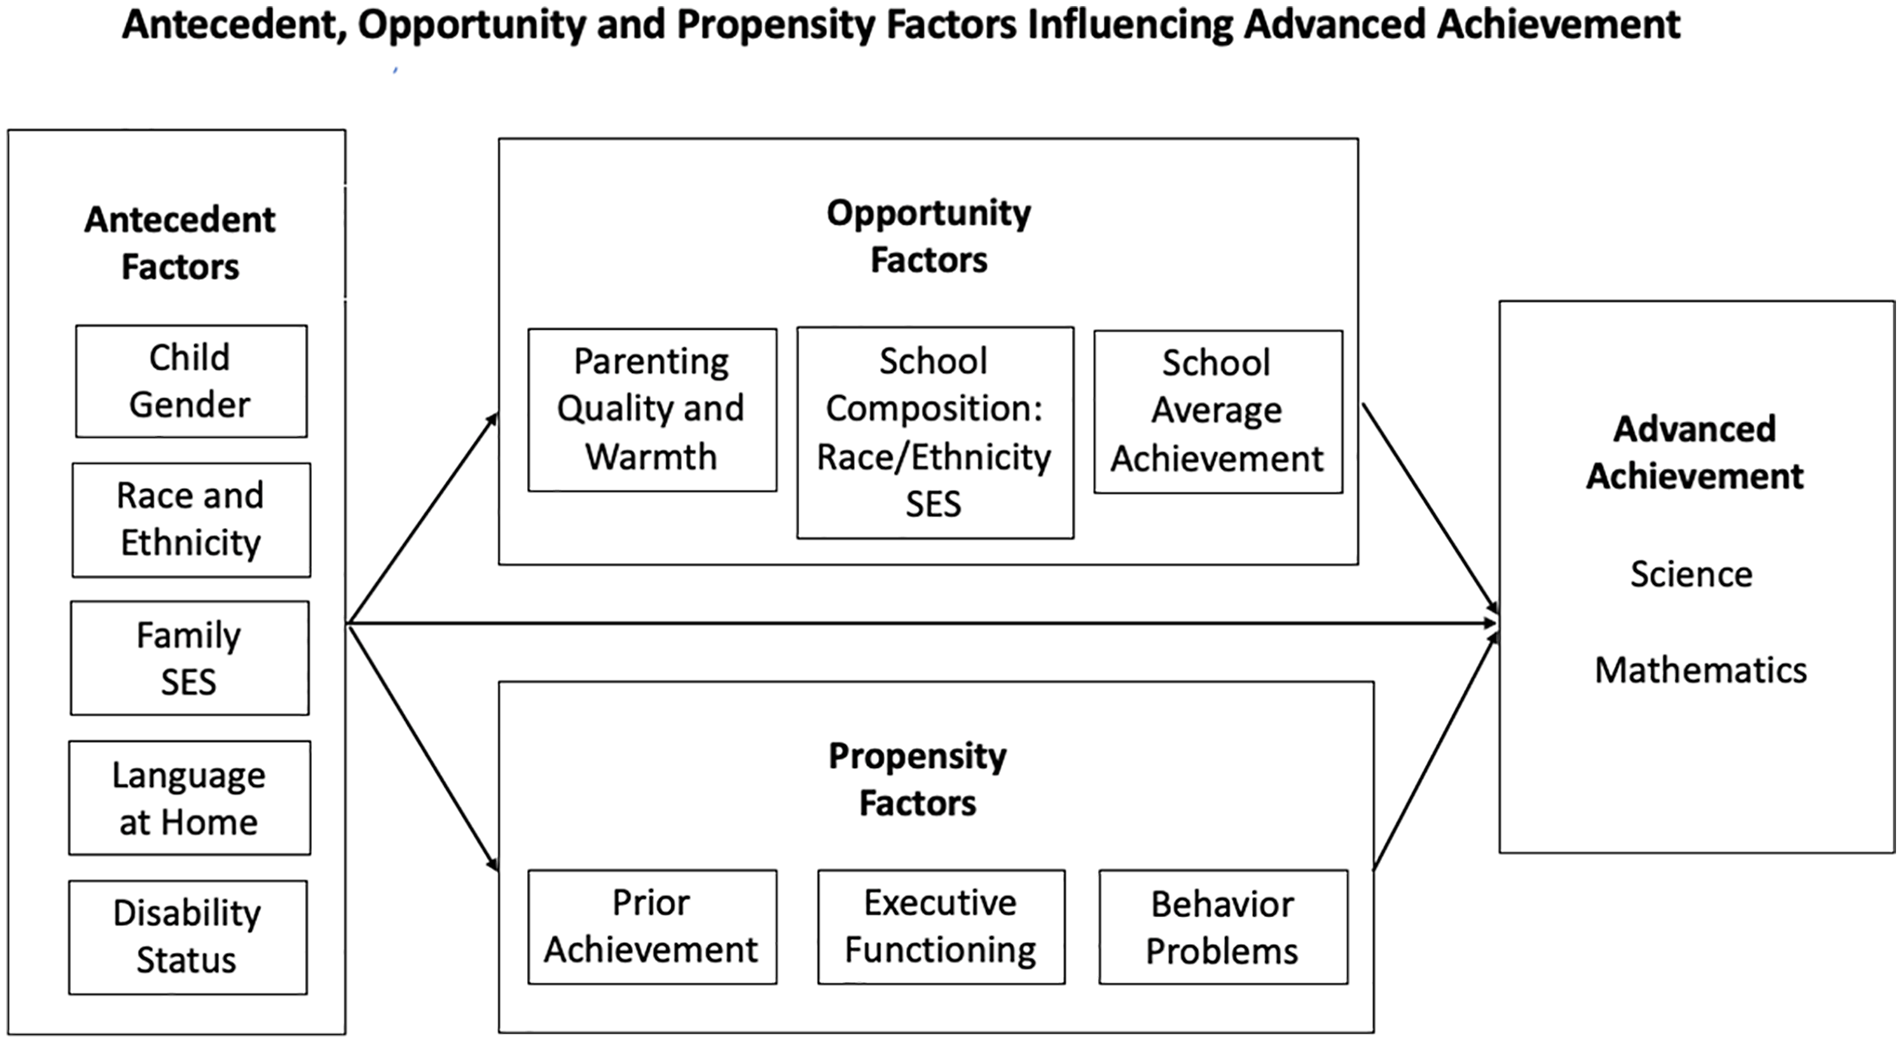
Conceptual Model of the Study’s Antecedent-Opportunity-Propensity Framework.
Opportunity factors are aspects of learning contexts in homes and schools that facilitate skills acquisition (Byrnes, 2020). Opportunity factors include parenting quality and the school’s economic and racial or ethnic composition (Bae & Lai, 2020; Lewis & Farkas, 2017; Rambo-Hernandez et al., 2019). Black, Hispanic, and AINAPI students are more likely to attend racially segregated and economically disadvantaged schools where fewer resources and professional training opportunities are available to teachers, paraprofessionals, and administrators as well as where greater staff turnover occurs (Lankford et al., 2002; Sorensen & Ladd, 2020).
Propensity factors are the student’s own characteristics that facilitate skill acquisition and maximize the ability to benefit from learning opportunities. Propensity factors include the student’s prior achievement, behavior, and executive functioning (Hoard et al., 2008; Miller-Cotto & Byrnes, 2020; Morgan et al., 2016, 2019). Black, Hispanic, and AINAPI students are more likely to enter schools already displaying lower levels of science or mathematics achievement, behavior, or executive functioning because of a greater likelihood of experiencing economic disadvantage (Burchinal et al., 2011; Fryer & Levitt, 2004, 2013; Morgan et al., 2016; Quinn & Cooc, 2015). Among antecedent, opportunity, and propensity factors, propensity factors most strongly predict student achievement (Byrnes, 2020; Lewis & Farkas, 2017; Morgan et al., 2016). Antecedent factors lead to opportunity and propensity factors, which then contribute to student achievement (Byrnes & Miller, 2007). Antecedent and opportunity factors can be addressed by economic and educational policies. Propensity factors can be addressed by preschool- and school-based interventions (Ribner et al., 2019).
Whether antecedent, opportunity, and propensity factors explain racial and ethnic disparities in advanced science and mathematics achievement during elementary school is currently unclear. The few large-scale studies examining racial and ethnic disparities in advanced STEM achievement have been unable to include propensity factors (e.g., prior science, mathematics, or reading achievement and executive functioning) when examining racial and ethnic disparities in advanced STEM achievement (Clotfelter et al., 2009; Gandara, 2005; Rambo-Hernandez et al., 2019). Available work examining disparities in advanced STEM achievement has been descriptive (Clotfelter et al., 2009; Davis-Kean & Jager, 2014; Gandara, 2005) or limited to examining school- instead of student-level risk and protective factors (Rambo-Hernandez et al., 2019). Although racial and ethnic disparities in advanced achievement are increasing in size in the United States, explanatory factors of these disparities are not well understood (Rambo-Hernandez et al., 2019). Identifying the antecedent, opportunity, and propensity factors that explain racial and ethnic disparities in advanced STEM achievement during elementary school would inform the design of economic and educational policies as well as of early interventions to support the STEM achievement of talented Black, Hispanic, and AINAPI students. The populations of talented Black, Hispanic, and AINAPI students are currently understudied (Irizarry, 2015; Plucker & Peters, 2016; Rambo-Hernandez et al., 2019).
Study’s Purpose, Research Questions, and Hypotheses
We investigated racial and ethnic disparities in advanced science and mathematics achievement during elementary school. We were particularly interested in examining the early onset and relative stability of these disparities as well as the antecedent, opportunity, and propensity factors that might explain why Black, Hispanic, or AINAPI students are less likely to display advanced science or mathematics achievement during elementary school. We investigated the following research questions (RQs):
To investigate these research questions, we evaluated the following hypotheses:
Method
Database, Design, and Analytical Sample
We analyzed the public-use version of the nationally representative Early Childhood Longitudinal Study, Kindergarten Class of 2010-11 (ECLS-K:2011) dataset. The ECLS-K:2011 is a population-based cohort followed from the fall of kindergarten to the spring of fifth grade. The U.S. Department of Education’s National Center for Education Statistics (NCES) maintains the ECLS-K:2011. Data were collected in the fall and the spring during kindergarten, first grade, and second grade and then during the spring of third, fourth, and fifth grade. Our weighted analytic sample (N = 10,922) represents estimates of the population of U.S. children who began kindergarten in 2010-2011. We used the NCES-provided sampling weight w12p0, which is a student’s base weight adjusted for nonresponse associated with both the fall and spring kindergarten parent interviews. We used the w12p0 weight because most cases that had parent data at both rounds also had student assessment data (Tourangeau et al., 2019). The study’s explanatory variables of antecedent, opportunity, and propensity factors were measured in the fall or spring of kindergarten. We used these factors to explain the study’s criterion variables of the likelihoods of advanced science or mathematics achievement during first, second, third, fourth, or fifth grade in analyses using autoregressive controls.
We used multiple imputation (MI) to account for missing values. Data were primarily missing due to item nonresponse (Tourangeau et al., 2019) and participant attrition (see Supplemental Table S2). Missing percentages increased from first grade to fifth grade for both science and mathematics achievement. MI adjusts for attrition bias more effectively than attrition weights (Davis-Kean et al., 2015). MI performs well with up to 50% missing observations (Allison, 2002). Supplemental Table S16 displays a full correlation matrix between the study’s variables of missing dummies (1 = missing, 0 = not missing). Students with missing science achievement data were likely to have missing mathematics achievement data across the surveyed grades. The missingness of parent-reported items such as a student’s disability status were highly correlated with other parent-reported items including parent-child activities (r = .95), family TV rules (r = .98), and parental warmth (r = .93). The missingness of school contextual factors such as school racial or ethnic composition was highly correlated with other school contextual factors including the school’s economic composition (r = .98) and the school’s average science and mathematics achievement (r = .81). Including these variables in the study’s MI procedures resulted in a reasonable assumption of data missing at random (Graham, 2009). We conducted MI using chained equations in Stata v. 15.0 to adjust for non-response bias. We imputed m datasets until the fraction of missing information divided by m was <0.01. Doing so maximized the relative efficiency of imputations. This led to m = 50 imputations.
Students were clustered within schools in the ECLS-K:2011 data. We used both student- and school-level variables as predictors. Educational researchers often adjust for clustering by using hierarchical linear models (HLM). (See McCoach & Adelson, 2010 for a brief introduction to clustering in gifted education.) Biomedical researchers, epidemiologists, and economists often use an alternative method known by varying terms including cluster-robust standard errors, empirical standard errors, or sandwich estimators. This alternative method adjusts the standard errors of the regression coefficients equally well for clustering. Cluster-robust standard errors are computationally easier, make fewer assumptions than HLM, and are at least as equally appropriate as HLM for estimating unbiased standard errors from clustered data (McNeish et al., 2017). Standard errors for our regression estimates were adjusted using the school identification number at the spring of kindergarten.
Advanced Science or Mathematics Achievement
We operationalized advanced science or mathematics achievement as science or mathematics achievement above the 90th percentile of the total test score distribution, separately at each surveyed grade. For example, students who displayed science achievement above the 90th percentile on the ECLS-K:2011 measure of general science achievement in the spring of third grade were identified as displaying advanced science achievement in third grade. Using achievement above the 90th percentile as an indicator of advanced STEM achievement is consistent with prior work (Bell et al., 2019; Plucker et al., 2010; Rambo-Hernandez et al., 2019; Zhou et al., 2017). We also used more liberal and conservative cutoffs of achievement above the 75th and 95th percentiles, respectively, in robustness checks detailed below.
Measures
Measures of Antecedent Factors
Student and Family Sociodemographic Characteristics
Gender as a dichotomous variable was collected from schools during the sampling process and the fall kindergarten parent interview and then confirmed by parents in the spring kindergarten. We used male as the reference group. Student race or ethnicity as categorical variables were surveyed during the parent interviews. Possible responses included White, non-Hispanic; Black/African American, non-Hispanic; Hispanic, race specified; Hispanic, no race specified; Asian, non-Hispanic; Native Hawaiian or Other Pacific Islander, non-Hispanic; American Indian or Alaska Native, non-Hispanic; and more than one race, non-Hispanic. We combined Hispanic, race specified and Hispanic, no race specified into one Hispanic group. We combined Native Hawaiian or Other Pacific Islander, non-Hispanic and American Indian or Alaska Native, non-Hispanic into an AINAPI group. Our analytical racial and ethnic categories were White, Black/African American, Hispanic, Asian, more than one race, and AINAPI. White students were the reference group. 2
Student primary home language was a dichotomous variable. Parents were asked whether a language other than English was regularly spoken in the home during the fall and spring of kindergarten. Reference group responses indicated that English was regularly spoken in the home or that English and another language were equally used. Household SES was a continuous composite variable using data from parental interviews in the fall or spring of kindergarten about each parent’s or guardian’s occupation and educational level as well as the family’s household income (Tourangeau et al., 2015). We standardized family SES and all other continuous variables in the analyses.
Disability status as a dichotomous variable was indicated by whether students had a disability diagnosed by a professional. Parents were asked questions about their child’s development (i.e., ability to be independent and take care of himself or herself, ability to pay attention and learn, overall activity level, overall behavior and ability to relate to adults and children, emotional or psychological difficulties, ability to communicate, difficulty in hearing and understanding speech, and eyesight) in the spring of kindergarten. Parents who indicated that their child had developmental delays were then asked follow-up questions including whether an evaluation by a professional had occurred, whether a diagnosis of a problem had been obtained, and whether participation in therapy services or special needs programming currently was occurring or had occurred in the past. The composite variable was coded “1” if the parent answered “yes” to at least one of the follow-up questions or specified any specific diagnoses. Excluded responses included a diagnosis of nearsightedness/myopia, farsightedness/hyperopia, color blindness/deficiency, and astigmatism in the case of vision diagnosis as well as external ear canal ear wax in the case of hearing diagnosis. We conservatively coded the composite variable as “0” if the child had a diagnosis but the specific diagnosis was not reported (i.e., responses including refused, “don’t know,” or not ascertained). Students without disabilities were the reference group.
Measures of Opportunity Factors
Parenting Quality
We included five measures of parenting quality as continuous variables that were surveyed in the fall or spring of kindergarten. Cognitive stimulation (α = .72) was a standardized sum of nine questions answered in the fall of kindergarten indicating how often the parent engaged in activities with their child in a typical week. These activities included telling stories, singing songs, doing arts and crafts, playing games or puzzles, doing science projects or talking about nature, playing with construction toys, doing household chores, exercising or playing sports, and practicing reading, writing, or working with numbers.
Emergent literacy (α = .57) was a standardized composite score of five items related to literacy activities. The first three items assessed the frequency of parents engaging in book reading and picture book reading with the child as well as the child reading outside school. The last two items reported the number of books that their child owned and how long the parent spent on reading to their child. We added standardized scores of the first three items and the last two items to obtain the standardized composite score.
Parent-child activities (α = .65) was a standardized composite score of six items assessing whether the parent had participated in activities with their child over the past month including visiting a library, a bookstore, an art gallery, a concert, a zoo, or a sport event as well as twelve questions regarding whether their child ever engaged in out-school activities including academic activities (e.g., tutoring or mathematics lab), dance/music/drama/art/crafts lessons, organized athletics/clubs/preforming arts programs, and instructions (non-English language, religious, and volunteer work). Parental warmth (α = .65) was a measure of four items asking the parent to self-assess their relationship with their child through showing love, expressing affection, spending close time together, and child-parent closeness. These four items were originally scaled 1 to 4 indicating “completely true” to “not at all true.” We used reversed coding so that higher scores indicated greater parental warmth.
Family TV rules (α = .52) was a standardized composite of three parent-reported binary questions indicating whether there were family rules about: (a) allowable TV programs; (b) how many hours of TV the child could watch; and (c) how early or late the child watched television. Parents voluntarily self-reported information on their parenting practices. Similar groupings of these items have been used in prior work investigating parental literary activities (e.g., Byrnes et al., 2019), cognitive stimulation (e.g., Slicker et al., 2021), parent-child activities (e.g., Kim, 2021), parental warmth (e.g., Ogg & Anthony, 2020) and family TV rules (e.g., Morgan et al., 2021). Relatively low values of alpha for emergent literacy and family TV rules were likely due to the small number of scale items.
School Characteristics
School opportunity factors as continuous variables included the percent of students receiving free school lunch and reduced-price school lunch, the percent of non-White students, and averaged science and mathematics achievement in the spring of kindergarten.
Measures of Propensity Factors
Science, Mathematics, and Reading Achievement
Trained field staff individually assessed a student’s science, mathematics, and reading achievement as continuous variables using untimed item response theory (IRT) scaled measures. Measure administration included a two-stage assessment process. The first stage was a routing section. The routing section included items of varying degrees of difficulty that, depending on the student’s performance, was then followed with one of three second-stage assessments (i.e., additional low-, middle-, or high-difficulty items). The science achievement measure was based on the 2011 NAEP Science framework and the curriculum standards of Arizona, California, Florida, New Mexico, Texas, and Virginia. The mathematics achievement measure was developed based on 2005 NAEP Mathematics Framework and curriculum standards of California, New Jersey, Tennessee, Texas, and Virginia. The reading achievement measure was based on the 2009 NAEP Reading Framework and the curriculum standards of Texas, California, New Jersey, Florida, and Virginia.
The science achievement measure was designed to assess a student’s understanding about the physical, life, and Earth and space sciences as well as scientific inquiry. The mathematics achievement measure was designed to assess a student’s conceptual knowledge, procedural knowledge, and problem solving. The mathematics achievement measure included items on number sense, properties, and operations; measurement; geometry and spatial sense; data analysis, statistics, and probability; and patterns, algebra, and functions. The reading achievement measure was designed to assess basic reading skills (e.g., print familiarity), vocabulary, and reading comprehension. The reliabilities for the ECLS-K:2011’s science and mathematics assessments were relatively high across kindergarten to fifth grade. The science and mathematics reliability coefficients ranged from .73 to .86 and .93 to .94, respectively, across kindergarten to fifth grade. The reading reliability coefficient was .95 in the spring of kindergarten.
Executive Functioning
We included assessments of cognitive flexibility, working memory, and inhibitory control as three continuous variables indicating executive functioning.
Cognitive flexibility was individually assessed by the Dimensional Change Card Sort (DCCS; Zelazo, 2006). Students were asked to sort 22 different picture cards based on different rules (i.e., sorting cards based on color, shape, and border). Each card had a picture of either a red rabbit or a blue boat. Students sorted the cards by color and then by shape. Four of six cards had to be correctly sorted by shape to proceed to sorting by border. Students who proceeded were asked to sort cards with black borders by color and cards without black borders by shape. A total score was developed by combining scores of all the three tasks. The DCCS displays strong test–retest reliability (e.g., .90-.94; Beck et al., 2011).
Working memory was individually assessed using the Numbers Reversed subtest of the Woodcock-Johnson III Tests of Cognitive Abilities (Woodcock et al., 2001). The Numbers Reversed task has strong test–retest reliability (e.g., .69-.87; Vought & Dean, 2011). Students repeated sets of orally presented single-digit numbers in reverse order. Students were first given five two-digit sequences. For example, if presented with the sequence “3, 5,” a student would be expected to respond with “5, 3.” The assessment continued until the maximum of eight-number sequences was completed or three consecutive incorrect responses were given. We used the W scores as recommended by the measure’s publishers (Mather & Woodcock, 2001). The W scale is a standardized scale with a M of 500 and a SD of 100.
Inhibitory control was individually rated by teachers using the Children’s Behavior Questionnaire (Putnam & Rothbart, 2006). Teacher ratings as a measure of inhibitory control have strong validity evidence (Allan et al., 2014). During the spring of kindergarten, teachers rated how often individual students displayed social behaviors related to attention and inhibitory control. The inhibitory control subscale consisted of six items assessing how students reacted to different situations in the past 6 months including whether students were easily distracted or could be stopped from doing something as instructed. Teachers used a seven-point rating scale from “extremely untrue” to “extremely true.” The reliability coefficient for the inhibitory control scale was .87 (Tourangeau et al., 2019).
Behavioral Functioning
Teachers rated how often their students exhibited externalizing or internalizing problem behaviors as continuous variables during the spring of kindergarten using a modified version of the Social Skills Rating System (Gresham & Elliott, 1990). The Social Skills Rating System has adequate evidence for internal consistency including over time, interrater reliability, construct- as well as criterion-related validity, and factor invariance across White and non-White elementary students (Elliott et al., 1988; Walthall et al., 2005). The Externalizing Problem Behaviors subscale consisted of five items (i.e., arguing, fighting, acting impulsively, getting angry, disturbing activities). The Internalizing Problem Behaviors subscale consisted of four items (i.e., is the child lonely, sad, anxious, or displays low self-esteem). Problem behavior frequency was rated using a four-point response scale ranging from “never” to “very often.” Higher scores indicated that the behavior occurred more frequently. The internal consistency reliability coefficients for the externalizing and internalizing problem behaviors scales were .89 and .78, respectively (Tourangeau et al., 2019).
Statistical Analyses
To examine RQ1, we examined the absolute number and relative percentages of students by race or ethnicity who displayed advanced science or mathematics achievement in kindergarten as well as in first, second, third, fourth, and fifth grade. We conducted proportion tests across racial or ethnicity groups. We used White, non-Hispanic students as the reference group and applied the Benjamini and Hochberg (1995) procedure to avoid potential Type I errors resulting from multiple hypotheses testing (Chen et al., 2017).
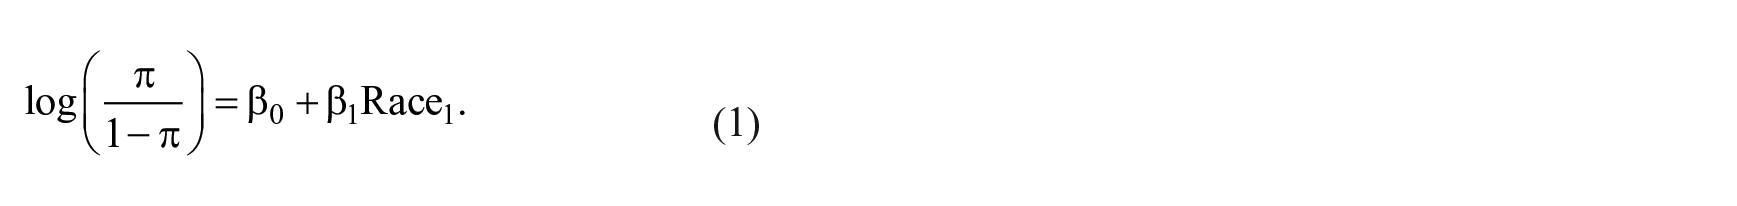
To examine RQ2, we estimated logistic regression models separately for each grade level. We estimated two models for each elementary grade. Model 1 was an unadjusted model including only the antecedent factor of race or ethnicity. Model 2 was a fully adjusted model that simultaneously included antecedent, opportunity, and propensity factors measured by the end of kindergarten. We also controlled for the propensity factors of science and mathematics achievement by the end of kindergarten to better estimate the independent effects of the study’s other explanatory factors (Klein, 2019; VanderWeele, 2021). We calculated forest plots of the estimated odds ratios (ORs) for race or ethnicity across the grades with 95% confidence intervals to visualize the trend of racial or ethnic disparities in advanced achievement over time (see Figures 2–5).
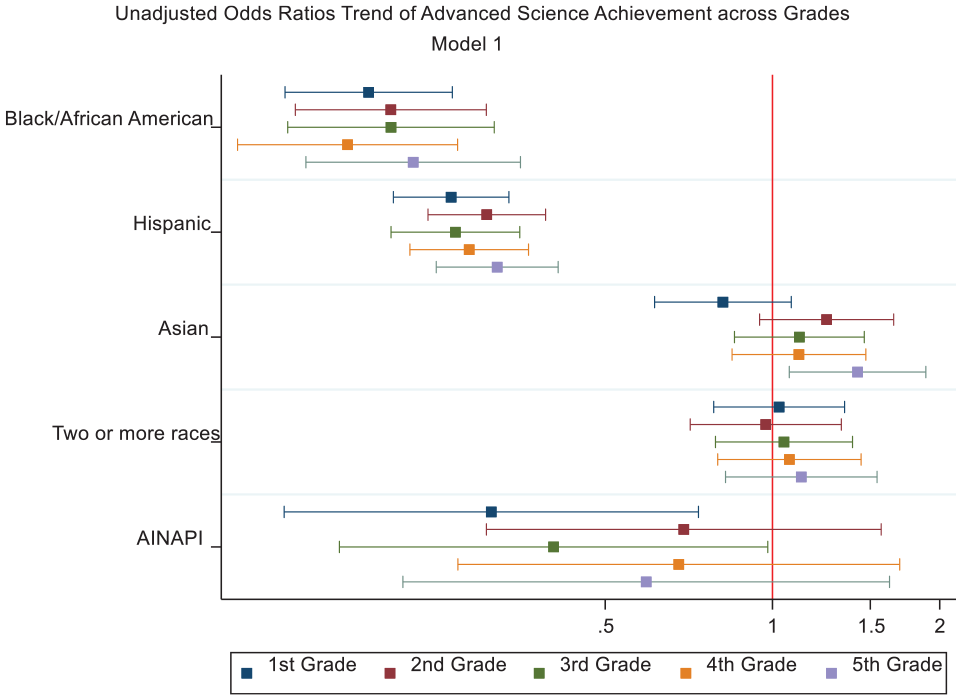
Plotted Unadjusted Odds Ratios (Model 1) Trend of Advanced Science Achievement Across Grades.
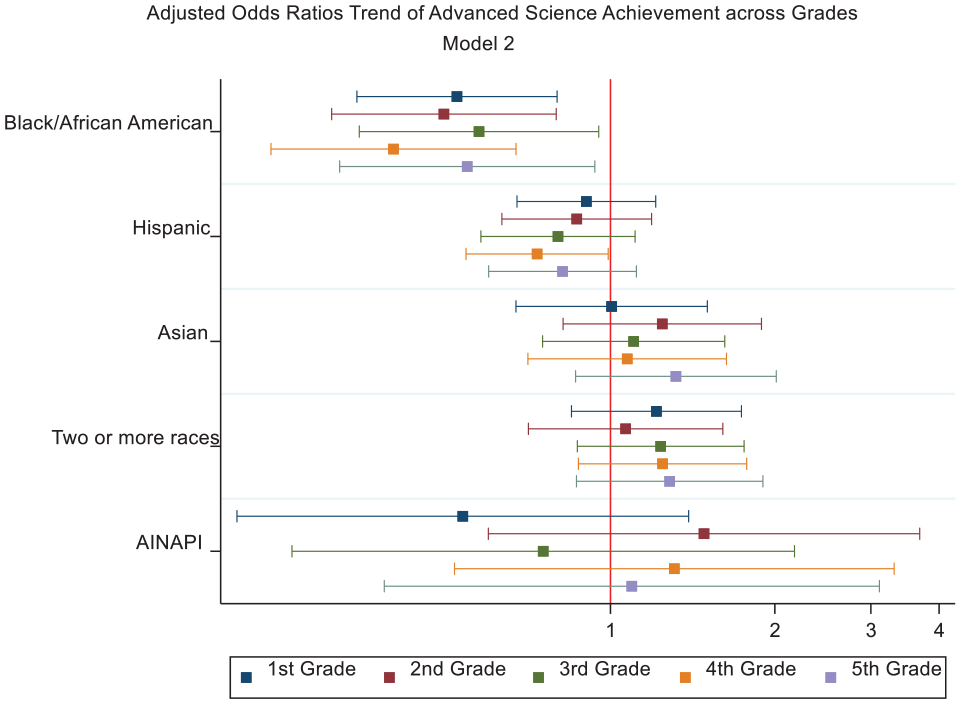
Plotted Adjusted Odds Ratios (Model 2) Trend of Advanced Science Achievement Across Grades.
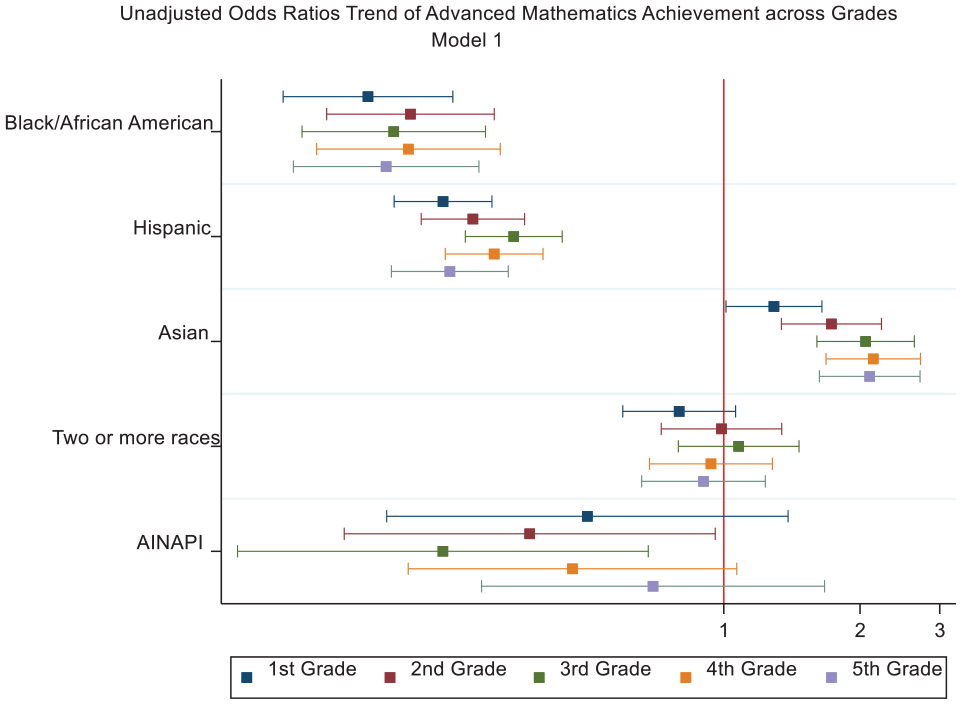
Plotted Unadjusted Odds Ratios (Model 1) Trend of Advanced Mathematics Achievement Across Grades.
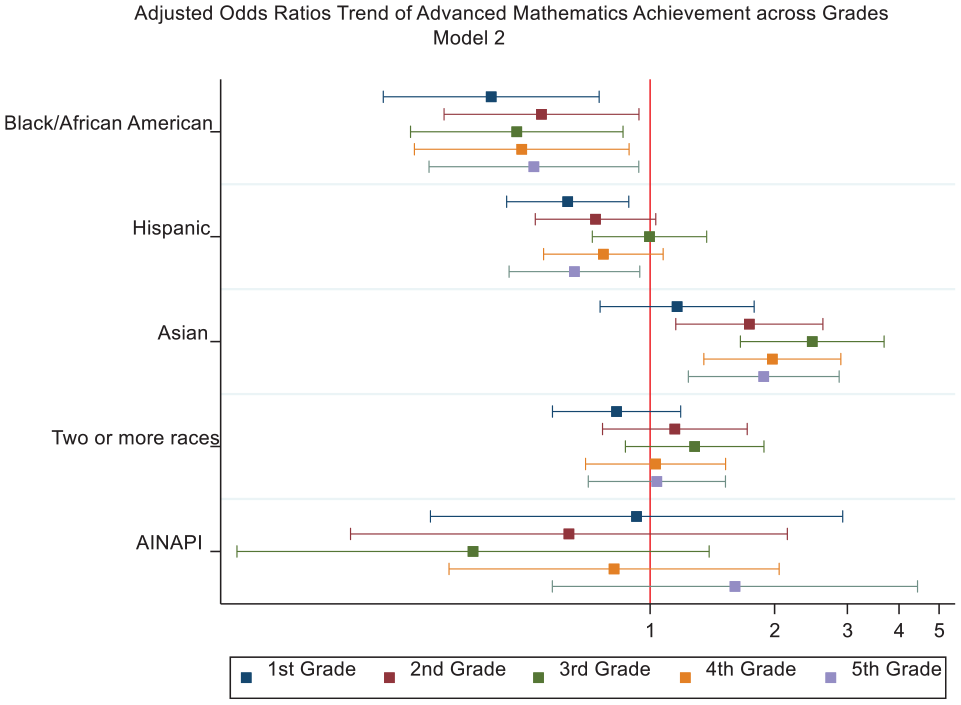
Plotted Adjusted Odds Ratios (Model 2) Trend of Advanced Mathematics Achievement Across Grades.
The logistic regression models were represented by Equations 1 and 2 below, where the log odds of achieving advanced achievement,

Robustness Checks
We conducted robustness checks using other operationalizations of advanced science or mathematics achievement. First, we used a more liberal 75th percentile cutoff as well as a more conservative 95th percentile cutoff (Supplemental Tables S6 to S9). Second, we operationalized consistently advanced achievement as being in the highest 10% of the averaged science or mathematics achievement scores across first to fifth grade (Supplemental Tables S10 and S11). Third, we examined the relative consistency of displaying advanced science or mathematics achievement using count variables of the number of times students displayed advanced science or mathematics achievement using negative binomial regression models (Supplemental Tables S12 to S15). Results from these robustness checks were consistent with the study’s main findings. The online supplement includes the descriptive statistics for predictors (weighted mean or percentage, before and after MI), a correlation matrix, the robustness checks, and analytic syntax.
Results
Are Black, Hispanic, or AINAPI Students Less Likely to Display Advanced Science or Mathematics Achievement During Elementary School?
Science Achievement
Table 1 displays the number and percentage of students by race or ethnicity who displayed advanced science achievement during each elementary grade. Black or Hispanic students were far less likely than White students to display advanced science achievement in kindergarten. Specifically, 3% and 4% of Black and Hispanic versus about 16% of White students (p<.001) displayed advanced science achievement. Statistically and practically significant disparities between Black, Hispanic, and White students in advanced science achievement were also evident in first, second, third, fourth, and fifth grade. About 5% of students who are AINAPI displayed advanced science achievement by kindergarten. This percentage was 4% by fifth grade. Asian students were initially less likely than White students to display advanced science achievement in kindergarten (i.e., 7% versus 16%, respectively). Asian students then were more likely than White students to display advanced science achievement by fifth grade (i.e., 16% versus 13%, respectively).
Numbers and Percentages of Students by Race or Ethnicity Displaying Advanced Science Achievement, Kindergarten to Fifth Grade, ECLS-K:2011 Data.
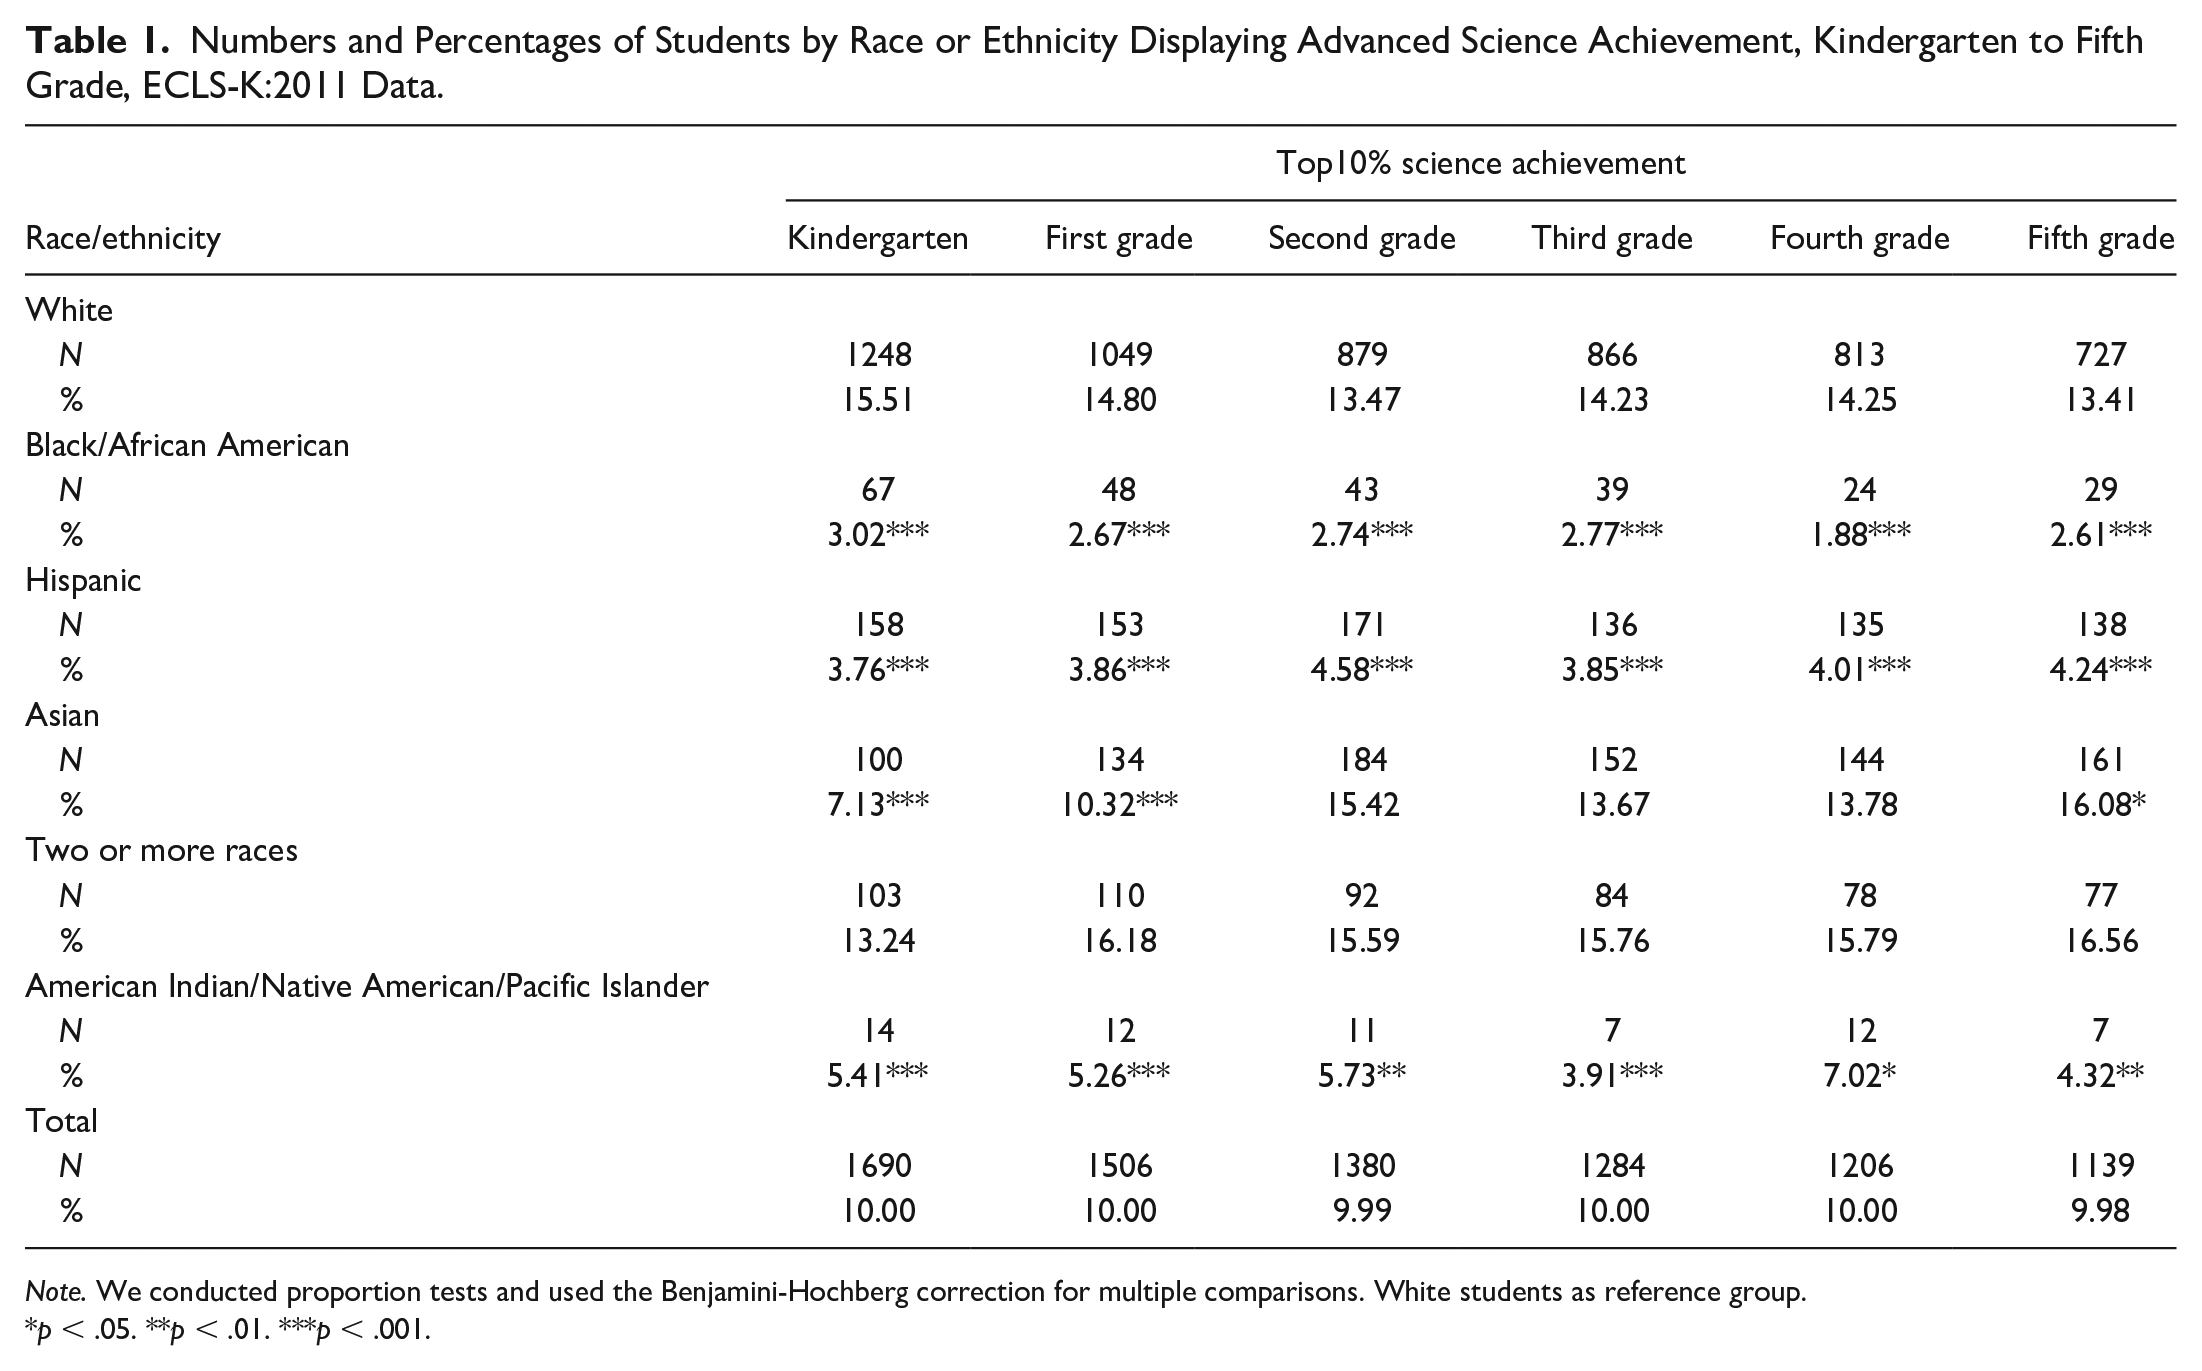
Note. We conducted proportion tests and used the Benjamini-Hochberg correction for multiple comparisons. White students as reference group.
p < .05. **p < .01. ***p < .001.
Mathematics Achievement
Table 2 presents the number and percentage of students by race or ethnicity who displayed advanced mathematics achievement during each elementary grade. Large racial and ethnic disparities in advanced mathematics achievement were evident by the end of kindergarten. About 4% of Black or Hispanic students versus about 13% of White students (p < .001) displayed advanced mathematics achievement. Large disparities between Black, Hispanic, and White students were also evident in first, second, third, fourth, and fifth grade. At the end of fifth grade, about 2% of Black students and 3% of Hispanic students displayed advanced mathematics achievement. About 13% of White students and 22% of Asian students did so. American Indian or Native American students were also consistently less likely to display advanced mathematics achievement than White students. The percentages of AINAPI students displaying advanced mathematics achievement during elementary school ranged from 4% to 7%.
Numbers and Percentages of Students by Race or Ethnicity Displaying Advanced Mathematics Achievement, Kindergarten to Fifth Grade, ECLS-K:2011 Data.
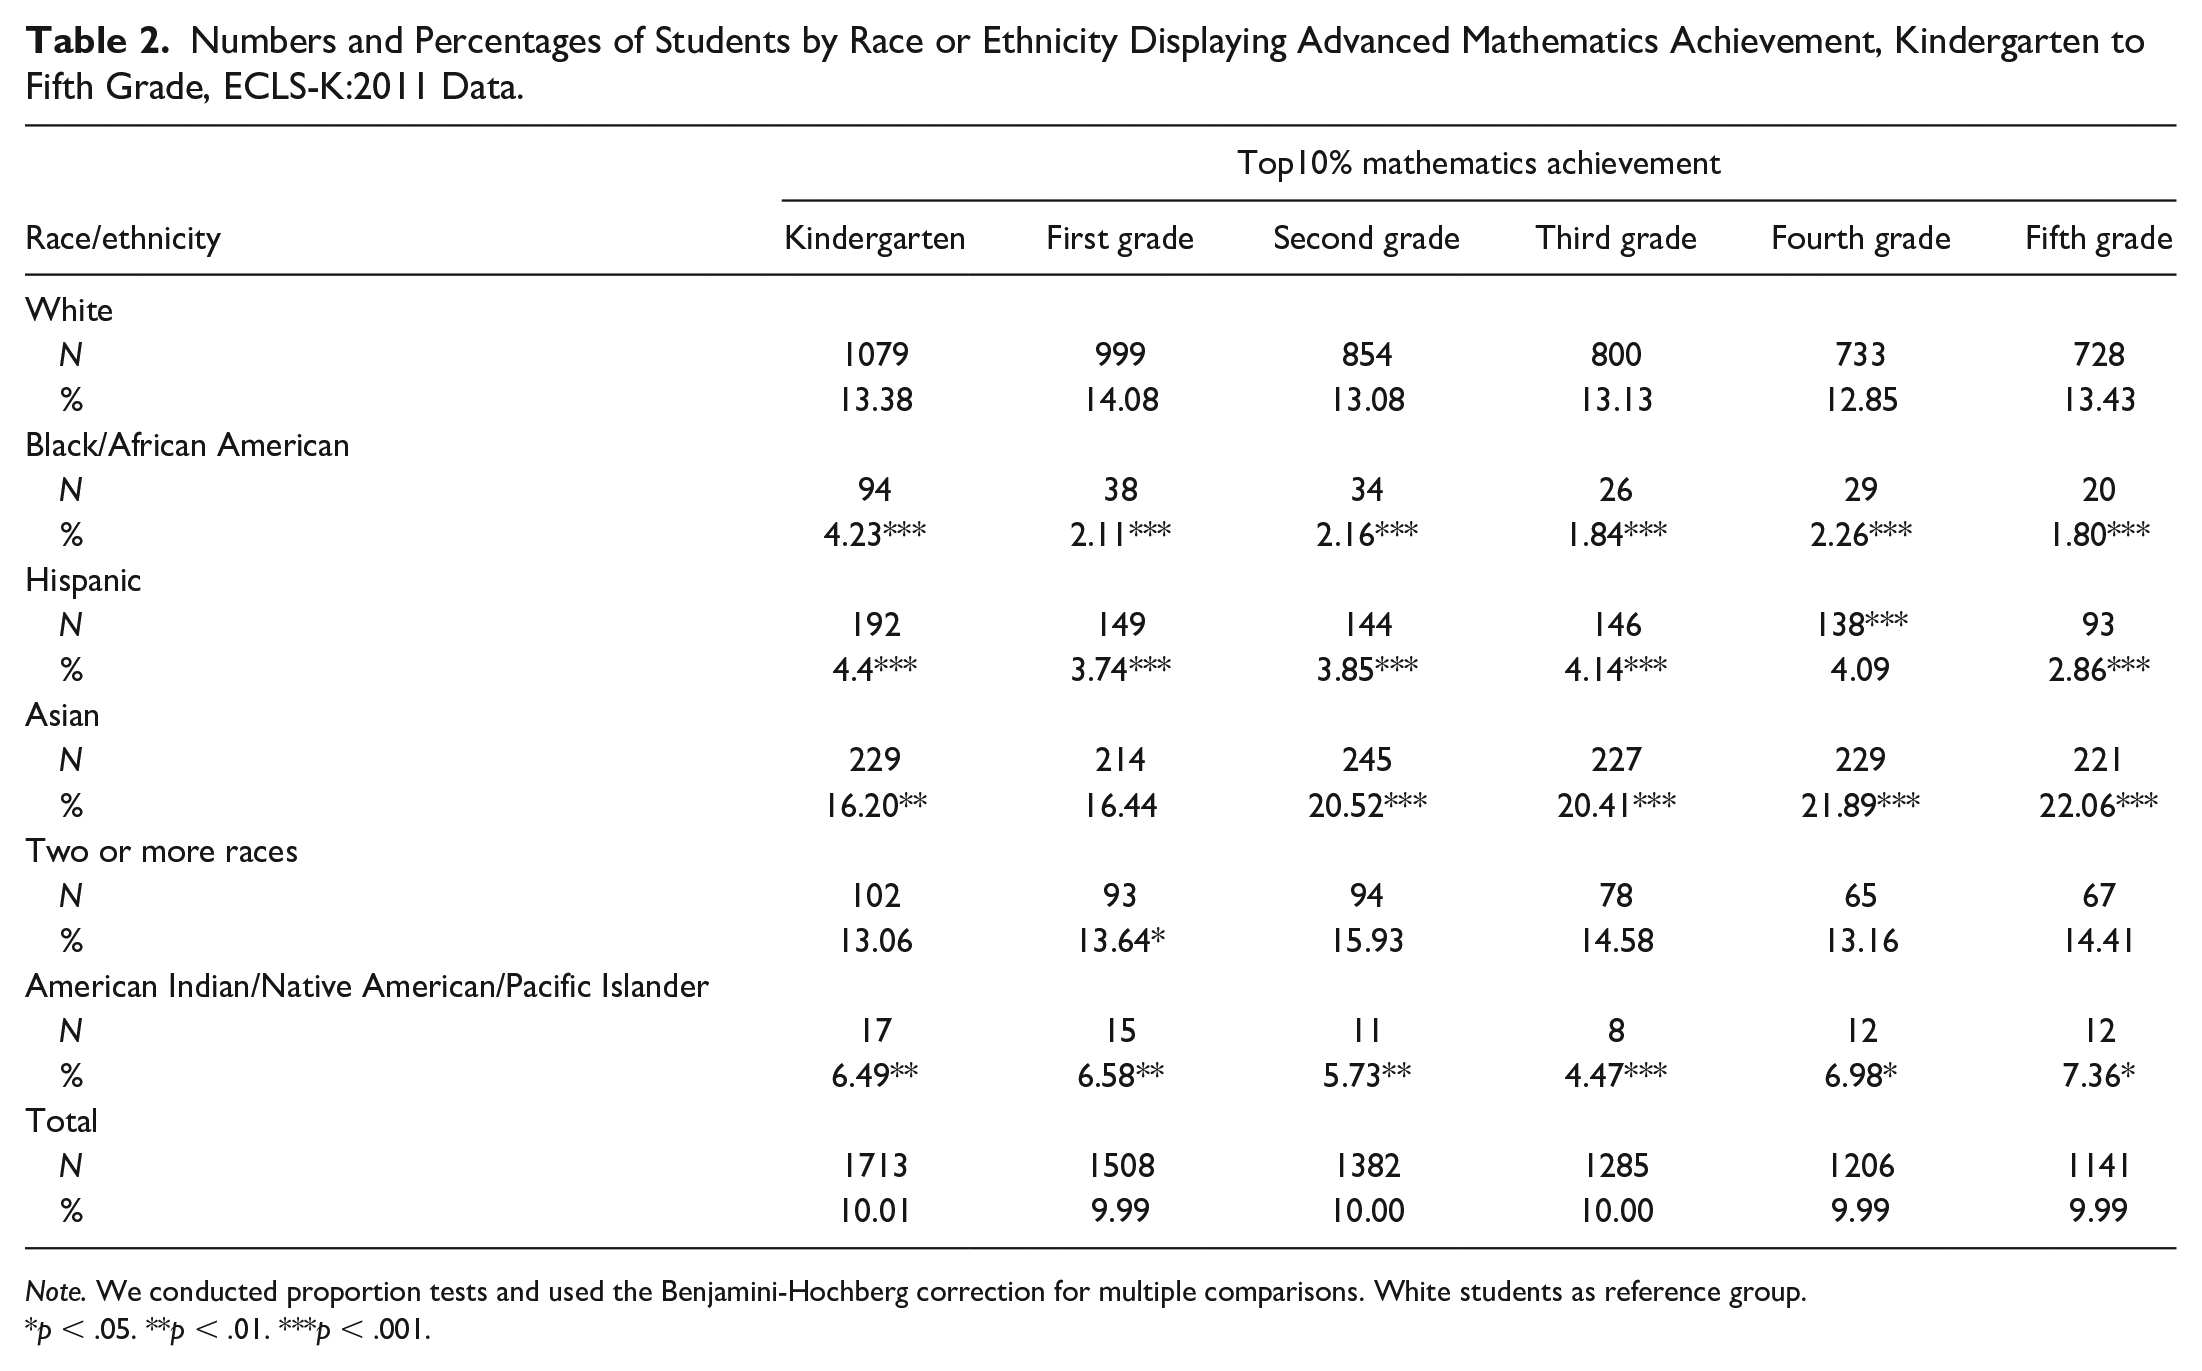
Note. We conducted proportion tests and used the Benjamini-Hochberg correction for multiple comparisons. White students as reference group.
p < .05. **p < .01. ***p < .001.
Do Antecedent, Opportunity, and Propensity Factors Explain Racial and Ethnic Disparities in Advanced Science or Mathematics Achievement During Elementary School?
We next examined explanatory factors of the observed disparities. We emphasize findings that were relatively more consistent in reporting these results. We did so because we examined 22 explanatory factors across two criterion variables separately examined across five elementary grades, resulting in 220 (i.e., 22 x 2 x 5) estimated coefficients. We operationalized consistent findings as those in which more than 50% of the coefficients for the explanatory variable across the five grades were statistically significant and directionally similar. Because there were five grades, we emphasize coefficients that were statistically significant and in the same direction across at least three of the five grades.
Science Achievement
Table 3 displays results from the logistic regression modeling of explanatory factors of racial and ethnic disparities in advanced science achievement at the end of first, second, third, fourth, or fifth grade using antecedent, opportunity, and propensity factors measured by the end of kindergarten. Model 1’s unadjusted estimates repeatedly indicated large racial and ethnic disparities in advanced science achievement during each of the examined elementary grades. Black and Hispanic students were significantly less likely than White students to display advanced science achievement across each of the elementary grades. The unadjusted ORs ranged from 0.17 to 0.23 for Black students and 0.26 to 0.32 for Hispanic students (ps < .001). AINAPI students were initially significantly less likely to display advanced science achievement in the first and third grade. However, these disparities were not statistically significant following correction for multiple comparisons. Figure 2 displays over-time changes in the unadjusted ORs for each racial or ethnic group versus White students. Although there were slight fluctuations in the ORs for the racial and ethnic groups across grades, there was no clear upward or downward trend. Instead, these relations were relatively stable across the grade levels.
Odds Ratios From Logistic Regression Models of Advanced Science Achievement in First, Second, Third, Fourth, or Fifth Grade, Kindergarten Predictors.
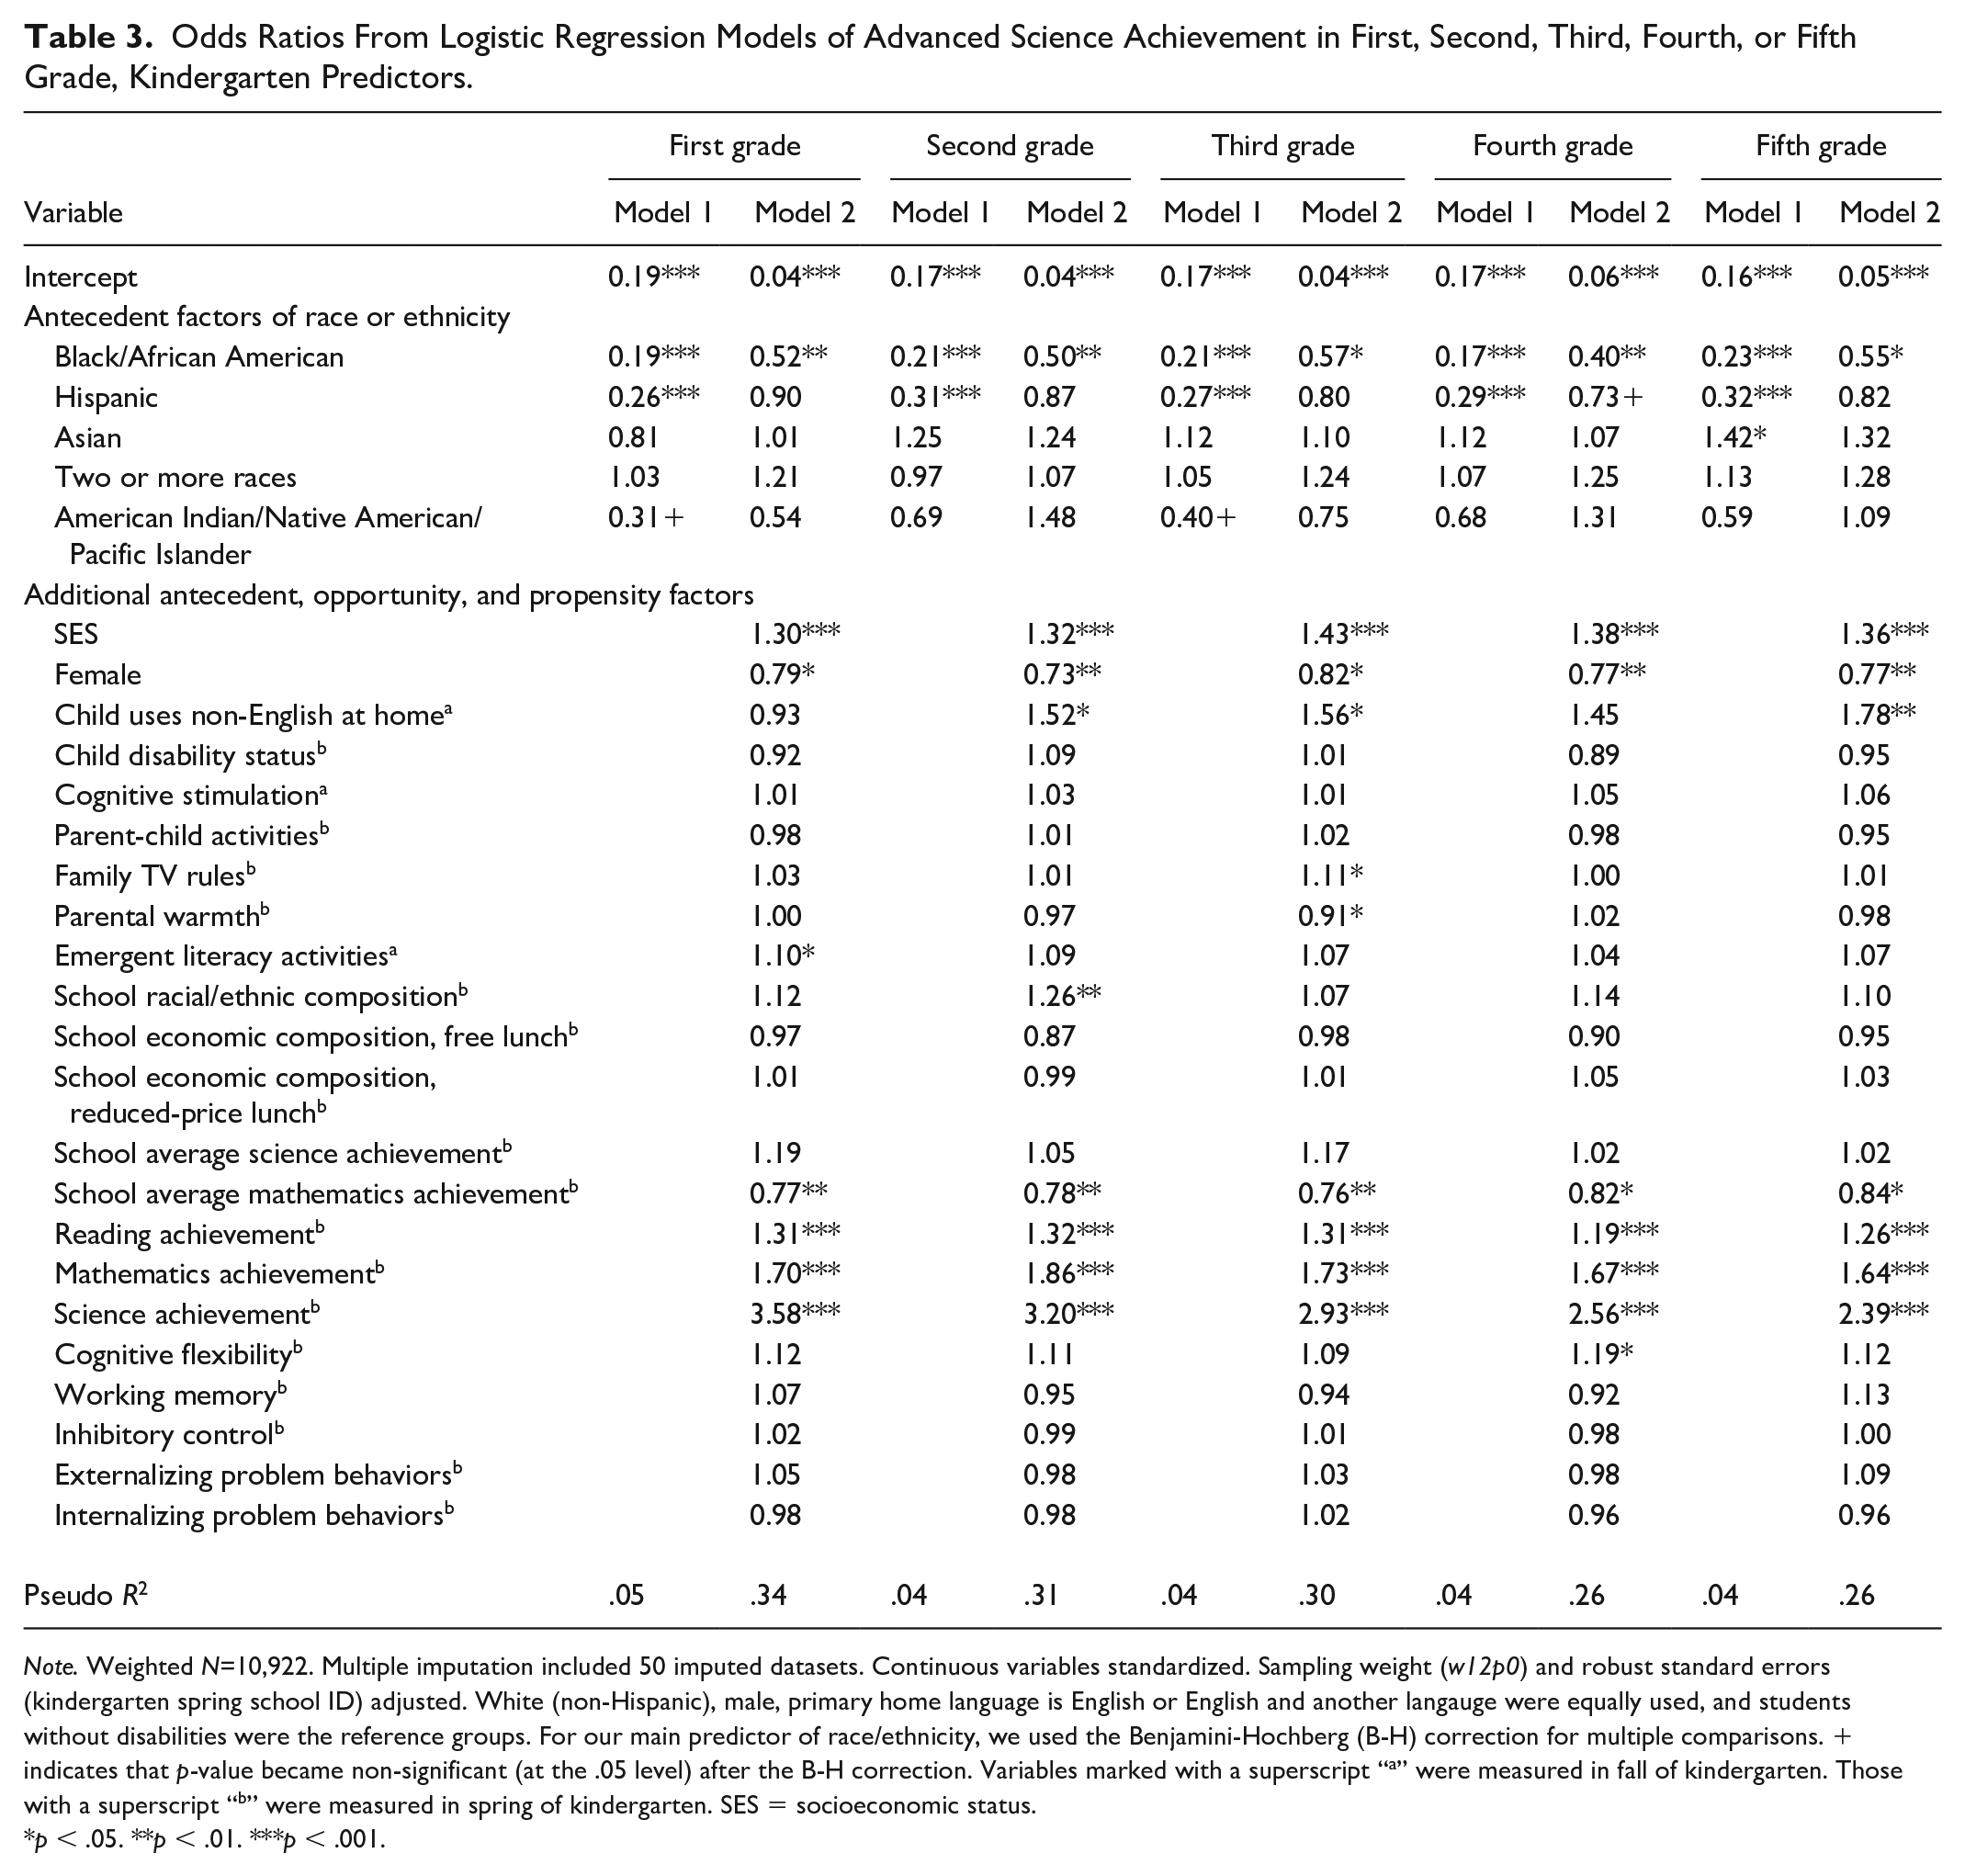
Note. Weighted N=10,922. Multiple imputation included 50 imputed datasets. Continuous variables standardized. Sampling weight (w12p0) and robust standard errors (kindergarten spring school ID) adjusted. White (non-Hispanic), male, primary home language is English or English and another langauge were equally used, and students without disabilities were the reference groups. For our main predictor of race/ethnicity, we used the Benjamini-Hochberg (B-H) correction for multiple comparisons. + indicates that p-value became non-significant (at the .05 level) after the B-H correction. Variables marked with a superscript “a” were measured in fall of kindergarten. Those with a superscript “b” were measured in spring of kindergarten. SES = socioeconomic status.
p < .05. **p < .01. ***p < .001.
Model 2’s antecedent, opportunity, and propensity factors significantly explained disparities in advanced science achievement between Black or Hispanic and White students. For example, inclusion of Model 2’s additional predictors reduced the size of the Black-White disparity in the likelihood of advanced science achievement in first grade from an ORs of 0.19 (p < .001) to 0.52 (p < .01). Thus, the average percentage difference in relative odds of advanced science achievement in first grade between Black and White students was reduced from 81% to 48%. Despite being substantially reduced, Model 2’s explanatory factors did not fully explain the Black-White disparities in first, second, third, fourth, and fifth grade. In contrast, the disparity between Hispanic and White students was fully explained in Model 2 (e.g., a first grade OR reduction from 0.26 [p < .001] to 0.90 [p = .495]) in each of the examined grades. The average percentage difference in relative odds of advanced science achievement from first to fifth grade between Black and White students was reduced from 80% to 49%. The average percentage difference in relative odds of advanced science achievement between Hispanic and White students was reduced from 71% to 18%. Figures 2 and 4 versus Figures 3 and 5 display the estimated ORs for the racial and ethnic groups in unadjusted and adjusted analyses. The persistently unexplained Black-White disparity in advanced science disparity, despite statistical control for Model 2’s explanatory variables, should be investigated in future research.
Among the study’s antecedent, opportunity, and propensity factors, the domain-specific autoregressor of science achievement in kindergarten strongly and consistently explained racial and ethnic disparities in advanced science achievement across the elementary grades. Children’s relative odds of displaying advanced science achievement in first, second, third, fourth, or fifth grade were two to four times greater for each 1-SD increase in science achievement in kindergarten. This predictive relation was consistently strong until the end of fifth grade, despite Model 2’s additional explanatory factors simultaneously included in the regression analyses. This finding suggests that early disparities in science achievement (i.e., prior to or by kindergarten) explain later disparities in advanced science achievement during elementary school. The domain-general autoregressors of mathematics and reading achievement also consistently explained racial and ethnic disparities in advanced science achievement across elementary school.
Other statistically significant explanatory variables across each of the elementary grades were the positive relation for family SES and the negative relation for females. Students using a non-English language at home were significantly more likely to display advanced science achievement. A possible explanation of this finding is that bilingualism facilitates learning of complex rules and procedures integral to advanced STEM learning (Hartanto et al., 2018; Stocco & Prat, 2014). We also observed that school average mathematics achievement was negatively related to likelihood of displaying advanced science and mathematics achievement. A possible theoretical explanation of this finding is the big-fish-little-pond theory (Marsh et al., 2008). Here, students in higher performing schools may have lower self-concepts because so many other students are performing relatively better academically, leading to lower effort and achievement by the affected students.
Mathematics Achievement
Table 4 repeats these regressions for advanced mathematics achievement. Table 4’s Model 1 indicates that large racial and ethnic disparities in advanced mathematics achievement occurred during each of the elementary grades. For Black and Hispanic students, the unadjusted ORs for advanced mathematics achievement ranged from 0.16 to 0.20 and 0.24 to 0.34 (ps < .001), respectively. AINAPI students were initially less likely to display advanced mathematics achievement in second (OR = 0.37) and third grade (OR = 0.24). However, these disparities were not statistically significant following corrections for multiple comparisons. In contrast, Asian students were more likely to display advanced mathematics achievement. Asian students were about twice as likely to display advanced mathematics achievement as White students by the end of fifth grade (OR = 2.1, p < .001). As indicated in Figure 4, Hispanic-White disparities became slightly smaller from first to third grade while Asian-White differences became slightly larger across the same time.
Odds Ratios From Logistic Regression Models of Advanced Mathematics Achievement in First, Second, Third, Fourth, or Fifth Grade, Kindergarten Predictors.
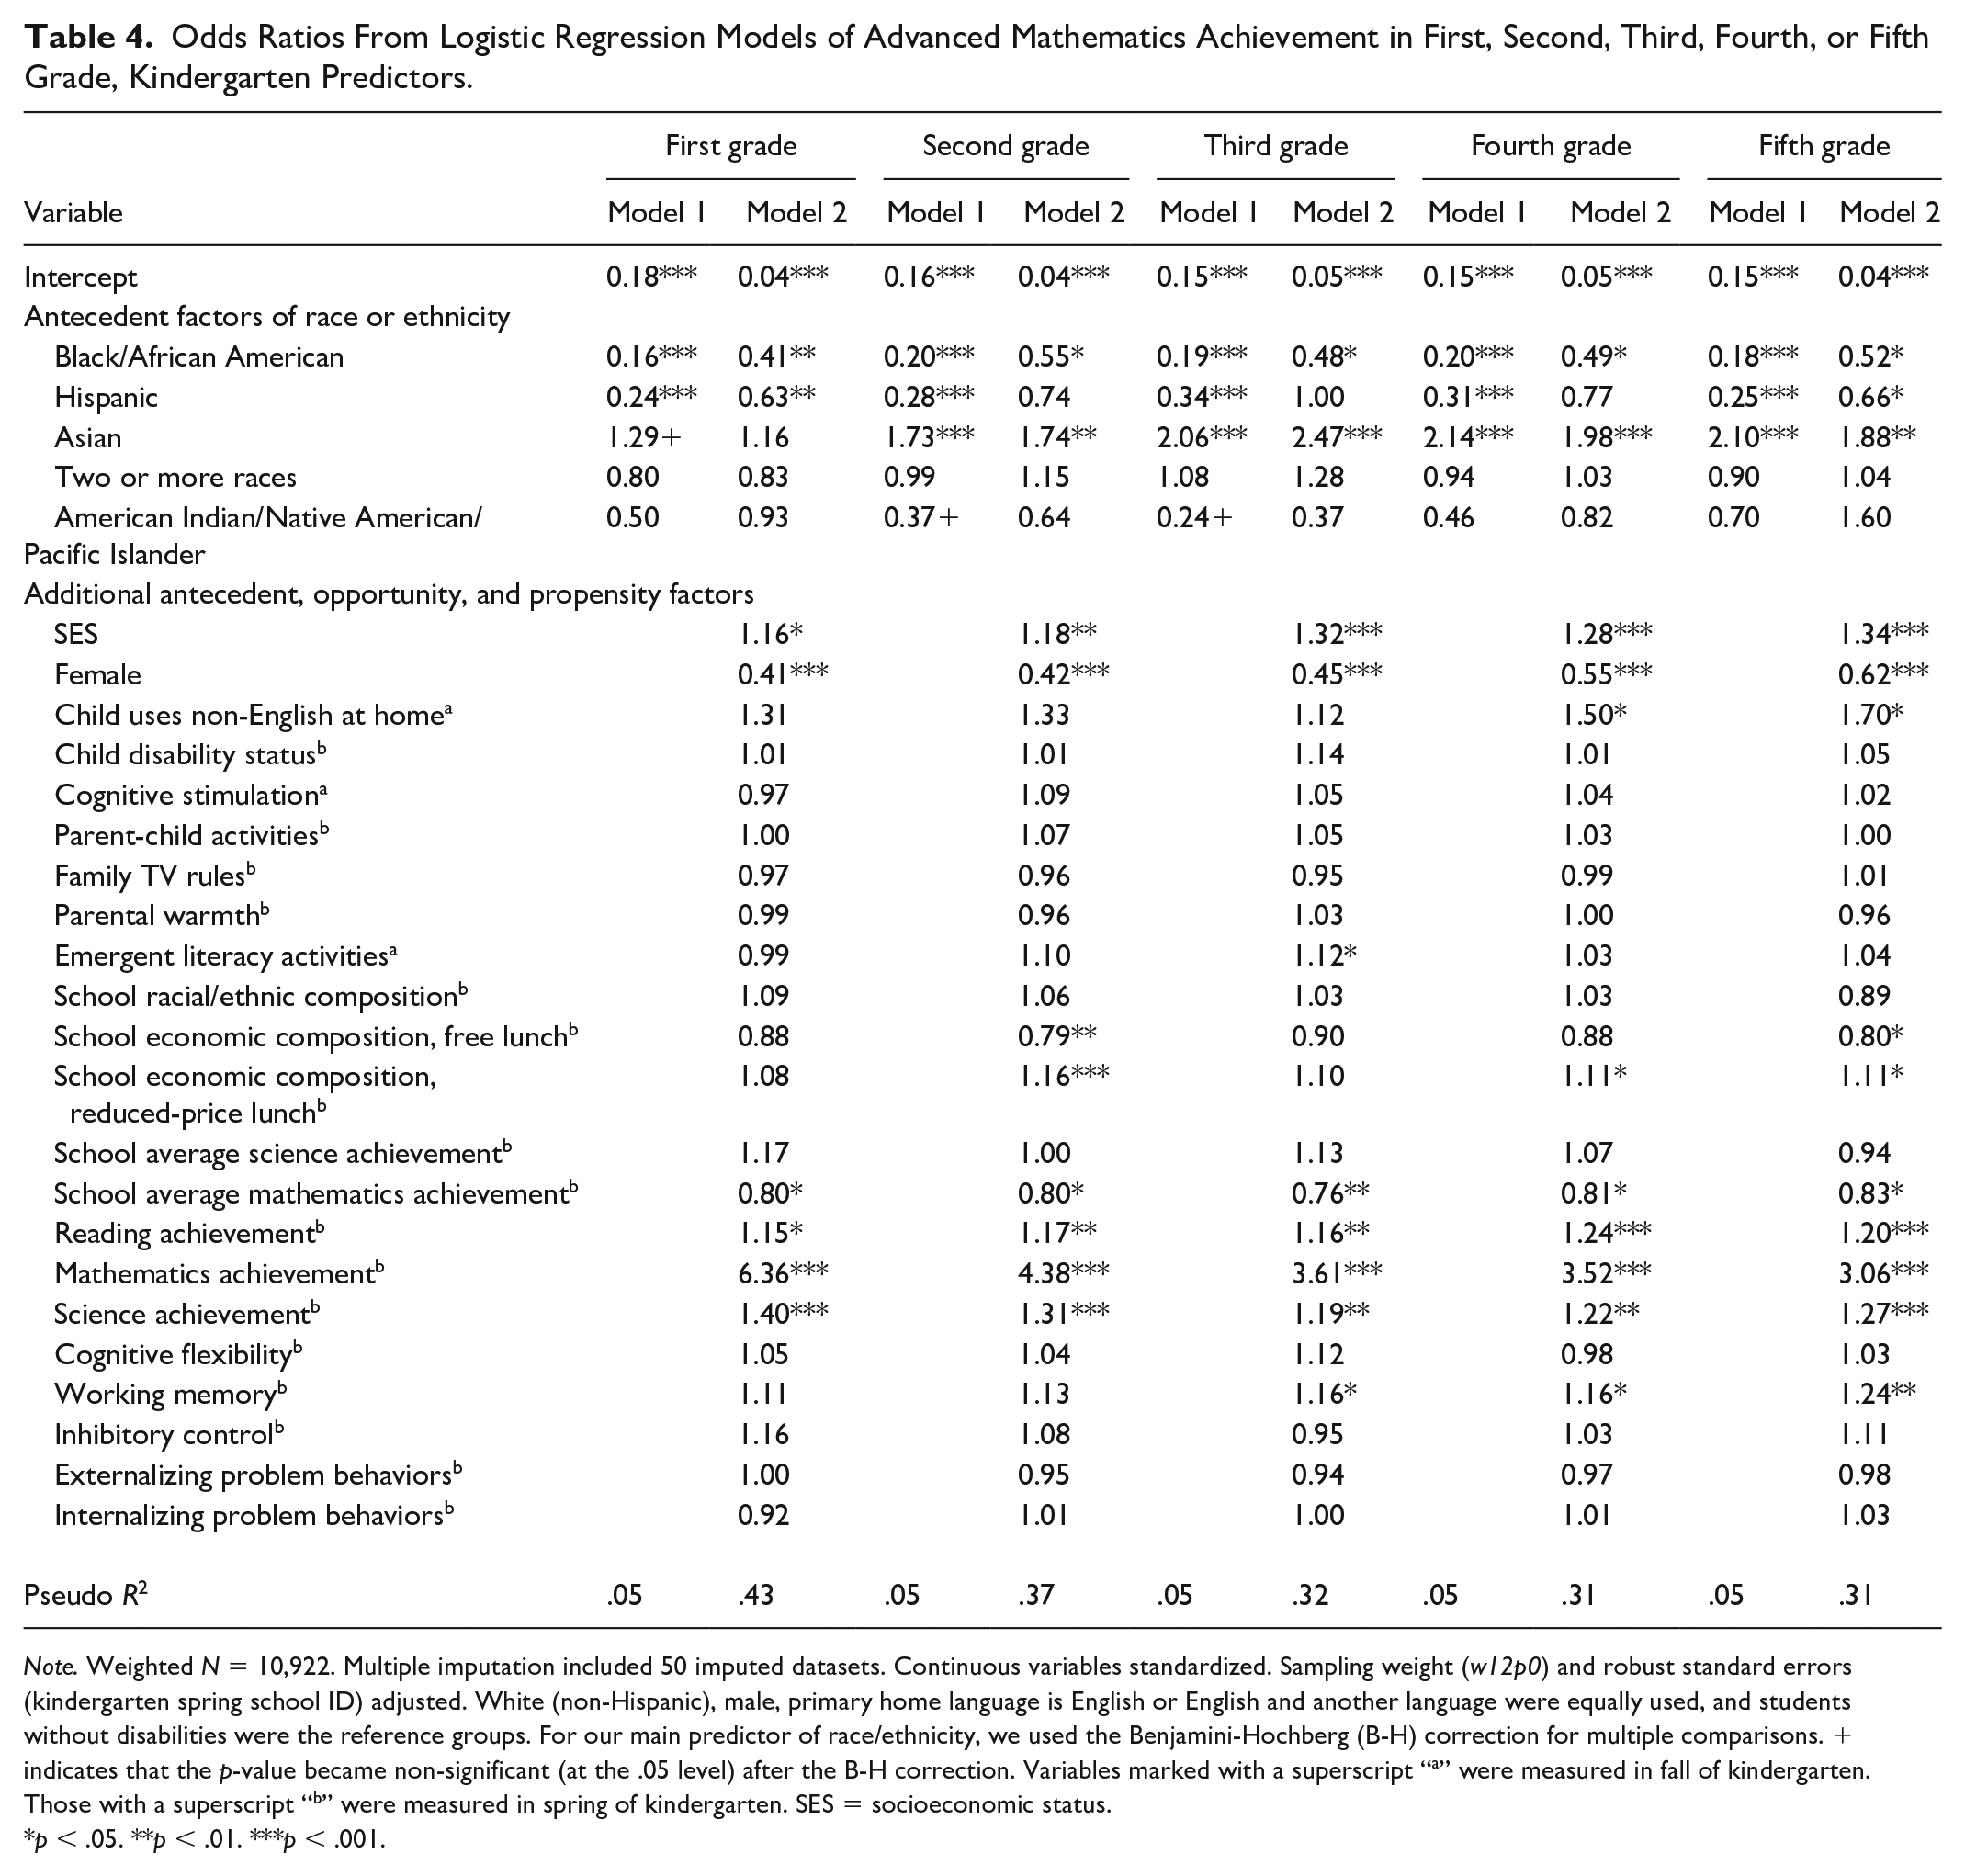
Note. Weighted N = 10,922. Multiple imputation included 50 imputed datasets. Continuous variables standardized. Sampling weight (w12p0) and robust standard errors (kindergarten spring school ID) adjusted. White (non-Hispanic), male, primary home language is English or English and another language were equally used, and students without disabilities were the reference groups. For our main predictor of race/ethnicity, we used the Benjamini-Hochberg (B-H) correction for multiple comparisons. + indicates that the p-value became non-significant (at the .05 level) after the B-H correction. Variables marked with a superscript “a” were measured in fall of kindergarten. Those with a superscript “b” were measured in spring of kindergarten. SES = socioeconomic status.
p < .05. **p < .01. ***p < .001.
Model 2’s antecedent, opportunity, and propensity factors significantly explained the disparities in advanced mathematics achievement between Black or Hispanic and White students. For example, the estimated ORs in first grade between Black and White students were substantially attenuated from 0.16 (p < .001) to 0.41 (p < .01) after accounting for Model 2’s explanatory factors. The disparity between Hispanic and White students during first grade was also substantially explained (i.e., OR reduction from 0.24 [p < .001] to 0.63 [p < .01]). The average percentage difference in relative odds of advanced mathematics achievement from first to fifth grade between Black and White students was reduced from 81% to 51%. The average percentage difference in relative odds of advanced mathematics achievement between Hispanic and White students was reduced from 72% to 24%. The initially observed disparities between AINAPI and White students in second and third grade were fully explained. There was some fluctuation in the ORs for the racial the ethnic disparities across grades, with slightly different trends in the lower versus upper grades. For example, Figure 5 indicates that Hispanic-White disparities were smaller from first to third grade and larger from third to fifth grade.
Children’s kindergarten mathematics achievement was the strongest predictor of whether they displayed advanced mathematics achievement in first, second, third, fourth, or fifth grade. Kindergarten reading and science achievement were also positive and significant predictors of advanced mathematics achievement across each of the subsequent elementary grades. Other consistently positive kindergarten predictors were the family’s SES and the student’s working memory. Females and those attending schools with higher average mathematics achievement had lower likelihoods of displaying advanced mathematics achievement at each grade level.
Discussion
Overview of Findings
We analyzed a population-based cohort of U.S. elementary schoolchildren followed from the fall of kindergarten to the spring of fifth grade to examine the early onset and over-time stability of racial and ethnic disparities in advanced science and mathematics achievement. We also examined to what extent antecedent, opportunity, and propensity factors explained these disparities. We hypothesized that Black, Hispanic, or AINAPI students would be less likely than White or Asian students to display advanced science or mathematics achievement by kindergarten as well as during first, second, third, fourth, and fifth grade. We further hypothesized that antecedent, opportunity, and propensity factors by the end of kindergarten would substantially or fully explain these disparities, particularly the antecedent factor of family SES and the propensity factors for acquiring advanced levels of science or mathematics skills (Byrnes, 2020).
Findings were largely consistent with our hypotheses. Large racial and ethnic disparities in advanced science or mathematics achievement occurred by the end of kindergarten and continued to occur at the end of first, second, third, fourth, and fifth grade. At the end of fifth grade, about 13% of White students and 22% of Asian students displayed advanced mathematics achievement. The contrasting percentages were 2% and 3% for Black and Hispanic students, respectively. About 7% of AINAPI students displayed advanced mathematics achievement at the end of fifth grade. These racial and ethnic disparities in advanced science and mathematics achievement were substantially or fully explained by the study’s antecedent, opportunity, and propensity factors. Particularly strong explanatory factors were the family’s SES and the student’s science, mathematics, and reading achievement by the end of kindergarten.
Study’s Strengths and Limitations
Strengths of our study include analyses of a population-based cohort followed from kindergarten entry to the end of fifth grade, individually administered and psychometrically strong measures of science, mathematics, and reading achievement, and data collected on a wide range of student, family, and school factors from a nationally representative sample of U.S. elementary schoolchildren. Although propensity factors strongly predict achievement growth including in STEM (Byrnes, 2020; Morgan et al., 2016), to what extent these factors explain racial and ethnic disparities in advanced STEM achievement including as early as kindergarten has been unknown (NAEP, 2020; Rambo-Hernandez et al., 2019). Our study establishes that student propensity factors by kindergarten strongly predict the early onset of racial and ethnic disparities in advanced STEM achievement throughout elementary school. We used antecedent, opportunity, and propensity factors measured by the end of kindergarten to explain racial or ethnic disparities at the end of each of the subsequent elementary grades. Doing so allowed us to report on direct effects of factors simultaneously adjusted for initial levels of science and mathematics achievement, thereby better identifying factors that might be targeted in experimentally evaluated interventions (VanderWeele, 2021). We also internally replicated our findings by separately examining each grade level.
Our study also has limitations. The ECLS-K:2011’s data collection began as students entered kindergarten. Data collection then ended as students exited fifth grade. We are unable to report on the onset, stability, or explanatory factors of racial and ethnic disparities in advanced science or mathematics achievement before kindergarten, during middle and high school, or into adulthood. We are also unable to report on the specific types of science, mathematics, or reading skills (e.g., scientific inquiry, knowledge of basic operations, oral vocabulary) most strongly predictive of the observed disparities. Only general science, mathematics, or reading achievement scores are available in the ECLS-K:2011. Although the term STEM includes other types of academic knowledge (Granovskiy, 2018), only science or mathematics achievement was assessed in the ECLS-K:2011. Our analyses did not examine how antecedent, opportunity, and propensity factors dynamically interrelate over time including through indirect effects (Lewis & Farkas, 2017).
We operationalized advanced science or mathematics achievement as being above the 90th percentile of the total achievement distribution. Although (a) our use of a 90th percentile cutoff is consistent with prior research (Bell et al., 2019; Plucker et al., 2010; Rambo-Hernandez et al., 2019) and (b) the findings were robust to using 75th and 95th cutoffs, we may have observed other findings using still other cutoffs including those indicative of extremely high achievement (e.g., 1-3%) and giftedness (e.g., McClain & Pfeiffer, 2012; Pennsylvania Department of Education, 2014). Relatedly, we operationalized advanced achievement as scores relative to the entire score distribution. Other findings might have emerged using other types of reference group operationalizations (e.g., Rambo-Hernandez et al., 2019; Rambo-Hernandez & McCoach, 2015). Some of the study’s analyses relied on small sample sizes. Small sample sizes increase the standard errors of the estimated coefficients. We were unable to include measures of early STEM attitudes and aspirations. Other work finds that gender disparities in STEM attitudes and aspirations emerge by kindergarten in analyses controlling for ability and, over time, predict lower likelihoods to pursue STEM degrees (Ceci et al., 2014). We were unable to examine the experiential knowledge of talented Black, Hispanic, and AINAPI students and their families through qualitative or mixed methods research (Gillborn et al., 2018).
Study’s Contributions and Implications
Our findings have theoretical and practical implications. Our results are largely consistent with the antecedent-opportunity-propensity theoretical framework (Byrnes, 2020) in which a relatively small set of student, family, and school factors explains racial and ethnic disparities in STEM achievement (Byrnes & Miller, 2007; Byrnes & Wasik, 2009; Wang, 2013). We substantially explained disparities between Black and White students as well as substantially or fully explained disparities between Hispanic and White students. This suggests that the study’s antecedent, opportunity, and propensity factors might constitute potential targets of economic and educational policies designed to address the observed disparities during early and middle childhood. The family’s SES and the student’s propensities for acquiring academic skills by kindergarten were consistently strong predictors of advanced STEM achievement during elementary school.
However, the study’s antecedent, opportunity, and propensity factors do not fully explain the observed racial disparities. For example, the antecedent, opportunity, and propensity factors fully explained the first grade Hispanic-White OR in advanced science achievement from 0.26 (p < .001) to 0.90 (p = .495). The first grade Black-White OR was substantially reduced from 0.19 (p < .001) to 0.52 (p < .01). Yet this and the other observed Black-White disparities were not fully explained and remained both practically and statistically significant. Our findings suggest that additional factors have yet to be identified that fully explain racial disparities in advanced STEM achievement during elementary school. Put another way, a relatively small set of student, family, and school factors mostly explain Hispanic-White or AINAPI-White disparities in advanced STEM achievement during elementary school. Black-White disparities in advanced STEM achievement during elementary school are still large after extensively accounting for such factors. This unexplained Black-White gap in advanced science and mathematics achievement is consistent with prior work (Fryer & Levitt, 2004) finding that Black- but not Hispanic-White achievement gaps in reading and mathematics among observationally similar kindergarten students increase over time, possibly due to Black students being more likely to attend lower quality schools and the increasing English proficiency of many Hispanic students. Further theoretical and empirical work that fully explains racial disparities in advanced STEM achievement is needed.
We add to the prior theoretical work by including additional antecedent and opportunity factors. Byrnes (2020) recently identified home language use and disability status as variables not previously included in studies evaluating the antecedent-opportunity-propensity framework. Our findings suggest that disability status does not predict racial and ethnic disparities in advanced science or mathematics achievement in analyses accounting for student propensity factors. However, we do observe that non-English-language use in the home repeatedly predicts a greater likelihood of displaying advanced science or mathematics achievement in adjusted analyses. Bilingualism may facilitate the learning of the complex rules and procedures integral to supporting advanced STEM achievement (Hartanto et al., 2018; Stocco & Prat, 2014). Children who are English Language Learners have been reported to be more likely to be identified as gifted during elementary school (Ricciardi et al., 2020). Our findings are also consistent with the big-fish-little-pond theory (Marsh et al., 2008) in which students attending schools averaging higher mathematics achievement may adopt lower self-concepts, leading to lower effort and achievement in science and mathematics by the affected students.
Our study also has practical implications. The early onset of racial and ethnic disparities in advanced STEM achievement has been unclear. Most prior work has investigated achievement gaps generally (Fryer & Levitt, 2004; Henry et al., 2020; Morgan et al., 2016; Navarro et al., 2012; Reardon & Galindo, 2009; Von Hippel et al., 2018). Work investigating disparities specifically in advanced STEM achievement has analyzed data from older elementary school students (NAEP, 2020; Rambo-Hernandez et al., 2019). By establishing that disparities in advanced STEM achievement occur by kindergarten and continue to occur throughout elementary school, our study provides new empirical knowledge about the populations of talented Black, Hispanic, and AINAPI students. These populations are currently understudied (Irizarry, 2015).
A practical implication of these findings is that factors present before kindergarten may largely explain racial and ethnic underrepresentation in STEM. Racialized K-12 educational processes may only partly explain underrepresentation in STEM, although these processes may contribute to or exacerbate such under-representation. This is because large and stable disparities in advanced science and mathematics achievement already occur by the end of kindergarten and so very early during children’s K-12 school careers. Antecedent, opportunity, and propensity factors measured by the end of kindergarten then substantially or fully explain racial and ethnic disparities in advanced science or mathematics achievement during first, second, third, fourth, and fifth grade. These early disparities may then differentially position White and Asian students to benefit from educational processes during middle and high school.
Currently, most efforts to address STEM underrepresentation begin in middle school, high school, or college (e.g., Alvarado & Muniz, 2018; Casto & Williams, 2020; Hinton et al., 2020; Jelks & Crain, 2020; McGee, 2020; Riegle-Crumb et al., 2019; Rozek et al., 2019). Yet large “leaks” in the metaphorical STEM pipeline likely occur by early childhood in the U.S. (Morgan et al., 2016). This suggests that the current emphasis on middle or high school or college (e.g., Hinton et al., 2020) may be too late to successfully address racial and ethnic disparities in STEM course taking, degree completion, and workforce participation.
Our findings are consistent with other work suggesting that STEM talent development efforts for Black, Hispanic, or AINAPI students should begin by elementary school (Alexander et al., 2012; McClure et al., 2017; Olszewski-Kubilius et al., 2016; Tai et al., 2006). That is, efforts to address STEM underrepresentation should focus more broadly on the social, economic, and educational processes already resulting in inequities in advanced STEM achievement by the elementary grades (Peters, 2021). Interests in feelings of efficacy towards STEM may be especially modifiable during this period (Hachey, 2020; Morgan et al., 2016; Penner & Paret, 2008; Pringle et al., 2012). Teachers and friends are more likely to support STEM interests during elementary school (Rice et al., 2013). STEM interest begins to decline by middle school as students begin viewing scientists as stereotypically White (Finson, 2010; Hachey, 2020; Wong, 2015). Racial and ethnic disparities in STEM career interest emerge by the start of high school (Saw et al., 2018).
Our findings are also consistent with prior work examining racial and ethnic gaps in academic achievement more generally (Kuhfeld et al., 2020; Morgan et al., 2016; von Hippel et al., 2018), and so again suggesting the potential importance of policies, programs, and practices during early and middle childhood (Currie & Almond, 2011; Ladson-Billings, 2006; Reardon et al., 2021). Addressing these disparities may require instruction designed to be culturally relevant, interesting, and engaging to students from underrepresented groups. Additional elements may need to include intensive supplemental enrichment and accelerated programming (Olszewski-Kubilius et al., 2016). Policies and programs explicitly designed to support the early talent development of students of color also may be necessary. Non-White families often lack access to the resources needed to support their children’s talent development (Plucker & Peters, 2016). Without additional support, these families and their children may continue to be under-served by U.S. elementary schools (Grissom & Redding, 2016). Our findings also align with work examining gender disparities in advanced STEM achievement. This work finds that early experiences and ecological factors help to explain gender disparities in advanced study in STEM (Ceci et al., 2014; Halpern et al., 2007).
Our study helps identify potential targets of policies and programs designed to address STEM underrepresentation. Consistent with prior work (Byrnes, 2020), we show that the antecedent factor of family SES and the student propensity factors of early science, mathematics, and reading achievement consistently and strongly explain racial and ethnic disparities in advanced STEM achievement. Because family SES is consistently related to the likelihood of displaying advanced science or mathematics achievement during elementary school in analyses adjusting for student propensity factors, economic policies that substantially reduce childhood poverty (e.g., expanded benefits, direct income transfers, and additional child tax credits), which should disproportionately benefit Black, Hispanic, or AINAPI students (Parolin et al., 2020), may help address racial and ethnic disparities in advanced science and mathematics achievement. Other work finds that family SES by kindergarten strongly predicts young children’s knowledge about the natural and social worlds as well as their science achievement as they age (Morgan et al., 2016). School-level poverty fully explains the association between school racial segregation and achievement gaps (Reardon et al., 2021). Economic and educational policies and programs that help support early STEM experiences by addressing adverse childhood experiences as well as limited access to high-quality child care and preschool may also be benefical (McClure et al., 2017; Peters, 2021). Additional possiblities for addressing racial and ethnic disparities in advanced science and mathematics achievement include increasing children’s early exposure to science and mathematics content through universal pre-K (Amadon et al., 2022) and preschool interventions (Dumas et al., 2019), practices using validated school-based instructional methods (e.g., peer-assisted tutoring, small-group instruction, play-based games) (de Chambrier et al., 2021; Dietrichson et al., 2021), and increased access to challenging curricula and summer programs (Little et al., 2018; Olszewski-Kubilius & Corwith, 2018).
Universally screening for advanced science and mathematics achievement to identify talented Black, Hispanic, and AINAPI students as early as the primary grades may also help address racial and ethnic disparities in advanced achievement (Matthews & Rhodes, 2020; Plucker & Peters, 2016). Such universal screening might use standardized measures of cognitive and non-cognitive skills instead of teacher nominations and referrals (Card & Giuliano, 2016; McBee et al., 2016; Wai & Lakin, 2020; Wai & Worrell, 2020). Elementary schoolteachers may be less likely to recognize students of color displaying advanced achievement, resulting in a lower access to enrichment activities and supports that might further develop their talents (Grissom & Redding, 2016; Irizarry, 2015). Universal screening using standardized measures increases participation in enrichment programs by racially and ethnically diverse elementary students (Card & Giuliano, 2016), which then contributes to their greater academic achievement (Card & Giuliano, 2014). Addressing the early onset and over-time stability of racial and ethnic disparities in advanced science and mathematics achievement through economic and educational policies and programs prior to or by school entry may be necessary for expanding racial and ethnic representation in gifted education (Peters, 2021) and the STEM workforce (NASEM, 2011; NSF, 2021) as well as ensuring the nation’s scientific innovation and resulting economic competitiveness (Bell et al., 2019; NASEM, 2011).
Supplemental Material
sj-docx-1-gcq-10.1177_00169862221128299 – Supplemental material for Racial and Ethnic Disparities in Advanced Science and Mathematics Achievement During Elementary School
Supplemental material, sj-docx-1-gcq-10.1177_00169862221128299 for Racial and Ethnic Disparities in Advanced Science and Mathematics Achievement During Elementary School by Paul L. Morgan, Eric Hengyu Hu, George Farkas, Marianne M. Hillemeier, Yoonkyung Oh and Cecelia A. Gloski in Gifted Child Quarterly
Footnotes
Declaration of Conflicting Interests
The author(s) declared no potential conflicts of interest with respect to the research, authorship, and/or publication of this article.
Funding
The author(s) disclosed receipt of the following financial support for the research, authorship, and/or publication of this article: Funding support provided by the National Science Foundation (#1644355; #1761012) and an infrastructure grant to the Population Research Institute (P2CHD041025) from the National Institute for Child and Human Health and Development, National Institutes of Health. No official endorsement should be inferred.
Open Science Disclosure Statement
The data analyzed in this study are publicly available at https://nces.ed.gov/ecls/kindergarten2011.asp (and the variables and data used for this study are identified through using the following code). The code used to generate the findings reported in the article are available at ![]() for purposes of reproducing the results or replicating the study. There are no other newly created, unique materials used to conduct the research.
for purposes of reproducing the results or replicating the study. There are no other newly created, unique materials used to conduct the research.
Notes
Author Biographies
References
Supplementary Material
Please find the following supplemental material available below.
For Open Access articles published under a Creative Commons License, all supplemental material carries the same license as the article it is associated with.
For non-Open Access articles published, all supplemental material carries a non-exclusive license, and permission requests for re-use of supplemental material or any part of supplemental material shall be sent directly to the copyright owner as specified in the copyright notice associated with the article.