
Abstract
Engagement behaviors are crucial for school success and are often targeted for improvement in school-based interventions. It may be helpful for both researchers and school-based practitioners to understand the likely impacts of interventions on engagement behaviors (e.g., to understand the extent to which engagement behaviors might change with treatment). For single-case studies designed to answer demonstration questions (i.e., including a baseline condition) and that were conducted in elementary classroom settings (N = 131), we calculated log response ratio and within-case standardized mean difference effect sizes for engagement dependent variables to establish benchmarks. We described differences based on study characteristics (functional relation determination, publication status, primacy of outcome), disability status of participants, and implementation characteristics (group size, implementer). Effect sizes (645 A-B comparisons) were heterogenous and varied based on functional relation determination, disability status, and implementation variables. More research is needed about additional variables that might explain heterogenous outcomes, especially for children with autism and behavioral disorders.
Engagement in educational activities may mediate learning and success in classroom contexts. Engagement in school is related to academic achievement (Lindstrom et al., 2021; Martins et al., 2022), challenging behavior (Archambault & Dupéré, 2017; Welsh et al., 2016), and peer relations (Martins et al., 2022). Measurement of engagement is complex (cf. Ledford, 2021; Lindstrom et al., 2021), in part because the construct can be considered to represent either a trait (e.g., a child is generally engaged in school) or a state (e.g., the child is engaged in an activity at this moment). When considered as a state, the behavior is highly context bound, meaning it is strongly influenced by immediate environmental variables and likely to change when contexts change (Sandbank et al., 2021; Yoder et al., 2018). For example, children are more likely to be engaged in free play and small-group activities rather than large-group activities in educational settings (Coelho et al., 2019; Johnson et al., 2021), and the momentary behavior of adults in classrooms can influence student engagement (Mason et al., 2020).
Children with a variety of disabilities, served under a range of special education eligibilities, may have lower levels of engagement in educational activities than their nondisabled peers. 1 These differences may have varied underlying causes. For example, autistic children may be less socially engaged in school settings, compared with matched peers (Locke et al., 2016; although some of these differences may also be attributable to the “double empathy” problem; cf. Milton et al., 2022); children with attention deficit hyperactivity disorder (ADHD) may be distractable and have difficulties sustaining attention, which can impact engagement in academic activities (American Psychological Association, 2013); children with behavioral disorders may have interfering behaviors that are incompatible with engagement (Chow & Wehby, 2019); and children with intellectual disabilities are more likely to have attending difficulties than typically developing children (Neece et al., 2011). Thus, given the potential importance of engagement to a variety of academic and social outcomes, and the likelihood of attending difficulties for a wide range of reasons and for many children, exploring engagement outcomes for young children is crucial.
Engagement states can be readily measured in the context of single-case-design research, given the propensity to change based on differing environmental conditions. In single-case research, assessment of context-bound behavior change, such as change in engagement states, has traditionally been conducted using visual analysis (Ledford & Gast, 2018). A benefit of this approach is that it allows for simultaneous assessment of common internal validity threats, such as history and maturation. It is also an accessible evaluation method (i.e., easily understood by teachers). However, the use of appropriate effect sizes in single-case research is becoming increasingly important because of the growing research base and the need to establish under what conditions an intervention is likely to produce given effects (Ledford et al., 2022; Shepley et al., 2022). Use of effect sizes allows for comparisons and synthesis across studies and facilitates identification of characteristics associated with variation in outcomes. Similar to effect sizes used in group-design studies, single-case-design effect sizes may also allow researchers to compare the magnitude of change in their own studies with those in other studies and potentially to make a priori, context-relevant predictions about the magnitude of change in forthcoming studies.
One single-case effect size metric that has desirable properties (see Ledford et al., 2022; Pustejovsky & Ferron, 2017) is the within-participant standardized mean difference (SMD), which is an estimate of magnitude of change based on mean differences between baseline and intervention conditions (Pustejovsky & Ferron, 2017). This effect size has the additional benefit of being similar to the often-used SMD effect sizes in group-design intervention work but without the limiting stipulations associated with across-participant SMD (also referred to as the design comparable effect size by the Institute of Education Sciences; What Works Clearinghouse, 2020). For example, use of the within-case SMD variation does not require specific design types and can be calculated when fewer than three participants are included in a study (see Maggin et al., 2022). The within-case SMD, unlike the more common SMD metrics in group-design research, comprise estimates of mean differences in behavior occurrence for a single case or participant, standardized by the variability of data also for that single participant.
Another useful effect size for single-case research designs is the log response ratio (LRR). Specifically, LRR is the natural logarithm of the proportional change between baseline and intervention conditions, and it is particularly relevant for estimating differences in incidence or prevalence of behaviors that are directly observed and measured on a ratio scale (Pustejovsky, 2015, 2018). This metric has a number of characteristics that make it desirable, including appropriateness for a wide variety of designs and less sensitivity to procedural variations than other metrics (e.g., different session lengths across studies; Pustejovsky, 2019). Unlike commonly used nonoverlap metrics, which estimate the degree of overlap between conditions, both of these metrics (LRR and within-case SMD) estimate magnitude of effect. Magnitude refers to degree to which the level of behavior is different between two different conditions, regardless of visual analysis or social importance.
Although SMD and LRR effect sizes are appropriate for estimating magnitude of single-case behavior change, the field has not established guidelines or benchmarks for interpreting the magnitude of these metrics. That is, no standards have been suggested regarding the extent to which a particular metric suggests that a change in behavior is small or large, whether it is socially valid or meaningful, or how it compares relative to effect sizes established in other studies. Such benchmarks may assist in appropriate and context-relevant interpretation of intervention efficacy. Only three studies (Chow, Ledford, et al., 2023; Chow, Morse, et al., 2023; Ledford et al., 2024) have produced empirically derived effect sizes for single-case-design studies for the purposes of establishing benchmarks (i.e., average effects likely for single-case-design studies in a given area). Those distributions for engagement and challenging behavior variables for young children (e.g., ages 3–5) in school settings provided evidence for heterogenous effect sizes that were related to a number of characteristics. Additional work is needed to empirically derive effect sizes, especially with large bodies of work for school-age children and in relation to implementation variables, which the field currently lacks. Given single-case effect sizes do not have established benchmarks for small, medium, and large effects comparable to those established in group-design work (i.e., Cohen, 1988), these empirically derived distributions are helpful for situating a given effect size in the context of specific areas of research, functioning much like similar studies in group design research (e.g., Chow et al., 2022; Tanner-Smith et al., 2018). Thus, the purpose of this study was to describe effect size distributions for school-based interventions designed to improve engagement for elementary-age children with and without disabilities. We also describe differences in distributions based on participant and study characteristics, including (a) functional relation determination, (b) publication status, (c) dependent variable type, (d) disability status, (e) implementer, and (f) group size. Given lack of previous work in the area, we did not have specific, directional hypotheses; all analyses were exploratory and descriptive.
Method
To address the purpose of our study, we first identified existing research that met inclusion criteria, coded descriptive information, calculated effect size estimates, and descriptively analyzed differences based on potentially impactful characteristics.
Search
We searched for eligible published and unpublished single-case studies using electronic databases PsycINFO, ProQuest Dissertations and Theses, and PubMed. A Preferred Reporting Items for Systematic Reviews and MetaA- nalyses (PRISMA) diagram and descriptions of search terms are available in the supplemental materials (https://osf.io/hstgw/). All eligible studies from all age groups were initially screened; then studies were divided into groups by age (preschool, elementary age, secondary age, mixed), and only studies that measured individual data for participants in elementary school (see inclusion criteria and PRISMA diagram) are included in this report. Full-text screening was conducted for 323 sources; two independent screeners conducted screening for 108 of those 323 sources (33%).
Inclusion Criteria
Inclusion criteria included (a) availability in the English language, (b) that the study was conducted in a school setting for children identified as being in elementary school or in Grades K–5 or who were 5 to 10 years of age and not identified as being in a non-elementary setting (e.g., a 5-year-old in a preschool setting was excluded, but a 4-year-old identified as being in kindergarten was included), (c) observational data on a behavior broadly defined as engagement or being on task that were graphed, (d) use of a single-case design with three potential demonstrations of effect, (e) inclusion of a baseline (no-treatment, business-as-usual) condition in comparison to an educational (nonpharmaceutical) intervention with at least three data points in both baseline and intervention conditions, and (f) measurement of behavior for an individual (rather than, for example, classwide behavior change). We did not include designs with fewer than three adjacent demonstrations (e.g., A-B-C-A-B) or time-lagged designs with nonconcurrent measurement, use of measurement systems that were not ratio based (e.g., rating scales), or measures of non-engagement (off-task) behaviors.
Coders
Coders were two doctoral-level faculty members in special education departments at two different institutions (first and third authors; one White non-Hispanic woman and one Asian man) and two doctoral students (second and fourth authors; both White non-Hispanic women). One faculty member and both doctoral students held certifications as behavior analysts; both faculty members and one doctoral student held previous teaching certifications. Data extraction was completed by eight master's students who all identified as women (in special education, applied behavior analysis, and child studies program areas) with oversight and data checking from the first author.
Coding
The four authors coded eligible studies via the Research Electronic Data Capture tool hosted at Vanderbilt University (Harris et al., 2009). Authors double-coded 50 of 131 included studies (38%) and discussed all discrepancies; data presented are those determined to be correct after discrepancy discussions. We conducted 100% double coding for initially coded studies until all coders were reliable and then conducted weekly reliability on a small, randomly selected percentage of articles thereafter. See the coding manual in the supplemental materials. For each source, we coded the publication status (published, unpublished), publication outlet (journal name or “unpublished”), year of availability (publication or defense date), and a confirmation that the source met inclusion criteria. For each participant, we coded reported gender, age, race, ethnicity, and disability category (or “no disability”). For each single-case design, we coded the design type (e.g., multiple baseline across participants, A-B-A-B), a confirmation that the design represented a demonstration rather than a comparison design (Ledford & Gast, 2018; because effect sizes that represent the difference between two intervention conditions are interpreted differently than those that represent a change from baseline to intervention conditions), whether a functional relation could be established (i.e., if baseline engagement data were at or near ceiling levels, a “no” would be coded here), and whether a functional relation was present or absent (if establishing a functional relation was possible). We also coded whether the variable was the primary variable in a study or a secondary variable (generally, whether condition-change decisions were made based on the variable of interest; see rules in the codebook in the supplemental materials). We also coded the size of the group during teaching (e.g., while instruction or supports were happening) and during outcomes measurement (e.g., representing data shown on the graph). An example of this distinction can be found in a common intervention called “check-in, check-out,” where there are individually implemented teaching and check-in components but outcome measurement typically occurs during typical instructional activities. In this case, we coded individual for teaching group size and whole group for measurement group size. Interventions could also have the same teaching and measurement context (e.g., a teacher implemented a behavior-specific praise intervention during whole group, and that is also when measurement occurred). We coded implementer status for both teaching and measurement contexts as researcher, endogenous implementer, or unreported.
Data Extraction
We extracted data using PlotDigitizer, a free program for extracting single-case data from graphs (Huwaldt & Steinhorst, 2020). Data were extracted by master's students and were checked for apparent accuracy by the first author by visually comparing each graph and the plot digitized data values to ensure they were a reasonable match (i.e., that the correct data were digitized). Identified errors were re-extracted. Double coding was conducted for 54 effect sizes (17%) by subtracting the smaller from the larger value, dividing that value by the maximum Y-value, and multiplying by 100. Plot-digitized data are available in the supplemental materials. We decided to conduct double coding for 17% of effect sizes given typical high agreement for this process as well as high reliability in previous studies conducted by our research team (Chow, Ledford, et al., 2023; Chow, Morse, et al., 2023; Ledford et al., 2024; Moeyaert et al., 2016).
Effect Size Calculation
We calculated within-case SMD and LRR effect sizes using the SingleCaseES package (Pustejovsky & Swan, 2018) in the R statistical environment (R Core Team, 2022; code available in the supplemental materials). LRR is the natural logarithm of the proportional change between baseline and intervention conditions, and SMD is the standardized mean difference of means between conditions. We used the LRRi specification because therapeutic behavior change occurs when behaviors increase. We used the standard deviation of baseline (as opposed to a pooled standard deviation) to scale differences between conditions. We removed extreme values (i.e., effect size values over 100; these values often occur when data are at or near zero levels in baseline; n = 7 effect sizes for SMD only). Then, we calculated the median effect size and standard deviation for all remaining effect sizes and removed outliers that were more than three standard deviations from the median (n = 17 LRR effect sizes; n = 21 SMD effect sizes). Overall, this resulted in removal of 3.49% of total effect sizes and resulted in data analyses and graphic representations that were more easily interpretable and representative of the vast majority of available data. Quartile analyses occurred for remaining effect sizes and were calculated in Microsoft Excel (file available in the supplemental materials) using formulas for minimum, first quartile, median, third quartile, and maximum values. Given our purpose was to describe the distribution of effect sizes (rather than to derive a specific estimate of a population characteristic), we did not conduct additional analyses for combining data from the same participants, designs, or sources. That is, each effect size represents a single A-B comparison from one participant.
We used GraphPad Prism (Version 9.5.1) graphing software to calculate and graph correlations and frequency distributions for LRRi and SMD effect sizes (PRISM file available in the supplemental materials). For most categories, there were no missing effect sizes. For disability category comparisons, we did not include categories with fewer than 20 effect sizes across fewer than 10 studies (developmental delay, n = 9 effect sizes; intellectual disability, n = 9 effect sizes; other or specific category not reported, n = 10 effect sizes). For implementer, we did not include effect sizes for which the implementer was unclear in the teaching context, measurement context, or both. For group size, we did not include effect sizes for which the arrangement was unclear in the teaching context, measurement context, or both.
Results
Study Characteristics
We extracted data from 131 sources, including 64 unpublished dissertations and theses (with 333 effect sizes) and 67 articles published in peer-reviewed journals (with 312 effect sizes). Most effect sizes were associated with A-B-A-B designs (n = 310, 48%) or multiple-baseline designs across participants (n = 230, 36%), with 37 effect sizes associated with multiple-probe designs across behaviors (6%) and 34 effect sizes associated with alternating-treatments designs and multiple-baseline designs across behaviors, social partners, or contexts (n = 5% each). For 382 effect sizes (59%), coders determined that a functional relation was present in the associated single-case design, whereas for 218 effect sizes (34%), coders determined that no functional relation was present. Remaining effect sizes (n = 45, 7%) were associated with designs for which coders could not determine whether a functional relation existed (due to visual analysis concerns, such as behavior at ceiling levels during baseline). Coders identified dependent variables as primary for 389 (60%) and secondary for 256 (40%) effect sizes.
Participant and Implementation Characteristics
Studies included 90 participants identified as girls (21%; 127 effect sizes), 320 identified as boys (73%; 471 effect sizes), and 27 with no identifiable gender (number of participants was smaller than number of comparisons because some participants had multiple associated effect sizes; 47 effect sizes). No participants were identified with any other gender expression (e.g., nonbinary). The mean age was 8.5 years, with a median of 8 years and a range of 4 to 14 years (one 4-year-old was identified as being in a kindergarten classroom, and one 14-year-old was identified as being in an elementary school classroom with no grade named). Most effect sizes were associated with students without a reported race (n = 302). When reported, effect sizes were associated with students identified as White (n = 183, 53%), Black (n = 133, 39%), Asian (n = 17, 5%), Middle Eastern (n = 6, 2%), and multiple races (n = 4, 1%). Most effect sizes were associated with participants who were not identified as Hispanic or non-Hispanic (i.e., ethnicity was not reported; n = 555, 86%), with 73 effect sizes for participants identified as Hispanic (11%) and 17 for participants identified as non-Hispanic (3%).
Most effect sizes were associated with students who had identified disabilities (n = 453, 70%), with 111 effect sizes associated with participants identified as autistic (17%), 109 effect sizes for participants with ADHD diagnoses or other health impairment (OHI) eligibilities (17%), 48 effect sizes for participants with learning disabilities (7%), 36 effect sizes for participants with behavioral disorders (6%), and 23 effect sizes for participants with speech impairments (4%). There were 192 effect sizes (30%) associated with participants with no identified disability.
The largest number of effect sizes (n = 389, 60%) were associated with interventions implemented by endogenous implementers (during both teaching and measurement contexts, when they were different). For 114 effect sizes (18%), interventions were implemented by researchers (during both teaching and measurement contexts), and 62 effect sizes (10%) were associated with interventions that were implemented by a researcher but with measurement occurring with an endogenous implementer (e.g., individual teaching conducted by a researcher, followed by measurement during a typical math class). Remaining effect sizes (n = 80, 12%) were associated with unclear implementers in teaching and/or measurement contexts.
An equal number of effect sizes was associated with interventions taught and measured in whole-group activities (n = 171, 27%) and taught and measured in individual contexts (e.g., one to one; n = 171, 27%). Fewer effect sizes were associated with individual teaching and whole-group measurement contexts (n = 41, 6%) or small-group teaching with either small or whole-group measurement contexts (n = 55, 9%). Remaining effect sizes (n = 207, 32%) were associated with unclear group size in one or both contexts.
Overall Effect Size Distributions
The median LRRi effect size (following exclusion of outliers; n = 17) was 0.40, with a range from −1.41 to 2.21 and first and third quartile values of 0.19 and 0.76. The median SMD effect size (following exclusion of outliers; n = 21) was 1.69, with a range of −2.83 to 13.98 and first and third quartile values of 0.85 and 2.90. See distributions for both effect size metrics in the right panels of Figure 1. The Pearson's product moment correlation between LRRi and SMD effect sizes was r = 0.66 (p < .0001; see scatterplot of LRRi and SMD values in the left panel of Figure 1). Although correlated, absolute values of the effect sizes were dissimilar, with a wider range for SMD (for ease of analysis and comparison with LRR values, fewer than 5% of values ranging between 8.0 and 14.0 are not shown in the histogram on the bottom right).
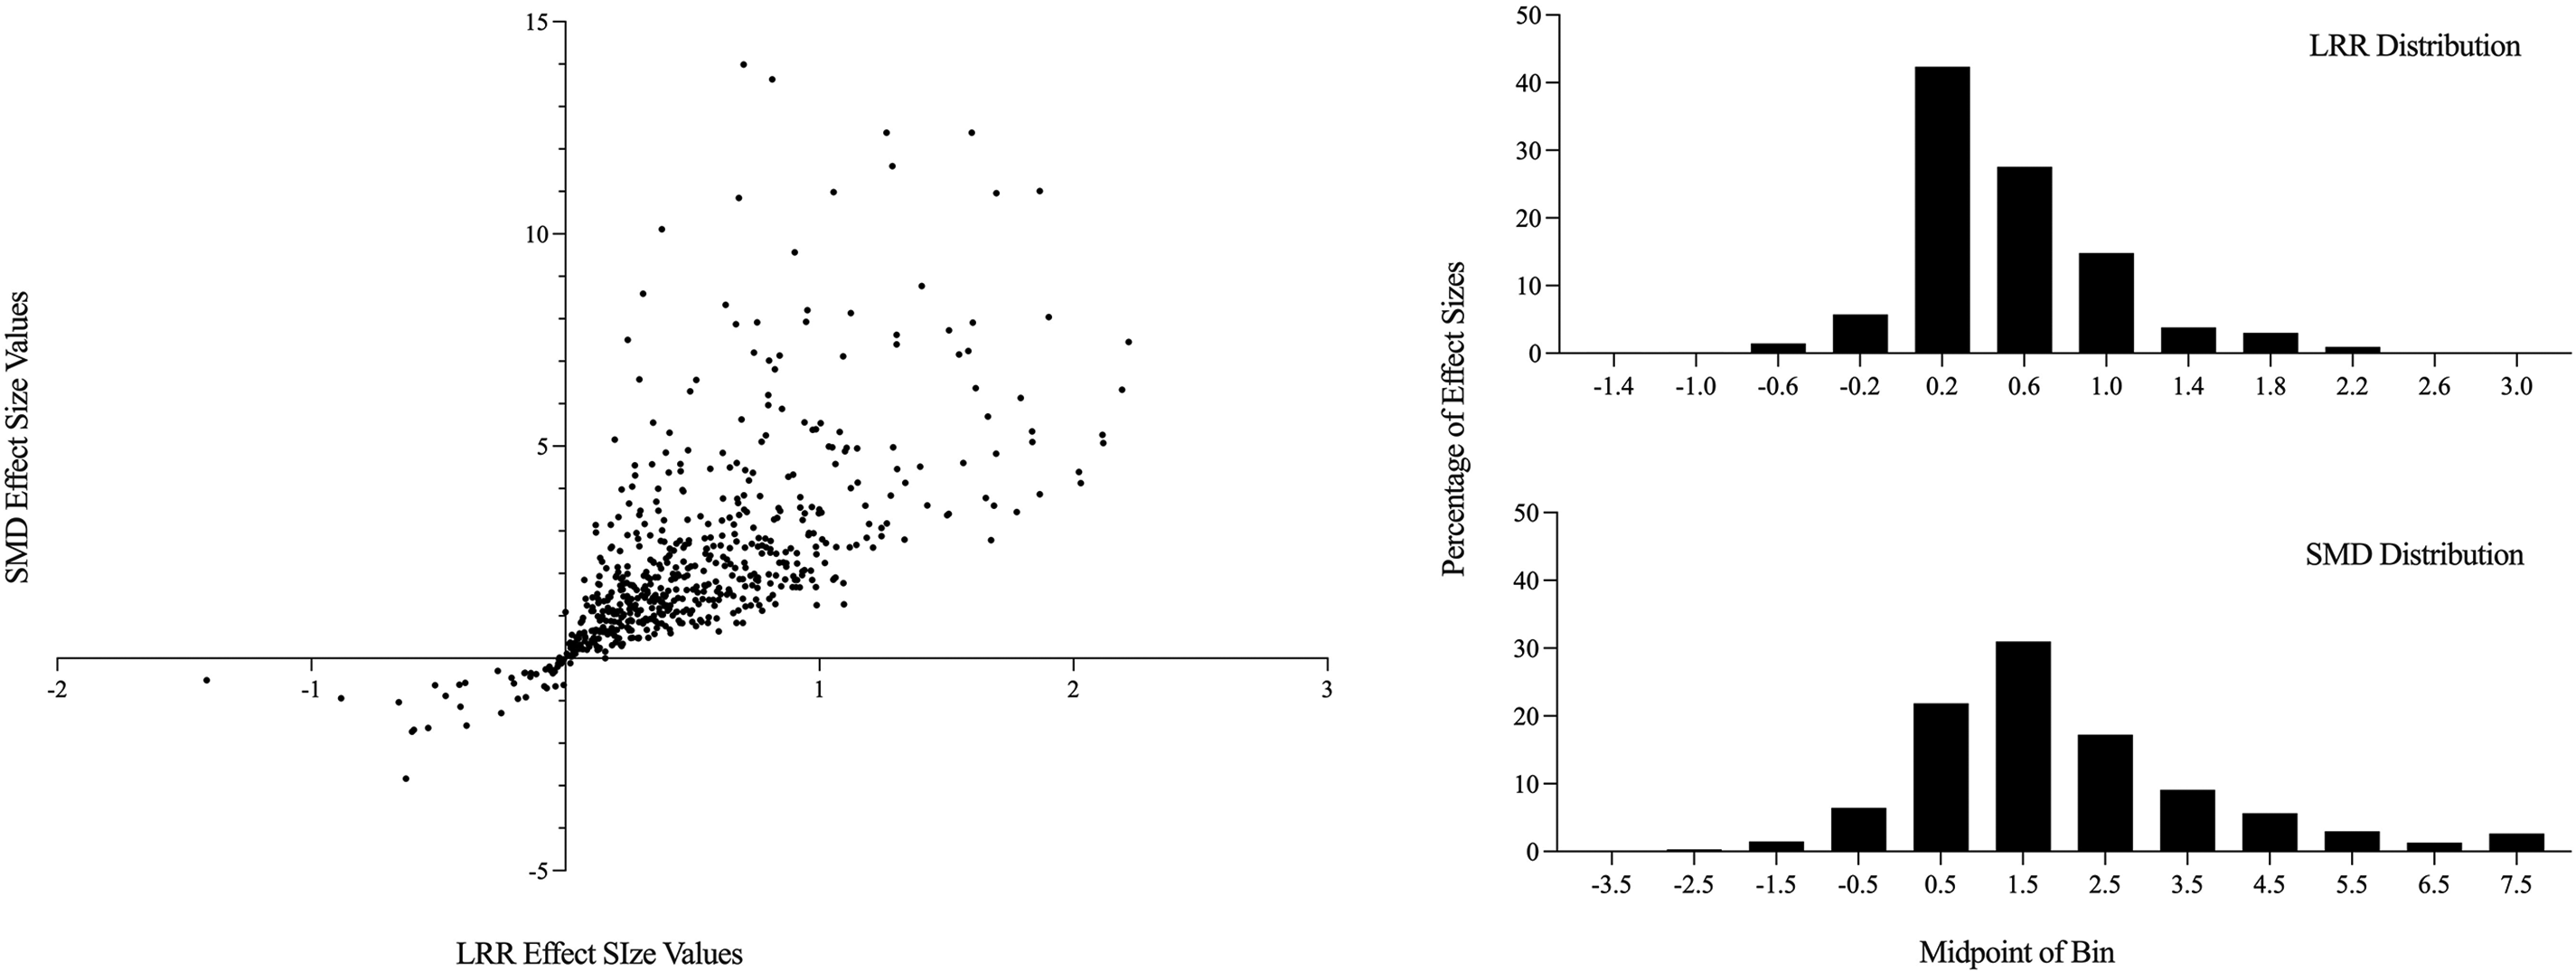
Overall effect size distributions for SMD and LRR and correlations between metrics. SMD = within-case standardized mean difference; LRR = log response ratio, increasing.
Across-Group Differences in Effect Size Distributions
We descriptively analyzed differences in median effect size values for both metrics based on functional relation determination, publication status, dependent variable type, disability status, and implementation variables. Tables 1 and 2 show descriptive statistics for all comparisons for LRRi and SMD, respectively. We note that the number of comparisons varies across groups, which has implications for the precision of estimates (i.e., certainty around range of effect sizes for a particular disability group is lower than that of the overall estimates for all groups combined).
Across-Group Differences in LRR Effect Size Distributions.
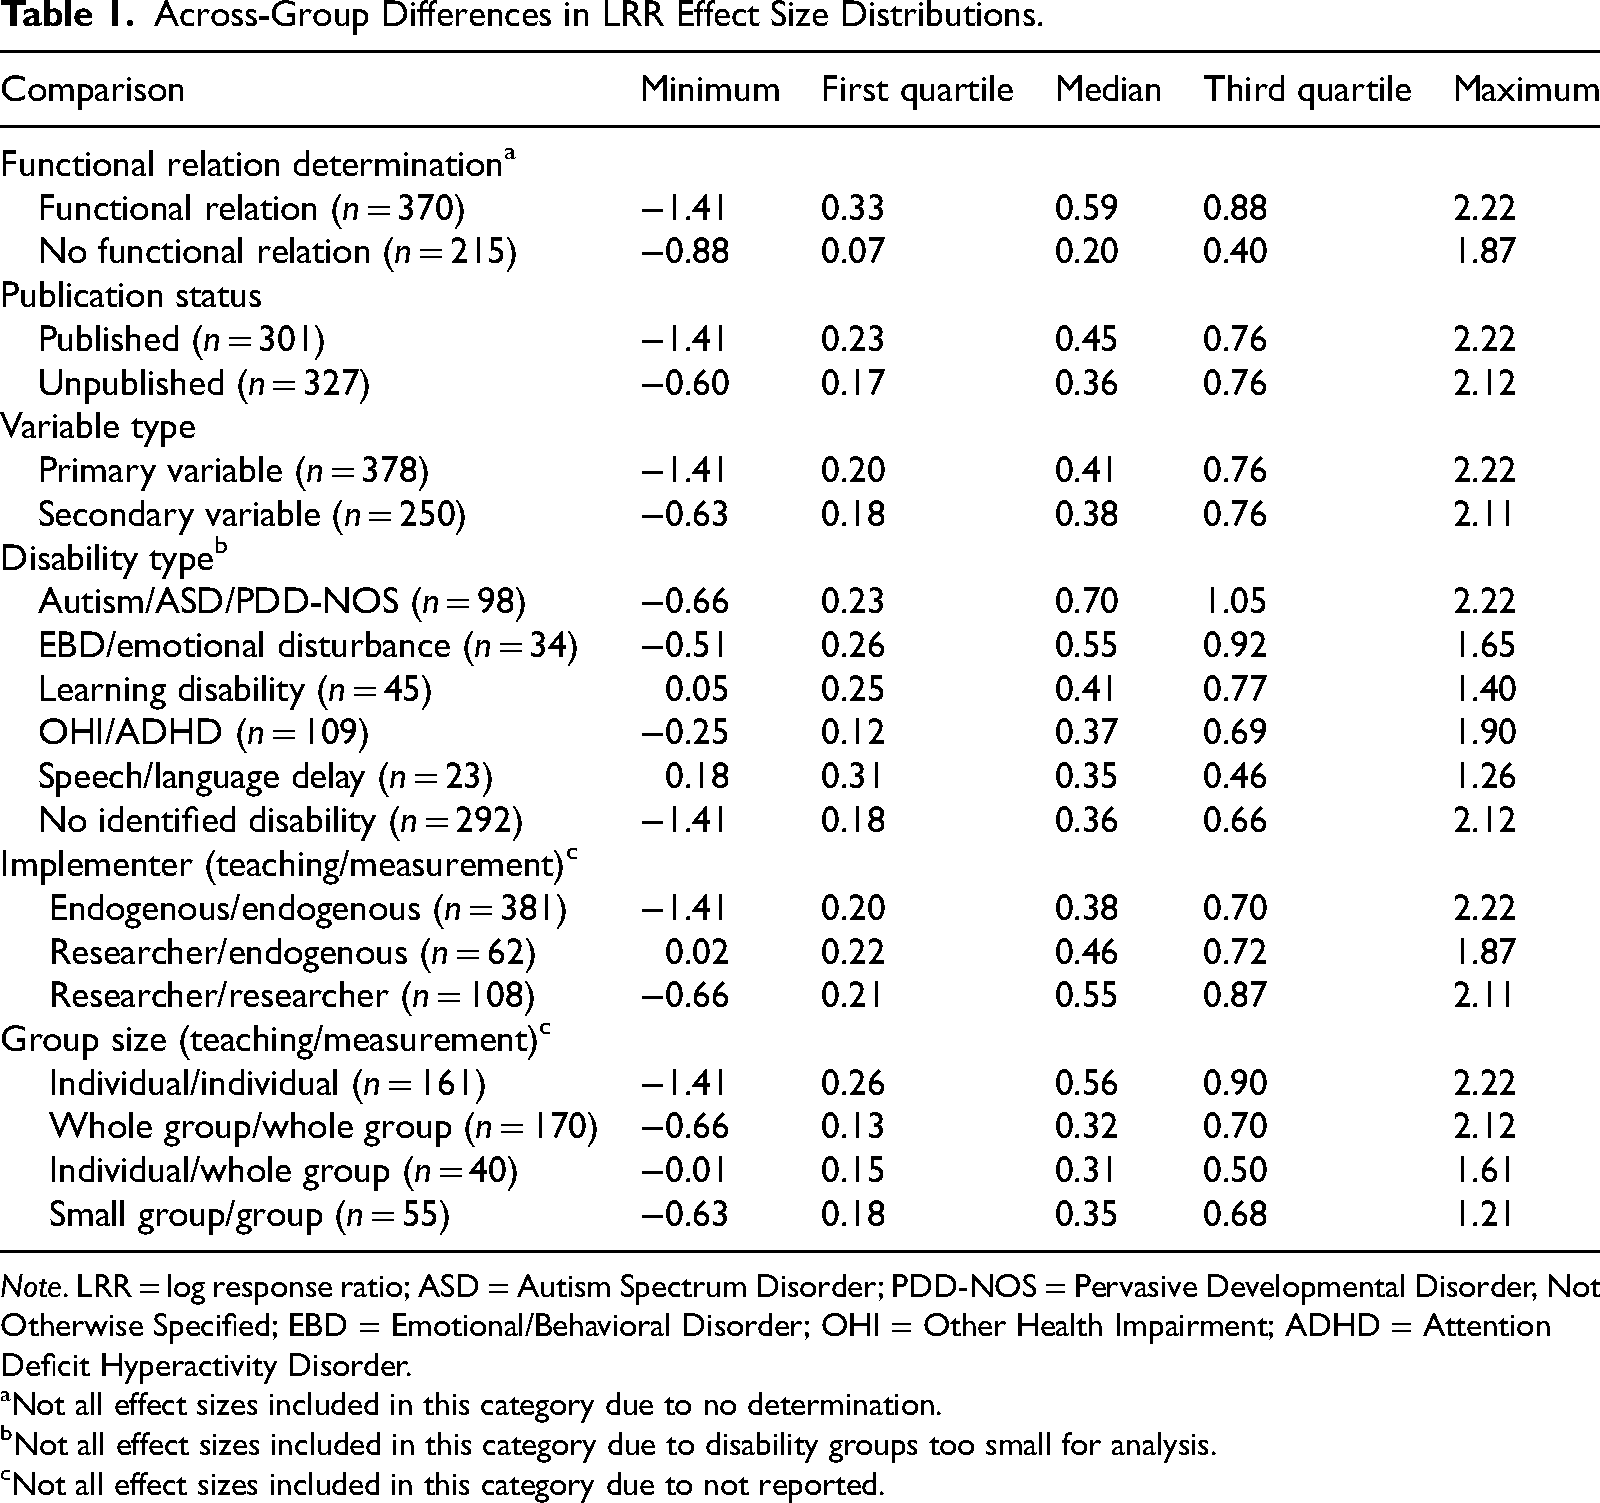
Note. LRR = log response ratio; ASD = Autism Spectrum Disorder; PDD-NOS = Pervasive Developmental Disorder, Not Otherwise Specified; EBD = Emotional/Behavioral Disorder; OHI = Other Health Impairment; ADHD = Attention Deficit Hyperactivity Disorder.
Not all effect sizes included in this category due to no determination.
Not all effect sizes included in this category due to disability groups too small for analysis.
Not all effect sizes included in this category due to not reported.
Across-Group Differences in SMD Effect Size Distributions.
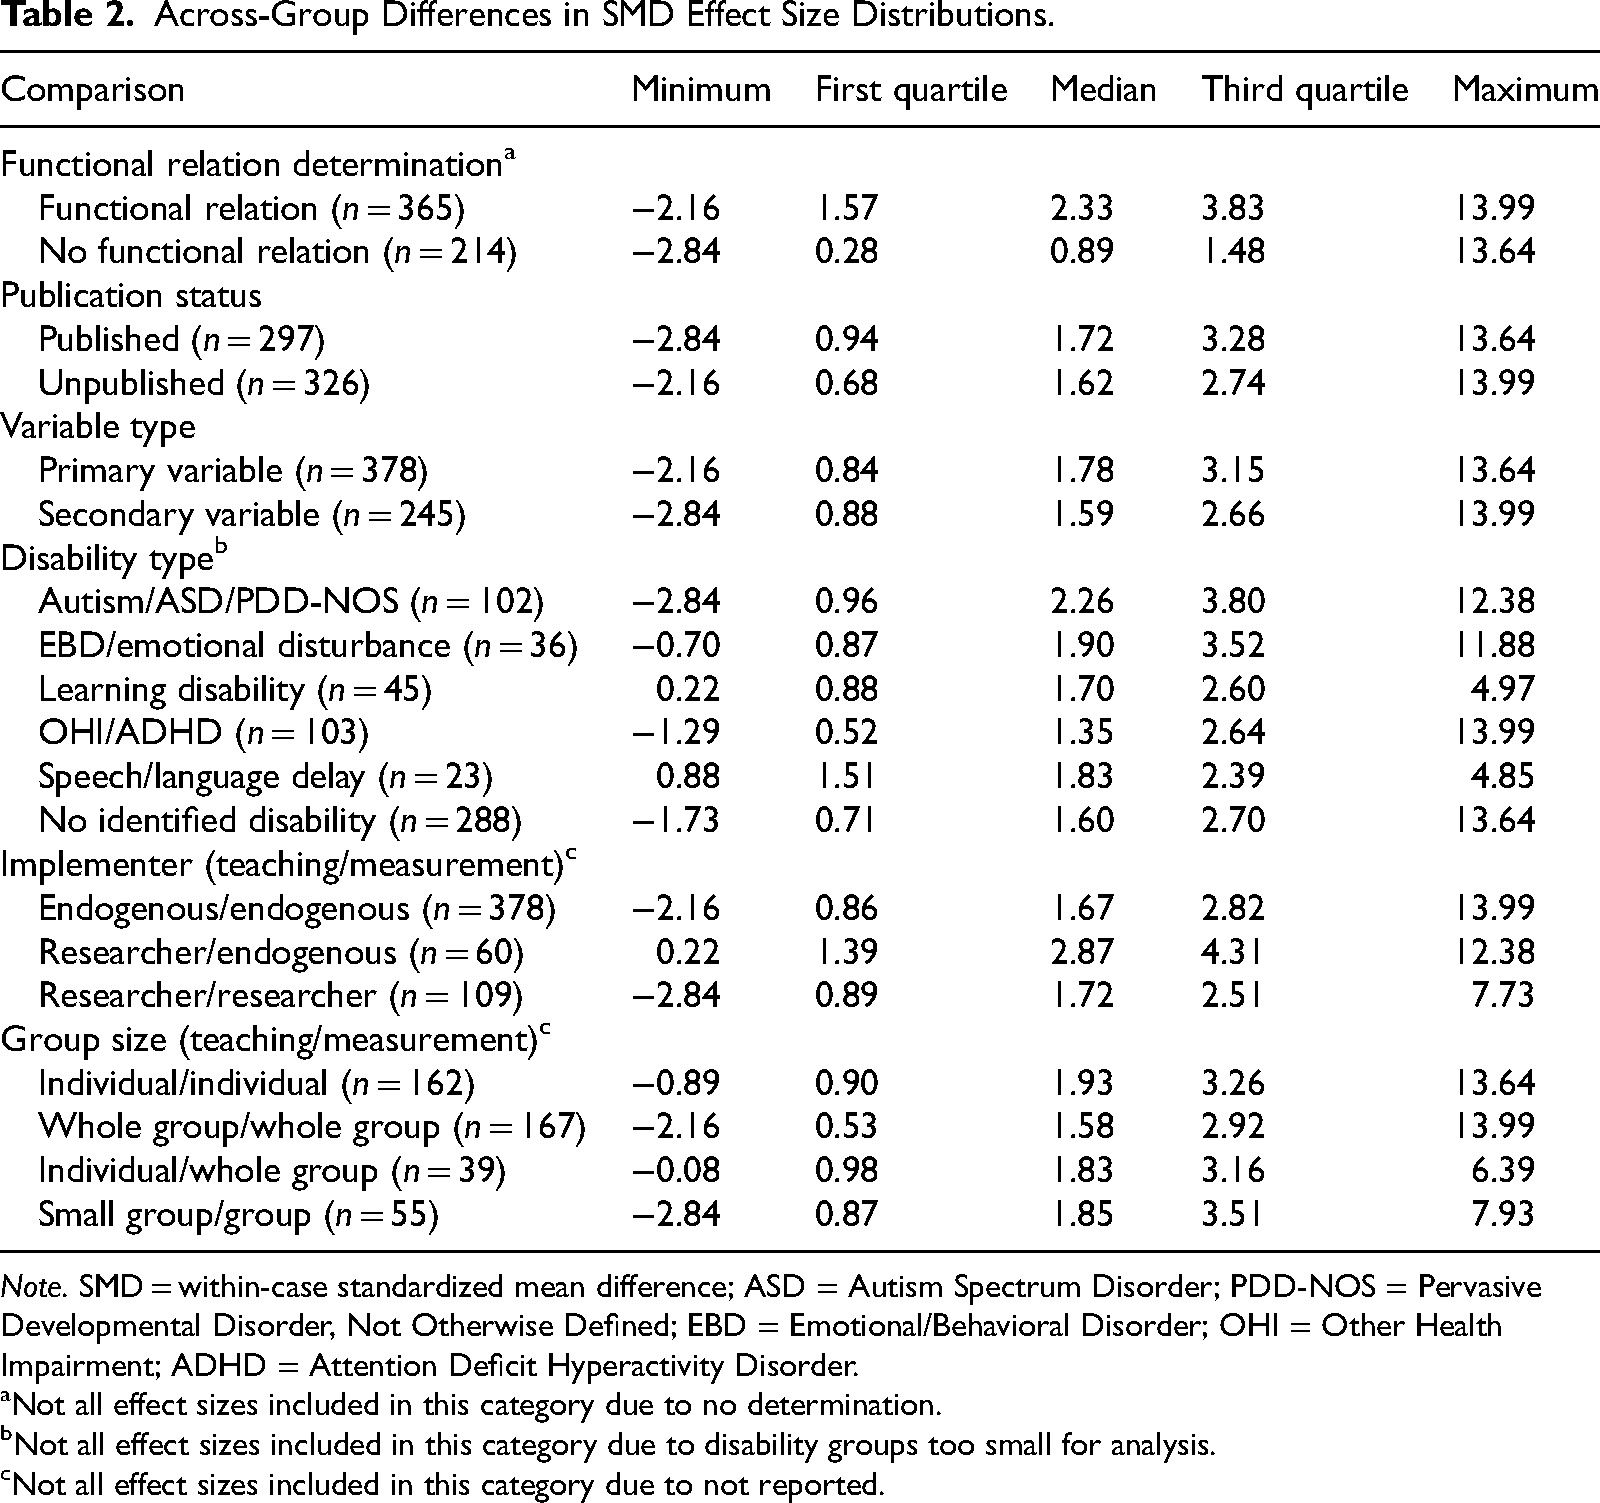
Note. SMD = within-case standardized mean difference; ASD = Autism Spectrum Disorder; PDD-NOS = Pervasive Developmental Disorder, Not Otherwise Defined; EBD = Emotional/Behavioral Disorder; OHI = Other Health Impairment; ADHD = Attention Deficit Hyperactivity Disorder.
Not all effect sizes included in this category due to no determination.
Not all effect sizes included in this category due to disability groups too small for analysis.
Not all effect sizes included in this category due to not reported.
Study Characteristics
Functional relation determination
Median effect sizes associated with designs for which a functional relation was established (LRRi Mdn = 0.59, SMD Mdn = 2.33) were larger than those associated with designs with no functional relation (LRRi Mdn = 0.20, SMD Mdn = 0.89) and those for which a functional relation could not be determined (LRRi Mdn = 0.19, SMD Mdn = 1.09). The top panel of Figure 2 shows distributions for functional relation status indicating that most effect sizes for studies with no functional relation or no determination were small but positive (0.0–0.4 for LRR; 0.0–2.0 for SMD), with fewer negative effect sizes. The distributions for designs with functional relations were almost entirely on the positive side of the dotted line (indicating effect sizes greater than 0).
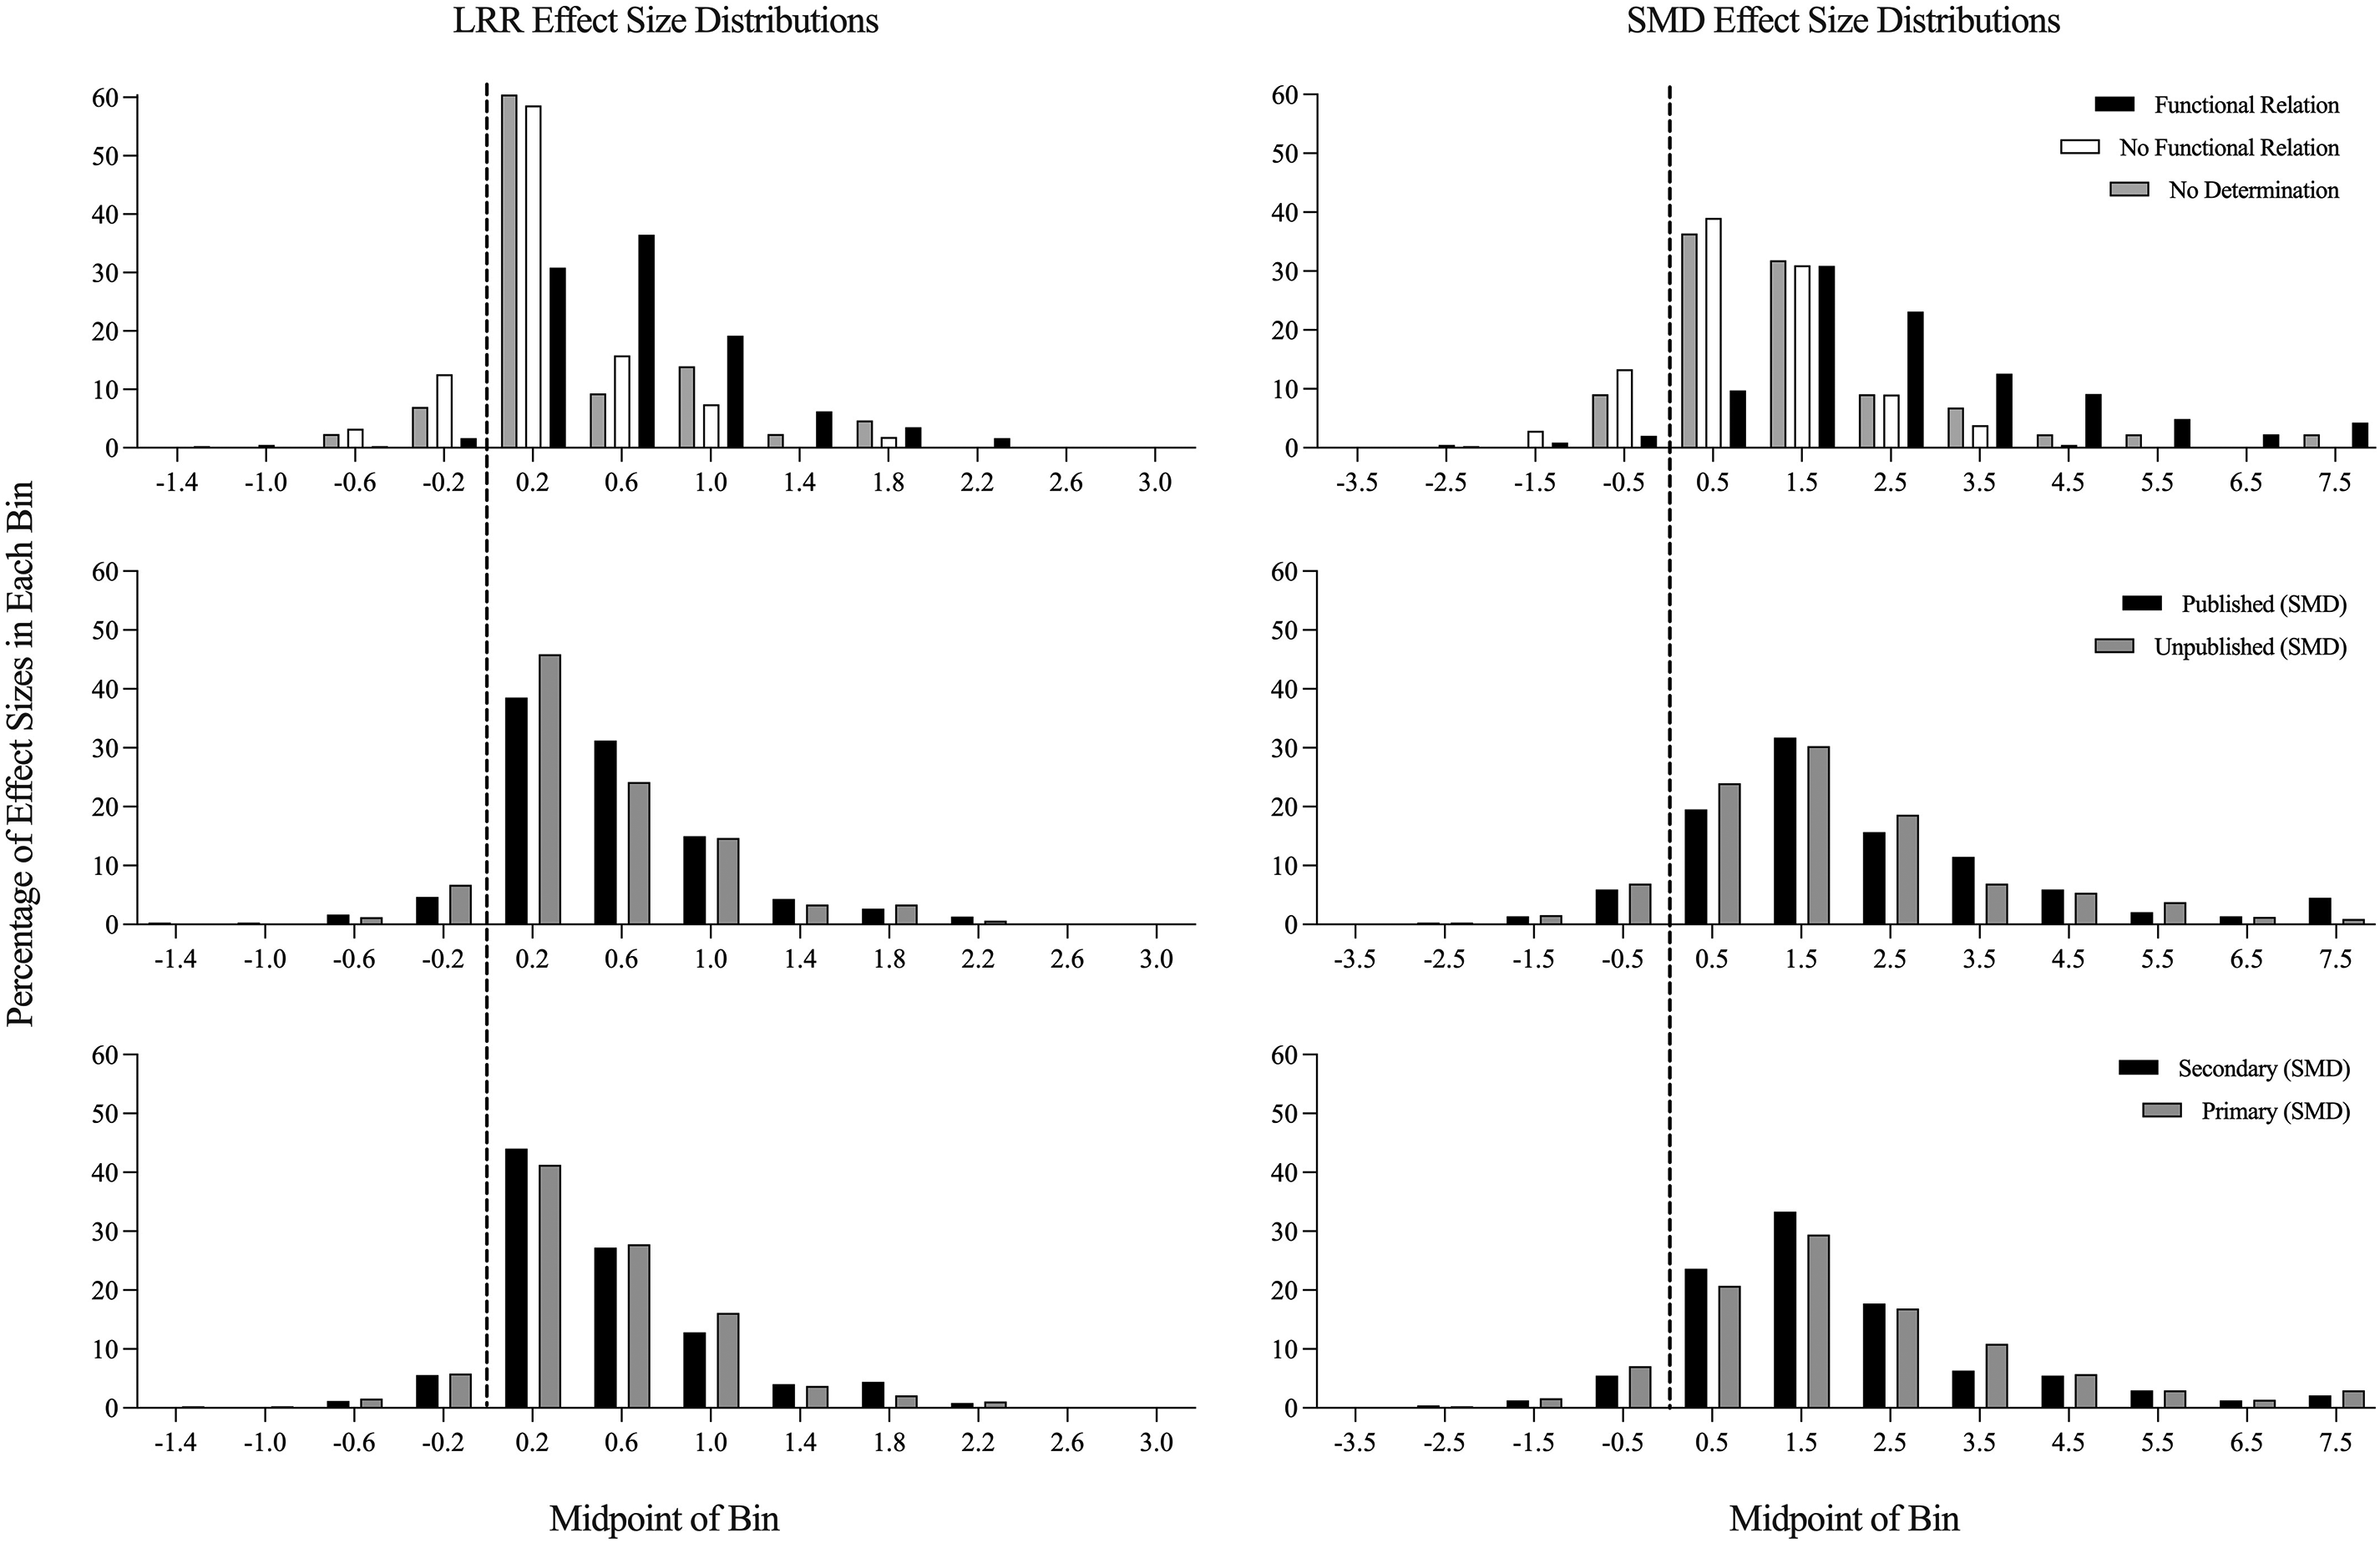
Distributions of LRR and SMD effect sizes by functional relation determination, publication status, and variable primacy. Dashed lines represent effect sizes of 0; values to the left of the line are associated with countertherapeutic changes. LRR = log response ratio, increasing; SMD = within-case standardized mean difference. For the top panels, distributions are divided by effect sizes associated with designs that were coded as establishing a functional relation (Functional Relation), not establishing a functional relation (No Functional Relation), or for which a determination was not possible (No Determination). For the middle panels, distributions are divided by publication status (Published or Unpublished), and for the bottom panels, distributions are divided by whether the engagement variable was primary (used to make intervention decisions) or secondary to another variable (e.g., implementation of an intervention by the teacher, which was the primary variable).
Publication status
Median effect sizes for unpublished sources were smaller (LRRi Mdn = 0.36, SMD Mdn = 1.62) than those for published sources (LRRi Mdn = 0.45, SMD Mdn = 1.72), although the differences were small and the distributions (middle panel of Figure 2) were similar. When only studies with functional relations coded were considered, effect sizes were similar for published (LRRi Mdn = 0.59, SMD Mdn = 2.28) and unpublished sources (LRRi Mdn = 0.60, SMD Mdn = 2.48), suggesting that unpublished sources are more likely to include designs without functional relations present but that when a functional relation is present, the magnitude of behavior change is similar in published and unpublished sources.
Dependent variable primacy
Median effect sizes coded as primary variables were marginally larger (LRRi Mdn = 0.41, SMD Mdn = 1.78) than those coded as secondary variables (LRRi Mdn = 0.38, SMD Mdn = 1.59). Similar to findings with publication status, median effect sizes were similar when considering only designs with functional relations (primary, LRRi Mdn = 0.58, SMD Mdn = 2.44; secondary, LRRi Mdn = 0.61, SMD Mdn = 2.27). The bottom panel of Figure 2 shows similar distributions for both dependent variable types.
Disability Status
Effect sizes associated with disabled participants (LRRi Mdn = 0.46, SMD Mdn = 1.77) were larger than those associated with nondisabled participants (LRRi Mdn = 0.36, SMD Mdn = 1.59). Differences between disability categories were more considerable, with the largest effects for autistic participants (LRRi Mdn = 0.70, SMD Mdn = 2.26) and participants with behavioral disorders (LRRi Mdn = 0.55, SMD Mdn = 1.90) and less robust effects for participants with learning disabilities (LRRi Mdn = 0.41, SMD Mdn = 1.70), OHI or ADHD (LRRi Mdn = 0.37, SMD Mdn = 1.35), and speech language impairments (LRRi Mdn = 0.35, SMD Mdn = 1.83). Compared with the overall distributions, effect sizes for autistic participants were less frequently small or negative and more frequently large (e.g., > 1.2 for LRR and >2.0 for SMD; see Figure 3). Effect sizes for participants with emotional and behavioral disorders had both more negative values (e.g., countertherapeutic outcomes) and more large values (e.g., large-magnitude behavior change). Participants with no disabilities, learning disabilities, and speech language impairments had similar distributions, with less variability for speech language impairments (the smallest group of included effect sizes; see Figure 3).
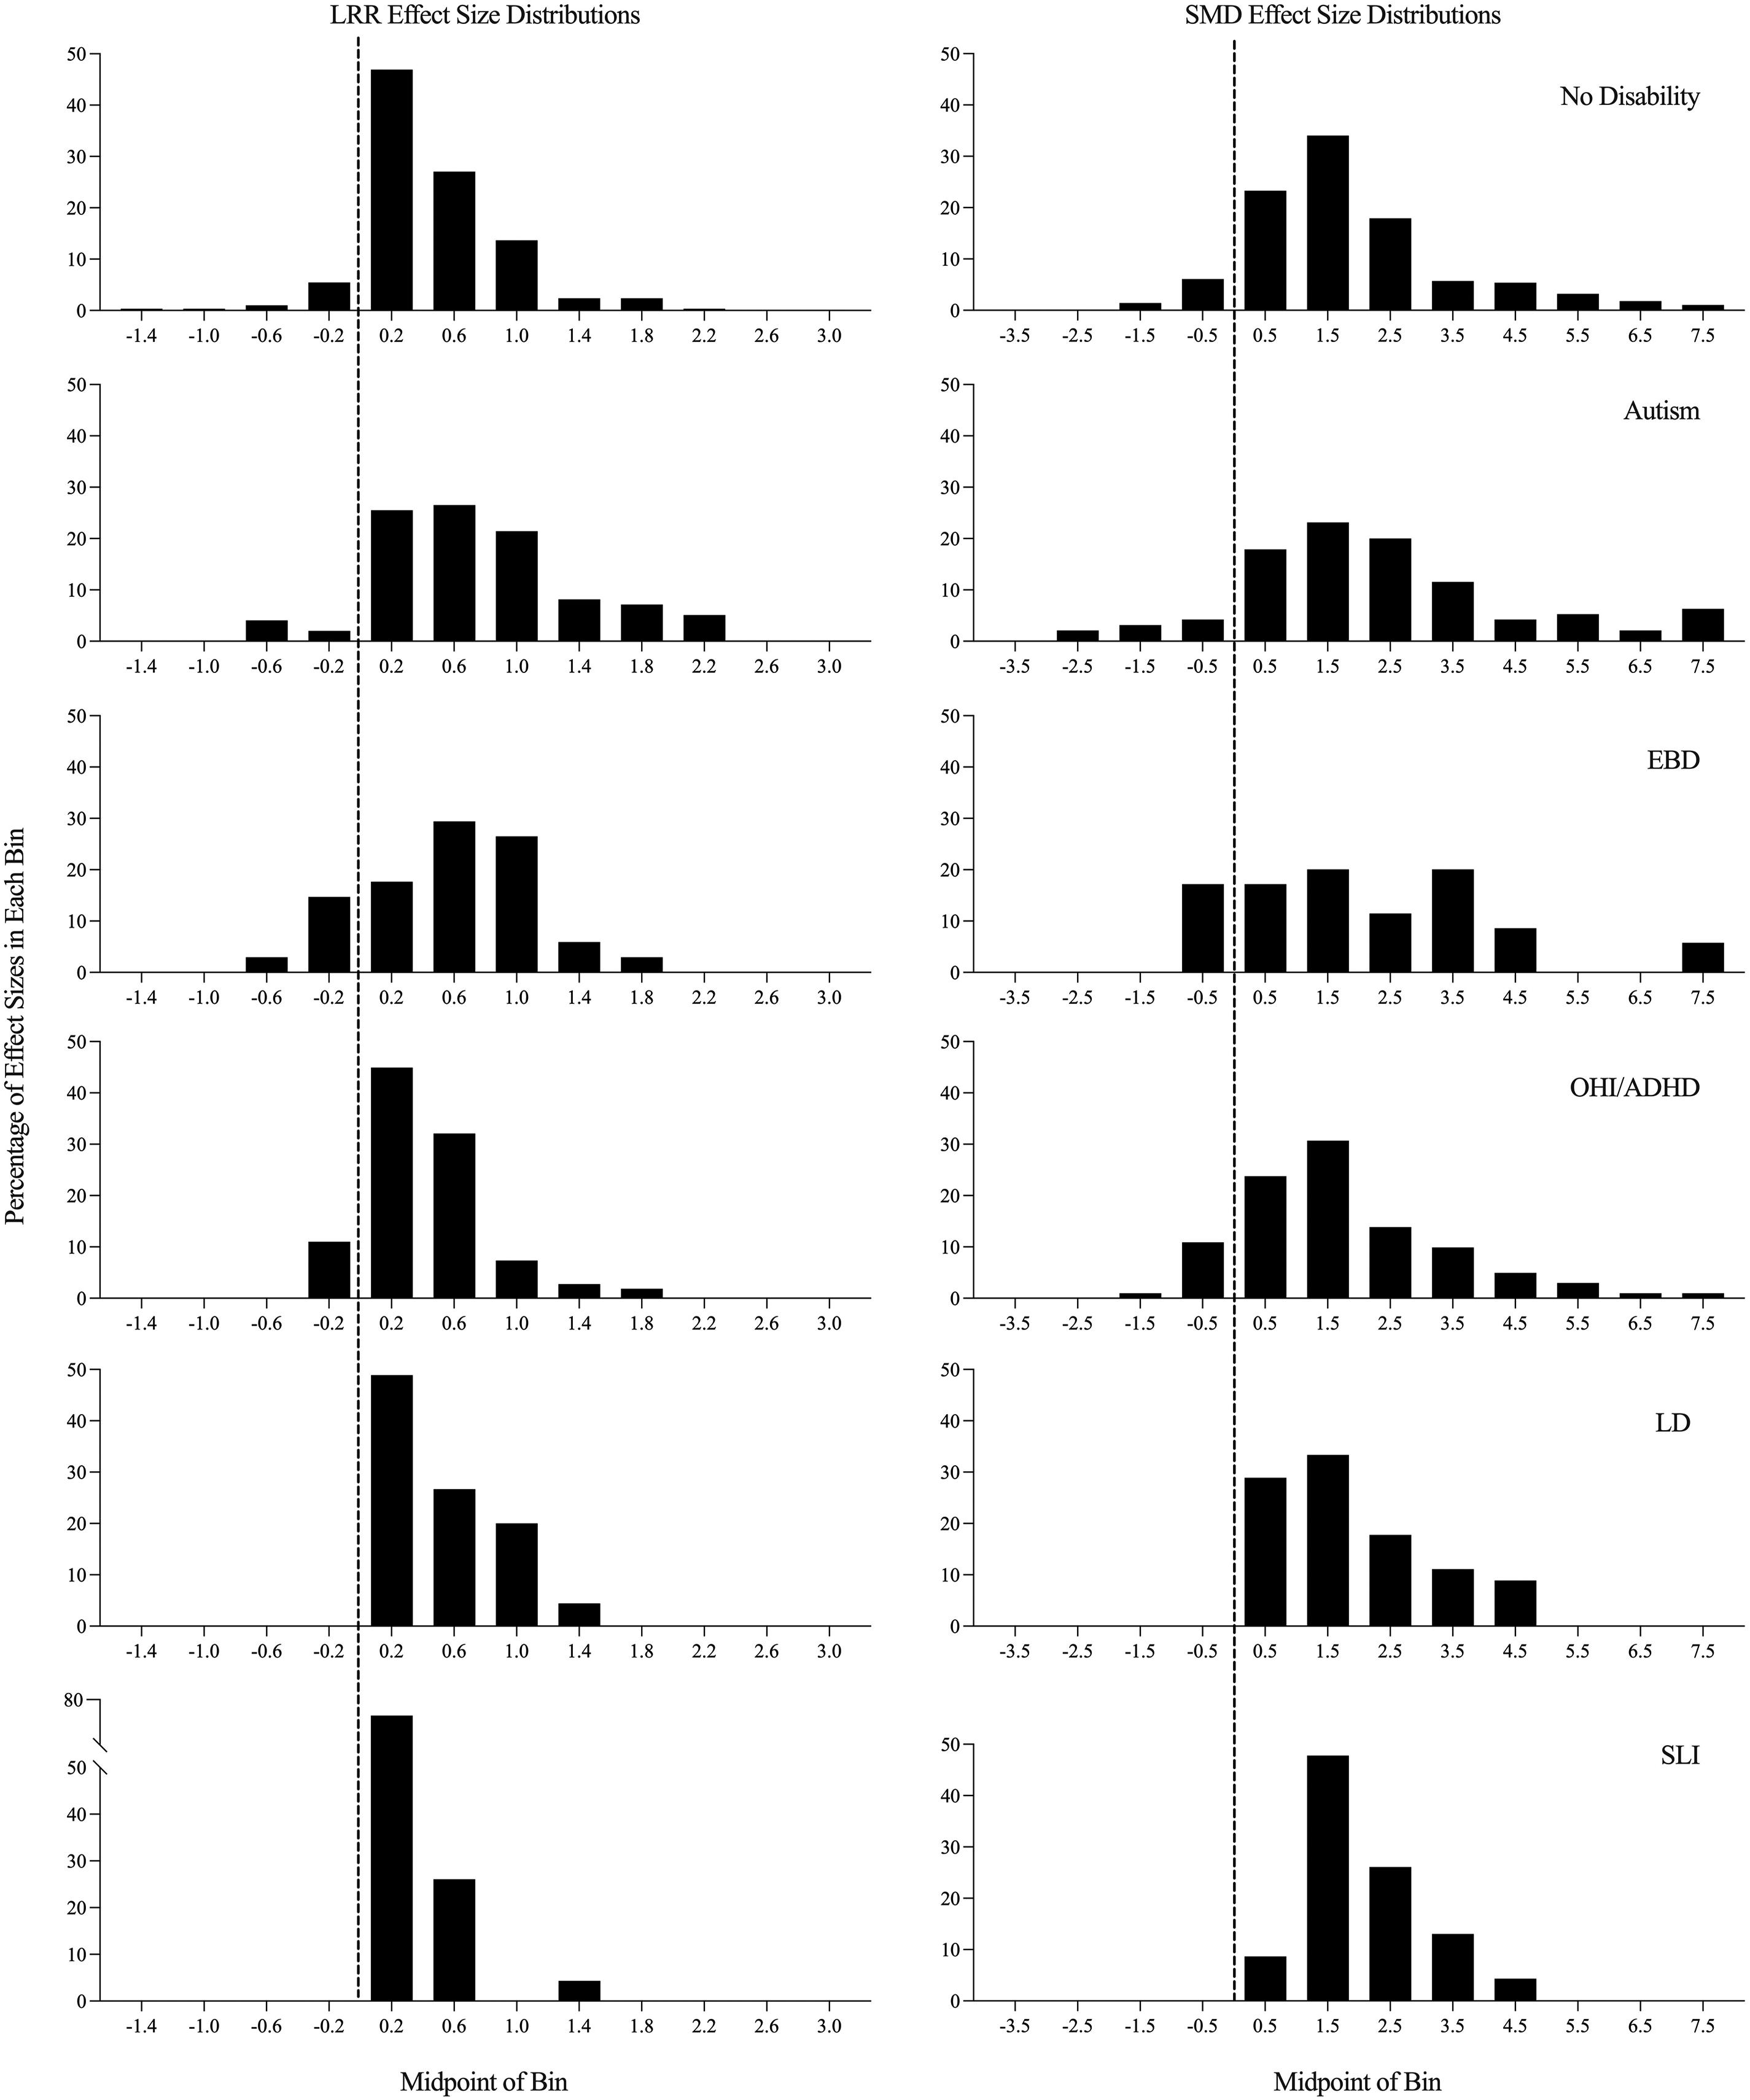
Distributions of LRR and SMD effect sizes by disability status. Dashed lines represent effect sizes of 0; values to the left of the line are associated with countertherapeutic changes. LRR = log response ratio, increasing; SMD = within-case standardized mean difference; EBD = emotional/behavioral disorders; OHI/ADHD = disability category of “other health impairment” reported and/or ADHD diagnosis reported; LD = learning disability; SLI = speech/language impairment.
Implementation Variables
We compared three groups of effect sizes in association with implementer status: those with (a) endogenous implementers in both teaching and measurement contexts, (b) researchers in both teaching and measurement contexts, and (c) researchers in teaching contexts and endogenous implementers in measurement contexts. Effect sizes associated with researcher implementation in both contexts (LRRi Mdn = 0.55, SMD Mdn = 1.72), were larger than those for endogenous implementers in both roles (LRRi Mdn = 0.38, SMD Mdn = 1.67). There were mixed outcomes by effect size when a researcher implemented in the teaching context and an endogenous implementer was present in the measurement context (LRRi Mdn = 0.46, SMD Mdn = 2.87). For both LRR and SMD, negative effect sizes were most often present when endogenous implementers were identified for both teaching and measurement contexts (see top panels in Figure 4).
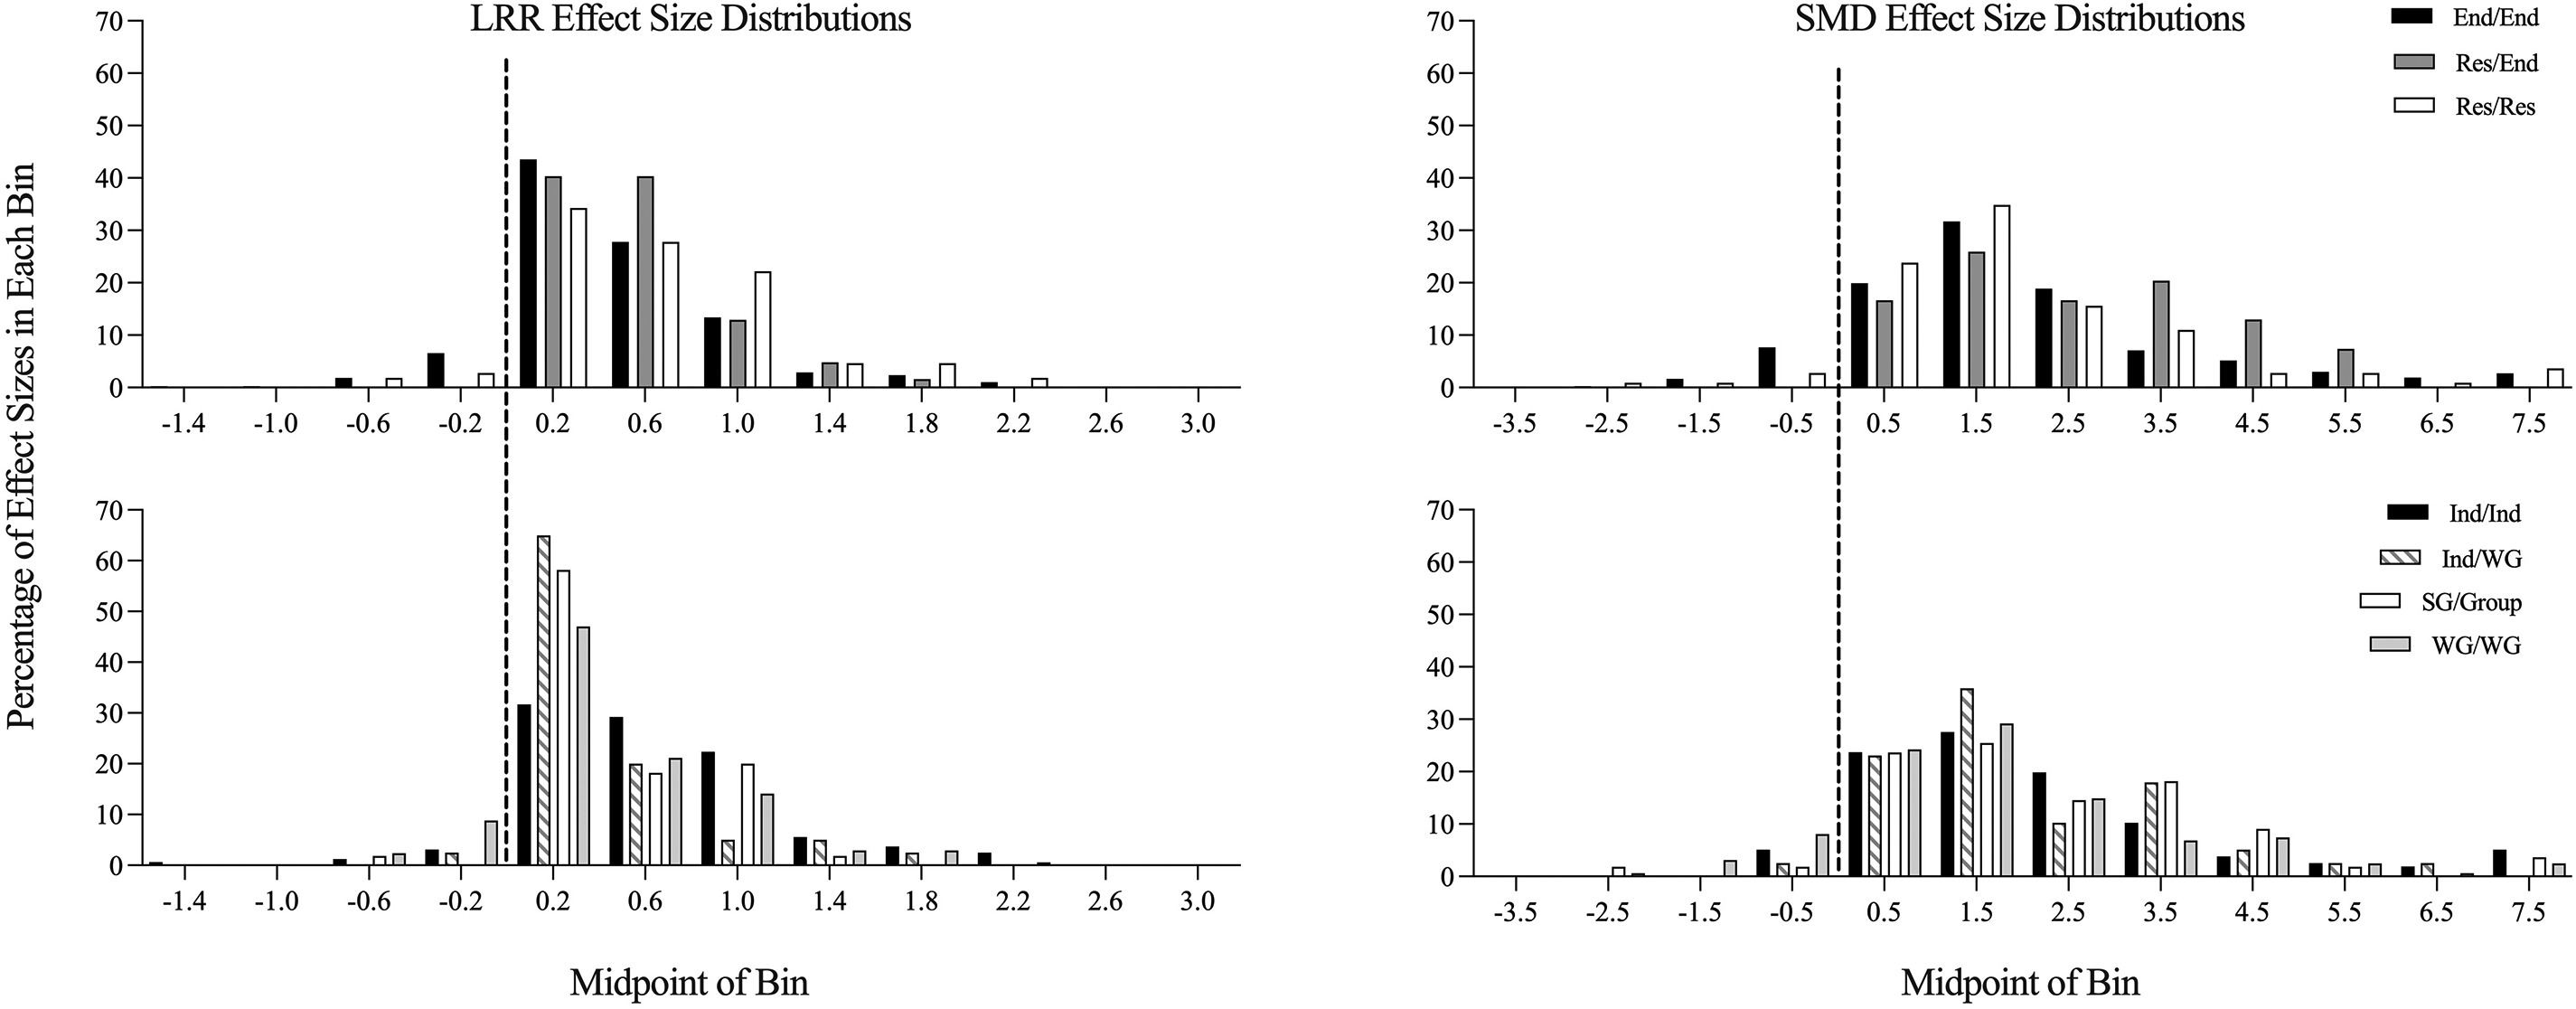
Distributions of LRR and SMD effect sizes by implementation variables. Dashed lines represent effect sizes of 0; values to the left of the line are associated with countertherapeutic changes. LRR = log response ratio, increasing; SMD = within-case standardized mean difference; End/End = endogenous adults implemented in both teaching and measurement contexts; Res/End = researchers implemented during teaching, teachers implemented during measurement contexts; Res/Res = researchers implemented in both contexts; Ind/Ind = individual arrangement in both contexts; Ind/WG = individual teaching arrangement with measurement in whole-group context; SG/Group = small-group teaching with measurement in either small- or whole-group contexts; WG/WG = whole-group arrangements in both contexts.
For group size, we compared four groups of effect sizes: those in which (a) teaching and measurement occurred individually, (b) teaching and measurement occurred in whole group, (c) teaching occurred individually but measurement occurred in whole group, and (d) teaching occurred in small group and measurement occurred in small or whole group. The largest median effect sizes were associated with individual teaching and measurement (LRRi Mdn = 0.56, SMD Mdn = 1.93), with relatively even distribution across three bins (0.0–1.2 for LRR; 0.0–3.0 for SMD; see bottom panel of Figure 4). Smaller effect sizes were calculated for whole group (LRRi Mdn = 0.32, SMD Mdn = 1.58), individual teaching and whole-group measurement (LRRi Mdn = 0.31, SMD Mdn = 1.83), and teaching in small group and measurement in group arrangements (LRR Mdn = 0.35, SMD Mdn = 1.85). For these contexts, the smallest positive values for LRR were most common (the bin including values 0.0–0.4), and for SMD, values in the first two bins were most common (0.0–2.0), with a wide distribution (see bottom panels of Figure 4).
Discussion
The purpose of this study was to characterize effects of studies that included a measure of engagement for elementary-age students in school settings and to generate empirically derived effect size benchmarks to describe the distribution of intervention effects on engagement. Most studies included children with disabilities, including many children with autism (expected given the prevalence of single-case-design studies in special education research and for autism research specifically; Steinbrenner et al., 2020). More interesting is that although common arguments for single-case design includes appropriateness for low-incidence populations (Ganz & Ayres, 2018; Shadish et al., 2015) and the fact that individuals with intellectual disabilities often have impaired attention-related behaviors (McClain et al., 2017; Neece et al., 2011), there were only five studies with nine effect sizes for children with intellectual disabilities. There was also an overrepresentation of boys and Black children compared with national data and other disability categories (Chow et al., 2022; National Center for Education Statistics, 2022). Taken together, these data suggest that additional work is needed to determine appropriate interventions for improving engagement for children with intellectual disabilities, and that boys and Black children may be overidentified as having engagement difficulties. Many studies included endogenous implementers, suggesting that findings about outcomes may be generalizable to school settings in the absence of nonendogenous personnel.
In terms of effect sizes, LRR estimates were correlated with, but consistently smaller than, SMD estimates. More work is needed to establish the extent to which certain values for one metric are comparable to specific values in another (e.g., median values of 0.40 LRR and 1.69 SMD values in this study). We found comparable average LRR and SMD effect sizes for elementary-age students as those previously identified for preschoolers (Chow, Ledford, et al., 2023; Chow, Morse, et al., 2023). Similarly, we identified larger effect sizes for published sources compared with unpublished ones (consistent with previous research; Chow & Ekholm, 2018; Gage et al., 2017) and similar effect sizes for primary and secondary dependent variables. We also found that effect sizes associated with children with disabilities, especially autism and behavioral disorders, were larger than those associated with children without disabilities. There are several potential reasons why this might be the case: (a) children with disabilities may be more likely to be access Tier 3 individualized interventions for engagement, whereas children without disabilities may be more likely to access fewer individualized supports; (b) children with disabilities may have lower baseline levels of engagement, resulting in larger changes given they have more room to improve; and (c) autistic children may access more intensive services than other children (e.g., longer hours, more individual support; Phelps, 2021). Effect sizes for researcher implementers and individual implementation were larger than others; this may indicate that intensive, individualized supports delivered by highly trained adults lead to the largest behavior changes. Because we did not explicitly code for maintenance and generalization, it is unclear whether these large changes are sustainable in typical contexts (in some cases, generalization across contexts may have been demonstrated when teaching context or implementer was different from measurement context or implementer).
Distributions of effect sizes suggest that negative effect sizes were uncommon in published and unpublished sources, even when no functional relation was identified. Although we did not code for adverse events (which are rarely reported; Bottema-Beutel et al., 2021), this may suggest that even nonbeneficial interventions are unlikely to cause reduction in engagement. This is likely, in part, due to the nature of single-case-design studies and the ability to tailor interventions to each individual child, maximizing the likelihood that interventions that are individualized have a desired impact, even if small. It may also suggest that small, positive effect sizes may not necessarily indicate the presence of conclusive functional relations.
Implications
These reported effect sizes may be important both for planning future single-case studies and for interpreting existing evidence. For example, when planning studies related to improving engagement for elementary-age students, it may be helpful to reference existing distributions to predict outcomes and related impacts for participants with various characteristics and/or for interventions with various characteristics (e.g., individually administered interventions, interventions implemented by endogenous implementers). Likewise, after study completion, it may be helpful to compare intervention evaluations with existing literature, in terms of the magnitude of behavior change. Although we provide estimates of “average” effect size, more work is needed to establish meaningful, socially valid benchmarks (e.g., what magnitude of behavior change is associated with changes perceived by teachers, researchers, and others as “small” or “large”). This study provides a first step in understanding the variation in single-case-design effect size when engagement was a study outcome. Of course, more work in the area is needed, especially in relation to other variables that are likely to impact effect size (e.g., measurement systems, intervention components, design type).
Limitations
Given the wide age range and developmental span represented by these data, and the likelihood that measurement occurred given author-derived definitions and varying measurement systems, the single construct of engagement may represent a number of different behaviors, and some of the identified variability may be due to these inconsistencies between studies (see, for example, Ledford et al., 2024). Though we did include some parameters related to study quality for study identification (e.g., minimum number of baseline data points), we did not include a measure of study quality. Future studies might consider this as an additional characteristic associated with variations in effect size. Also, some comparisons represented small groups of effect sizes (e.g., there were only 23 effect sizes for children with speech and language disabilities); our confidence in the precision of these estimates is lower. Finally, given our purpose was to describe distributions of effect sizes across studies and the fact that we conducted limited coding of independent variable characteristics (e.g., types of intervention provided), we did not conduct a meta-analysis of effect sizes. Additional research is needed to synthesize and explain variability in effect sizes for specific types of interventions for particular populations of students and for interventions designed to improve educator implementation outcomes of evidence-based practices and the subsequent effect on student behavioral outcomes.
Conclusion
Average effect sizes representing the magnitude of change of engagement behaviors for elementary-age participants in school-based settings varied by metric type (LRRi, SMD) and study characteristics. As such, researchers should consider using available benchmarks, including median effect sizes identified in this and other studies, to situate their effects given the specific population, contexts, and selected metrics.