
Abstract
Although quality guidelines for single-case intervention research emphasize the importance of concurrent baselines in multiple-baseline and multiple-probe designs, nonconcurrent variations on these designs persist in the research literature. This study describes a systematic review of special education intervention studies (k = 406) between 1988 and 2020 that report using nonconcurrent multiple-baseline or multiple-probe designs to test interventions for individuals with disabilities ages 21 years and younger. We coded and synthesized study characteristics pertaining to participants, settings, interventions, data reporting, and contextual factors. Findings indicate the prevalence of nonconcurrent designs for intervention studies in a variety of settings addressing social and communication needs of individuals with disabilities. We discuss implications for research and practice and offer suggestions for improving the validity of nonconcurrent designs. A PRISMA-compliant abstract is available at https://osf.io/sdnj5/?view_only=f386b1fe5f14430a8d63fceed293718d.
Researchers in special education have embraced various methods to develop and test interventions for individuals with disabilities. These methods feature conventional “group” designs, single-case designs (SCDs), regression discontinuity designs, and literature synthesis strategies, including meta-analysis, to summarize outcome research (Kratochwill & Pullen, 2017). SCDs have been implemented for decades in education and the social sciences and have been recognized by the Institute of Education Sciences What Works Clearinghouse (WWC) as being capable of determining evidence-based practices (WWC, 2022). Given their capacity to demonstrate experimental control with as few as one participant, SCDs are ideal for use in special education research, particularly when the disability of focus is low incidence or manifests in different needs and supports across individuals. SCDs offer advantages in such cases, in which researchers may encounter difficulties recruiting large samples of participants with homogeneous characteristics. For example, a review by the National Clearinghouse on Autism Evidence and Practice (NCAEP) reported that 83% of the 972 autism intervention studies reviewed between 1990 and 2017 used an SCD (Steinbrenner et al., 2020). As SCDs maintain prevalence in special education intervention research, researchers have devised quality guidelines for designing and conducting such studies.
Standards developed by the WWC are available for SCD methodology (Pilot Standards 1.0; see Kratochwill et al., 2010, 2013) and feature the most common designs, including within-participant ABAB, multiple-baseline, and alternating-treatment strategies. Changing-criterion and multiple-probe designs were added to Standards 1.0 and are now in the most recently revised standards (WWC Standards 5.0). Although concerns have been raised about the WWC standards (see Kratochwill et al., 2021; Maggin et al., 2021), no objections have been made about the status of the types of designs that are considered to be scientifically credible in the standards. The multiple-baseline design (MBD) is frequently used, and among its variations across behaviors, situations, and participants, the application across participants has been reported to be the most common (Shadish & Sullivan, 2011). The central characteristic of the MBD is the concurrent assessment of baselines and replication of the intervention across the series of measures, with at least three replications being the criterion for meeting WWC standards “without reservations.” Most methods texts and SCD standards also recommend at least three replications, but researchers may choose to schedule more replications, along with methodological enhancements (as discussed later; see also Levin & Ferron, 2021), to add scientific credibility to the design, to protect against attrition or mixed intervention outcomes, or for other reasons (Kazdin, 2021).
One variation of the MBD is the multiple-probe design (MPD), which also includes concurrent assessment but with less frequent measurement and wherein probes are scheduled at crucial times to ensure control of validity threats that might occur without the proper sequence of measures. For example, measurement across the series should be scheduled just prior to and following the introduction of the intervention (Gast et al., 2018; Horner & Odom, 2014). The MPD is an appealing choice when it is unethical or undesirable to collect many baseline data points, such as when the participant engages in self-injurious or aggressive behavior or when collecting baseline data would cause the participant to repeatedly fail or practice a skill incorrectly (see, for example, Harris et al., 2019; Kratochwill et al., 2023). Thus, MPDs, along with reduced-baseline-data MBDs, may also be a viable option when it is not advisable to collect data at every session.
One variation of the MBD is presented in the SCD literature—a nonconcurrent MBD (NCMBD) across behaviors, settings, or participants. In this design variation, baseline and intervention conditions across levels (or “tiers”) occur at different time points and not concurrently as in the classic MBD. Several variations are possible within the nonconcurrent option, in that data points within the different tiers may vary in terms of their intervention start points and degree of overlap across tiers (Kazdin, 2021).
It is unclear exactly when the NCMBD was first reported in published research or introduced as an alternative to the concurrent MBD, but it has been the focus of some debate over the years (e.g., Christ, 2007; Harris & Jenson, 1985a, 1985b; Hayes, 1985; Kratochwill et al., 2022; Levin & Ferron, 2021; Slocum et al., 2022; Watson & Workman, 1981). The debate centers on how well the nonconcurrent version of the design controls for threats to internal validity, such as history and maturation. Carr (2005) argued that the nonconcurrent variation of the design allows for replication, but not “verification,” of the intervention effect, a primary characteristic of the conventional MBD. In contrast, Levin and Ferron (2021) contended (a) that differentiating between concurrent and nonconcurrent MBDs is not always a cut-and-dried process and (b) that with comparable forms of relevant randomization built into the two designs, unwanted internal-validity-confounding variables are comparably controlled. Slocum et al. (2022) have recently noted that three primary threats to internal validity must be addressed in MBDs, namely, Campbell and Stanley's (1966) “maturation” (including practice and fatigue effects), testing and session experience, and coincidental events (primarily “history” effects). These authors also argue that the within-tier comparisons in MBDs are a priority due to inherent stronger control options and conclude that NCMBDs are on an equal experimental par with traditional MBDs. Moreover, Levin and Ferron (2021) and Kratochwill et al. (2022) suggest that in contrast to traditional MBDs, NCMBDs are actually an external validity enhancer, insofar as they can assess whether intervention effects generalize across different time periods
There are potential benefits to the NCMBD in relation to special education research. The NCMBD may be especially useful to researchers, given considerations of resources or access to participants (Kazdin, 2021). For example, when study participants cannot be recruited at the same time or when delays in the intervention would raise ethical issues, the NCMBD might be adopted. Thus, researchers adopting the NCMBD may address certain ethical or logistical concerns inherent in concurrent designs, thereby providing an alternative means of contributing to a growing research literature regarding a certain intervention or participant population.
Amid the debates regarding use and interpretation of NCMBDs and nonconcurrent MPDs (NCMPDs), researchers continue to implement these designs in special education intervention studies, and these studies are published in leading research journals. As long as such designs are being adopted, there is value in investigating them as a whole, reporting characteristics, evaluating strengths and shortcomings, and identifying potential practices for increasing their validity. In particular, we stand to develop more meaningful guidance for improving the quality of intervention studies based on NCMBDs and NCMPDs by investigating how such designs have been applied in special education research to date, how study characteristics have been reported, and the various strengths and limitations across studies. To date, no synthesis of NCMBDs in special education has been published.
Specifically, information is needed on the methodological details in NCMBD and NCMPD studies. Certain characteristics of participants (e.g., age, gender identification, race-ethnicity, disability), settings (e.g., clinic, school), and interventions (e.g., independent and dependent variables) may be more common in nonconcurrent designs (NCDs). Furthermore, as critics of NCDs have raised concerns about validity and interpretability of their findings, it is important to examine how researchers adopting such methods present and interpret their findings, whether researchers have attempted to enhance the credibility of their study design, and to what degree evidence of intervention effectiveness can be ascertained from the data presented.
To synthesize the research literature on the application of both NCMBDs and NCMPDs, we conducted a systematic review of intervention studies in special education in which researchers adopted these designs. Our goal was to assess a variety of characteristics of the research featuring NCDs, including participant descriptions (i.e., age, gender identification, race-ethnicity, disability diagnosis), intervention dimensions (i.e., implementer, setting), and the range and type of dependent variables selected (i.e., communication or social, behavioral, academic, life skills, implementation fidelity, psychological, physical or motor, leisure or play, job or employment skills). We also aimed to examine design characteristics (i.e., type of design variation, embedded designs, number of data points, number of levels, design description) of the sampled studies. Because published guidelines on the minimum number of replications needed to determine an effect (i.e., Horner et al., 2005) might have influenced the number of levels authors included in their designs, we also analyzed whether there were differences in the number of levels reported in studies published prior to 2006 and those published in 2006 and later. Furthermore, we investigated (a) whether authors used graphical aids, descriptive statistics, or statistical analysis to aid visual analysis and (b) the reasons authors provided for adopting an NCD. Overall, our aims were to address the gaps in the literature that we identified earlier by investigating the application of NCDs, summarize their use in special education research, and offer suggestions to improve them when adopted in applied clinical and education research. Therefore, we conducted our systematic review and synthesis to address the following research questions:
How are NCDs used in special education intervention research? What are characteristics of participants, settings, and interventions in studies featuring NCDs? How do authors of NCDs present graphical data? What methods do authors use to complement or aid visual analysis (i.e., graphical aids, descriptive statistics, statistical analysis)? To what degree do researchers using NCMBDs and NCMPDs provide a rationale for the use of an NCD? How is the use of NCDs distributed across researchers, scholarly journals, and time?
Method
To be transparent in our methods and to adhere to open-science guidelines, we have stored our complete data file and associated supplemental materials on Open Science Framework (OSF). We refer to these materials as appropriate throughout the manuscript and reference the link to the materials here: https://osf.io/sdnj5/?view_only=478cf1ea1c7c4456a93d55dd7c2d3edf.
Study Identification
Search Strategy
We identified studies for this review through (a) a primary search, (b) an updated search, (c) a first-author search, and (d) consultation with NCAEP. See “Search Strategy” on OSF for the Boolean string and dates searched. The search was limited to peer-reviewed articles and dissertations in an effort to include gray (unpublished) literature. No other limiters were applied (e.g., date, location) as our goal was to provide a broad overview of how NCDs are used in special education research. For the first-author search, we entered the name of the first author of all included studies into Scopus, an abstract and citation database. Because of the nature of the review, we did not conduct an ancestral or forward search, as authors do not typically cite articles based solely on design. However, we did hypothesize that authors who published a study using an NCD would be more likely to use this design in other studies.
To ensure a comprehensive search, the first author (a member of the NCAEP research team) reviewed a list of nonconcurrent and delayed MBDs and MPDs that resulted from the recent NCAEP review (see Steinbrenner et al., 2020) to determine whether any articles met our inclusion criteria. We compared the NCAEP list against the identified articles from the present review and included any articles that were not previously identified. See “PRISMA Flowchart” on OSF for a flowchart depicting the number of articles identified at each stage of the review.
Inclusion and Exclusion Criteria
Inclusion criteria included the following: The study was published in English and included (a) at least one NCMBD or NCMPD with at least two tiers and (b) at least one participant age 0 to 21 with a disability or an adult participant (e.g., teacher, parent, sibling, peer) who worked with a person age 0 to 21 with a disability. Studies implementing a partially nonconcurrent design or other designs embedded within the NCD were included. To be inclusive, “disability” was defined broadly and included disability categories described in the Individuals With Disabilities Education Act (2004) as well as any “physical or mental impairment that substantially limits one or more major life activities” (Americans With Disabilities Act, 2009). For a list of disability categories identified in this study and their operational definitions, see “Variables Codes” on OSF.
Exclusion criteria included (a) designs described as NCMBD or NCMPD with fewer than two tiers (i.e., one-participant AB designs), (b) designs described by the study authors as replicated AB designs, and (c) participants described only as at risk for a disability.
Title-and-Abstract and Full-Text Review
After identifying documents through the primary, updated, and first-author searches, we exported them to RefWorks to remove duplicates from the data set. After deduplication was complete, we exported the remaining references to Covidence for screening and applied the inclusion criteria. We screened all references at the title-and-abstract level initially and further examined the full text of any documents for which we were unable to determine whether they met inclusion criteria from the title and abstract alone. See “PRISMA Flowchart” on OSF for the number of documents excluded at each stage and the reasons for exclusion.
Variable Coding
We coded several variables for each study, including variables related to participant characteristics (i.e., age, gender, gender identification, race-ethnicity, diagnosis), intervention characteristics (i.e., implementer, setting), dependent and independent variables, design characteristics (i.e., type of design, number of designs, embedded designs, number of levels or tiers, number of data points, presentation of data, design description), visual analysis aids (i.e., graphical aids, descriptive statistics, statistical analysis), rationale for using an NCD, randomization characteristics (i.e., type of randomization used and whether an associated statistical test was conducted), and authorship frequency. In the following sections, we describe in detail how each variable was coded, and “Variable Codes” on OSF lists operational definitions of each variable. We used the Preferred Reporting Items for Systematic Reviews and Meta-Analyses (PRISMA; see Page et al., 2021) to guide our reporting and have included a checklist detailing which aspects are reported in this manuscript (see “PRISMA Checklist” on OSF).
Participant Characteristics
Age
We coded the number of participants with disabilities in each of the following age categories: 0 to 5 years old, 6 to 11 years old, and 12 to 21 years old. In 14 studies, authors provided only a range of ages for participants across multiple age categories (e.g., “five children with autism participated, all ages 4–6 years old”). Therefore, we were unable to code this variable for those studies as it was unknown how many participants were in each category. Further, an additional five studies (Luna et al., 2019; Maffei-Almodovar, 2019; May et al., 2011; Wandler, 2015; Weldy et al., 2014) included only adult participants without disabilities (e.g., teachers, therapists, staff members); thus, we were unable to code participant age for these studies.
Gender identification and race-ethnicity
We coded gender identification and race-ethnicity for participants with disabilities ages 0 to 21. For gender identification, we coded whether the participants identified as male, female, nonbinary, genderfluid, or genderqueer. For race-ethnicity, we coded whether the participants were Black or African American, Native American or Alaskan Native, Hispanic or Latinx/Hispanic American, Native Hawaiian or Pacific Islander American, White or European American, Asian/Asian American, Middle Eastern or North African/Middle Eastern American, or biracial/multiracial. For both variables, we also coded whether authors reported that participants preferred not to answer gender identification or race-ethnicity questions, whether participants preferred to self-identify, and whether gender identification or race-ethnicity were not reported.
Disability diagnosis
We coded the disabilities with which participants were diagnosed (i.e., autism, speech or communication disorder, intellectual disability, neurological disorder, developmental delay, attention-deficit hyperactivity disorder, internalizing disorder, visual or hearing impairment, other health impairment, physical disability, behavioral disorder, Down syndrome, specific learning disability). When multiple participants had the same disability, it was coded only once. Thus, our results indicate the number of studies that report participants with each of the different diagnoses (i.e., k) rather than the number of individual participants (i.e., n) with these diagnoses. When a study included participants over the age of 21, we coded disability diagnoses only for participants 21 years old and under. Five articles focused on training adults (e.g., teachers) to implement interventions with participants with disabilities but did not specify the diagnoses of the participants.
Intervention Characteristics
Implementer
We coded the role of the person who implemented the intervention with the person with a disability (i.e., researcher or research assistant; parent or caregiver; teacher; paraprofessional; peer or sibling; paid caregiver or direct care staff; person with a disability; behavior therapist or Board Certified Behavior Analyst; related service personnel; psychologist, psychiatrist, or counselor; not specified; other). If the interventionist was a researcher and served in another role (e.g., the classroom teacher), then the implementer was coded as researcher. When a researcher was training or coaching an adult to implement the intervention, we coded only the role of the adult directly implementing the intervention (e.g., parent) unless the researcher also implemented some sessions with the person with a disability, in which case we coded the implementers as both researcher and the role of the adult (e.g., parent).
Setting
We coded settings where interventions occurred (i.e., school; home; autism or ABA clinic; early intervention; counseling, psychology, or psychiatric clinic; community; hospital or medical rehabilitation center; residential home or facility; not specified; other). When authors described settings with generic terms (e.g., “clinic”), we coded setting as “not specified.”
Dependent and Independent Variables
Dependent variables
We coded the following dependent variables: communication or social, behavioral, academic, life skills, implementation fidelity, psychological, physical or motor, leisure or play, job or employment skills, and other. We only coded dependent variables with graphed data and selected only one category per dependent variable, with the exception of studies that coded multiple behaviors as a single dependent variable (i.e., in instances where the target behavior was individualized for each participant).
Independent variables
We coded the following independent variables using a “select all that applies” format to capture all components of packaged interventions: applied behavior analysis or behavior therapy; communication or language; training; technology based; social skills; psychology-based therapy or cognitive behavior therapy; academic; physical therapy, occupational therapy, or exercise; feeding protocols; and medication or medical.
Design Characteristics
Type and number of designs
We coded whether the design was an NCMBD or an NCMPD and whether it was across behaviors, participants, settings, or another study dimension. We also coded the number of MPDs or MBDs in the study. A design was defined as a graphical display of similar data. For example, a study that included three participants and used an NCMBD across more than one setting would have three designs (i.e., one MBD per participant). It was not uncommon for studies to separate the levels to resemble a series of AB designs with each level appearing in a separate figure, rather than stacking them as is typical in an MPD or MBD (see Twarek et al., 2010). In these instances, we grouped designs together logically. For example, if out of six levels of an MPD or MBD, three levels included data on one dependent variable and the other three levels included data on a different dependent variable, then two designs were coded.
Embedded designs
We coded whether studies embedded another design and, if so, whether it was an embedded alternating-treatment, multielement, reversal, or withdrawal design. We also coded other embedded designs; however, the designs had to be capable of demonstrating a functional relation between the independent and dependent variables to be coded. For example, we did not code ABC designs or any variations of this design.
Number of levels or tiers
We coded the number of levels in the NCMBD or NCMPD. When studies contained two designs, we averaged the number of levels and rounded up to the nearest whole number. For example, if one design had three levels and the other design had four levels, then the average would be 3.5, which we rounded up to four. If there were more than two designs, we coded the median number of levels across all designs in the study. In addition to collecting continuous data on the number of levels per study, we also collected categorical data by coding the number of studies that had two to 10 or more levels.
Number of data points
We coded the minimum and maximum number of data points in baseline and intervention conditions. For example, if the NCMBD consisted of three levels, then coders counted the data points in baseline and intervention for each level and selected the appropriate category to represent the minimum and maximum number of data points for each phase (i.e., 1, 2, 3, 4, 5, 6–10, 11–15, 16–20, 21–30, 31–40, 41–50, 50+). The level with the fewest data points was coded as the minimum, and the level with the most was coded as the maximum. Although this variable was originally intended to be coded continuously to allow for descriptive analyses (e.g., means, ranges), we decided to code it categorically because of the complexity of coding the exact number of data points in each study (e.g., unclear graphs, overlapping data points, or phase change lines not positioned correctly). Many statistical analyses and effect sizes adopted for SCD research (discussed later) are dependent on the number of graphed data points, with more data points generally providing greater statistical power to the analyses (e.g., Levin et al., 2018). Further, traditional visual analysis also depends on a sufficient number of data points to adequately assess aspects of the data, such as trend. By coding the minimum and maximum number of data points for each phase, we aimed to describe the upper and lower boundaries of data points typically collected in practice. This information may help guide recommendations to the field on the ideal or preferred number of data points per phase or assist statisticians in determining the feasibility of requiring the collection of a certain minimum number of data points when developing new statistical-analysis approaches.
We did not count maintenance or generalization data points; however, if the intervention included multiple phases, as in an embedded ABCD design, then we summed the total data points across all intervention phases to determine the minimum and maximum. Graphs depicting only assessment data (e.g., results of a functional analysis) were not coded.
Presentation of data
We coded whether authors presented their data nonconcurrently, meaning that readers could readily observe from visually inspecting the graph when data were collected. This assessment could be accomplished in the following ways: (a) labeling the x-axis with the specific dates on which data were collected or (b) if labeling the x-axis as sessions, plotting the data in such a way that it was obvious from the graph that data were not collected concurrently. If all data points for each level aligned across every session, as in a concurrent design, then the study was coded as not presenting data concurrently. Few studies included multiple graphs, with some graphs presenting data concurrently and other graphs presenting data nonconcurrently. In these cases, studies were coded as both. See “Nonconcurrent Example—Dates,” “Nonconcurrent Example—Sessions,” and “Concurrent Example” on OSF for illustrative examples of how graphs could be coded as presenting data concurrently and nonconcurrently. It should be noted that there are multiple ways that authors can present their data nonconcurrently, and the illustrative graphs are just two such examples. The primary criterion for deciding whether data were presented nonconcurrently was whether graphs clearly demonstrated that data were not collected concurrently.
In addition, we coded whether authors labeled data on the x-axis as a (a) general term, (b) specific date, or (c) other. Any term that was general in nature and did not provide information on the specific date when data were collected was coded as “general term” (e.g., sessions, probes, days, months, weeks). We coded “specific date” when authors provided exact dates of data collection (e.g., May 3, 5/17/20). When studies included multiple graphs with varying date specificity, we coded “both.” When authors used a method of labeling the x-axis other than general term or specific date, we coded “other.”
Design description
To capture information about how authors described their study, we coded whether (a) the NCD was referred to as an “experiment” or “experimental” in the abstract or narrative, (b) the design heading in the Method section referred to the NCD as experimental (e.g., “Experimental Design”) but the word “experimental” was not used elsewhere in the manuscript to describe the NCD, and (c) the authors used the phrase “functional relation(ship)” or a related term (e.g., “functionally related”) in reference to the dependent and independent variables in the NCD.
Visual Analysis Aids
To document researchers’ use of various techniques to complement or assist with interpreting SCD data, we coded use of (a) graphical aids (i.e., shading or lines on the graph designed to assist with data interpretation, including trend lines, variance lines, goal lines, normative sample lines, etc.), (b) descriptive statistics (i.e., any statistics reported in tabular format to summarize graphed data, including means, standard deviations, ranges, etc.), and (c) statistical analyses (i.e., including analyses calculated to provide a quantitative measure of the outcome or magnitude of the intervention effect, such as effect sizes, nonoverlap indices, inferential statistical tests, etc.).
Rationale for Using an NCD
We coded authors’ stated reasons for using an NCD as follows: (a) difficulty recruiting participants or a limited number of participants with similar symptoms, (b) ethical reasons, or (c) logistical, feasible, or practical considerations related to applied settings. When authors listed general benefits of NCDs without details on the reason they used an NCD for that particular study, we coded “not specified.”
Randomization Characteristics
We coded whether authors incorporated randomization into studies and, if so, what type of randomization was used. Although we originally intended to code Ferron and Levin's (2014) definitions of case, within- or between-case intervention, and intervention start-point randomization (i.e., participants randomly assigned to predetermined baseline lengths) separately, authors rarely adopted this terminology in their reporting, thereby making it difficult to determine which type of randomization they used. Thus, when authors reported adopting any type of randomization, we coded randomization as a binary variable (i.e., yes or no). However, we did specifically code within-case intervention randomization when authors randomized the order of interventions in alternating-treatments designs. For studies that implemented randomization, we coded whether the authors reported conducting an associated statistical test, regardless of the test being a theoretically appropriate one or not (Levin et al., 2019; Levin & Ferron, 2021).
Authorship Frequency
To investigate the frequency with which authors used NCDs to conduct intervention research for students with disabilities, we created a database using author names extracted from each study. We then calculated frequencies of each entry in the database using R (Version 3.6.1).
Interrater Reliability and Training Procedures
The first author trained research team members (i.e., faculty and graduate students in special education) prior to screening and coding. Training consisted of (a) reviewing inclusion criteria and operational definitions for variable codes (see “Variables Codes” on OSF) and (b) screening and coding a portion of included documents until at least 80% agreement was achieved.
To assess interrater reliability (IRR), a selection of the included primary studies were screened and coded by two research team members. The following percentage of documents were double screened and coded at each stage of the review: 100% of titles and abstracts for the primary and updated searches, 49% of titles and abstracts for the first-author search, 50% of full texts for the primary search, 100% of the full texts for the updated search, 29% of full texts for the first-author search, and 100% of documents for most variables coded. Following the recommendation of a reviewer of an earlier version of this article, a small subset of variables was added after the entire data set was coded for the original variables. These variables included gender identification, race-ethnicity, x-axis data labels (i.e., general terms or specific dates), visual analysis aids (i.e., graphical aids, descriptive statistics, statistical analyses), and design description (i.e., experimental, functional relation). Because coders achieved a high degree of reliability during training, we collected IRR data on only 32% of included documents for these variables. Across all variables coded, documents used for training were not included in IRR calculations.
To calculate IRR, the number of agreements was divided by the number of disagreements plus agreements and multiplied by 100 to obtain a percentage. Mean IRR results were as follows: 89% (range 88%–96%) for title-and-abstract screening, 95% (range 86%–98%) for full-text screening, and 92% (range 75%–96%) for the majority of variable coding. For the additional variables coded, mean IRR was 95% (range 84%–99%). Only one variable was below 80% IRR (i.e., number of data points), due to poor-quality graphs, miscounting, and misunderstandings about which data points counted as intervention when multiple phases were included as part of intervention. In these cases, we resolved disagreements either by consensus or with a third rater. The first author led meetings to resolve disagreements, ensure consistency, and minimize coder drift.
Results
A total of 1,507 individuals with disabilities participated in 406 NCMBD and NCMPD experiments across 342 peer-reviewed journal articles and 49 dissertations published between 1988 (the earliest published NCD that was captured in the search) and 2020 (see “Reference List” and “Frequency Distribution” on OSF). A total of seven peer-reviewed articles and six dissertations reported multiple experiments that met our inclusion criteria. In these instances, the experiments were coded separately. Included articles were published in 105 unique journals, with seven journals contributing 10 or more articles. These included the Journal of Applied Behavior Analysis (k = 63), Behavioral Interventions (k = 26), Journal of Autism and Developmental Disorders (k = 16), Journal of Developmental and Physical Disabilities (k = 16), Research in Autism Spectrum Disorders (k = 13), Developmental Neurorehabilitation (k = 11), and Research in Developmental Disabilities (k = 11). On average, each study included 3.7 participants with disabilities (SD = 3.12), with a range of 1 to 44 participants across all studies. See “NC-MBD Manuscript Code File” on OSF for a complete data file with all variable codes.
Participant Characteristics
Although the largest percentage of participants with disabilities were ages birth to 5 years old (44%; n = 628), many participants were 6 to 11 years old (37%; n = 524). Nearly 1 in 5 participants (19%; n = 275) were between 12 and 21 years old. Note that the total number of participants across the three age categories (n = 1,427) is less than the total number of participants we report across all primary studies (N = 1,507). This discrepancy is a result of some studies describing participant ages in general terms that did not facilitate precise coding (e.g., “A total of five students between the ages of 4–10,”) rather than providing specific age information for each participant.
When analyzing gender identification data, we found substantially more participants with disabilities identified as male (57%; n = 858) than as female (19%; n = 291). Gender identification data were not reported for nearly one quarter of participants (24%; n = 358). Conversely, race-ethnicity data were not reported for more than three quarters of participants (77%; n = 1,161). Of the participants with race-ethnicity data, most were White or European American (14%; n = 213). The remaining participants were distributed across racial categories, except for the category Native American or Alaskan Native, which did not include any participants (see “Participant Characteristics” on OSF).
Autism was reported most frequently across the included studies (65%), followed by speech or communication disorders (33%). Anecdotally, many participants with speech or communication disorders also had autism diagnoses, which is not surprising given that communication challenges are a core characteristic of autism (American Psychiatric Association, 2013). Intellectual disability was represented in approximately one fifth of studies (21%), and neurological disorders were reported in 11% of studies. The remaining disability categories were reported in 10% or fewer studies, with specific learning disability being the least frequent (3%).
Intervention Characteristics
Researchers were the most prevalent implementers (see Table 1), serving as implementers in approximately half of included studies (51%). Parents or caregivers were implementers in 20% of studies. Although less prevalent, teachers were implementers in 12% of studies. Remaining implementer categories were represented in 5% or fewer of included studies, except for “other” (6%) and “not specified” (15%). Examples of “other” implementers include job coach or job trainer, pediatric allergist, and therapeutic recreation trainer. Psychologists, psychiatrists, and counselors were implementers in the fewest number of studies (2%; k = 8).
Design, Intervention, and Outcome Characteristics.
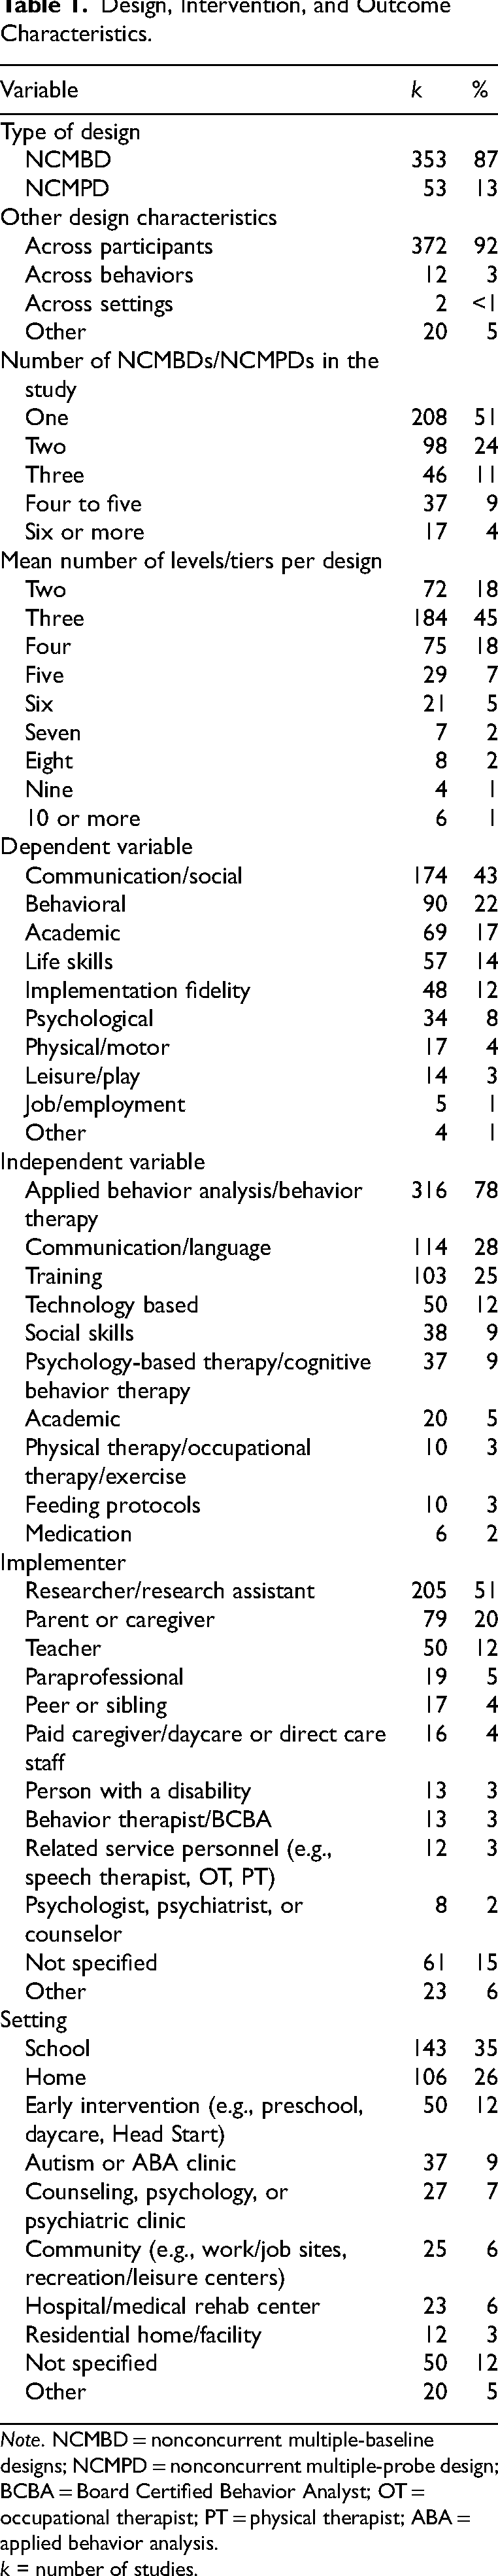
Note. NCMBD = nonconcurrent multiple-baseline designs; NCMPD = nonconcurrent multiple-probe design; BCBA = Board Certified Behavior Analyst; OT = occupational therapist; PT = physical therapist; ABA = applied behavior analysis. k = number of studies.
Interventions occurred in a variety of settings, with school (35%) and home (26%) being most prevalent, followed by early intervention (12%). Residential homes or facilities were settings in the least number of studies (3%; k = 12).
Dependent and Independent Variables
The most frequently targeted dependent variable was communication or social skills (43%), followed by behavioral (22%), academic (17%), and life skills (14%). Implementation fidelity was targeted in 12% of studies and various other skills in fewer than 10% of studies. Job or employment skills were targeted least frequently within this corpus of studies (1%; k = 5).
Applied behavior analysis or behavior therapy was by far the most frequently used intervention, with 78% of studies using at least some behavior-analytic practices. More than a quarter of included studies (28%) used communication or language interventions, followed by training (25%) and technology-based interventions (12%). Other interventions were tested in fewer than 10% of included studies, with medication being the least common (2%; k = 6).
Design Characteristics
Type and Number of Designs
Most studies implemented an NCMBD (87%; k = 353) as opposed to an NCMPD (see Table 1). Further, the vast majority of studies adopted an across-participants design (92%; k = 372), with only 12 studies adopting an across-behaviors design (3%) and two studies adopting an across-settings design (1%). More than half of the included studies reported results using only a single MPB or MBD (51%), whereas nearly 25% used two designs. The remaining 25% of studies used three or more designs.
Embedded Designs
One fifth of studies embedded another design within the NCMBD or NCMPD (20%; k = 80). Of those studies that embedded another design, 42 embedded alternating-treatments or multielement designs (53%), and 31 embedded reversal or withdrawal designs (39%). Seven studies embedded another type of design (9%). These included changing-criterion designs, multiple-schedules designs, and a combination of alternating-treatments and reversal designs.
Number of Levels or Tiers and Data Points
The mean number of levels per study was 3.66 (SD = 1.74; range: 2–16). When analyzed categorically, most designs included three levels (45%), followed by two levels (18%) and four levels (18%). The remaining studies (18%) included designs with five or more levels. Analyzed across time, slightly more studies included three or more levels after 2005, when Horner et al.’s (2005) article was published, advocating for a minimum of three replications of effect (85% of studies between 2006 and 2020 included three or more levels). However, a large percentage of studies (67%) between 1988 and 2005 already met this standard.
Regarding number of baseline data points, we found that most studies had a minimum of one to three (57% for NCMBD, 78% for NCMPD) and a maximum of 6 to 10 (45% for NCMBD, 28% for NCMPD). For intervention data points, most NCMBD studies had a minimum of 6 to 10 (30%), and most NCMPD studies had a minimum of one (26%). When considering the maximum number of intervention data points, most studies had six or more, regardless of design. See “Data Points” on OSF for a tabular presentation of these data.
Presentation of Data
The majority of studies (75%; k = 306) presented data concurrently, whereas 23% of studies (k = 91) presented data nonconcurrently. Only nine studies presented data on some graphs concurrently and on other graphs nonconcurrently (2%). The vast majority (98%; k = 398) of studies used a general term to label the data on the x-axis. A total of six studies used a specific date on the x-axis (1%), one study labeled some graphs using general terms and other graphs using specific dates (<1%), and one study did not label the x-axis (<1%).
Design Description
Over half of the included studies used the word “experiment” or “experimental” to describe the NCD in either the abstract or narrative (58%; k = 237). An additional 69 studies (17%) used the term “experiment” in the Design heading of the Method section (e.g., “Experimental Design”) but did not use it anywhere else in the publication to describe the NCD. The remaining studies (25%; k = 100) did not use the word “experiment” or “experimental” to describe the NCD anywhere in the publication. Further, nearly 1 in 5 studies (18%; k = 73) used the term “functional relation(ship)” or a similar term in reference to the independent and dependent variables.
Visual Analysis Aids
Approximately one fifth of included studies used a graphical aid (17%; k = 69), descriptive statistics (22%; k = 89), or statistical analyses (21%; k = 87) to complement or assist with visual analysis or interpreting graphed data. It should be noted that we coded studies as reporting descriptive statistics only if they were presented in a tabular format; anecdotally, however, authors frequently used at least one descriptive statistic in the narrative to summarize graphed data, and so this variable may be underreported. Additionally, to further contextualize the statistical-analysis variable, we extracted data regarding (a) which statistical procedures authors reported using and (b) the citations authors provided to support the use of the selected statistical procedures with single-case data (see “Statistical Analyses” document on OSF).
Overall, authors used a total of 34 different analyses to quantify the effects of single-case data (one author simply reported calculating “an effect size”; as such, this study was coded as “other” and not reported in the “Statistical Analyses” summary table). Most studies that reported using a statistical analysis reported the results of only one analysis (74%; k = 64); however, 13% of the studies reported results for two analyses (k = 11), 10% reported results for three analyses (k = 9), and three studies reported results for four, five, and six analyses, respectively. The most frequently reported analyses were nonoverlap indices, led by percentage of nonoverlapping data (PND; 26%; k = 23) and Tau-U (18%; k = 16). Cohen's d (14%; k = 12) and the Kolmogorov-Smirnov test (13%; k = 11) were also used frequently; however, all studies reporting Kolmogorov-Smirnov statistics were provided by only two unique authors, leading to an overrepresentation of this analysis in the data set. When analyzing effect size use by unique authors, the five most common statistical analyses were PND (19 authors), Tau-U (14 authors), Cohen's d (11 authors), nonoverlap of all pairs (nine authors), and improvement rate difference (six authors).
Rationale for Using an NCD
Most studies did not specify reasons for adopting an NCD over a concurrent one (78%; k = 315). Of the studies that reported reasons, most cited logistical, feasible, or practical considerations related to applied settings (77%; k = 70). Studies also reported ethical reasons, such as not wanting to delay treatment (17%; k = 15), or difficulty recruiting participants (20%; k = 18).
Randomization Characteristics
One fifth of the studies implemented some form of randomization (20%; k = 83). Of those that did, most incorporated case, phase, or intervention start-point randomization (60%; k = 50), and the remaining studies incorporated another form of randomization (40%; k = 33), such as randomizing the alternating conditions in an alternating-treatments design. Only one study mentioned applying some type of randomization statistical test (Erturk, 2019), even though the results of that test were not reported in the Results section.
Frequency of NCDs Among Researchers
Across the 406 studies in our sample, we identified 857 unique authors. Authors appeared in our cumulative list between one and 27 times (Mdn = 1, M = 1.6, SD = 1.9). Of these authors, a vast majority (78%; n = 665) appeared in the reference list only once. Ten authors appeared in the reference list 10 or more times, and only two authors appeared in the reference list over 20 times. “Reference List” on OSF provides information on distribution of authorship.
Discussion
We conducted a systematic review of NCDs in special education research based on a sampling of studies from 1988 through 2020 (see “Reference List” on OSF) and summarized findings across studies. On the basis of our findings, we offer some suggestions for improving the designs as well as future directions for practice and research.
Future Directions for Practice
Each variation of NCDs has unique considerations when it comes to affecting internal validity. Although NCDs have historically been criticized for concerns over internal validity and the inability to verify intervention effects, we found that over 80% of the included studies followed the WWC's (2022) Standards for Single-Case Design Studies for a minimum of three replications, and more than a third of studies included four or more replications. Our findings are promising, as more replications strengthen the rigor of the design and allay concerns about threats to the study's internal validity. Further, as the number of tiers in the design increases, history becomes a less plausible confounder of intervention effects. If anything, and as was noted earlier, obtaining similar effects at different points in time, as is associated with an NCMBD, would also serve to increase a study's external validity (i.e., its replicability and generalizability; see Kratochwill et al., 2022).
In general, including more replications allows for stronger inferences about the intervention's effectiveness (Kazdin, 2021). However, at the time of this writing, there is no empirical basis for either the minimum or the optimal number of replications that should be included in any of the MBD variations, concurrent or nonconcurrent. Nonetheless, a procedure advanced by Lanovaz and Rapp (2016) for the single-participant ABAB design could be applied to all variations of the multiple-level MBD to generate useful guidelines concerning the number of replications required. Lanovaz and Rapp (2016) examined a large number of actual ABAB design investigations—and specifically, the first AB component—to determine whether the data pattern in those two phases was replicated in the second AB component's phases of the series. They found that approximately 85% of the initial effects were essentially replicated in the second AB series in these designs. This procedure could be extended to MBD variations to obtain an estimate of how many tier replications might be needed for researchers to feel comfortable arguing for a credible intervention effect, at least on a descriptive or visual-analysis level. Moreover, comparisons could be made to establish effect size values to suggest that the number of replications beyond a certain threshold might not be needed in the concurrent and nonconcurrent MBD variations. Consider, for example, if a researcher who implements an NCMBD replicates the intervention effect 10 times (and with strong effects for each replication, little variation in the data, and virtually no between-phase data overlap). Would critics of an NCMBD consider such an outcome not to be credible evidence for an intervention effect?
Data Presentation
Another primary consideration in use of NCMBDs is related to how data are plotted. The most transparent approach is plotting data nonconcurrently (i.e., when the data were actually collected) and not plotting data such that every data point begins on Session 1, as is the case in a traditional concurrent MBD (see “Concurrent Example” on OSF). We found that most researchers plotted their data to resemble a concurrent design, even though data were gathered nonconcurrently. Best practice in NCDs recommends plotting actual dates of data collection on the x-axis so readers can determine when data were collected (Carr, 2005; see “Nonconcurrent Example—Dates” on OSF). This recommendation is especially important when data in the design are collected over extended periods (e.g., years), as a reader would not be able to determine when the data were collected if the data were plotted as “sessions” or another general term. Plotting actual dates on the x-axis has added benefits of making it clear to the reader (a) when multiple data points are collected in a day and (b) when there is a lag in the collection of data points (e.g., between the conclusion of intervention and beginning of maintenance). Further, when data are plotted with specific dates, readers can align the different tiers’ baseline and intervention series data points conveniently, to conduct their own ready-made “vertical analysis” of the data (see, e.g., Kratochwill et al., 2021), which is helpful for assessing replication effects. The more tiers demonstrating that an effect emerges only when the intervention is introduced to that tier (and not before), the greater confidence a researcher has that the effect was attributable to the intervention (Kazdin, 2021).
Length of Baseline Series
Several methodological features can be added to NCDs to increase the probability that an observed effect is due to the intervention. First, the researcher can apply internal validity criteria from the literature for drawing valid inferences from case studies (Kazdin, 1981; Kratochwill et al., 1984). For example, the researcher can take into account such features as the type and stability of the data series, size of the effect, and integrity of the intervention, among other features that improve drawing valid inferences. Another strategy to improve the inference of an NCMBD is to vary the length of the baseline series in each AB component (Kazdin, 2021)—something inherent to conventional concurrent MBDs. Thus, rather than adopting a fixed baseline length in each data series, the researcher would vary the length in each repetition of the AB series, whether with academic or behavioral measures (see also Levin et al.'s [2018] discussion of their revision of Marascuilo and Busk's [1988] replicated AB procedure). Further, the researcher may improve the internal validity of an NCD by embedding another design in the experiment that includes a replication component. We found that approximately 20% of the studies we reviewed added a second design to the NCD that was initially adopted.
Slocum et al. (2022) suggest that validity of the MBD, including the NCMBD, requires that the researcher focus on three dimensions of lagged phase changes across the tiers: Controlling for maturation requires baseline phases of distinctly different temporal durations (i.e., number of days); controlling for testing and session experience requires baseline phases of substantially different number of sessions; and controlling for coincidental events requires phase changes on sufficiently offset calendar dates. (p. 17). The authors note that a priority should be placed on within-tier comparisons, thereby allowing the typical temporal separation characteristic of the NCMBD to control for history effects. It is beyond the scope of the current article to expand on Slocum et al.'s arguments, but we concur with the authors that NCMBDs can potentially be on an equal “credibility” footing with traditional MBDs (Kratochwill et al., 2022).
Randomization
Another recommendation for improving the internal validity of the NCMBD is to incorporate some form of randomization into the design structure (Kratochwill & Levin, 2010; Levin et al., 2019; Levin & Ferron, 2021), as did one fifth of the studies in this review. First, a researcher may have the option to use case randomization, which requires randomly determining the order that participants, behaviors, or settings are scheduled in the investigation. Thus, for example, if the researcher has a sample of participants selected prior to the study, they would be randomly assigned to the different tiers of the design. A second option, intervention start-point randomization, is to assign each participant a random intervention start point from within a staggered, preselected start-point interval. A third type, within-case intervention order randomization, involves randomly assigning the administration order of A and B phases to each participant and would typically be adopted for reversal designs. With this approach, the researcher would randomize which of the two phases, A or B, begins in each replicated series (e.g., AB, BA, AB). An NCMBD researcher is unlikely to use this option, because the MBD is typically selected to circumvent the need for intervention withdrawal that typically occurs in a reversal design (i.e., intervention or B phase first, then baseline or A phase). However, when two interventions are being considered within an MBD (e.g., B and C), within-case intervention order randomization might be an option. A fourth randomization type, between-case intervention randomization, is typically applied in studies in which the researcher is interested in comparing two or more intervention conditions (e.g., B, C, or D), and participants are randomly assigned to these conditions or to a baseline control (A). Various randomized two-sample MBDs and associated analyses have recently been discussed and empirically investigated (Levin et al., 2022; Levin & Ferron, 2021). The four types of randomization may be used in combination if circumstances permit (e.g., case and intervention start-point randomization; within-case intervention order and intervention start-point randomization; see Collier-Meek et al., 2019; Hwang & Levin, 2019).
Although randomization can improve the internal validity of NCMBDs by counteracting potential researcher and methodological biases (Kratochwill & Levin, 2010), it requires decisions to be made prior to data collection, such as determining the number of data points to be included in each phase for intervention start-point randomization. Researchers may use practices such as preregistration of studies (e.g., on OSF; see Kratochwill et al., 2021) to specify data points that are acceptable for randomization. However, this a priori specification of when intervention will begin may be problematic if baseline data are not stable, as it is common in single-case research to wait until baseline data stabilize prior to intervening. One solution is for the researcher to decide upon a fixed number of baseline data points prior to starting the intervention (e.g., Levin et al., 2019; Levin & Ferron, 2021). Doing so increases the flexibility afforded to the researcher regarding the timing of phase changes; however, it also necessitates the collection of additional data points, which may not be feasible or desirable, depending on setting or intervention constraints. For example, with interventions targeting self-injurious or other harmful behaviors, it may be unethical to delay treatment for extended periods of time to collect the requisite number of data points in baseline. Similarly, interventions targeting academic outcomes may not demand the collection of large numbers of baseline data points, and doing so may pose ethical and methodological challenges (Harris et al., 2019; Kratochwill et al., 2023). Typically, participants are selected for academic intervention based on a history of low performance on academic tasks. Thus, the researcher knows in advance that the student requires intervention. In that case, collecting extended baseline data points necessitates the student “failing” repeatedly, which may be unethical if a small number of baseline data are stable and indicate a need for intervention. Further, collection of extended baseline data points for academic dependent variables may pose methodological concerns by increasing the potential for reactivity to the assessment, thus threatening internal validity. Following communication and social skills, behavioral and academic outcomes were the second and third most common dependent variables targeted by studies in this review, respectively. As such, concerns about the collection of extended baseline data may very well be valid. Our findings also indicate that very few studies cited any reason for adopting an NCMBD. Of the few that did report a rationale, only a small portion cited ethical reasons, such as not wanting to delay treatment. Authors of studies targeting behavioral and academic outcomes may have had ethical reasons in mind when choosing an NCMBD for their interventions, but it is unknown how frequently this choice occurred, given the small number of studies that reported rationales. Researchers who implement NCDs may consider reporting this information more regularly to increase transparency of their procedures and interpretability of findings. Further, the WWC may consider including a related quality standard to determine whether authors provided a rationale for their design choice. Including a rationale for any type of design used would be valuable for advancing the science and for offering guidance to fellow researchers.
Randomization Tests and Statistical Analyses
Appropriate use of randomization also provides researchers with the option to conduct a randomization statistical test, a major addition to statistical conclusion validity and an important supplement to visual analysis (Kratochwill & Levin, 2010; Levin & Kratochwill, 2021). That is, randomization tests and other viable single-case statistically based procedures lead to objectively derived, completely replicable data-analysis conclusions—something that researcher-conducted visual analyses cannot guarantee.
Fortunately, there are other options for quantifying effects. We found that authors reported using 34 different statistical analyses to quantify single-case data, which can be broadly categorized into parametric and nonparametric analyses. Although it is beyond the scope of this study to discuss the appropriateness of every metric, we highlight Tau-U and the between-case standardized mean difference (BC-SMD; see Chen et al., 2022) as two potential, complementary options for researchers.
Tau-U is a type of nonparametric analysis that is classified as a nonoverlap measure (see Parker, Vannest, & Davis, 2011). Four of the five most frequently used analyses in this study were nonoverlap indices, possibly due to their ease of calculation and interpretation. Of the nonoverlap indices, Parker, Vannest, Davis, et al. (2011) cite that Tau-U has several advantages over other options, including (a) less susceptibility to outliers due to use of all data points, (b) greater statistical power and precision, (c) ability to control for undesirable baseline trend, and (d) ability to calculate confidence intervals. Further, Tau-U has a high degree of reliability with visual analysis (Brossart et al., 2014). Despite these advantages, nonoverlap indices do have limitations, namely, the inability to measure the magnitude of an effect. As an illustration, consider Situation 1, where the A- and B-phase means are five units apart, with comparable outcome variation in the two phases, and with no overlap in the two phases’ outcomes; and Situation 2, where the A- and B-phase means are 10 units apart, again with comparable outcome variation in the two phases, and with no overlap in the two phases’ outcomes. The parametric effect size measures might be d = 0.50 (a moderate conventional effect size) for Situation 1 and d = 0.80 (a large conventional effect size) for Situation 2, and yet the two nonoverlap indices would be an identical 1.00 in both situations.
The BC-SMD (or design-comparable effect size) is a newer parametric effect size measure developed for use with single-case data that does measure magnitude and allows for theoretical aggregation of single-case- and group-design data (Shadish et al., 2014); however, the BC-SMD is not without its own limitations. For example, the results of BC-SMD vary widely (see Peltier et al., 2020, where the BC-SMD ranged from 0.03 to 18.58), and currently it can be used only in a limited number of contexts (e.g., reversal designs and MBDs across participants) and for designs with more than two participants. Despite these limitations, the BC-SMD holds promise as a primary effect size for single-case data as researchers are actively working to refine and improve it, including developing benchmarking standards for interpreting the magnitude of effect (see Pustejovsky et al., 2022) and extending its use to a larger number of design options (see Chen et al., 2022; Hedges & Natesan Batley, 2022–2025). Because all measures of effect for single-case data have their own limitations and there is not consensus in the field on which measure to use, current recommendations are to report results from multiple measures (Manolov et al., 2017; Vannest et al., 2018), as did nearly a quarter of the primary studies in this review.
Future Directions for Research
The goal of this study was to provide a broad overview of how NCDs were being used in special education research and offer recommendations for how to improve the validity and credibility of these designs when adopted by researchers. To accomplish this goal, we conducted a systematic search of the literature and coded variables related to participant characteristics, intervention dimensions, dependent variables, and design characteristics. Despite the comprehensiveness of this study, several areas remain to be investigated, namely, those related to internal validity. For example, although critics of NCDs have speculated that these designs are more vulnerable to threats to internal validity, to our knowledge, this speculation is not supported by empirical data from a large-scale review of the literature. Research is needed on the frequency and type of threats to internal validity that occur in special education research using an NCD (detailed by Slocum et al., 2022), such as (a) maturation, (b) testing and session experience, and (c) history. Further, an examination and evaluation of how researchers have managed specific threats to internal validity in studies using an NCD would provide valuable information to the field. Specifically, authors of future studies may consider describing threats to internal validity in NCDs, perhaps in a table, with examples from the literature demonstrating how researchers have successfully addressed threats in their designs. By continuing to investigate the use of NCDs in the literature, we can further our understanding of these designs and how to increase their rigor and acceptability among special education researchers.
Limitations
There are a few limitations to our examination of the NCD research literature. First, many studies had codes of “not specified” due to generic descriptions (e.g., “coach,” “therapist,” “clinic”) and minimal information on the implementer or setting. To bridge research to practice, increase replicability, and promote transference of skills to natural settings and agents, researchers must fully describe the knowledge and experience required for such roles. Second, few authors provided specific information about the design in their abstracts. Although our operational strategy included searching for keywords in the full text of the study, such a strategy depends on library database subscriptions and access to full text. If only the title and abstract are available, as was often the case, the search is limited to these two components of the document. Although our first-author search and review of nonconcurrent articles from the NCAEP study captured quite a few studies that would have otherwise been missed, there are likely some articles with an NCD that were not included in this review as a result of the search not capturing them. To ensure that future reviews can correctly identify studies meeting design-related criteria, it is important that authors specify the study's design in the abstract.
Third, the quality of graphs was sometimes poor, which led to difficulty when trying to count the data points in the baseline and intervention phases. Readers should keep this limitation in mind when evaluating results based on graphs. Finally, there was tremendous variability in how data and graphs were presented. For example, some studies included all levels of the NCD in one figure, as is typical in MBDs, whereas other studies included each level as a separate figure. Still other studies included multiple designs in one figure, making it difficult to determine what constituted a single design. Further, many studies included multiple intervention phases or embedded other designs within the NCMBD (e.g., reversal or withdrawal design), making it difficult to determine what exactly constituted intervention for the purpose of counting intervention data points. Although our team established decision rules for coding these variables to ensure consistency (see Method), applying different decision rules may have yielded alternative results from those in our study.
Conclusion
We have offered a number of future directions for the use of NCDs in special education based on our research. Although concurrent designs are typically regarded as methodologically preferable to NCDs, collecting concurrent data may be neither practical nor feasible owing to field limitations and unforeseen circumstances. We support Slocum et al.'s (2022) and Kratochwill et al.'s (2022) assertion that NCMBDs offer a desirable, methodologically sound alternative for MBD intervention researchers to consider. The recommendations and guidelines that we offer here have the promise to improve the inferences that can be drawn from results produced by NCDs in special education research.