
Abstract
We used time-varying effect modelling of two very large samples of fourth-grade students (Nreading = 148,240, Nmathematics = 152,220) to investigate associations between adoption and over-time implementation of a de facto cap on special education service receipt and over-time likelihoods of disability identification from 2003 to 2017 for Texas students including those from historically marginalized communities. Following the cap's adoption, Texas students who are Black or English Language Learners (ELLs) were gradually less likely to have been identified as having disabilities than students in adjoining statues who are Black or ELLs in analyses adjusting for individual academic achievement, family economic disadvantage, school fixed effects, and other explanatory factors. Findings provide additional evidence of the cap's specific associations with disability identification disparities for demographic populations especially likely to have experienced violations of the Individuals with Disabilities Education Act's Child Find and free and appropriate public education requirements.
Keywords
The Texas Special Education Cap
In 2004, the Texas Education Agency (TEA) adopted a de facto cap on the receipt of special education services in the state through pre-specified special education representation indicators (U.S. Department of Education’s Office of Special Education Programs [OSEP], 2018) included in the Performance Based Monitoring Analysis System (PBMAS). The PBMAS required school districts to report yearly data on specific performance indicators (Ballis & Heath, 2021a, 2021b; TEA, 2004). For each indicator, PBMAS assigned a level of intervention and required actions to school districts (OSEP, 2017). School districts were given scores indicating appropriate performance when the total percentage of their students receiving special education services was 8.5% or lower of the district's total student enrollment (DeMatthews & Knight, 2019).
The TEA also set special education representation indicators specifically for Black and Hispanic students. School districts were required to report whether the percent of Black or Hispanic students receiving special education was no more than one percentage point higher than the district's total Black or Hispanic student enrollment (TEA, 2004). In 2006, the TEA (2006) introduced this same one percentage point threshold for students identified as limited English proficient (LEP). Adoption of the special education thresholds was partially justified on suggestions that Texas students who are Black or English Language Learners (ELLs) were being over-identified as having disabilities (Rosenthal, 2016). Texas school districts exceeding the thresholds could receive additional monitoring and interventions that increased in severity based on the distance from the thresholds and the number of years the thresholds were unmet (Ballis & Heath, 2021b).
Following extensive investigative reporting in 2016 by the Houston Chronicle (Rosenthal, 2016), OSEP conducted a civil rights investigation from 2016 to 2017 to examine whether Texas had systemically denied students with disabilities (SWDs) access to special education and related services. The investigation found TEA noncompliant in proper implementation of the Individuals with Disabilities Education Act's (IDEA) Child Find and free and appropriate public education (FAPE) requirements (OSEP, 2018). This included delaying or denying appropriate evaluations for students who were likely to have disabilities and be in need of special education services (OSEP, 2017).
In 2017, the TEA removed the PBMAS special education thresholds. The Texas Legislature also formally repealed the Texas Special Education Cap's (TSEC) 8.5% indicators. In 2018, OSEP released a report finding that TEA's adoption and multi-year implementation of the special education representation indicators illegally incentivized Texas school districts to deny special education services to SWDs and so had failed to meet IDEA's Child Find and FAPE requirements (OSEP, 2018). Specifically, OSEP concluded that “TEA's use of the 8.5% indicator contributed to a state-wide pattern of practices that demonstrate that TEA did not ensure that all Independent School Districts in the State properly identified, located, and evaluated all children with disabilities who were in need of special education and related services” (p. 3). The TEA was required to develop and implement a corrective action response (CAR) to ensure compliance with IDEA. In 2020, OSEP reviewed TEA's progress on the CAR and concluded that TEA remained noncompliant in meeting IDEA's requirements. This included insufficient documentation that SWDs in Texas were being appropriately evaluated, identified, and provided with special education services. On August 27, 2021, OSEP notified TEA that Texas was at risk of losing federal special education funding due to continued noncompliance with the CAR (Dellinger, 2021).
Limitations in the Extant Knowledge Base About the Texas Special Education Cap
Yet empirical evidence of the extent to which adoption and over-time implementation of the de facto TSEC may have resulted in state-specific violations of IDEA's Child Find and FAPE requirements is currently limited, including for students from historically marginalized communities. The Houston Chronicle's extensive investigative reporting (Rosenthal, 2016) mostly relied on unadjusted descriptive statistics and interviews of stakeholders including parents of SWD who had not been formally identified by Texas schools and so were not provided with FAPE. OSEP's (2018) investigation included site visits of 12 independent school districts, interviews with teachers, staff, and administrators, listening sessions throughout the state, reviews of state- and district-level materials relating to disability identification and evaluation, and interviews with TEA representatives. Yet OSEP did not collect or independently examine regional data of the extent to which the likelihoods of disability identification among similarly situated students in Texas versus the adjoining states fluctuated over time following the TSEC's adoption and over-time implementation. This includes for students who are Black, Hispanic, ELLs, or from low-income families. Contrasts between similarly situated students, including those attending schools in the same region and across the same period, would provide stronger evidence of state-specific Child Find and FAPE violations associated with the state's de facto cap on special education service receipt. Contrasts between students in the region who were similar in academic achievement, grade, family economic background, and school resources would also help to establish whether differential treatment in disability identification was systemically occurring (U.S. Department of Education’s Office of Civil Rights [OCR], 2016).
These contrasts are currently unavailable from the few peer-reviewed studies examining the TSEC (Ballis & Heath, 2021a, 2021b; DeMatthews & Knight, 2019). Instead, the available studies have mostly contrasted students attending schools only within Texas or reported on district- and school-based factors that influenced special education enrollment trends as well as the causal impacts of the TSEC on student achievement, high school completion and college enrollment, post-secondary employment, and later earnings including for students of color. For example, Ballis and Heath (2021a) found that students of color and those from low-income families were more likely to lose special education services after fifth grade due to the TSEC's implementation. Their results were based on a sample of students attending Texas public schools between 1999–2000 and 2004–2005 and who had previously received special education services by fifth grade. Estimating the time-varying disability identification likelihoods of Black, Hispanic, ELLs, or low-income students in Texas relative to similarly situated Black, Hispanic, ELLs, or low-income students attending schools in the adjoining states from 2003 to 2017—and so during the TSEC's full implementation period—would provide additional empirical evidence of whether the state's adoption of the special education representation indicators was associated with Child Find and FAPE violations including for students from historically marginalized communities.
Study’s Purpose
We estimated the time-varying likelihoods of disability identification from 2003 to 2017 for students attending elementary schools in Texas relative to similarly situated students attending elementary schools in the adjoining states (i.e., Arkansas, Louisiana, New Mexico, and Oklahoma) including those who are Black, Hispanic, ELLs, or from low-income families. We investigated the following research question: Was the TEA's adoption and over-time implementation of the special education representation indicators associated with lower likelihoods that Texas students, including those who are Black, Hispanic, ELLs, or from low-income families, were identified as having disabilities relative to similarly situated students attending elementary schools in adjoining states across the same 14-year period?
We hypothesized that we would observe relatively lower disability identification likelihoods of Texas students following adoption and implementation of the TEA's special education representation indicators in analyses controlling for regional, year, age, biological sex, and achievement confounds. We expected to observe gradual declines in the likelihoods that Texas students were identified as having disabilities and receiving special education services following the TSEC's adoption and over-time implementation. This is because we expected the TSEC to mostly have resulted in the denial of services to students who had not yet been formally identified as having disabilities, instead of the deidentification of students who had already been identified as having disabilities by Texas schools (Rosenthal, 2016). We also expected over-time fluctuations in disability identification likelihoods to vary across the socio-demographic groups. This is because the TSEC specifically emphasized reducing the special education representation of students who are Black, Hispanic, and ELLs but not those from low-income families.
Method
Dataset
We analyzed student-level data from repeated cross-sectional samples of students who participated in the fourth grade reading or mathematics surveys of the National Assessment of Educational Progress (NAEP). The NAEP data were collected among fourth-grade students biennially from 2003 to 2017, and so across the years immediately before and following the TSEC's adoption by TEA in 2004 and until formal repeal in 2017 by the Texas Legislature. The reading or mathematics achievement of students participating in the NAEP were individually assessed. The assessments were psychometrically strong measures that were extensively developed by the National Center for Education Statistics (NCES, 2017a). Student achievement is strongly associated with the likelihood of disability identification including for students from historically marginalized communities (Donovan & Cross, 2002; Morgan et al., 2017). Data were weighted to be representative of Texas and the adjoining states.
Measures
The study's criterion variable was a binary indicator of whether students had Individualized Education Programs (IEPs) on file at their school, thereby indicating formally identified disabilities resulting in the receipt of special education services. We included the following factors as explanatory variables in the regression models. The first was a binary indicator of whether the individual students resided in Texas (1) or the adjoining states of Oklahoma, Arkansas, Louisiana, or New Mexico (0). We created dummy variables capturing whether the school records indicated that the students were Black, Hispanic, or ELLs. We also included indicators for whether the school record indicated the receipt of free or reduced-price school lunch (FRL) due to family economic disadvantage. We used interaction terms for Texas*Black, Texas*Hispanic, Texas*ELL, and Texas*FRL to isolate the effects of being in Texas relative to surrounding states for these groups of students.
We included student biological sex (1 = male) and school fixed effects in addition to academic achievement as statistical controls. Students participating in the NAEP were administered either a reading or mathematics assessment. Students who were administered the NAEP reading assessments answered questions based on selected reading material appropriate to their grade. The assessments measured a wide range of reading knowledge and skills including vocabulary, locating and recalling information on literary and informational text, interpreting and integrating text content, and critiquing and evaluating what students had read (NAEP, 2017b). The NAEP mathematics assessments included items by content area such as number properties and operation, measurement, algebra, geometry, and data analysis. The items were also classified by low, moderate, and high mathematical complexity (NAEP, 2017c). The reading and mathematics assessments displayed strong psychometric properties within and across survey waves. For example, the Cohen's Kappa and intraclass correlations between 2011 and 2013 were .71 and .80 and .90 and .94 for the reading and mathematics assessments, respectively (NAEP, 2017d).
Instead of reporting a student's exact achievement score, the restricted NAEP data provided five plausible scores for each student in years 2003, 2005, 2007, 2009, and 2011. Twenty plausible scores were provided for each student in 2013, 2015, and 2017. For years in which five plausible scores were provided, we duplicated each score three times to obtain 20 plausible scores. We then combined each biennial NAEP fourth grade reading dataset into one dataset containing repeated cross-sectional observations every 2 years from 2003 to 2017 (Nreading = 148,240). We then repeated this process for each biennial NAEP fourth-grade mathematics dataset (Nmath = 152,220). For each dataset, we structured the data such that each student had 20 of these achievement scores, with each containing a different plausible reading or mathematics score as well as the sex, race, ethnicity, FRL, and ELL variables. We analyzed data using the first plausible test score. Results were similar in analyses using other plausible scores. We also internally replicated the findings in analyses of a different subsample of students who participated in the NAEP mathematics assessment and with different combinations of variables.
Analyses
We used SAS to conduct weighted time-varying effect modeling (TVEM, Lanza et al., 2016). TVEM is an extension of linear regression for examining over-time relations between at least two variables. TVEM differs from other growth or random-effects models including those that can accommodate non-linear trajectories because it makes no parametric assumptions about the nature of relations between these two variables. Instead, TVEM estimates regression coefficients as continuous functions of time and makes no assumption that the regression coefficients are fixed with respect to time. This is especially useful in empirical research that can incorporate many data points, leading the shape of the growth curve to be dynamic and complex, as was the case here. TVEM also allows for the modeling of longitudinal effects of both time-varying variables and time-invariant variables. A SAS macro is available from https://aimlab.psu.edu/tvem/weighted-tvem-sas-macro/ (Dziak et al., 2017). TVEM results are conventionally displayed graphically rather than numerically. Statistically significant results are indicated by 95% confidence intervals (CI) that do not overlap with an odds ratio (OR) of 1.00.
We specified the following logit model to explain disability identification (IEP) from Texas or the adjoining states (TX), race/ethnicity (Black and Hispanic), ELL status (ELL), free/reduced lunch recipient (FRL), interactions between Texas and these covariates (TX_Black, TX_Hispanic, TX_ELL, TX_FRL), and test scores (Test) and sex (Male):
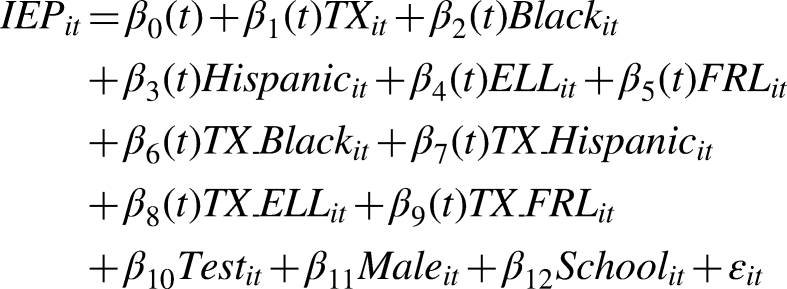
We fit the models using the sampling weight provided by the NAEP. Models were fit using the b-spline function. (The p-spline function cannot be used with weighted TVEMs.) We selected the number of knots for each time-varying predictor in a reverse stepwise fashion, guided by model fit statistics including the log likelihood and Akaike and Bayesian Information Criteria (AIC and BIC; i.e., of the 10 time-varying terms including the intercept, we first identified the optimal number of knots that maximized model fit in the 10th and final term, then the 9th term, then the 8th term, and so forth). We plotted the results as covariate-adjusted ORs with 95% CIs. These ORs were the study's effect size measures. We preregistered the analyses (https://tinyurl.com/osftexasnaep) and obtained Institutional Review Board approval. Sample sizes were rounded to the nearest 10 following NCES rules for analyzing restricted data.
Results
Table 1 displays the sample's descriptive statistics. The analytical sample was racially, ethnically, and economically diverse. Consistent with prior work (Morgan et al., 2017, 2020), supplemental analyses of the combined sample of five states (i.e., Texas, Oklahoma, Arkansas, Louisiana, and New Mexico) indicated that students who are Black, Hispanic, and ELLs were much less likely be identified as having disabilities and to receive special education services between 2003 and 2017 than similarly situated students who are White and non-ELLs (Supplementary Figures S1–S2) during the study's 14-year time frame. Low-income students were less likely to be identified as having disabilities beginning in 2010 in analyses controlling for either reading or mathematics (Supplementary Figure S3). The study's covariates displayed significant associations with the disability identification likelihoods. Consistent with prior work (e.g., Morgan et al., 2017), Table 2’s results indicated that students displaying higher academic achievement were less likely to be identified as having disabilities. Males were more likely to have disabilities (ps < .001).
Descriptive Statistics of the National Assessment of Educational Progress Fourth Grade Reading and Mathematics Samples for Texas and the Adjoining States of Arkansas, Louisiana, New Mexico, and Oklahoma Collapsed from 2003 to 2017 (Weighted Ns).
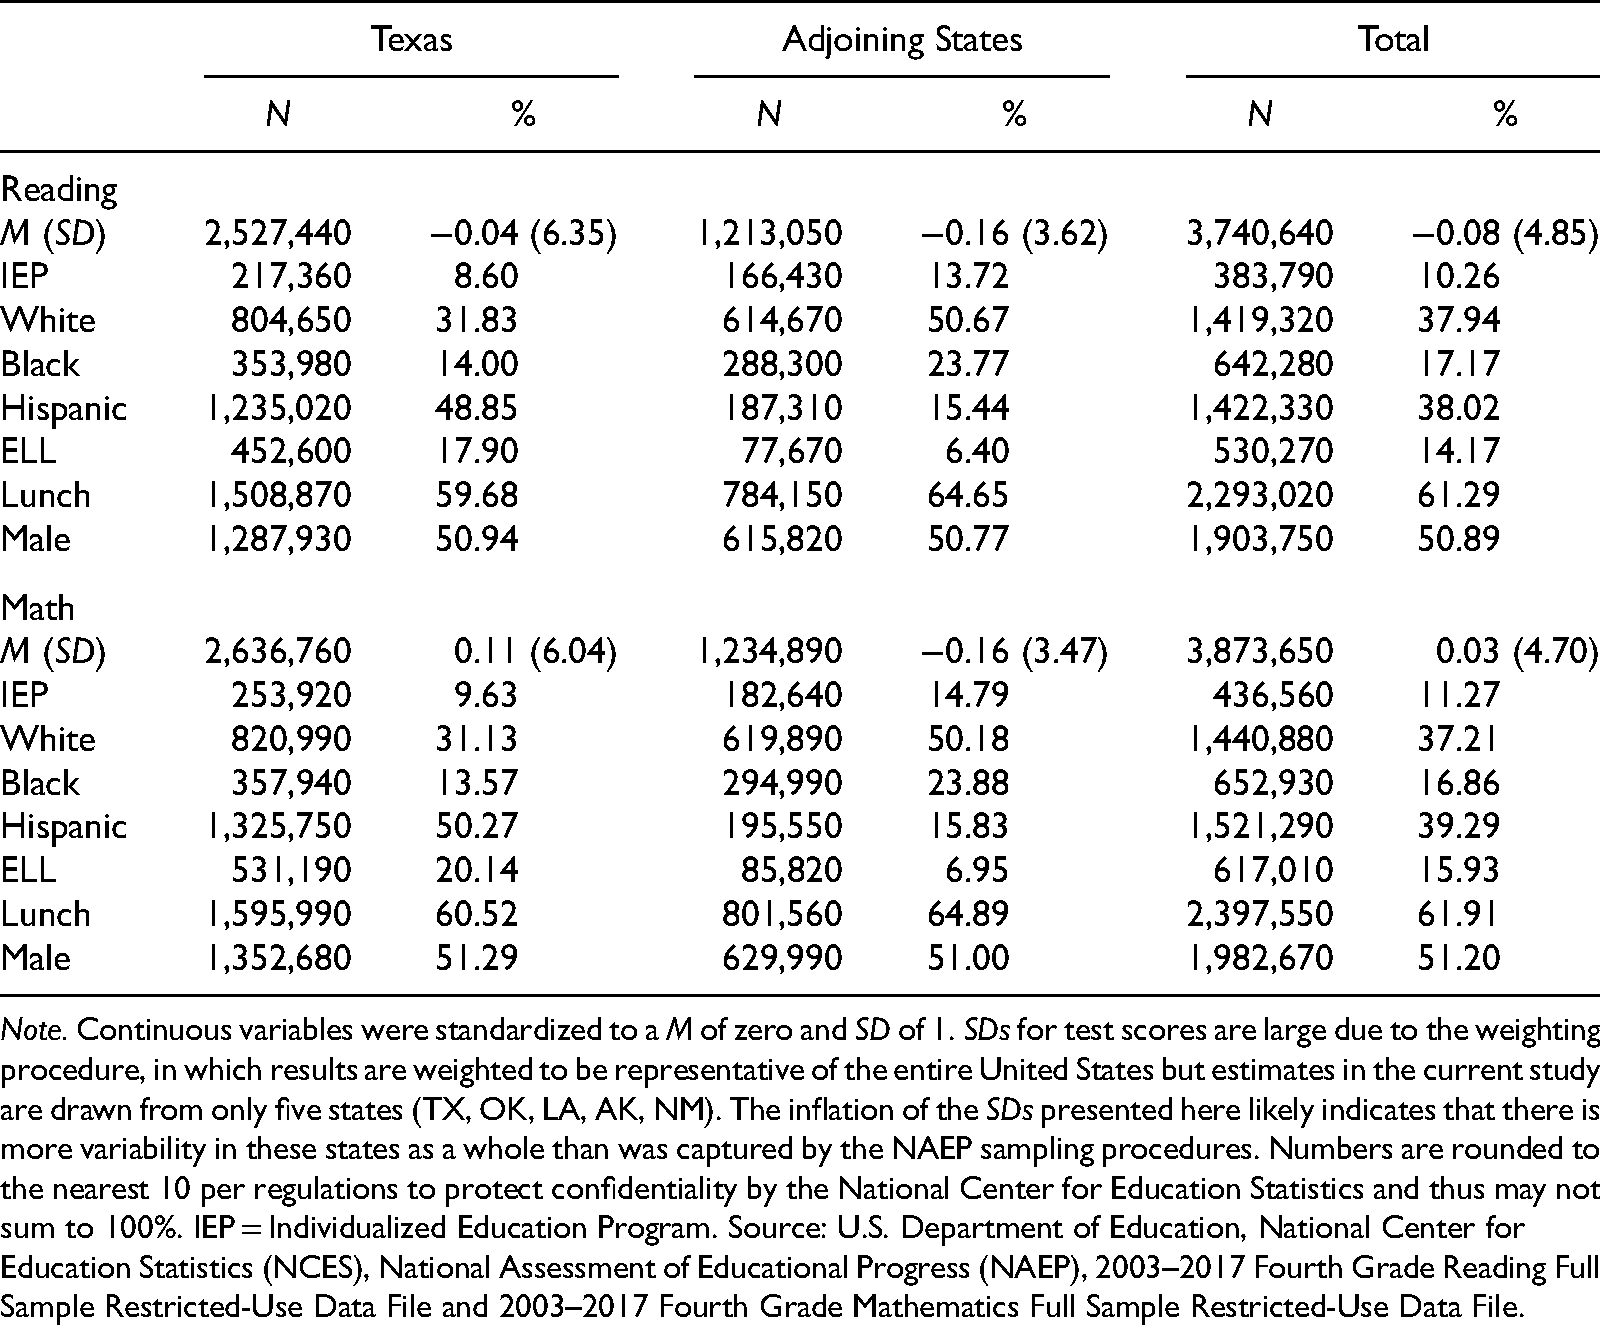
Note. Continuous variables were standardized to a M of zero and SD of 1. SDs for test scores are large due to the weighting procedure, in which results are weighted to be representative of the entire United States but estimates in the current study are drawn from only five states (TX, OK, LA, AK, NM). The inflation of the SDs presented here likely indicates that there is more variability in these states as a whole than was captured by the NAEP sampling procedures. Numbers are rounded to the nearest 10 per regulations to protect confidentiality by the National Center for Education Statistics and thus may not sum to 100%. IEP = Individualized Education Program. Source: U.S. Department of Education, National Center for Education Statistics (NCES), National Assessment of Educational Progress (NAEP), 2003–2017 Fourth Grade Reading Full Sample Restricted-Use Data File and 2003–2017 Fourth Grade Mathematics Full Sample Restricted-Use Data File.
Fixed Effects Covariates Included in Logit Time-Varying Effect Models (TVEMs) for Reading and Mathematics Measuring the Likelihood of Having an IEP in Fourth Grade From 2003 to 2017.
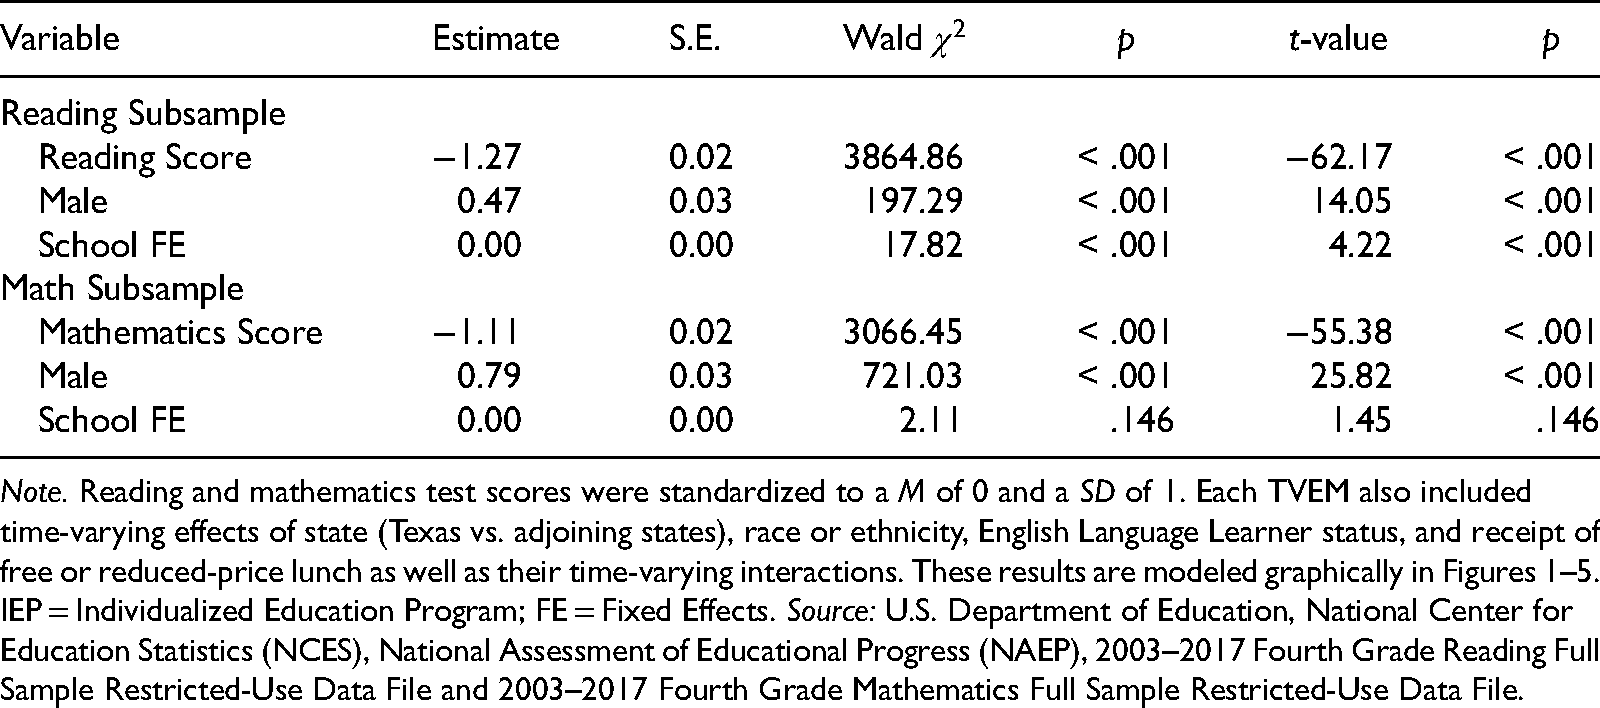
Note. Reading and mathematics test scores were standardized to a M of 0 and a SD of 1. Each TVEM also included time-varying effects of state (Texas vs. adjoining states), race or ethnicity, English Language Learner status, and receipt of free or reduced-price lunch as well as their time-varying interactions. These results are modeled graphically in Figures 1–5. IEP = Individualized Education Program; FE = Fixed Effects. Source: U.S. Department of Education, National Center for Education Statistics (NCES), National Assessment of Educational Progress (NAEP), 2003–2017 Fourth Grade Reading Full Sample Restricted-Use Data File and 2003–2017 Fourth Grade Mathematics Full Sample Restricted-Use Data File.
The TSEC's General Associations With Time-Varying Disability Identification
Figure 1 displays the time-varying likelihoods that students attending schools in Texas were identified as having disabilities relative to students attending schools in the adjoining states. Analyses adjusting for either reading or mathematics achievement initially indicated that Texas students were more likely to be identified as having disabilities immediately following the TSEC's adoption. Statistically significant over-identification was evident in 2005 in analyses adjusting for reading achievement as well as from 2004 to 2007 in analyses adjusting for mathematics achievement. Analyses adjusting for reading achievement indicated that fourth-grade students in Texas were gradually less likely to be identified as having disabilities than similarly situated fourth-grade students attending schools in the adjoining states. These estimates became statistically significant beginning in 2009 and remained statistically significant until 2013. The estimated ORs ranged from .62 to .78. Analyses adjusting for mathematics achievement followed a similar trend but did not indicate statistically significant under-identification of Texas students.
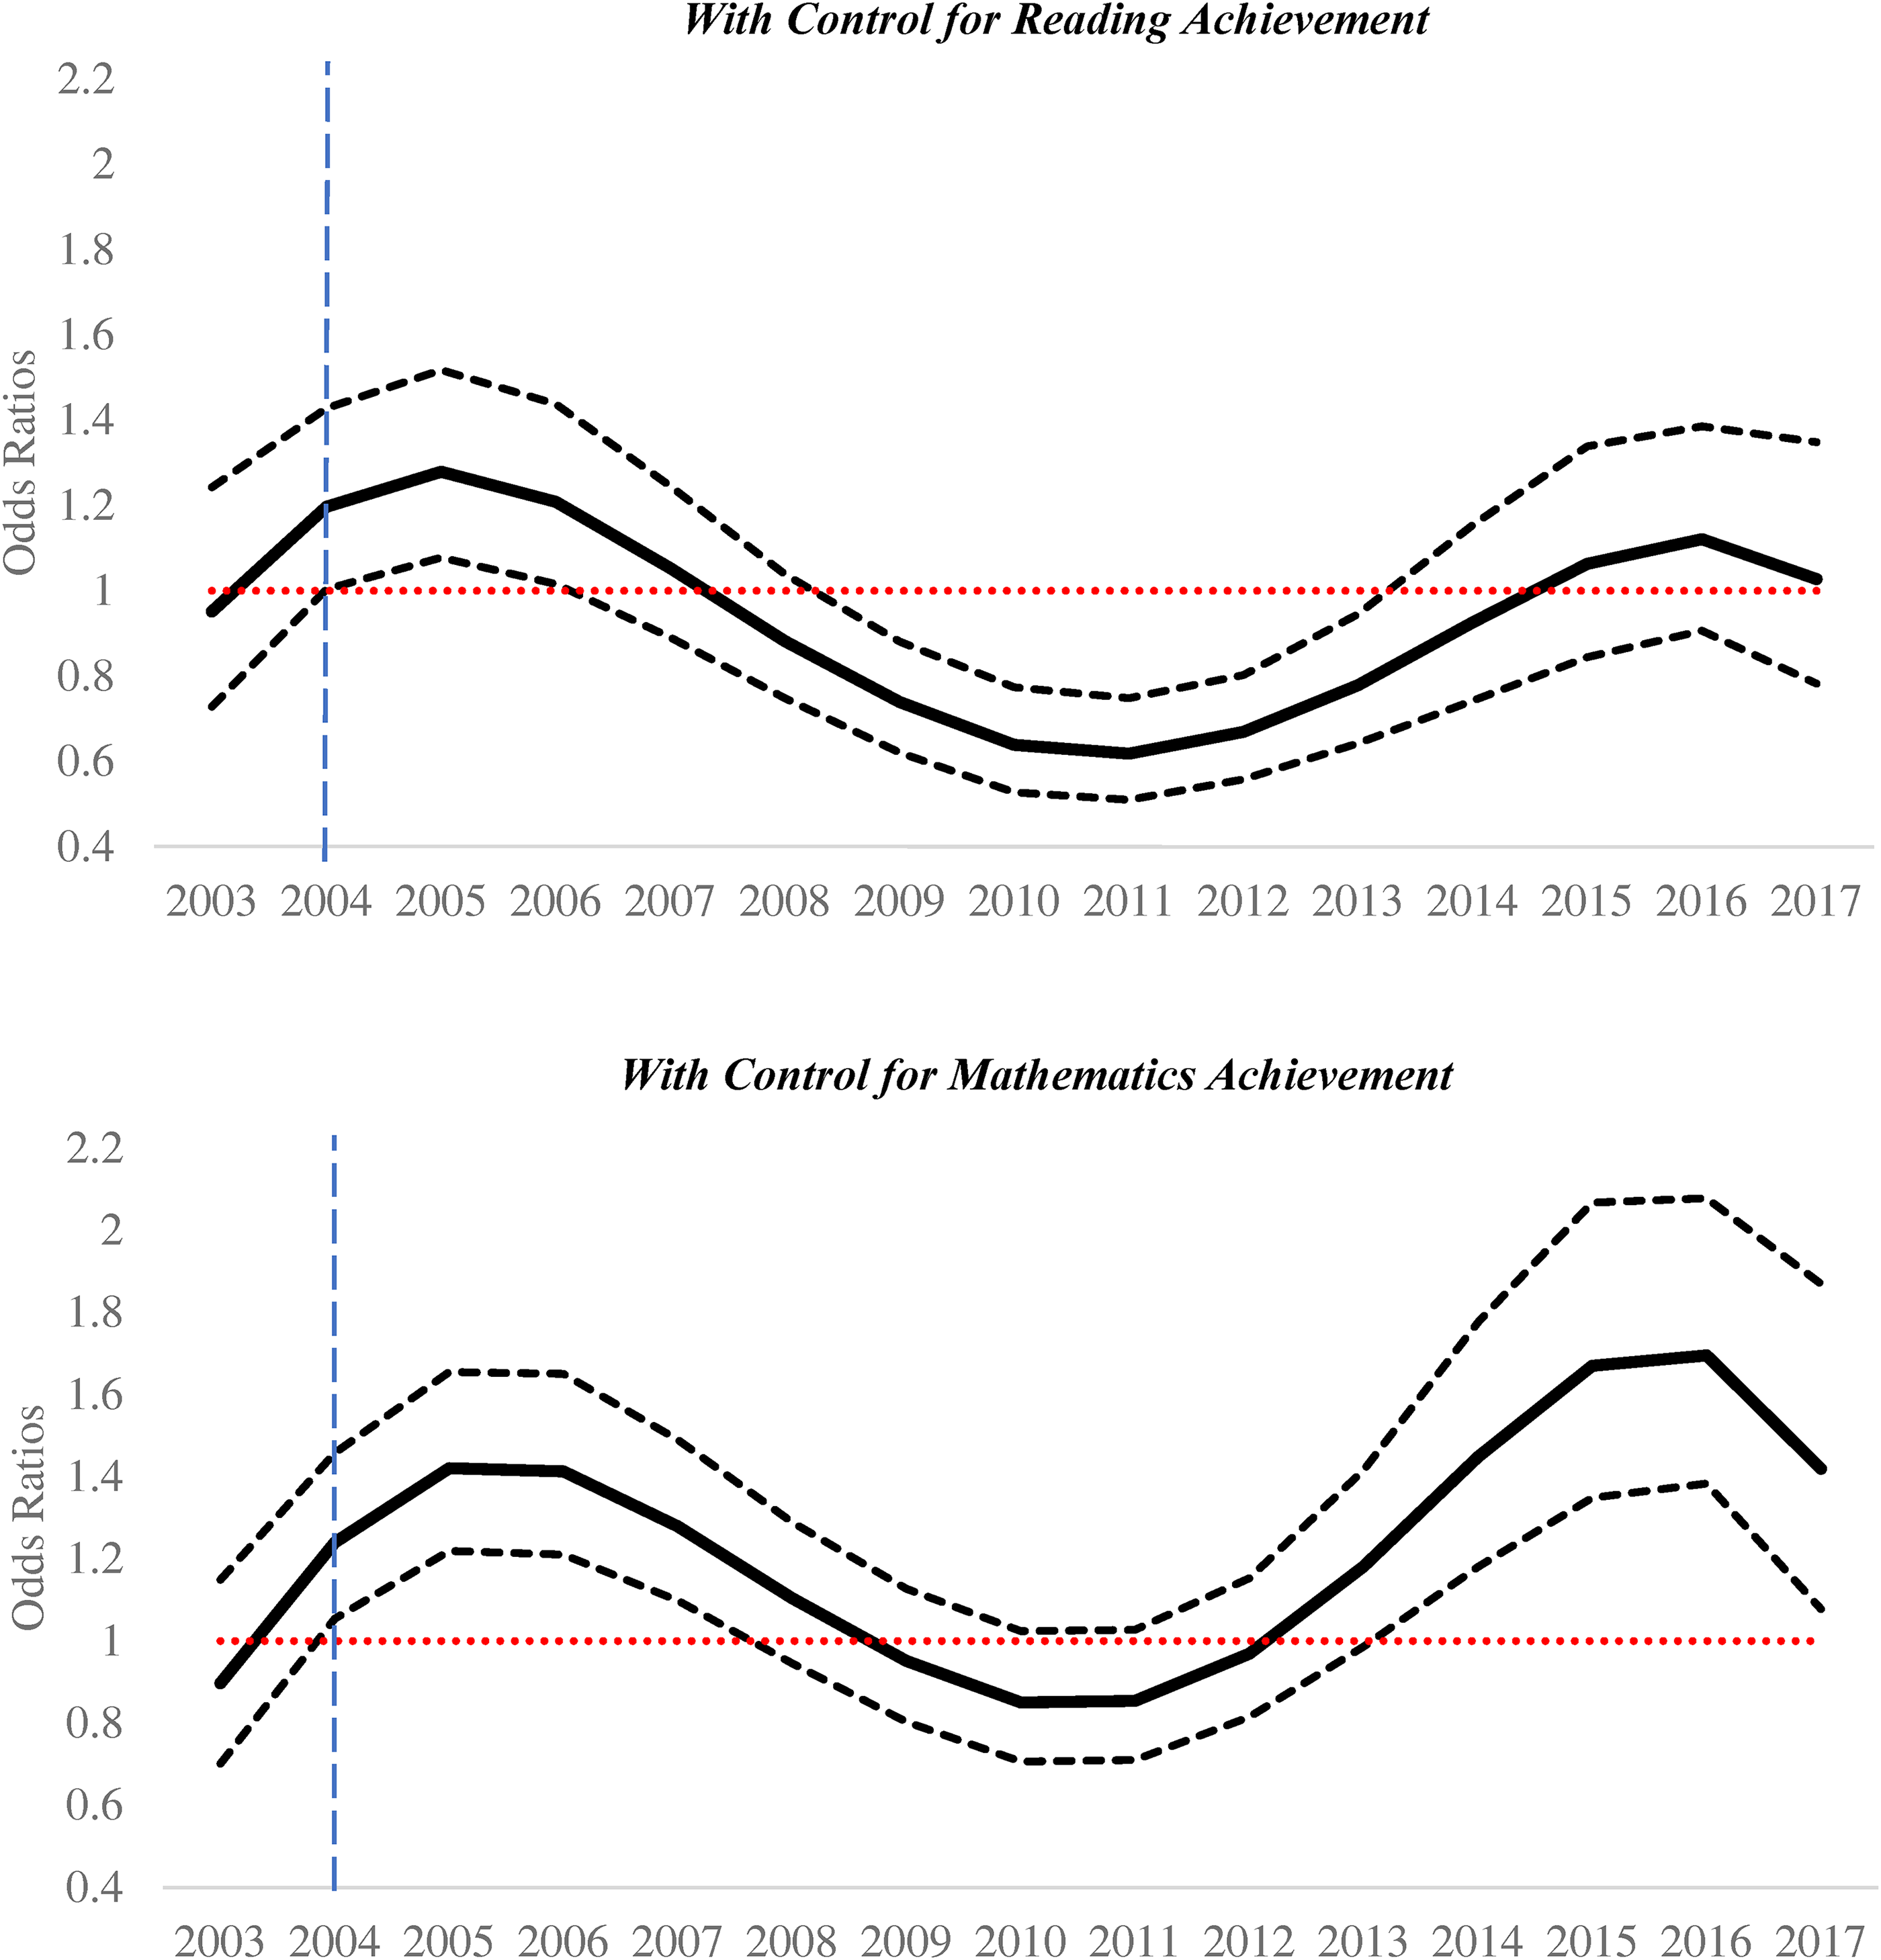
Odds Ratios for Students Having an IEP in Texas Versus the Adjoining States.
The TSEC's Specific Associations With Time-Varying Disability Identification for Black, Hispanic, ELLs, or Low-Income Students
Black Students
Figure 2 displays the time-varying disability identification likelihoods for Black students attending Texas schools relative to similarly situated Black students attending schools in the adjoining states from 2003 to 2017. Black students in Texas were less likely than similarly situated Black students in the adjoining states to be identified as having disabilities following the adoption of the TSEC. We observed statistically significant under-identification in analyses adjusting for either reading or mathematics achievement. Under-identification began to occur relatively earlier in analyses adjusting for mathematics achievement. Estimated ORs were statistically significant from 2004 to 2010 in analyses controlling for mathematics achievement. The estimated ORs were statistically significant from 2008 to 2014 in analyses controlling for reading achievement. Effect sizes ranged from .56 to .74 and .50 to .68 in analyses controlling for mathematics and reading achievement, respectively. Although the TSEC was partially justified based on suggestions that Black students were being over-identified as having disabilities in Texas schools (Rosenthal, 2016), we did not observe that Black students were over-identified in Texas schools relative to similarly situated Black students in schools in the adjoining states across the study's period.
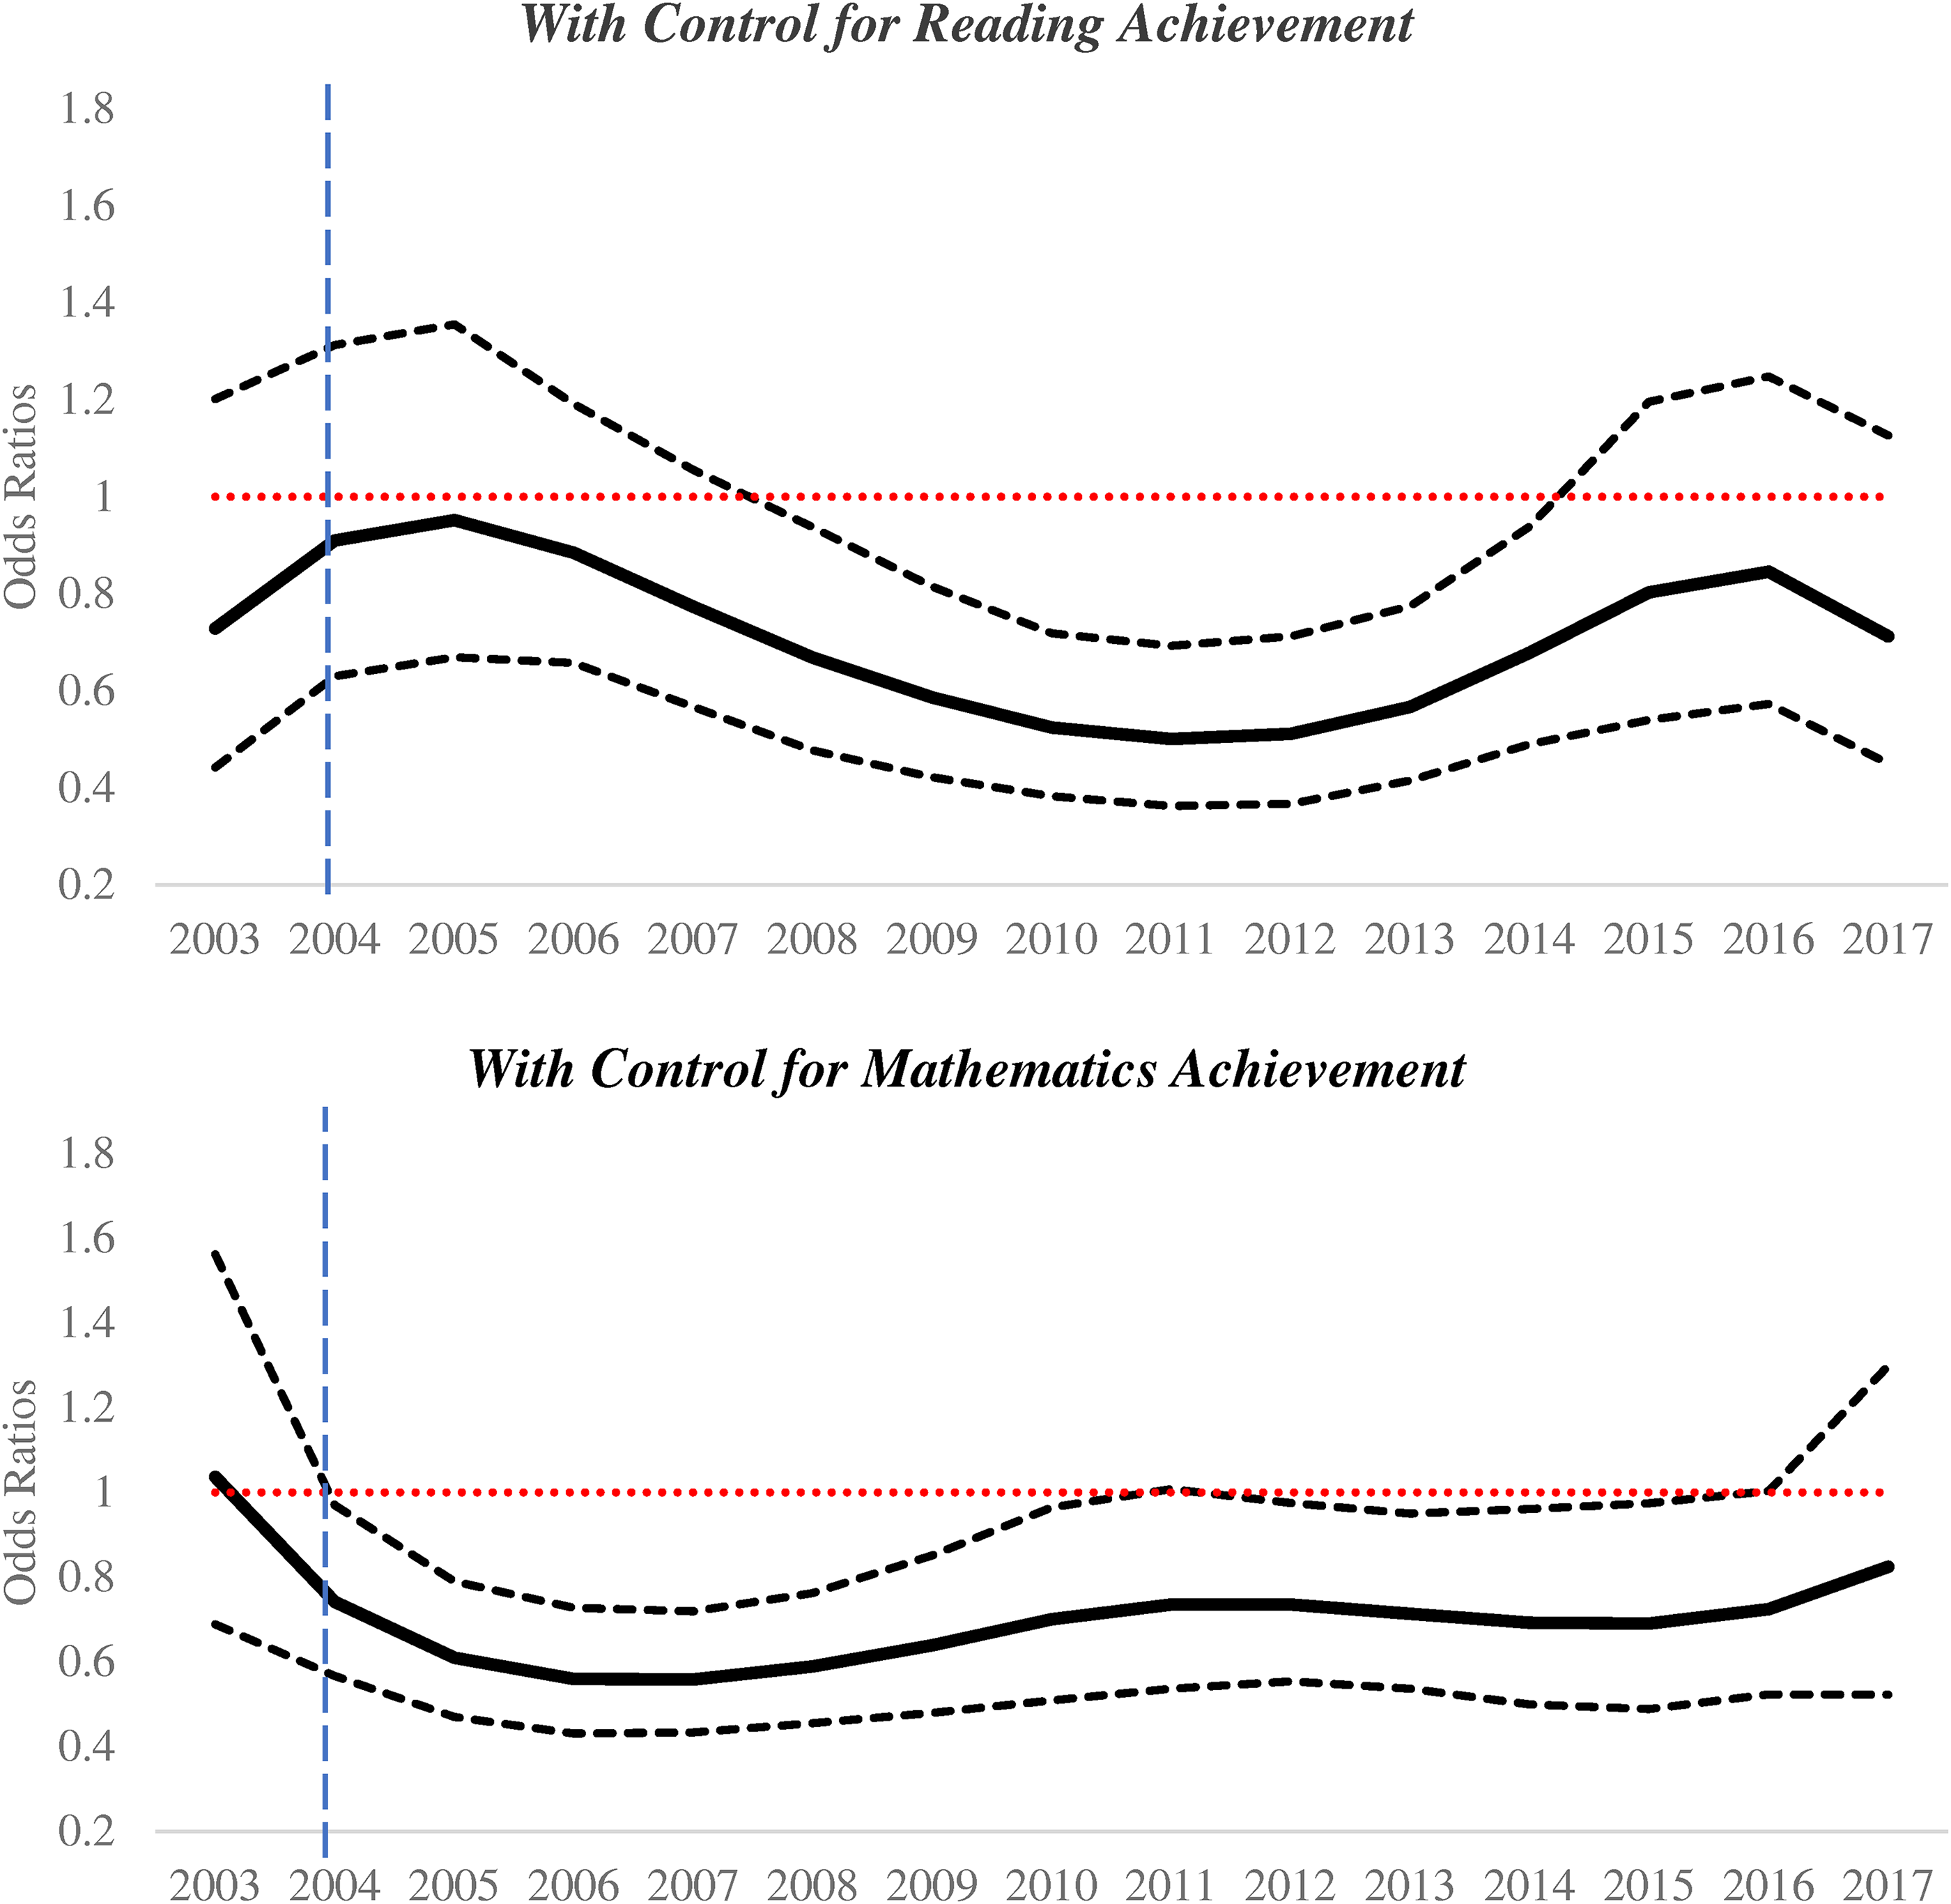
Odds Ratios for Students who are Black of Having an IEP in Texas Versus the Adjoining States.
Hispanic Students
Figure 3 displays the time-varying disability identification likelihoods for Hispanic students attending Texas schools relative to similarly situated Hispanic students attending schools in the adjoining states. We observed no statistically significant disparities in disability identification likelihoods between Hispanic students attending Texas schools relative to Hispanic students attending schools in the adjoining states. We observed consistently null findings for Hispanic students in Texas using either reading or mathematics as the statistical control for achievement.
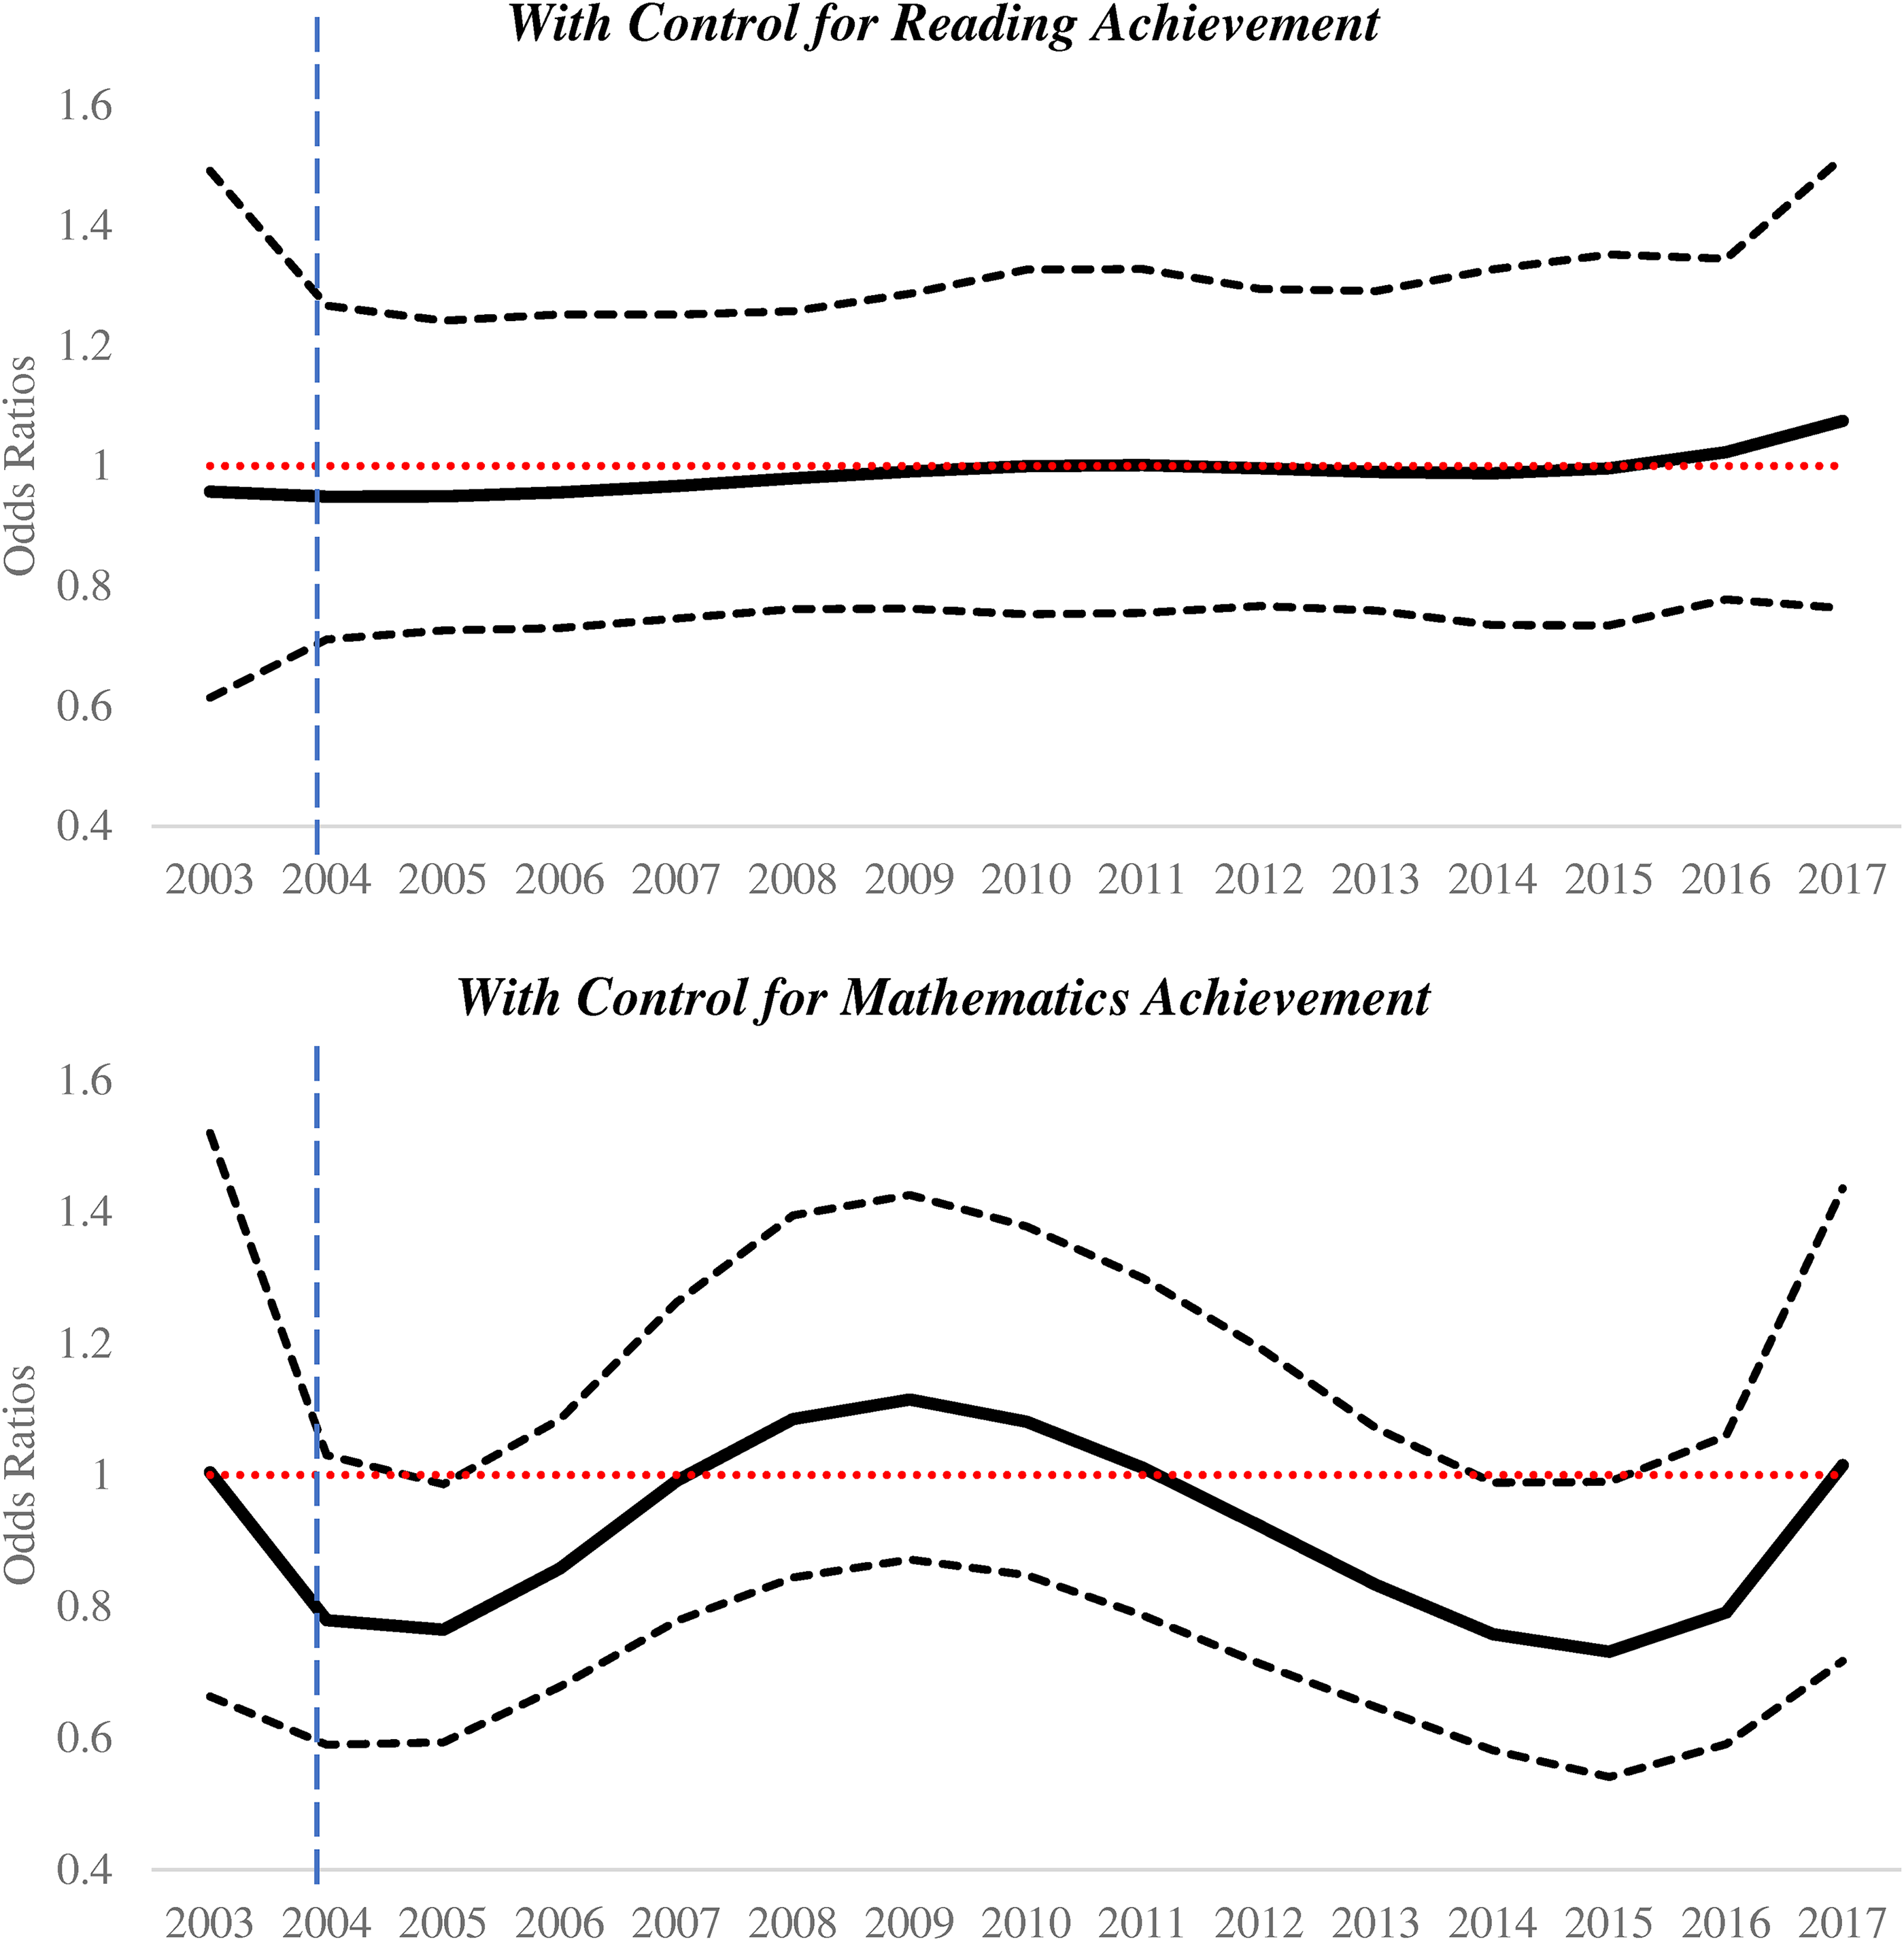
Odds Ratios for Students Who are Hispanic of Having an IEP in Texas Versus the Adjoining States.
ELL Students
Figure 4 displays the time-varying disability identification likelihoods of ELL students in Texas schools relative to similarly situated ELL students attending schools in the adjoining states. In analyses adjusting for reading achievement but not in analyses adjusting for mathematics achievement, ELL students in Texas were initially more likely to be identified as having disabilities. ELL students in Texas were gradually less likely to have an IEP than similarly situated ELL students in the adjoining states. Subsequent under-identification was evident in analyses adjusting for either reading or mathematics achievement. Estimated ORs were statistically significant from 2014 to 2017 in analyses controlling for reading achievement. Estimated ORs for under-identification were statistically significant from 2012 to 2016 in analyses controlling for mathematics achievement. Effect sizes ranged from .61 to .68 and from .58 to .69 in analyses controlling for reading and mathematics achievement, respectively.
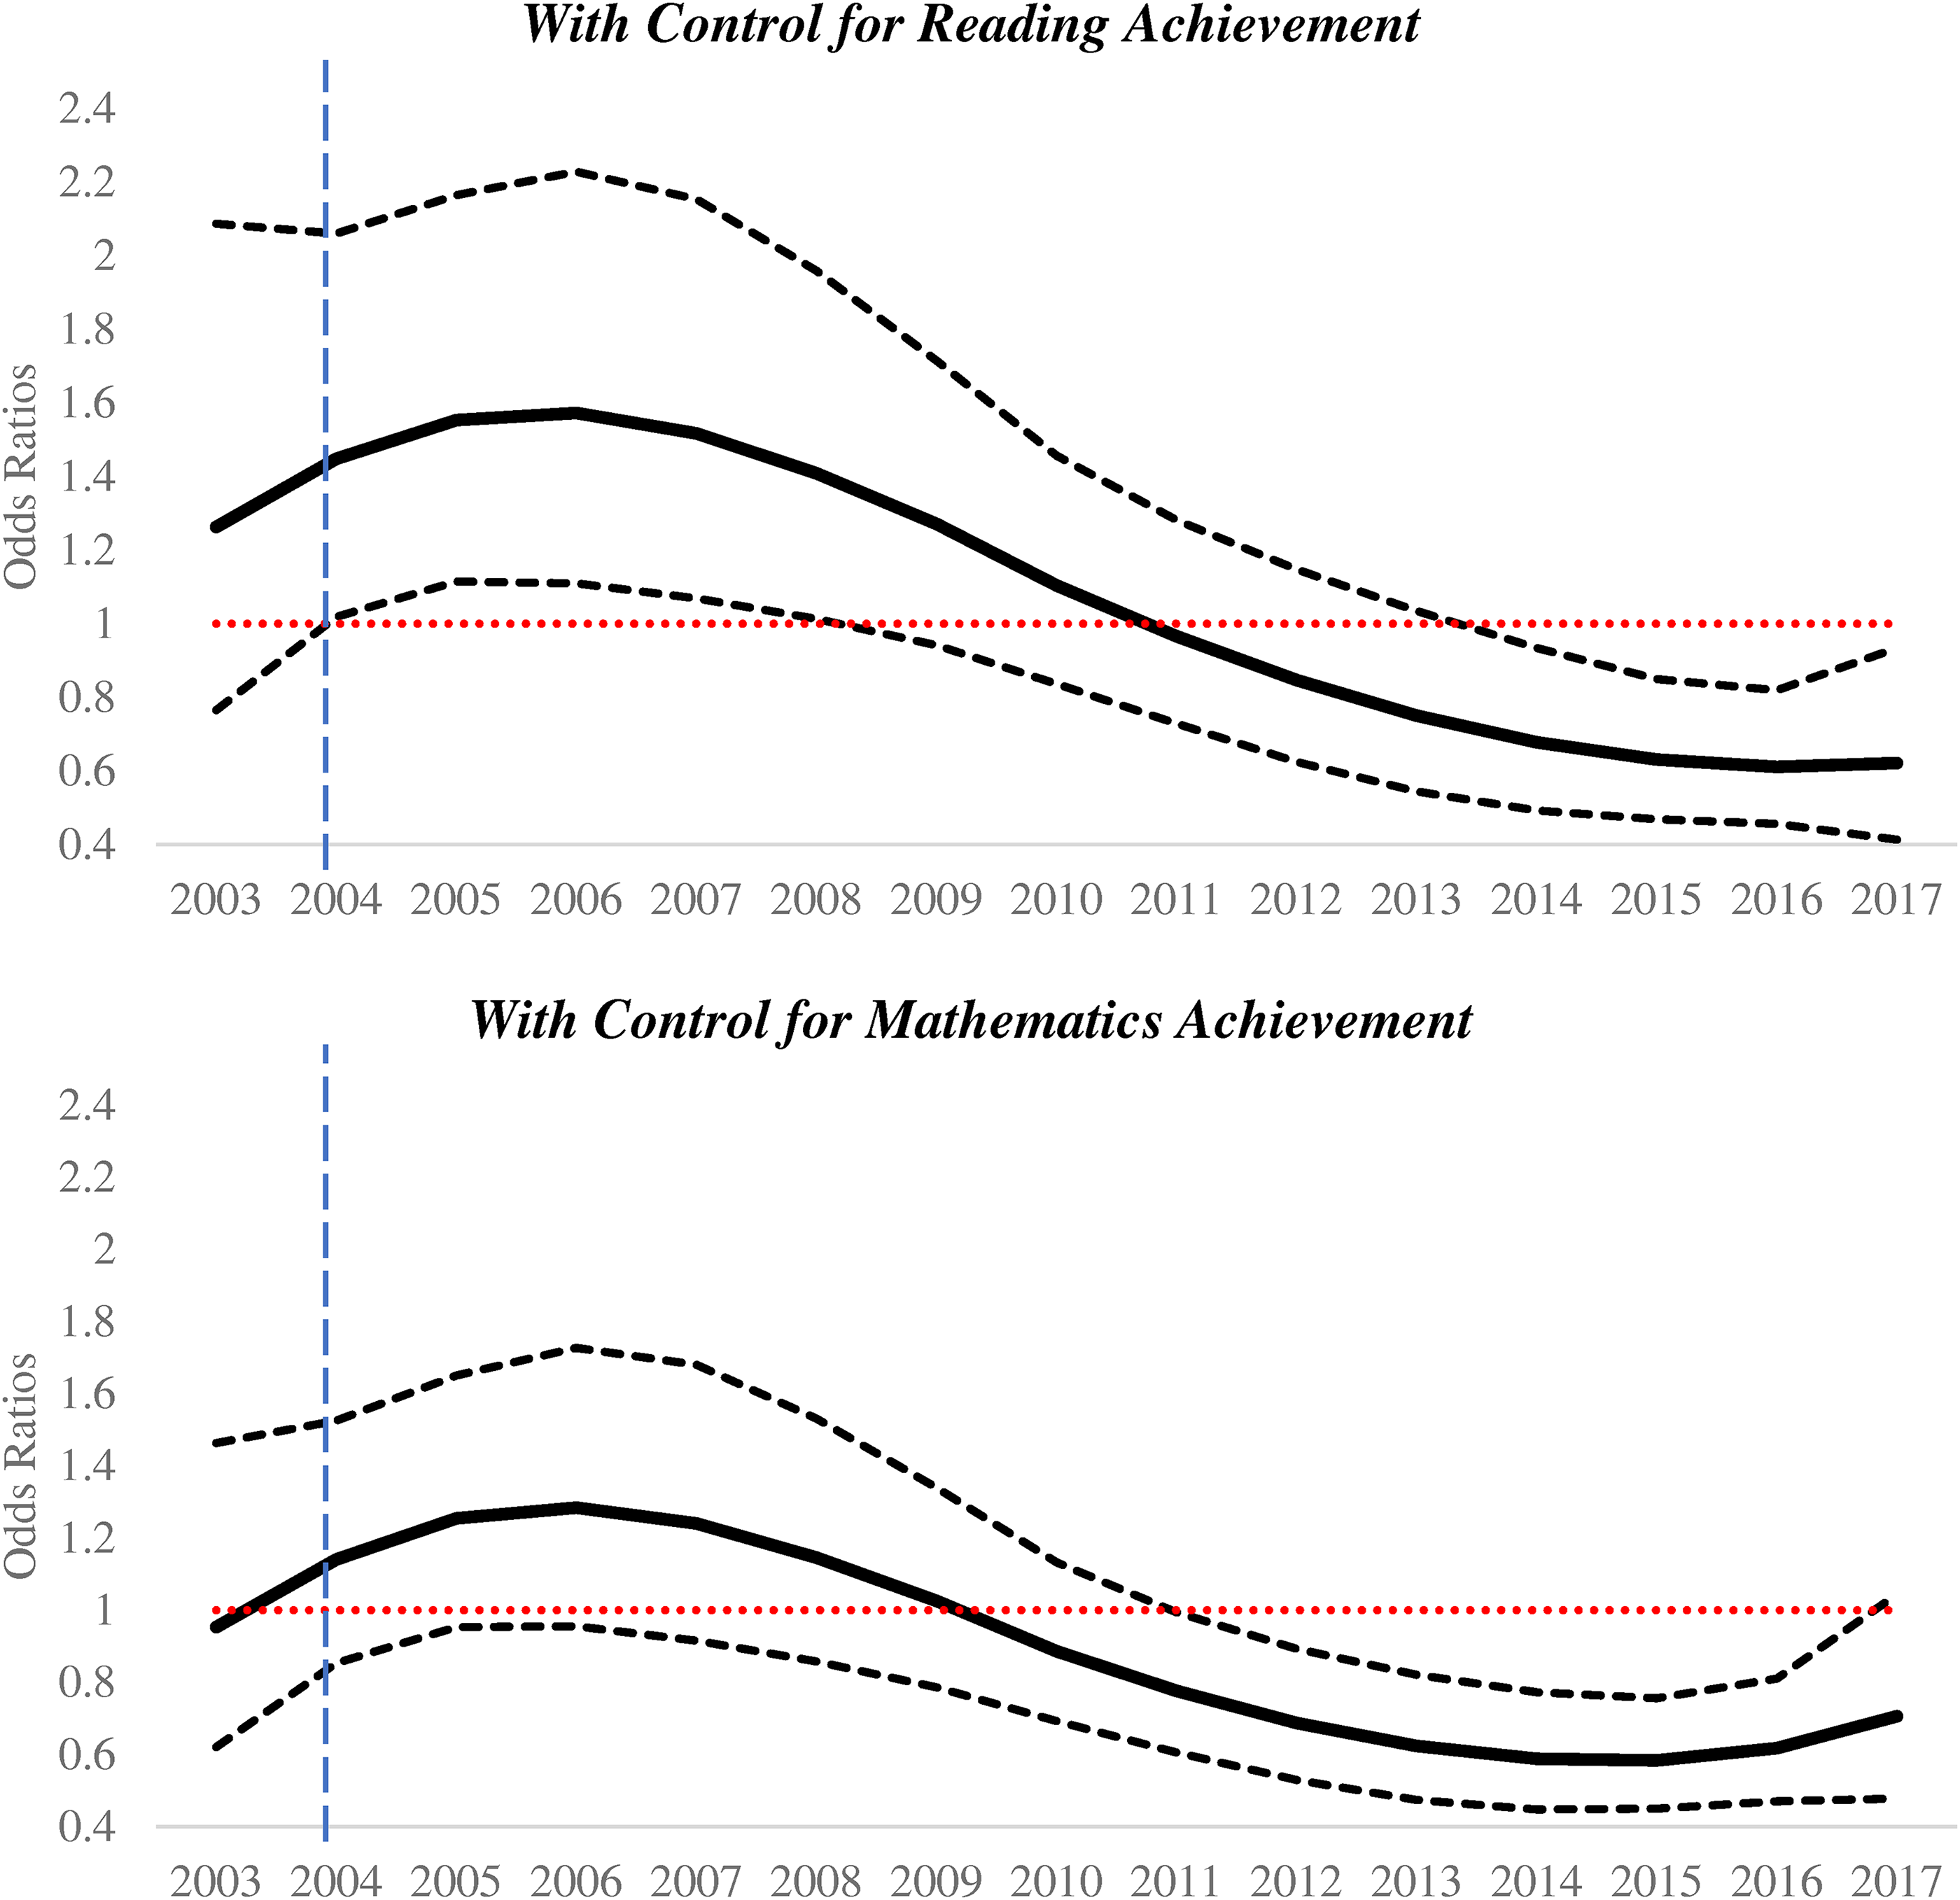
Odds Ratios for Students Who are ELL of Having an IEP in Texas Versus the Adjoining States.
Low-Income Students
Figure 5 displays the time-varying disability identification likelihoods for low-income students attending Texas schools relative to low-income students attending schools in adjoining states. In analyses controlling for reading achievement, low-income students attending Texas schools were significantly less likely initially to have IEPs than low-income students attending schools in the adjoining states before as well as immediately after the TSEC's adoption. Subsequent associations were not statistically significant. Analyses controlling for mathematics achievement were consistently not statistically significant.
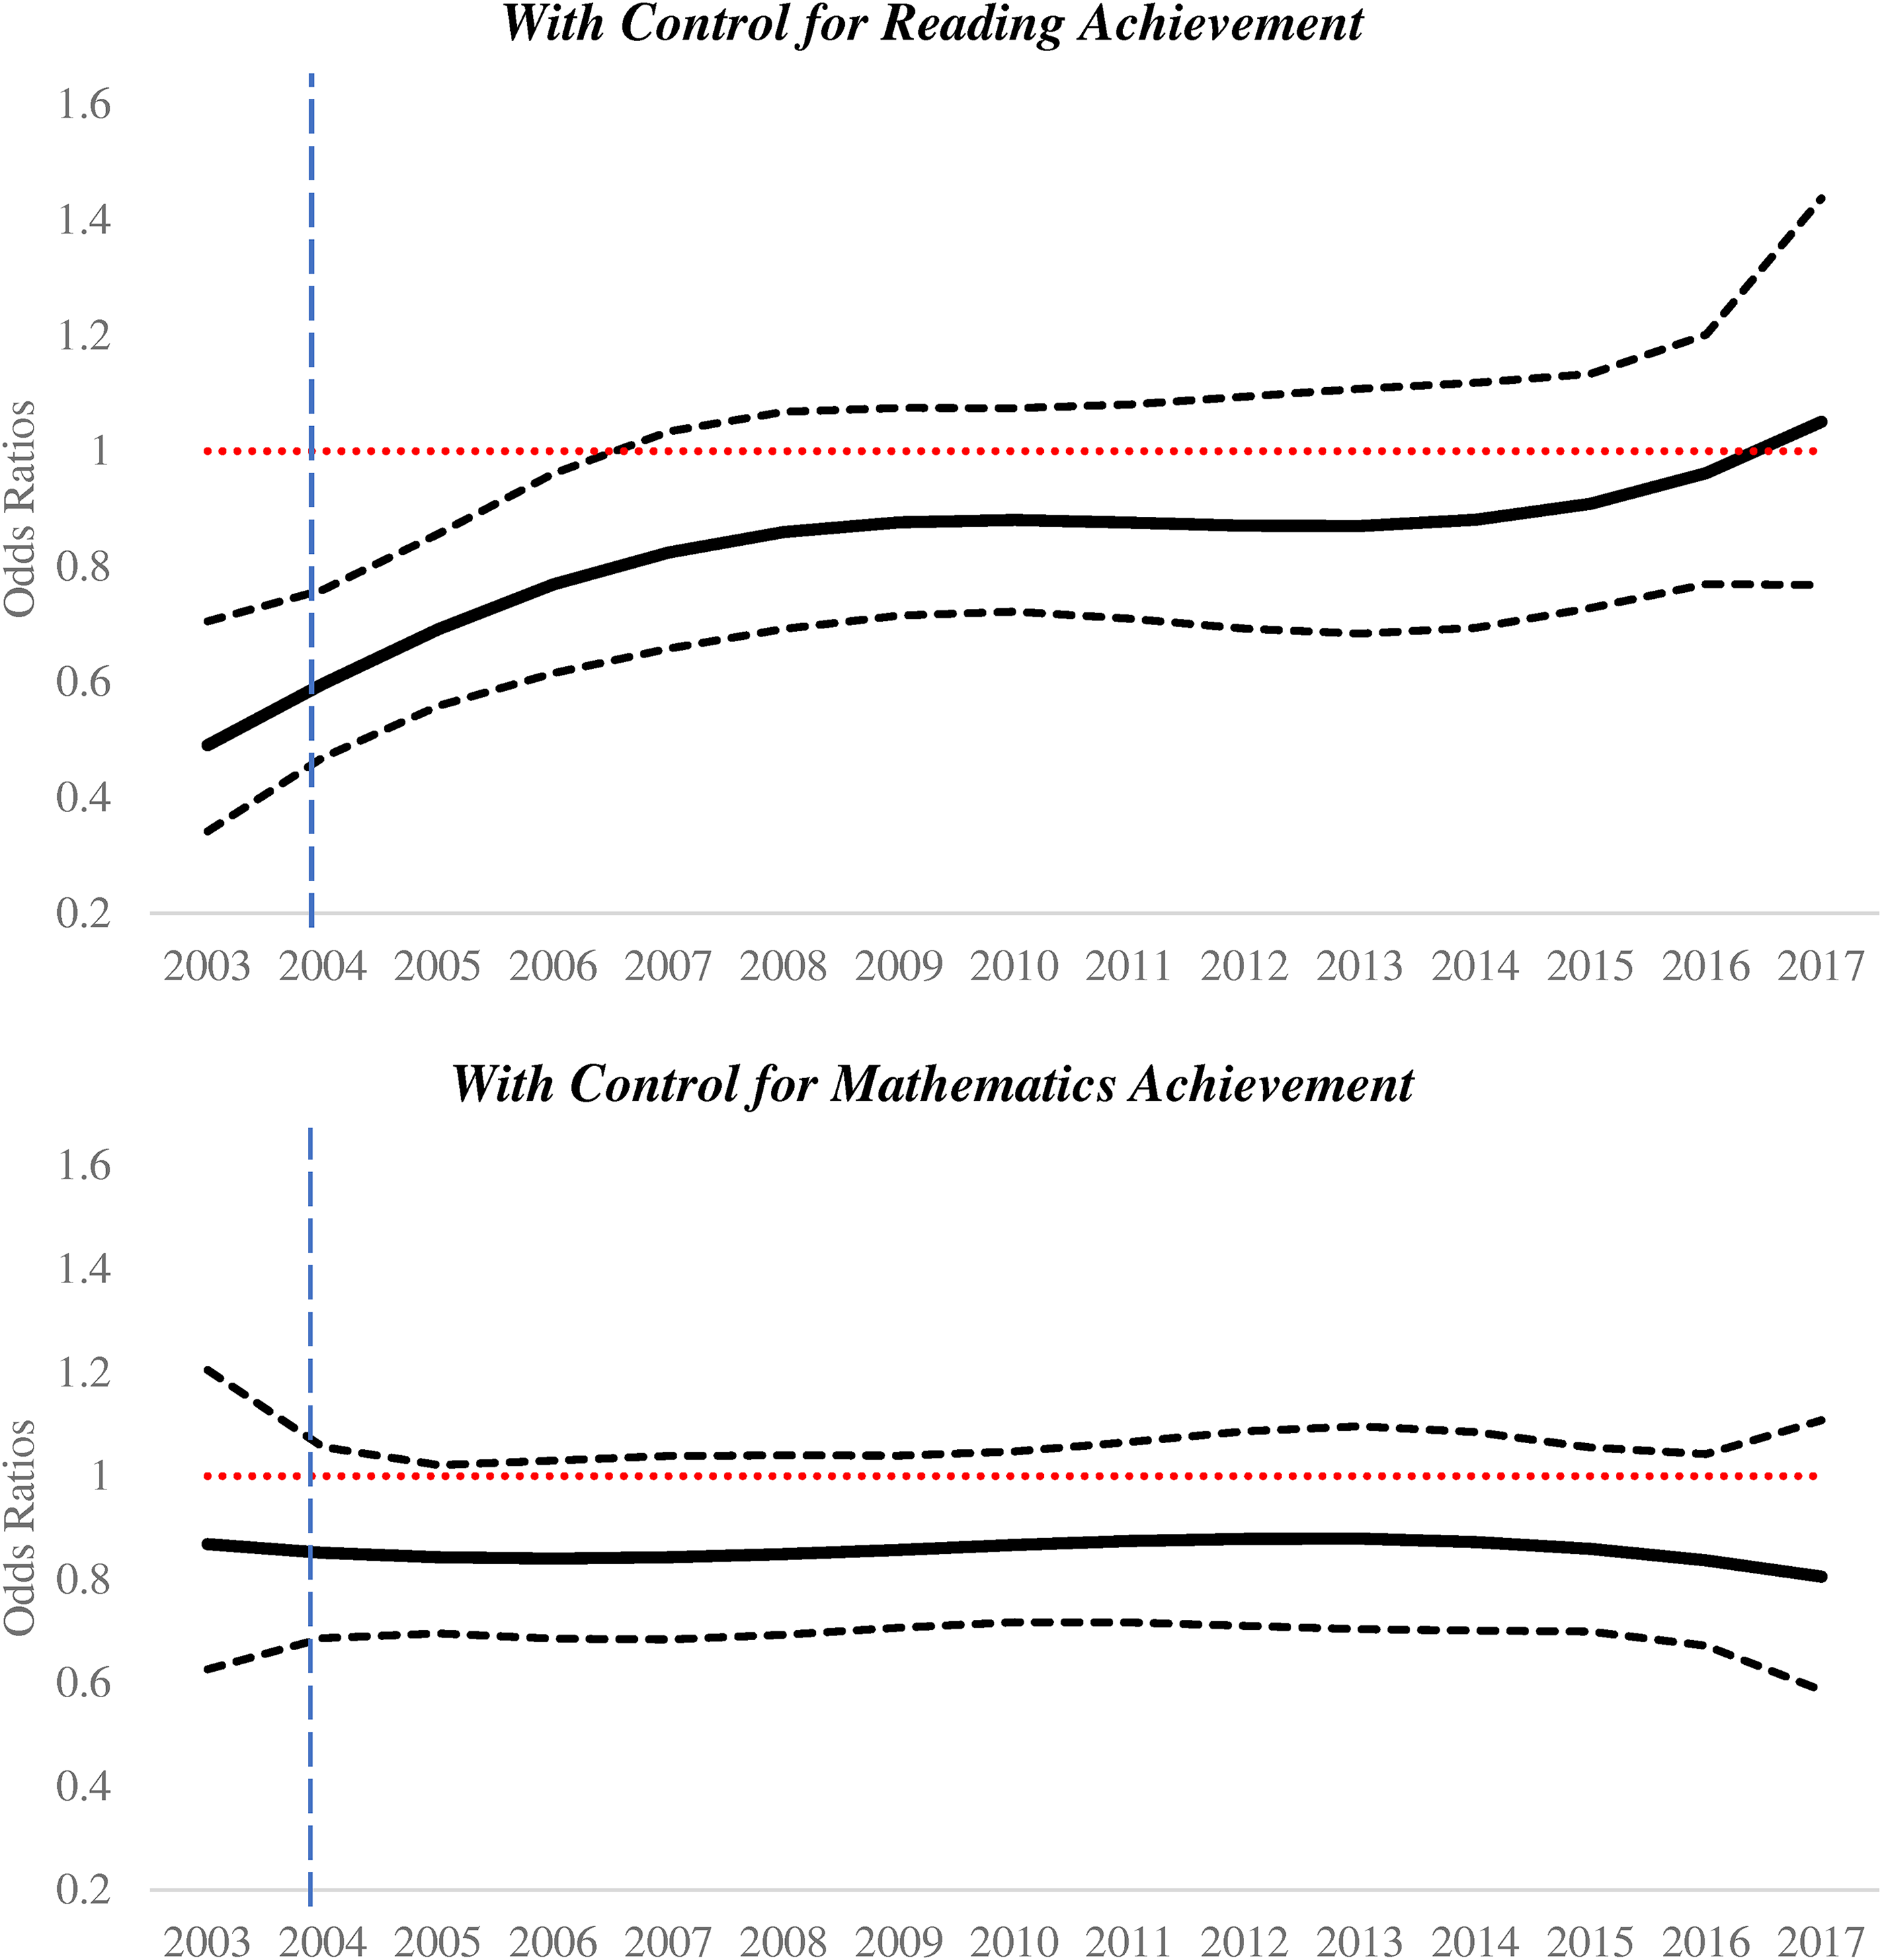
Odds Ratios for Students Who are Receiving Free or Reduced-Price Lunch of Having an IEP in Texas Versus the Adjoining States.
Robustness Checks
We then examined whether our results were robust to different modeling choices. The trend of under-identification was similar for Black and low-income students in Texas relative to similarly situated Black and low-income students in other U.S. states, although the disability identification likelihood disparities were not as large (Supplementary Figures S4 and S7, respectively). Results were similar for students who are Hispanic or ELLs when contrasting students attending Texas schools to students attending schools in the other 49 U.S. states instead of to students attending schools in states adjoining Texas (Supplementary Figures S5 and S6, respectively). Students attending Texas schools may be more like students attending schools in adjoining states and so in the same U.S. region, thereby providing better contrasts than to students from the United States more generally.
We also examined for time-varying likelihoods by specific disability subtype (Supplementary Figures S8–S18). ELL students were initially more likely to be identified as having learning disabilities (LDs) while attending Texas schools, but then became less likely to be identified over time (Supplementary Table S10). Low-income students in Texas were generally less likely to be identified as having LDs except from 2007 to 2013 (Supplementary Table S11). Black students attending Texas schools gradually were less likely to be identified as having either speech language impairments or other health impairments (Supplementary Figures S12 and S16).
We also examined whether results were robust to the inclusion of school-level variables. We first removed the school fixed effects from the models and then added time-invariant fixed effects for the proportion of students in the school that are Black or Hispanic and the total school enrollment. We also added time-varying effects for whether schools were in an urban or rural region relative to suburban regions (Supplementary Figures S19–S20). Texas students in urban or rural schools were initially less likely to be identified as having disabilities relative to students attending urban or rural schools in the adjoining states in analyses adjusting for mathematics achievement. Over-identification of students attending rural schools in Texas relative to rural schools in the adjoining states was briefly evident in 2011 and 2012 but not in other years.
Discussion
We estimated the time-varying likelihoods of disability identification for fourth-grade students attending Texas schools relative to similarly situated fourth-grade students attending elementary schools in the adjoining states from 2003 to 2017, and so across the TSEC's adoption and over-time implementation. We were particularly interested in the TSEC's associations with the disability identification likelihoods of students who are Black, Hispanic, ELLs, or from low-income families. We hypothesized that adoption and implementation of the TEA's pre-specified special education representation indicators was associated with students attending Texas schools including those who are Black, Hispanic, or ELLs being less likely over time to be identified as having disabilities and to receive special education services than similarly situated students of the same race, ethnicity, or language background attending schools in the adjoining states in analyses also controlling for year, age, sex, economic disadvantage, and achievement confounds. We expected these over-time fluctuations to vary across the socio-demographic groups, possibly due to the TSEC's specific emphasis on reducing the special education representation of Black, Hispanic, and ELL students but not low-income students. This is because the TSEC established thresholds for disability identification including for all students generally as well as specifically for students from historically marginalized populations. TEA incentivized schools to meet those thresholds through yearly monitoring procedures and corresponding penalties (Rosenthal, 2016). Adoption of the special education thresholds was partially justified on suggestions that Texas students who are Black or ELLs were being over-identified as having disabilities (Rosenthal, 2016).
We observed that fourth-grade students in Texas were less likely to be identified as having disabilities following adoption and over-time implementation of the TEA's special education representation indicators relative to similarly situated fourth-grade students attending schools in the adjoining states in analyses controlling for reading but not mathematics achievement. Following the TSEC's adoption and implementation, Black and ELL students attending Texas schools were subsequently less likely than similarly situated Black or ELL students attending schools in the adjoining states to be identified as having disabilities. We observed these associations in analyses controlling for reading or mathematics achievement as well as other potential confounds. Contrary to our expectations, we did not observe these associations for Hispanic students. As we expected, associations with low-income status were largely not statistically significant. Our results suggest that the de facto cap's associations with lower disability identification likelihoods were especially evident for Black or ELL students. Consistent with TEA using the PBMAS to incentivize districts to lower their rates of special education enrollment of Black students before ELL students (i.e., with Black and LEP enrollment performance levels set in 2004 and 2006, respectively; TEA, 2021), we observed that under-identification began to occur for Black students attending Texas schools prior to ELL students. Texas schools may have attempted to simultaneously comply with the PBMAS thresholds for Hispanic and ELL students by limiting the disability identification of ELL students.
Strengths and Limitations
Our study has several strengths. Our analyses approximate contrasts between similarly situated students from the same geographic region who were assessed during the same 14-year period, who were of the same sex, grade level, and racial, ethnic, economic, or language background, and who were attending similarly resourced schools. Student-level academic achievement is an especially strong potential confound of disparities in disability identification initially attributable to race, ethnicity, or language background (Donovan & Cross, 2002; Morgan et al., 2017). Region, year, age, biological sex, achievement, and school characteristic confounds including size, urbanicity, and racial composition do not explain our findings. By approximating contrasts between similarly situated students including those of the same sex and grade, who were of the same racial, ethnic, language, and economic backgrounds, and who displayed comparable levels of academic achievement, we provide stronger evidence of differential treatment in disability identification in Texas following the TSEC's adoption and implementation from 2004 to 2017, suggestive of systemic Child Find and FAPE violations occurring specifically within the state (OCR, 2016; OSEP, 2018).
Our sample was very large. Multiyear contrasts between students attending schools in Texas versus attending schools in the adjoining states to investigate the TSEC's over-time associations with lower disability identification likelihoods including for students from historically marginalized communities have been largely unavailable. The study's contrasts provide suggestive evidence that the cap's adoption and implementation may have exacerbated disparities in disability identification attributable to race and national origin (OCR, 2016).
Yet our study also has limitations. We were unable to use an experimental or quasi-experimental design to examine whether the TSEC's adoption and implementation was causally related to over-time changes in disability identification likelihoods including as experienced by students from historically marginalized communities. For example, we were unable to conduct difference-in-difference analyses due to overly small state-specific NAEP sample sizes of Black and ELL students with and without disabilities prior to 2003. Our results are based on regression modeling of repeatedly cross-sectional data and so do not allow for causal inferences. We are only able to report associations between the TSEC's adoption and implementation and the time-varying disability identification likelihoods in analyses adjusting for potential confounds.
We were unable to examine time-varying disability identification likelihoods across multiple years prior to 2003 due to overly small state-specific sample sizes. We therefore cannot report on the time-varying likelihoods across years prior to the TSEC's adoption. The demographic population shares differed between Texas and the adjoining states during this timeframe, particularly for Hispanic students. We are unable to explain the timing inconsistencies of some of the study's findings. For example, statistically significant disparities for Black and ELL students were evident relatively earlier when controlling for mathematics achievement than for reading achievement. A possible explanation of this finding is that mathematics achievement was a relatively more sensitive indicator of disability identification disparities within this specific policy context for some socio-demographic groups. This may have occurred due to Texas educators being more likely to provide struggling students—particularly those from historically marginalized communities—with instructional supports in reading than in mathematics. These findings warrant further investigation including through qualitative studies of school personnel involved in special education evaluation and eligibility decisions during the TSEC's adoption and implementation.
Contributions and Implications
Our study has implications for researchers, practitioners, and policymakers. For researchers, our results replicate and extend results from the few prior studies of the TSEC (Ballis & Heath, 2021b; DeMatthews & Knight, 2019). Our results are consistent with prior work reporting evidence of disparities in disability identification following the TSEC's adoption (Ballis & Heath, 2021a, 2021b; DeMatthews & Knight, 2019). We extend this prior work by showing that potential confounds including student-level academic achievement as well as additional student, family, or school explanatory factors do not consistently explain the disparities. We also found that the TSEC was associated with lower likelihoods of disability identification likelihoods for students from historically marginalized communities. This includes ELL students, a population not examined in prior work (Ballis & Heath, 2021a, 2021b; DeMatthews & Knight, 2019).
For practitioners, our results suggest that Texas students, including those who are Black or ELLs, were especially likely to have unmet educational and health needs resulting from unidentified disabilities following the TSEC's adoption. The additional supports and services made available through the TEA's CAR (TEA, 2018) may need to focus on ensuring that these specific student populations are being appropriately identified and provided with services. Currently, the CAR does not attempt to provide services and supports to socio-demographic populations that may have been disproportionately impacted by the TSEC. Educators and health providers in Texas and the adjoining region should expect students who are Black or ELLs to have been especially unlikely to be identified as having disabilities while attending Texas schools. These students may need additional supports including as provided in educational and health contexts. Recent quasi-experimental work examining the cap's impacts suggests that the resulting lack of access to services lowered the educational attainment of students generally (Ballis & Heath, 2021a). However, Black but not Hispanic students specifically impacted by the PBMAS monitoring of Black and Hispanic special education enrollment displayed small but positive increases in educational attainment (Ballis & Heath, 2021b).
For policymakers, our study provides additional empirical support for federal civil rights investigations (OSEP, 2018) finding that TEA failed to properly comply with IDEA's Child Find requirement and so did not provide SWD attending Texas schools with FAPE. Evidence of the associations between the adoption of the TSEC's special education representation indicators and lower disability identification likelihoods continue to be relevant for federal and state policymakers. As of August, 27, 2021, OSEP considered Texas to be non-compliant with the state's CAR to the U.S. Department of Education's on-site investigation finding that the de facto special education cap violated both IDEA's Child Find and FAPE requirements (Dellinger, 2021; U.S. Department of Education Office of Special Education and Rehabilitative Services [OSERS], 2018, 2020).
Our analyses also provide an example of how federal and state policymakers might use the repeatedly administered NAEP assessments to monitor for possible Child Find and FAPE violations including in Texas as well as other states. For example, federal and state policymakers might use the NAEP to conduct similar analyses that compare Texas students to students attending schools in the adjoining states. This could be done to monitor the extent to which Texas students—including those from historically marginalized communities—are less likely to be identified as having disabilities relative to similarly situated students. The use of TVEM would allow for over-time monitoring of these relative likelihoods and so help establish trends that are unlikely to result simply from chance fluctuation. Such analyses might be especially helpful in ensuring that the TEA is complying with the CAR and so fulfilling IDEA's Child Find and FAPE requirements, including for students from historically marginalized communities.
Federal policymakers might also use the NAEP datasets and TVEM analyses to monitor the extent to which IDEA's Child Find and FAPE requirements are being properly implemented more generally in U.S. schools (see also Farkas et al., 2020; Morgan et al., 2020). Doing so could be used to monitor for whether other states are enacting policies and practices similarly resulting in systemic Child Find and FAPE violations. To our knowledge—and despite the NAEP data being readily available for use by federal policymakers and regulators—the U.S. Department of Education does not independently monitor U.S. schools for over-time trends in disability identification including in analyses adjusted for student achievement or other potential confounds. Currently, the U.S. Department of Education's Office of Civil Rights reactively conducts civil rights investigations after receiving complaints filed by parents, advocacy organizations, or other stakeholders.
Use of the NAEP and TVEM might have resulted in earlier detection of adoption and implementation of the TSEC's special education representation indicators and resulting civil rights violations by federal officials. Instead, federal officials only began to request information from the TEA in 2016 about potential Child Find and FAPE violations following investigative reporting by the Houston Chronicle (OSERS, 2018), and so 12 years after the TEA began implementing the TSEC. By the time OSEP concluded that the TEA was failing to meet IDEA's Child Find and FAPE requirements, many SWDs in Texas had already failed to be appropriately identified and provided with services (OSEP, 2018; Rostenthal, 2016), and had since graduated. These students subsequently displayed lower likelihoods of high school completion and college enrollment, with larger negative effects especially likely to be experienced by those from historically marginalized communities (Ballis & Heath, 2021a). In addition to independently evaluating for Child Find and FAPE violations following the receipt of complaints by parents, advocacy organizations, or stakeholders, the U.S. Department of Education's OSEP and OCR might use the NAEP and TVEM to proactively conduct over-time monitoring of whether disparities in disability identification and special education service receipt are systematically occurring in specific states or localities in the United States.
Supplemental Material
sj-docx-1-ecx-10.1177_00144029221109849 - Supplemental material for Texas Special Education Cap's Associations With Disability Identification Disparities of Racial and Language Minority Students
Supplemental material, sj-docx-1-ecx-10.1177_00144029221109849 for Texas Special Education Cap's Associations With Disability Identification Disparities of Racial and Language Minority Students by Paul L. Morgan, Adrienne D. Woods, Yangyang Wang and Cecelia A. Gloski in Exceptional Children
Footnotes
Acknowledgments
The authors thank Dr. Stephanie Lanza and Dr. Ashley Linden-Carmichael for their methodological expertise and guidance.
Declaration of Conflicting Interests
The authors declared no potential conflicts of interest with respect to the research, authorship, and/or publication of this article.
Funding
The authors disclosed receipt of the following financial support for the research, authorship, and/or publication of this article: This work was supported by the Institute of Education Sciences, Eunice Kennedy Shriver National Institute of Child Health and Human Development, (grant number R324A200166, P2CHD041025).
Supplemental Material
Supplemental material for this article is available online.
Manuscript received September 2021; accepted June 2022.
References
Supplementary Material
Please find the following supplemental material available below.
For Open Access articles published under a Creative Commons License, all supplemental material carries the same license as the article it is associated with.
For non-Open Access articles published, all supplemental material carries a non-exclusive license, and permission requests for re-use of supplemental material or any part of supplemental material shall be sent directly to the copyright owner as specified in the copyright notice associated with the article.