
Abstract
Proportional reasoning is the cornerstone of many higher-level mathematics topics. We evaluated the sustainability effects of schema-based instruction (SBI) on proportional reasoning and the impact of professional development (PD) on the instructional practices of two cohorts of seventh-grade teachers (i.e., SBI-experienced-teacher implementers, who taught SBI in a previous study; SBI-novice-teacher implementers, who taught SBI for the first time with PD) and mathematics outcomes of students with mathematics learning difficulties. SBI was implemented for 6 weeks by 49 teachers in two distal states. Despite the cessation of PD provided to SBI experienced-teacher implementers, teachers in both cohorts demonstrated similar levels of fidelity. Results indicated no SBI experience effect on the immediate and 11-week retention tests of proportional problem solving, on a general measure of problem solving, and on an end-of-year mathematics achievement test, suggesting that the effectiveness of SBI generalizes over time to different cohorts of teachers and students.
The importance of proportional reasoning, which involves understanding the covariance of quantities and invariance of ratios (Fielding-Wells et al., 2014; Lamon, 2007), is evident in the Common Core State Standards for Mathematics (CCSS-M; National Governors Association Center for Best Practices & Council of Chief State School Officers, 2010). To be able to reason proportionally involves the ability to make multiple comparisons in relative terms, which is needed in a range of situations beyond ratio and proportion (Ben-Chaim et al., 2007; Lamon, 1993). The skills needed for proportional reasoning include a highly developed understanding of foundational concepts, such as multiplication and division, fractions, decimals, and scale (Boyer & Levin, 2015; Lamon, 2005). Proportional reasoning, the cornerstone of many higher-level mathematics topics, is also essential in subjects such as science, art, economics, and geography (Hilton & Hilton, 2016; Howe et al., 2011).
Despite the centrality to everyday numeracy and instructional time in middle school focused on proportionality, both students and teachers struggle with proportions (Post et al., 1988; Weiland et al., 2019; Weinberg, 2002) and need support to conceptually reason about proportions (Lamon, 2007). Many teachers’ pedagogical content knowledge (e.g., how to use appropriate representations to develop deep knowledge of multiplicative concepts) is insufficient, and they often experience the same conceptual difficulties as their students (Hilton & Hilton, 2016). Many students’ difficulties in reasoning with proportions may result from the lack of a strong conceptual understanding associated with multiplicative or relative thinking; an overreliance on algorithms like cross-multiplication, which may lead to the correct answer but do not highlight the multiplicative structures in a proportional relationship (Berk et al., 2009; Lobato et al., 2010; Modestou & Gagatsis, 2010); or difficulty distinguishing between proportional and nonproportional situations or treating all relationships as proportional (Fernández et al., 2012; Van Dooren et al., 2005).
In response to these challenges, our work has focused on developing middle school students’ proportional reasoning skills using schema-based instruction (SBI), a fully developed, research-based instructional program that covers the important topics of ratios, proportions, and percent (see Appendix A in the online supplementary materials for scope and sequence of the SBI program). The program builds student understanding of key mathematical concepts, such as ratios, rates, and percent, and promotes connections between related topics, such as fractions and ratios, and articulates differences between additive and multiplicative situations. The SBI program also addresses problem-solving procedures (e.g., priming the underlying problem structure, using visual-schematic representations) for a given class of problems, such as ratio, proportion, and percent of change. The SBI instructional approach for solving word problems has its roots in schema theory (Marshall, 1995), draws on cognitively guided instruction with regard to categorizing problems based on the underlying mathematical structure (Carpenter et al., 2015), and is guided by cognitive models of mathematical problem solving (Mayer, 1999). In this study, we are interested in the sustainability of the impact of the SBI teacher professional development (PD) program on two teacher cohorts’ (SBI-experienced-teacher implementers and SBI-novice-teacher implementers) instruction and the growth of their students with mathematics learning difficulties (MD) on proximal and distal mathematics outcome measures.
Prior Studies on the Effectiveness of SBI and Its Sustainability
Previous studies on proportional reasoning have demonstrated that targeted PD and explicit teaching using the SBI program can assist middle school students with and without MD to solve a wide variety of single and multistep proportion problems (Jitendra et al., 2009, 2011, 2013, 2015, 2019; Jitendra, Dupuis, et al., 2016; Jitendra, Harwell, Dupuis, et al., 2017; Jitendra, Harwell, Karl, et al., 2017; Jitendra & Im, 2019) and can improve students’ general mathematics problem-solving skills (e.g., Jitendra et al., 2015, 2019; Jitendra, Harwell, Karl, et al., 2017). Although teachers may be highly motivated, they are often underprepared to teach using new instructional materials that can pose a range of challenges, such as initial mismatch between principles underlying the innovative approach and teachers’ philosophy of teaching and learning (Obara & Sloan, 2010; Remillard, 2005). However, there is growing evidence that providing educative instructional materials along with PD can change teacher practices to align with the innovation and improve student learning (Schuchardt et al., 2017).
Building on our previous research regarding the effectiveness of SBI, delivered in a variety of settings to heterogeneous samples of students with various mathematical abilities (see Jitendra et al., 2015, 2018, 2019; Jitendra, Harwell, Karl, et al., 2021; Jitendra & Im, 2019), two studies examined the sustainability of the SBI teacher PD program in the achievement of desirable student outcomes and professional practice over time (Jitendra, Harwell, et al., 2016; Jitendra, Harwell, & Im, 2021). An important characteristic of Jitendra, Harwell, et al. (2016) was that mostly rural schools in one state in the upper Midwest participated, producing a sample of students and teachers who were predominantly White. In contrast, Jitendra, Harwell, and Im (2021) used a sample of demographically diverse students in different geographic regions of the country in urban, suburban, and rural schools. In Jitendra, Harwell, et al. (2016) and Jitendra, Harwell, and Im (2021), we invited all teachers who participated in the Year 1 study (Jitendra et al., 2015, 2019) to continue in the study a 2nd year to examine teacher implementation and student learning in classrooms of teachers who received PD and implemented SBI in the previous year and possibly gained more expertise with this method (experienced-teacher implementers, Cohort 1), and teachers implementing SBI for the first time with PD (novice-teacher implementers, Cohort 2).
Teacher PD is vital to implement evidence-based practices so that students can receive high-quality instruction. In Jitendra, Harwell, et al. (2016) and Jitendra, Harwell, and Im (2021), we designed our PD to include the essential features of high-quality PD identified in the research literature: (a) content focus on particular subject content (i.e., ratios, proportions, and percent) and pedagogical practices to support a broad range of learners; (b) coherence with current policy in terms of teaching and learning standards (CCSS-M); (c) collective participation, with teachers working together with colleagues; (d) duration (16 hr), and (e) active learning opportunities to engage in tasks connected to classroom work, such as using strategies to solve problems involving ratios and proportional relationships, reflecting on teachers’ own and their students’ engagement with proportional reasoning (Darling-Hammond et al., 2017; Desimone, 2009). It is important to note that 16 hr of PD is deemed sufficient for intended student learning outcomes (i.e., solving problems involving ratios, proportions, and percent) in the context of access to SBI instructional materials embedded in the subject matter (Schuchardt et al., 2017).
Results of Jitendra, Harwell, et al. (2016) and Jitendra, Harwell, and Im (2021) indicated that both SBI-experienced- and SBI-novice-teacher implementers delivered SBI with similar levels of fidelity. There was no SBI experience effect on the immediate test of proportional problem solving (PPS) in Jitendra, Harwell, et al. (2016). Although there was an SBI experience effect on the immediate test of PPS in Jitendra, Harwell, and Im (2021), with students in SBI-experienced-teacher implementer classrooms outperforming students in SBI-novice-teacher implementer classrooms, this effect was not found on the retention test of PPS, on a general measure of problem solving, or on the end-of-the-year state mathematics achievement (MA) test. In sum, the effect of SBI generalized over time to two distinct cohorts of teachers in that the impact of SBI on student mathematics outcomes was maintained over time without additional PD. These findings contribute to our understanding of the conditions for promoting the sustainability of the SBI teacher PD program: high-quality PD combined with SBI instructional materials. The current study builds on these studies (Jitendra, Harwell, et al., 2016; Jitendra, Harwell, & Im, 2021) to understand whether the SBI experience effect would generalize to impact the mathematics outcomes of students with MD served in inclusive general education classrooms.
The need for evaluations of sustainability of learning innovations such as the SBI program past the implementation of the intervention is crucial to scale up exemplary programs (Koellner et al., 2011). Teachers’ understanding of the principles of coherent learning innovations (e.g., the SBI program) and the benefits for their students when they effectively implement the core components of the innovation are important considerations if programs are to be sustained (Clements et al., 2015). Recent efforts to examine the sustainability effects of teacher PD are based on the understanding that continued use of high-quality PD program components is important to achieve desirable student outcomes (e.g., McMeeking et al., 2012; Polly et al., 2015). Several syntheses of PD research studies elucidate the distinguishing features of effective PD programs, which have guided the design and implementation of high-quality PD programs (e.g., Gersten et al., 2014; Kennedy, 2016). There is evidence that an emphasis on content knowledge; learning opportunities, such as observing expert teachers and examining students’ work; PD’s coherent alignment with the curriculum and standards; PD hours spent on curricular content knowledge and examining students’ work are significant predictors of teachers’ knowledge gain and their change in instructional practice (Copur-Gencturk et al., 2019; Garet et al., 2001).
A review of research on the effectiveness of math professional development approaches highlighted the importance of intensive math content–targeted PD programs (Gersten et al., 2014). Compared with studies implementing general PD approaches, intensive math content–targeted PD studies yielded larger effect sizes on students’ math outcomes. For example, Perry and Lewis (2011) found that when teachers received intensive PD on the topic of measurement interpretation of fractions (i.e., fractions can be represented in a number line), it resulted in significant improvements in students’ fraction knowledge. In short, a growing body of evidence documents that more prescriptive and content-targeted PD leads to better students’ MA test scores than more general and less content-targeted PD (Fryer, 2017; Telese, 2012). As such, the SBI PD program, which provides instructional materials along with PD, focused on targeted content knowledge of ratio and proportional relationships that can help teachers learn content and understand pedagogy (varied strategies to support the learning of a broad range of learners) to improve student outcomes.
Previous research on sustainability of PD programs is limited in that most studies involved small-scale case studies and survey research (e.g., Fishman et al., 2011) or focused primarily on the extent to which teachers retained the changes in their practices rather than the impact on students’ learning outcomes (e.g., Doabler et al., 2018; Liu & Phelps, 2020). Also, the designs of these studies follow two groups of teachers (intervention vs. control) over time (e.g., Antoniou & Kyriakides, 2013; Kutaka et al., 2017; Schuchardt et al., 2017); no study has examined the extent to which high-quality PD (e.g., a program that focused on crucial content, incorporated active learning experiences, and aligned with current teaching and learning standards at the national, state, and district levels) in conjunction with instructional materials was able to produce instructional changes for teachers in a variety of schools and impact the mathematics performance of a broad range of students.
The Current Study
Our research reflects a hierarchy in which we (a) initially assessed the effectiveness of the SBI program for improving mathematics outcomes for a broad population of middle school students, (b) then investigated the sustainability of the SBI program as reflected in the mathematics outcomes of a broad population of middle school students whose teachers participated in PD a year earlier, and (c) are now investigating the SBI program and its sustainability for specific populations of students. The current study is consistent with our focus on the sustainability impact of the SBI teacher PD program, using SBI-experienced-teacher implementers and SBI-novice-teacher implementers, on the mathematics outcomes of a population of students with MD. Specifically, this article reports on the learning outcomes of a subgroup of students with MD taken from Jitendra, Harwell, and Im (2021) after the 1st year of a 2-year study of the SBI program and corresponding PD. To situate the Jitendra, Harwell, and Im study, we review Year 1 of their effectiveness trial (Jitendra et al., 2019). In this experimental study, 41 of 59 seventh-grade teachers were randomly assigned to either the treatment (Cohort 1) condition or control (Cohort 2) condition. The remaining 18 teachers were in a district in which random assignment was done at the school level to minimize its impact on the district’s model of professional learning community at work. One class for each teacher was selected at random to participate in the study. Cohort 1 teachers (j = 34) received 2 days of PD before implementing SBI 5 days a week for approximately 6 weeks to teach PPS involving ratios, proportions, and percent, and Cohort 2 teachers (j = 25) taught the same topics from their district-adopted mathematics textbook. Results indicated that students in SBI classrooms on average outperformed students in control classrooms on proximal and distal measures of mathematics problem solving.
The present study draws on data from Jitendra, Harwell, and Im (2021) that include classroom video recordings of teachers’ instructional practices, assessments of students with MD, and teacher and students surveys of acceptability of SBI. We considered the following questions:
To what extent does implementation fidelity to the core components of the SBI program differ for SBI-experienced-teacher implementers compared with SBI-novice-teacher implementers? Because the current study included teachers who participated in Jitendra, Harwell, and Im (2021) and provided evidence of implementation fidelity, we hypothesized that SBI-experienced-teacher and SBI-novice-teacher implementers would deliver SBI with similar levels of fidelity. To what extent do students with MD of SBI-experienced-teacher implementers differ in their PPS performance on an immediate posttest and on a retention test (11 weeks later) relative to students with MD of SBI-novice-teacher implementers? Given the limited research with students with MD, it is not clear a priori whether students of Cohort 1 teachers would be predicted to score higher than or comparably to students of Cohort 2 teachers on the PPS tests. On the one hand, it may be that students of SBI- experienced-teacher implementers (who may better implement SBI) outperform students of SBI- novice-teacher implementers. On the other hand, SBI-novice-teacher implementers with more proximal PD experience may better implement SBI that would lead to greater student learning. To what extent do students with MD of SBI-experienced-teacher implementers differ in their overall mathematical problem-solving performance and MA relative to students with MD of SBI-novice-teacher implementers? Given that mathematics practices such as SBI need to occur over a long period of time for students with MD to effectively impact transfer of knowledge to a new domain (see Jitendra, Harwell, Karl, et al., 2017), we hypothesized that students of SBI- experienced-teacher implementers would perform similarly to students of SBI-novice-teacher implementers on measures that are broader than the PPS (i.e., assesses achievement in multiple domains). Are there differences in perceptions of teachers and students with MD in the two cohorts with regard to acceptability of SBI? On the basis of previous SBI research for students with MD (e.g., Jitendra, Harwell, Dupuis, et al., 2017), we hypothesized that students’ and teachers’ beliefs about the SBI program would be positive, but the direction of those effects is not clear.
In sum, this study contributes to the knowledge base of the sustainability of the SBI teacher PD program and the impact of support that both SBI instructional materials and the PD program can provide teachers in delivering effective mathematics instruction to improve the learning of students with MD. The results have important implications for the role of the SBI program with students with MD and for the teacher-related resources needed to implement this program.
Method
Project Context
This research draws from a larger sustainability study of SBI involving seventh-grade teachers and their students (see Jitendra, Harwell, & Im, 2021). The SBI research agenda focused on two cohorts of teachers recruited in 2015 from five school districts: two from the western region of the United States and three from the southeastern United States (Jitendra, Harwell, & Im, 2021). Starting dates of implementing SBI were staggered for each cohort, with Cohort 1 beginning in fall 2015 or winter 2016 and Cohort 2 beginning in fall 2016 or winter 2017, based on geographic locations of participating teachers. Jitendra, Harwell, and Im (2021) included 52 teachers: 27 in the SBI-experienced group (Cohort 1), who implemented SBI a second time, and 25 in the SBI-novice group (Cohort 2), who implemented SBI for the first time. Thirty-nine of the 59 seventh-grade teachers who participated in the Year 1 effectiveness trial (Jitendra et al., 2019) returned in Year 2 (Jitendra, Harwell, & Im, 2021). A total of 20 teachers in the Year 1 study, seven from the treatment (SBI) group and 13 from the control group, did not continue after Year 1 due to changes in teaching assignments, in that a teacher no longer taught a typical seventh-grade mathematics class and therefore was not eligible, or due to retirement or family circumstances. The 27 teachers who implemented the SBI program in the Year 1 study and participated in the Year 2 study implemented SBI a second time and represented the treatment group in the current study. We recruited 13 new teachers from the same schools to replace the 13 control group teachers from Year 1 who did not continue so that Cohort 2 in the current study included 25 teachers (12 teachers who returned + 13 new teachers). Thus a total of 27 + 25 = 52 teachers were initially available. However, two classrooms in the southeastern state and one in the western state were excluded because none of the students met our criteria for MD, leaving 26 classrooms in Cohort 1 and 23 in Cohort 2 (total = 49 classrooms). One class for each teacher was selected at random to participate in the study. Teacher participants (Cohort 1 and Cohort 2) were the same across the 2 years, but students in each teacher’s classroom changed from one academic year to the next.
Sample
For this study, all analyzed teacher and student data are taken from Jitendra, Harwell, and Im (2021) to include only data from classrooms serving students with MD. Students were classified as having MD based on end-of-the-year sixth-grade state MA test scores in each state. Achievement levels in the southeastern state were 1 (lowest = inadequate), 2 (below satisfactory), 3 (satisfactory), 4 (above satisfactory), or 5 (highest = mastery). Students whose achievement level was inadequate or below satisfactory (n = 299, 62.6% of the full sample) met the criterion for mathematical difficulties (i.e., low average performance on the state MA test) and were classified as having MD. Precise reasons for the large number of students with MD in the sample are unknown but may be related to characteristics of the state mathematics test used to categorize students as having MD as well as the fact that all sampled schools received Title I assistance. Achievement levels in the western state were 1 (lowest = below proficient), 2 (approaching proficient), 3 (proficient), or 4 (highest = highly proficient). Students whose achievement level was below proficient (n = 375, 39.3% of the full sample) were classified as having MD.
The current study included 49 teachers: 26 in Cohort 1, who implemented SBI a second time, and 23 in Cohort 2, who implemented SBI for the first time. The majority of the sample of seventh-grade students with MD were White (45.6%), with 34.2% Hispanic, 12.4% Black, 3.3% Asian, and 3.4% Multiracial. Teacher and student demographic characteristics by cohort and state are presented in Table 1, which shows the distribution of student background variables was generally similar across the SBI and control conditions in each state.
Summary of Student and Teacher Demographic Information.
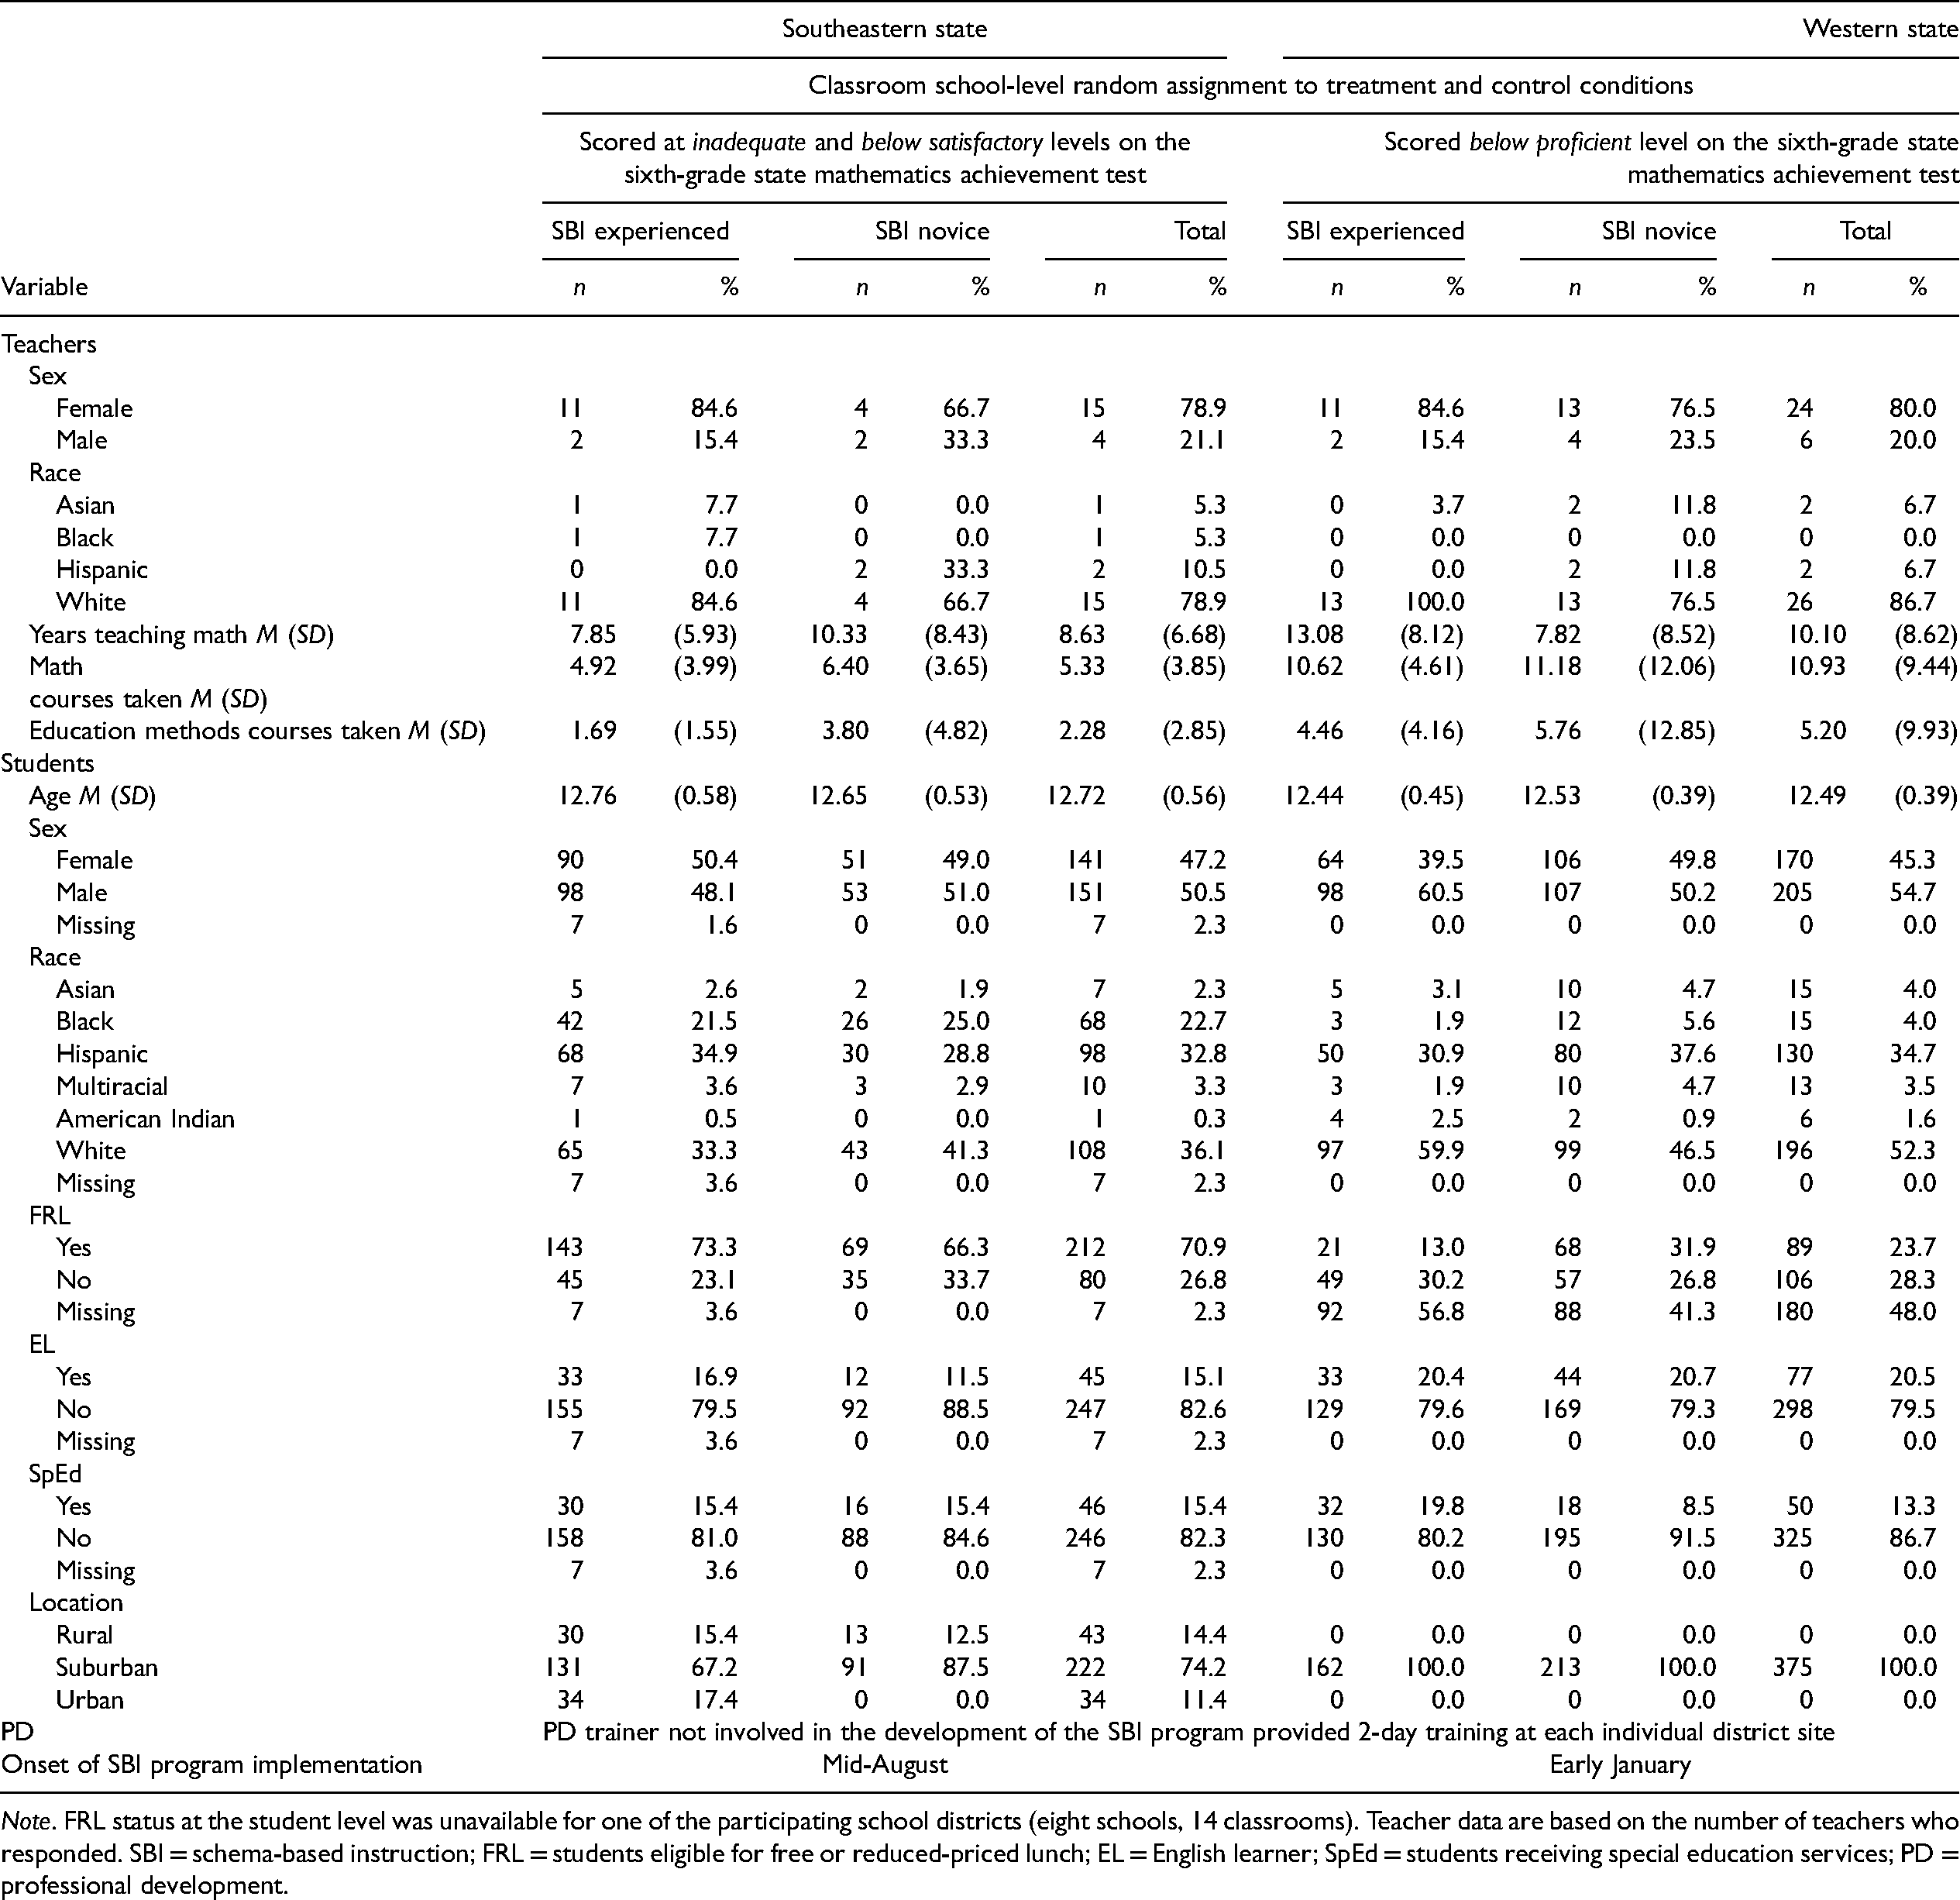
Note. FRL status at the student level was unavailable for one of the participating school districts (eight schools, 14 classrooms). Teacher data are based on the number of teachers who responded. SBI = schema-based instruction; FRL = students eligible for free or reduced-priced lunch; EL = English learner; SpEd = students receiving special education services; PD = professional development.
Procedures
PD. Only Cohort 2 teachers attended PD in the 2nd year of the study, which was conducted over two full school days (i.e., 16 hr) before the start of the study at each site (between August and December 2016). Cohort 1 teachers, who participated in a similar PD (see description of PD that follows) of same duration during the previous year (2015), did not receive additional PD during Year 2 of the study.
PD focused on (a) the importance and complexity of proportional reasoning and of the ways students understand and learn, (b) an orientation to the SBI program, and (c) a discussion of activities in the SBI program and ways in which the teachers might use them in their classrooms. Teachers were afforded opportunities to work with other teachers in pairs or small groups to learn about effective mathematical practices through observation, discussion, practice, and reflection. The PD not only familiarized teachers with the lesson structure and scope and sequence of the SBI program but also discussed ways to set up and manage SBI program materials and differentiate tasks for use with a broad range of learners. Across the 2 days, PD focused on introducing and developing foundational concepts (e.g., ratios, rates, percent), discussing contextual problem solving that included discovering and sorting problems by problem types (ratio, proportion, or percent), representing problems using visual-schematic diagrams, generating “ballpark” estimates (i.e., quick and easy based on benchmark numbers and fractions), and using multiple solution methods to solve problems. Following teachers’ review of lessons in the SBI program, the facilitator debriefed with the teachers to discuss the lessons and resolve any questions they had. Teachers also viewed multiple short video clips of lessons implemented by teachers in previous studies to provide models in implementing SBI approaches.
Description of the SBI program
The SBI program entailed replacement units that targeted ratio and proportion (equivalent ratios, rates, ratio and proportion word problem solving, scale drawings) and percent (percent increase or decrease, including those involving discounts, interest, taxes, and tips). Across the participating schools, teachers used four different textbooks from the following publishers: Big Ideas Learning, Houghton Mifflin Harcourt, McGraw Hill, and Pearson Education. The SBI program supplanted these programs, which ranged from a balanced instructional approach (discovery learning and scaffolded instruction) to digital interactive learning. The core math programs and the SBI program covered the same content and addressed the practices outlined in the CCSS standards. In addition, the instructional practices in the SBI program aligned with the recommendations articulated in the What Works Clearinghouse’s research synthesis on improving students’ mathematical problem-solving performance (Woodward et al., 2012). Our review of instructional features in the four core textbooks suggested that the core math programs do not consistently and extensively overlap with the key components of the SBI program, which emphasized priming the problem structure, using schematic-visual representations, estimating the answer prior to solving it, employing a variety of strategies, and prompting students to reflect on the problem-solving process.
The materials included student workbooks (in class and homework), a teacher’s guide that included detailed teaching scripts, and corresponding PowerPoint slides for teacher presentation, visual-schematic diagrams, and problem-solving checklists. The SBI program, consisting of 21 lessons, could be completed in about 30 days (some lessons could take more than a day to implement), with each lesson designed to be about 45 min in duration, which is the approximate amount of time typically spent on these topics in schools. (For further details of the SBI program, see Jitendra et al., 2019; Jitendra, Harwell, et al., 2016)
Measures
Teacher measures
We collected data about teachers’ perceptions of the PD training at the end of the 2-day PD using the same questionnaire used in Jitendra et al. (2019; Jitendra, Harwell, et al., 2016), which included four items (e.g., would recommend the SBI program to their colleagues) measured on a 4-point Likert scale. The data from this measure complemented the fidelity-of-implementation data by providing an additional source of information regarding teachers’ perception of the innovation.
We evaluated fidelity of implementation by coding classroom videos (two lessons on PPS for each teacher) using the same rubric as Jitendra et al. (2019; Jitendra, Harwell, et al., 2016) to document the presence or absence of key SBI components. Fidelity items (e.g., discovers the problem type, connects the new problem to previously solved problems) were evaluated on a 4-point scale (0 = did not implement to 3 = high level of implementation) (see Figure S1 in Appendix B of the online supplementary materials for the scoring rubric). Fidelity was independently assessed by two of three coders producing 99 ratings (only one lesson was videotaped for one teacher in Cohort 2). We resolved disagreements in ratings through discussion and review of the videotapes. Interrater reliability was estimated by computing intraclass correlations for the ratings, which averaged .90 (range .76 to .96).
The study also elicited teachers’ acceptability of the SBI program by asking them to complete a survey at the end of the study regarding the benefits of the ratio, proportion, and percent diagrams, problem-solving procedures, including focus on multiple solution strategies, and overall benefits of the SBI program (for further details, see Jitendra et al., 2019; Jitendra, Harwell, et al., 2016). Responses were measured using a 4-point rating scale, from 1 (strongly disagree) to 4 (strongly agree). Coefficient alpha for this scale is .90.
Student measures
Students completed the primary measure—the PPS test used in prior studies (see Jitendra et al., 2019, for further details)—at pretest, posttest, and delayed posttest (11 weeks later). The PPS test assessed students’ ability to reason with proportions to solve problems involving ratio, proportion, and percent (see Appendix B in the online supplementary materials for sample items). Interrater reliability, estimated using an intraclass correlation, averaged .89, .92, and .93 at pretest, posttest, and delayed posttest, respectively. The coefficient omega (Dunn et al., 2014) values for the PPS pretest, posttest, and delayed posttest were .50, .73, and .67, respectively.
The secondary measure was the Process and Applications subtest of the GMADE (Pearson, 2004), a general measure of mathematical problem solving, which students completed at pretest and posttest (see Jitendra et al., 2019; Jitendra, Harwell, et al., 2016). The coefficient omega reliabilities were .50 for the pretest and .61 for the posttest.
In addition, the districts provided students’ end-of-year MA data from two different state assessments for use as the study’s tertiary outcome measure. Scaled mathematics scores obtained in spring 2016, when students were in sixth grade served as a pretest, and scaled scores for the same assessment obtained in spring 2017, when the same students were in seventh grade, served as a posttest. The districts also provided student-level information about sex, race, special education, English learner (EL) status, and free and reduced-price lunch (FRL) status.
The study elicited students’ satisfaction with the SBI program (i.e., diagrams and problem-solving procedures) by asking them to complete a survey at the end of the study, which was measured using the same 4-point rating scale as the teacher measure (see Jitendra et al., 2019; Jitendra, Harwell, et al., 2016). Coefficient alpha was .85.
Data Analysis
Research Question 1, which addresses fidelity-of-implementation data, was examined using two-sample t tests to test differences between cohort conditions. Research Questions 2 and 3, which assess differences between Cohort 1 and Cohort 2 classrooms to address the impact of SBI primarily at the student level, was examined using a series of multilevel (i.e., two-level, students-within-classrooms) models with predictors at both levels using the HLM 8 software (Raudenbush et al., 2019). Outcome variables were the PPS posttest, PPS delayed posttest, and the GMADE posttest, and each was analyzed separately (i.e., all analyses were based on cross-sectional data). Single-level analyses of the end-of-year state MA data were also performed, and analyses that did not use multilevel models used α = .05 for each statistical test.
For each outcome, the Level 1 (student) model contained the predictors sex (0 = male, 1 = female) and race (Black = 1, Hispanic = 1, Asian = 1, and Multiracial = 1, with White = 0 serving as the reference group, for a total of four predictors capturing race), and for all outcomes, the pretest served as a student-level control variable.
Level 2 (teacher and classroom) variables included the treatment variable (1=SBI-experienced, 0=SBI-novice), a teacher variable (i.e., years of experience teaching mathematics), and variables capturing the percent of students per classroom for ELs, eligibility for FRL, and special education status. The coarse and discontinuous nature of the distributions of the classroom percents for the EL, FRL, and special education variables prompted us to rescale these variables to better capture the pattern in these data. Accordingly, these three variables were transformed to quartiles (i.e., 0 = lowest concentration of ELs, FRL, or special education students in a classroom, 3 = highest concentration). The rescaled versions of these variables were used as classroom predictors.
Slopes capturing the impact of the student predictors on the outcome variables were found to be statistically equal across classrooms. Thus our analyses of the impact of cohort on student PPS are based on intercept-only models. Residuals from the fitted models were examined for evidence of violations to model assumptions of normality, homoscedasticity, and linearity, and no major violations were found. To control for compounding of Type I error rates, we used the Dunn-Bonferroni correction in which an overall error rate of α = .15 was divided among all tests of fixed effects linked to each outcome variable. We assigned .05 to the test of the cohort effect, because this was the most important effect in the model, and divided the remaining .10 equally among tests of the remaining effects, producing α = .10/11 = .009 per test. For the analyses reported later, all available data were used.
Research Question 4, which addresses the acceptability of SBI program data at the teacher and student levels, was examined using two-sample t tests. For all analyses, data were analyzed separately for each state (j = 19 and 30 classrooms for the southeastern and western state, respectively), given that the state-administered MA test and screening criteria for MD were different in the southeastern and western states.
Results
We initially performed a series of descriptive analyses that included examining the correlations among all measures and exploring preexisting differences between Cohort 1 and Cohort 2 classrooms in each state. Results of these analyses showed the correlations between the PPS pretest and posttest, pretest and delayed posttest, and posttest and delayed posttest were .47, .47, and .64, respectively, in the southeastern state and .40, .36, and .54, respectively, in the western state. The correlation between the GMADE pretest and posttest was .40 in the southeastern state and .32 in the western state. The correlation between sixth- and seventh-grade MA was .68 in the southeastern state and .48 in the western state. Correlations among the PPS, GMADE, and MA tests ranged from .34 to .68 across time points in the southeastern state and ranged from .26 to .67 across time points in the western state. The p values for all these correlation coefficients were less than .001 (see Table S1 in Appendix B of the online supplementary materials).
Table 2 provides descriptive statistics for each outcome measure by cohort and state. On the PPS and GMADE pretests, there were no significant differences between cohorts (|ts| < 1.84, p values > .068), except for the PPS pretest scores in the southeastern state showing that Cohort 2 classrooms performed better than Cohort 1 classrooms, M = 9.31 versus 8.37, t(197) = −2.39, p = .017, but the difference was quite small (1.9% of the variance in the PPS pretest due to cohort). On the sixth-grade state MA test, there were no significant differences between cohorts in the two states (|ts| < .40, p values > .692), suggesting that student performance in the two cohorts was similar at baseline.
Descriptive Statistics for Student Measures by Cohort.
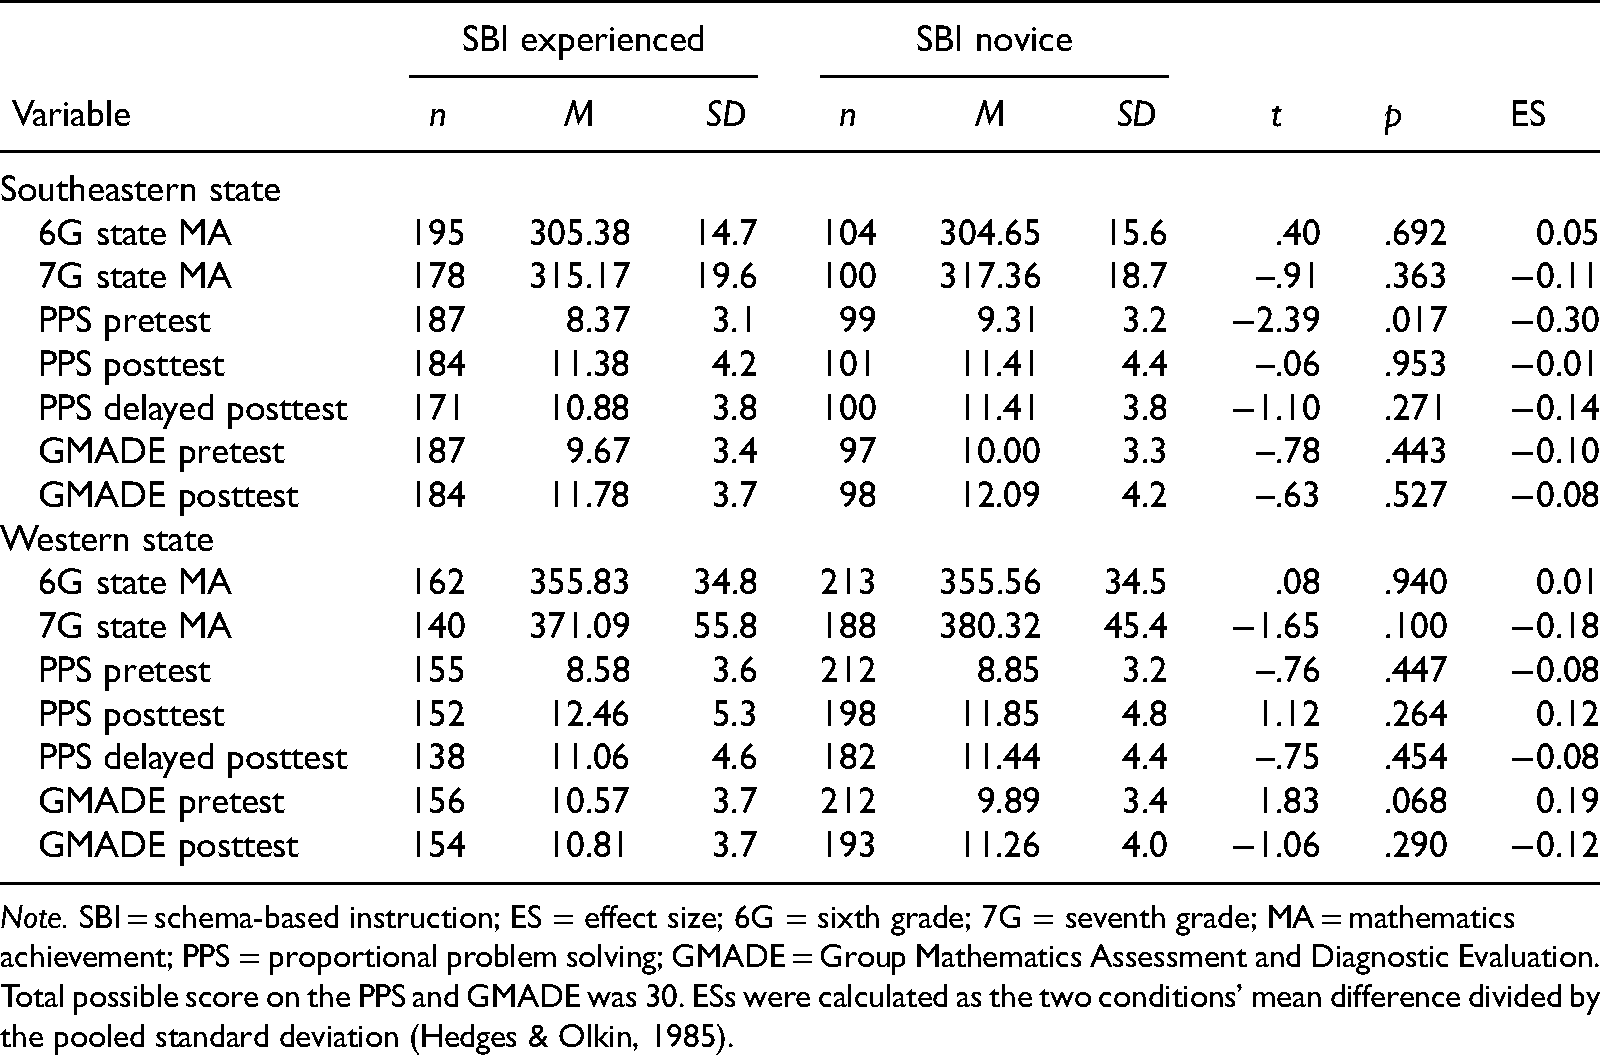
Note. SBI = schema-based instruction; ES = effect size; 6G = sixth grade; 7G = seventh grade; MA = mathematics achievement; PPS = proportional problem solving; GMADE = Group Mathematics Assessment and Diagnostic Evaluation. Total possible score on the PPS and GMADE was 30. ESs were calculated as the two conditions’ mean difference divided by the pooled standard deviation (Hedges & Olkin, 1985).
Influence of the SBI PD Program on Teachers’ Fidelity of Implementation
Regarding Research Question 1, results indicated no statistically significant differences between cohorts on the total score: southeastern, t(17) = –.32, p = .757; western, t(28) = −1.07, p = .293; and all individual items: southeastern, |ts| < .84, p values > .418; western, |ts| < 1.17, p values > .254 (see Table S2 in Appendix B of the online supplementary materials). For the southeastern state, the mean total score across the seven items on the fidelity checklist was 14.58 (SD = 2.43) for SBI-experienced teachers and 14.25 (SD = 0.94) for SBI-novice teachers out of a possible 21 points (higher scores are consistent with greater fidelity). For the western state, the mean total fidelity-of-implementation score was 14.69 (SD = 3.46) for SBI-experienced teachers and 15.85 (SD = 2.48) for SBI-novice teachers.
Impact of the SBI PD Program on Students’ Performance on the PPS Test
Tables 3 through 5 report the results of fitting a two-level multilevel model to each outcome measure that speak to the second research question. On the PPS posttest, cohort was not a significant predictor in both states, meaning that, given the model, students with MD on average performed the same on proportional reasoning: southeastern, γ01 = –.82, t(13) = –.94, p = .365; western, γ01 = −1.22, t(24) = −1.14, p = .264. Among the other predictors, Asian and PPS pretest scores were significant predictors of PPS posttest scores in both states. The results indicated that on average, Asian students scored 3.76 and 3.60 higher than White students in the southeastern, γ20 = 3.76, t(243) = 2.70, p = .007, g = 1.02 SD, and western state, γ20 = 3.60, t(306) = 3.00, p = .003, g = 0.83 SD, respectively. The significant pretest predictor indicates that each one-unit increase in the PPS pretest was associated with a 0.58 and 0.51 expected increase on the PPS posttest in the southeastern, γ60 = .58, t(243) = 8.28, p < .001, g = 0.16 SD, and western state, γ60 = .51, t(306) = 7.04, p < .001, g = 0.12 SD, respectively.
HLM Results for PPS Posttest.
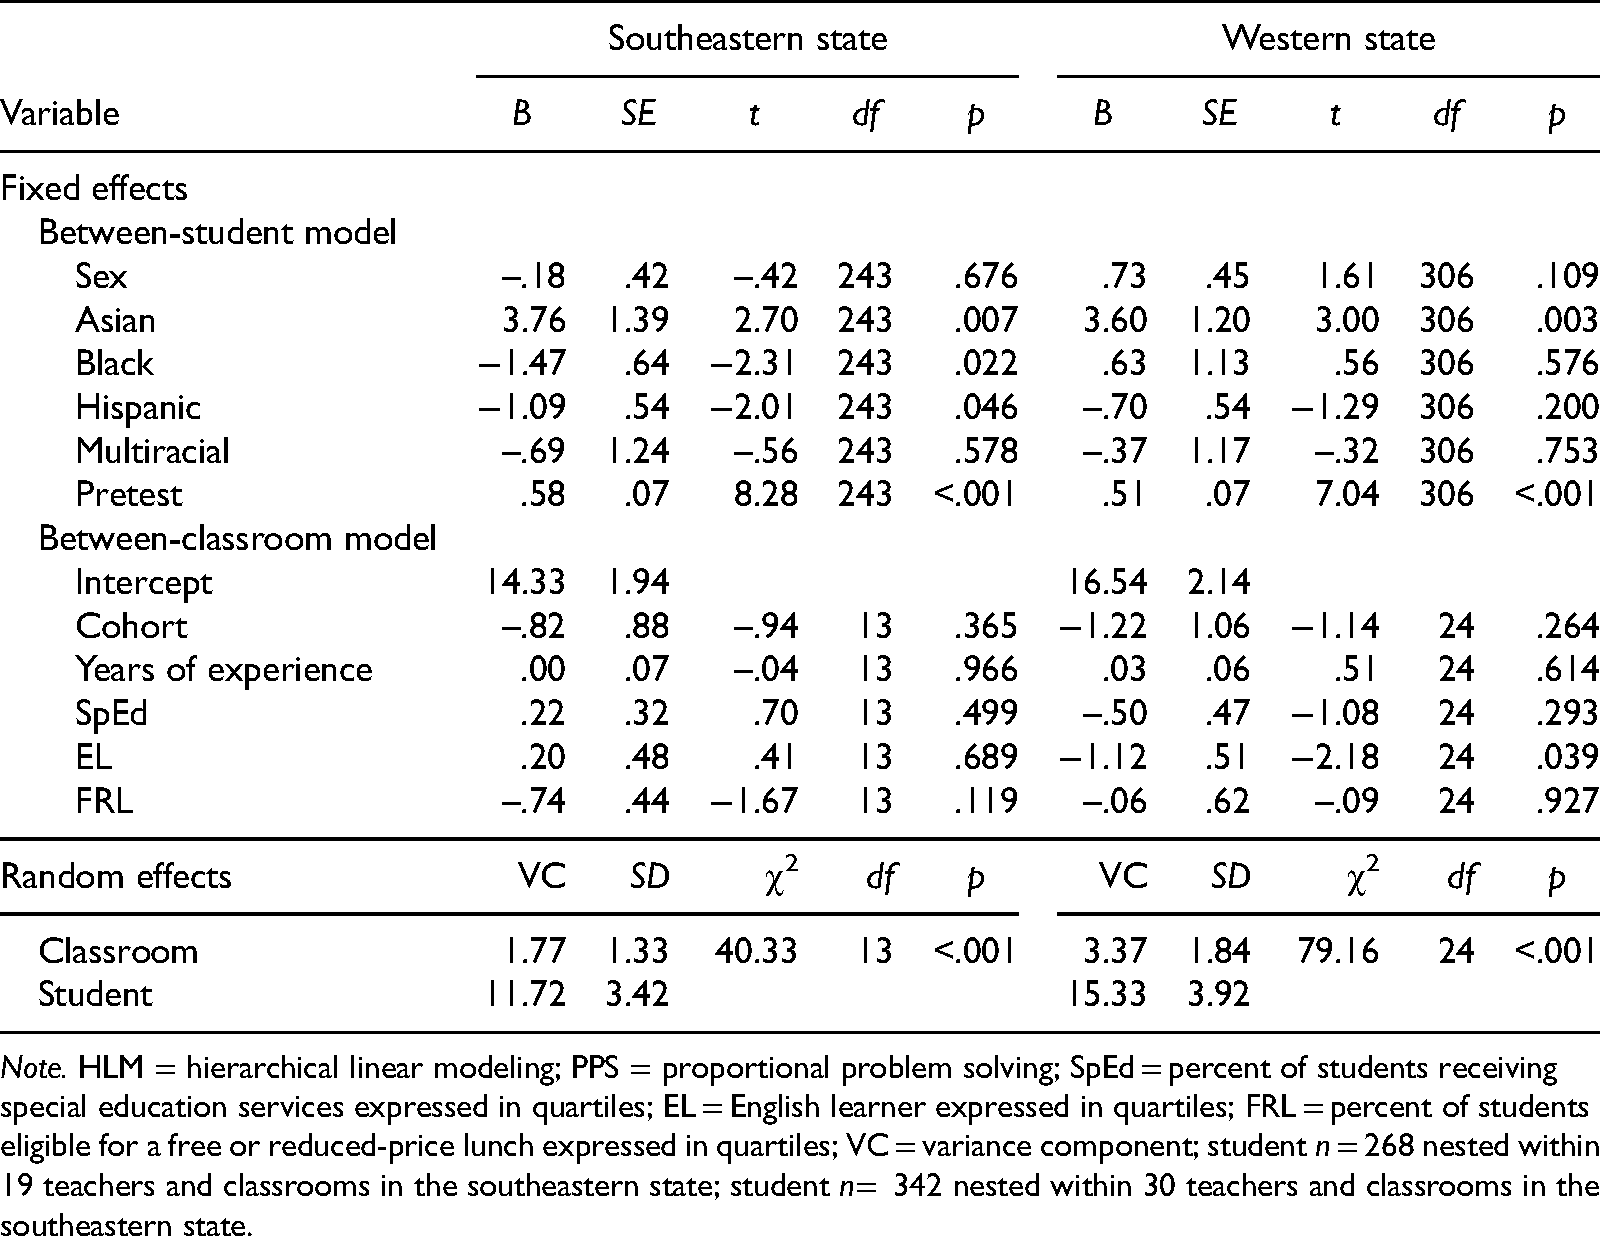
Note. HLM = hierarchical linear modeling; PPS = proportional problem solving; SpEd = percent of students receiving special education services expressed in quartiles; EL = English learner expressed in quartiles; FRL = percent of students eligible for a free or reduced-price lunch expressed in quartiles; VC = variance component; student n = 268 nested within 19 teachers and classrooms in the southeastern state; student n= 342 nested within 30 teachers and classrooms in the southeastern state.
HLM Results for PPS Delayed Posttest.
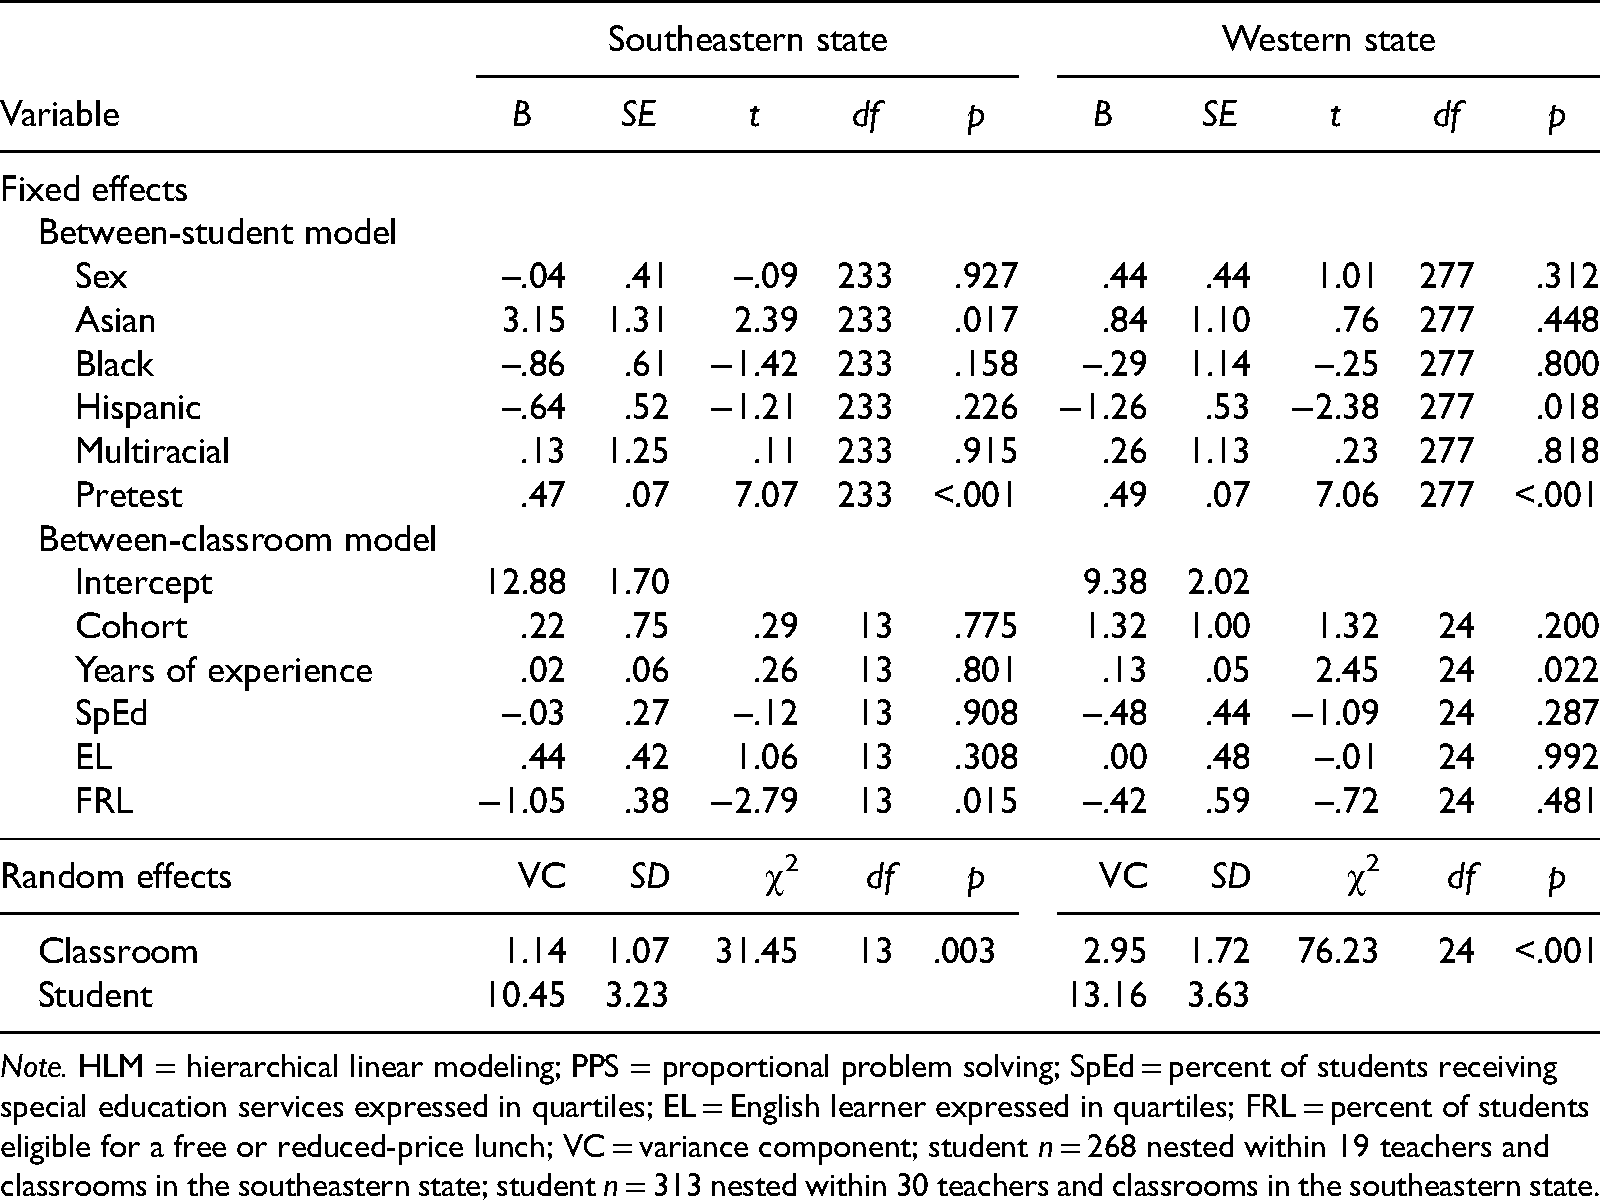
Note. HLM = hierarchical linear modeling; PPS = proportional problem solving; SpEd = percent of students receiving special education services expressed in quartiles; EL = English learner expressed in quartiles; FRL = percent of students eligible for a free or reduced-price lunch; VC = variance component; student n = 268 nested within 19 teachers and classrooms in the southeastern state; student n = 313 nested within 30 teachers and classrooms in the southeastern state.
HLM results for GMADE Posttest.
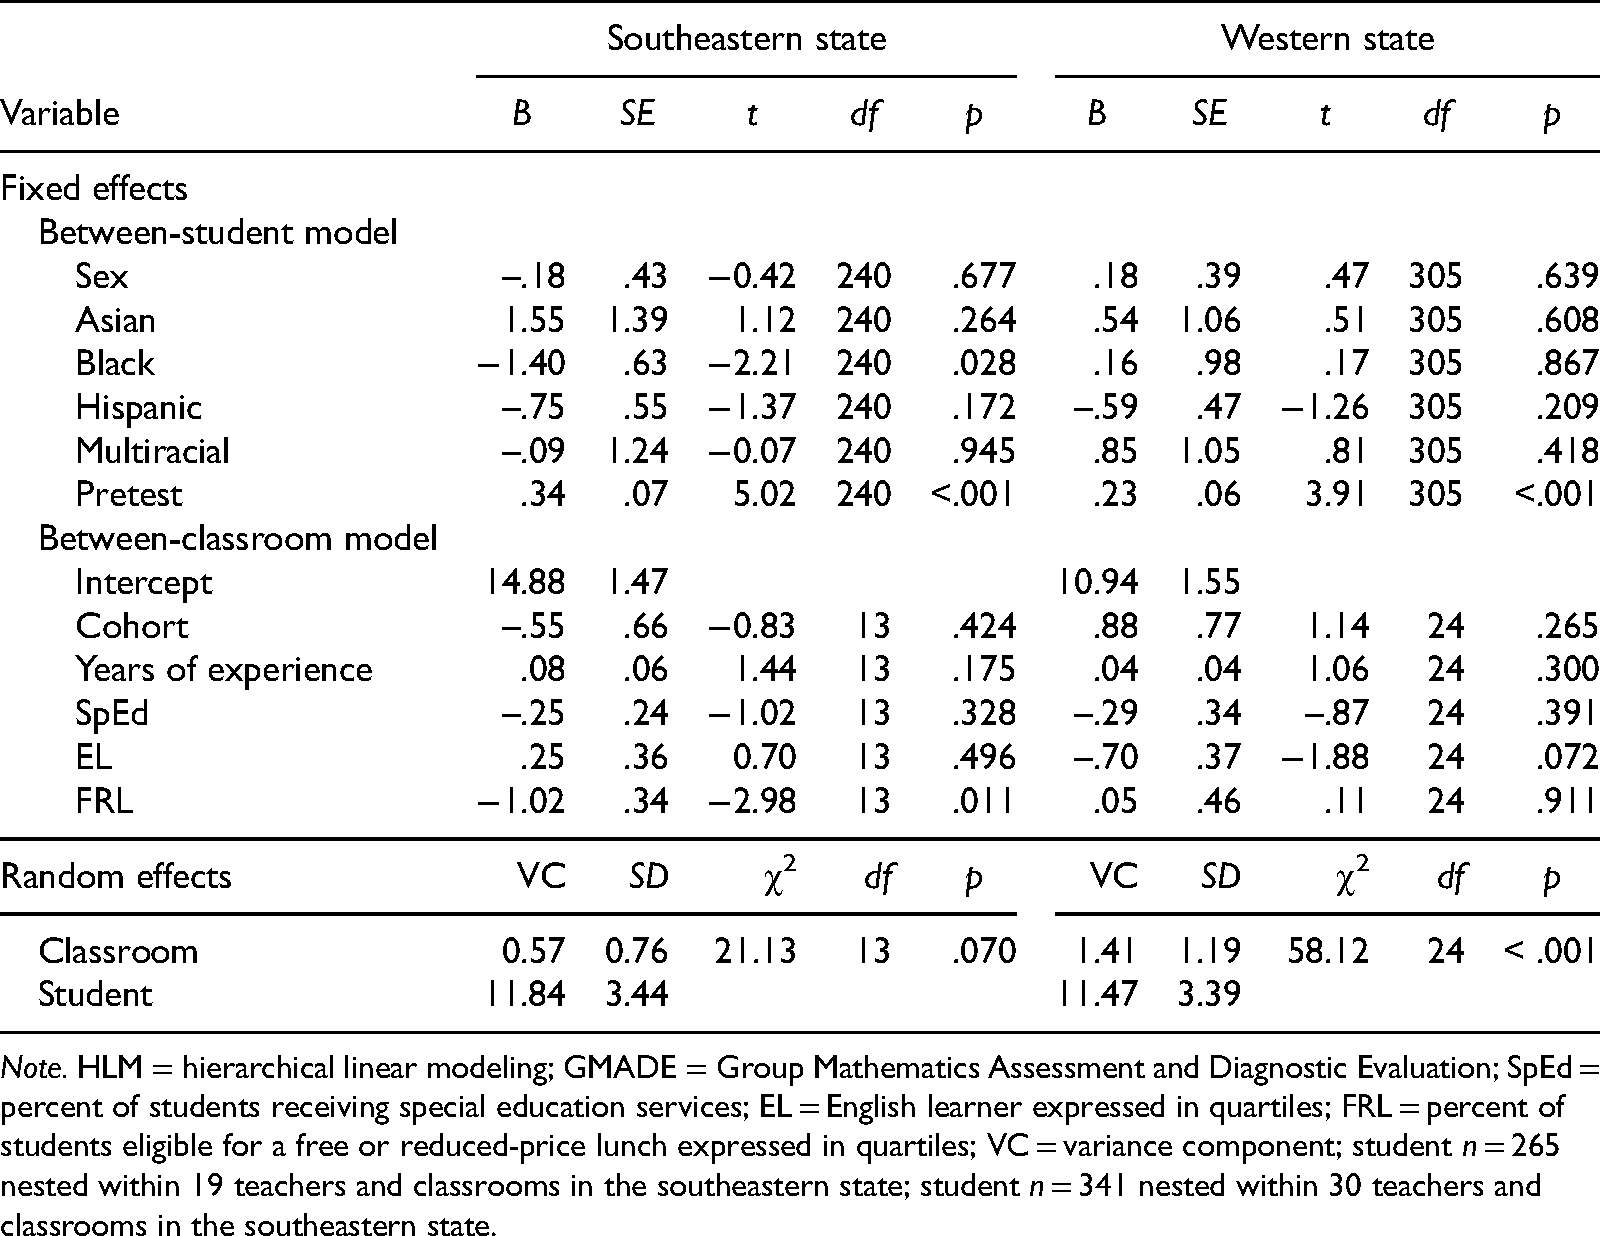
Note. HLM = hierarchical linear modeling; GMADE = Group Mathematics Assessment and Diagnostic Evaluation; SpEd = percent of students receiving special education services; EL = English learner expressed in quartiles; FRL = percent of students eligible for a free or reduced-price lunch expressed in quartiles; VC = variance component; student n = 265 nested within 19 teachers and classrooms in the southeastern state; student n = 341 nested within 30 teachers and classrooms in the southeastern state.
On the PPS delayed posttest, cohort was not a significant predictor in both states, meaning that, given the model, students with MD on average performed the same on proportional reasoning regardless of condition: southeastern, γ01 = .22, t(13) = .29, p = .775; western, γ01 = 1.32, t(24) = 1.32, p = .200. The only significant predictor was PPS pretest scores in both states: southeastern, γ60 = .47, t(233) = 7.07, p < .001, g = 0.14 SD; western, γ60 = .40, t(277) = 7.06, p < .001, g = 0.12 SD.
Impact of the SBI PD Program on Students’ Performance on the GMADE and End-of-Year State Achievement Test
On the GMADE posttest, multilevel analyses showed that again, cohort was not a significant predictor in both states: southeastern, γ01 = –.55, t(13) = –.83, p = .424; western, γ01 = .88, t(24) = 1.14, p = .265. This suggests that students with MD on average performed the same on general mathematics problem solving regardless of whether their teacher was an SBI-experienced- or SBI-novice-teacher implementer. Among the other predictors, the pretest score was the only significant predictor of GMADE posttest scores in both states: southeastern, γ60 = .34, t(240) = 5.02, p < .001, g = 0.10 SD; western, γ60 = .23, t(305) = 3.91, p < .001, g = 0.06 SD.
On the end-of-year state MA test, a single-level regression analysis based on the sample of students was performed to examine differences in students’ MA outcome between cohorts above and beyond students’ demographic and background variables and their previous year’s (spring 2016) MA test scores. Across states, results indicated that cohort was not a significant predictor (southeastern, standardized β = .05, p = .288; western, standardized β = –.08 p = .274), suggesting that students with MD on average performed the same on the outcome regardless of whether their teacher was part of Cohort 1 or Cohort 2 (see Table S3 in Appendix B of the online supplementary materials for further details about our regression analyses).
Analysis of end-of-year MA level data. We also compared the distribution of end-of-year MA level in the two cohort conditions by conducting a chi-square test to address the practical implications of the effects of the SBI program. Recall that in the southeastern state, we distinguished two subsamples of students with MD based on previous year’s MA level: inadequate (nSBI-experienced = 100, nSBI-novice = 51) and below satisfactory (nSBI-experienced = 78, nSBI-novice = 49). Results comparing the distribution of end-of-year MA level revealed no significant differences between the two cohort conditions in the southeastern state: inadequate, χ2(2) = .23, p = .890; below satisfactory, χ2(4) = 5.35, p = .253. As seen in the left and middle panels of Figure 1, the percent of students with MD in the inadequate group who showed improvement in their MA level was 36.0% in Cohort 1 classrooms and 35.3% in Cohort 2 classrooms, χ2(1) = .01, p = .936. Of these, 8% of students in Cohort 1 classrooms and 6% in Cohort 2 classrooms shifted into the no-risk categories by the end of the school year. The percent of students with MD in the below-satisfactory group that shifted into the no-risk categories by the end of the school year was 50% in Cohort 1 classrooms and 46.9% in Cohort 2 classrooms, χ2(1) = .12, p = .728. However, slightly more students in Cohort 2 classrooms (24.5%) than in Cohort 1 classrooms (14.1%) who scored in the below-satisfactory category scored sufficiently poorly at the end of the year to fall into the inadequate category, although this result was not statistically significant, χ2(1) = 2.19, p = .139.
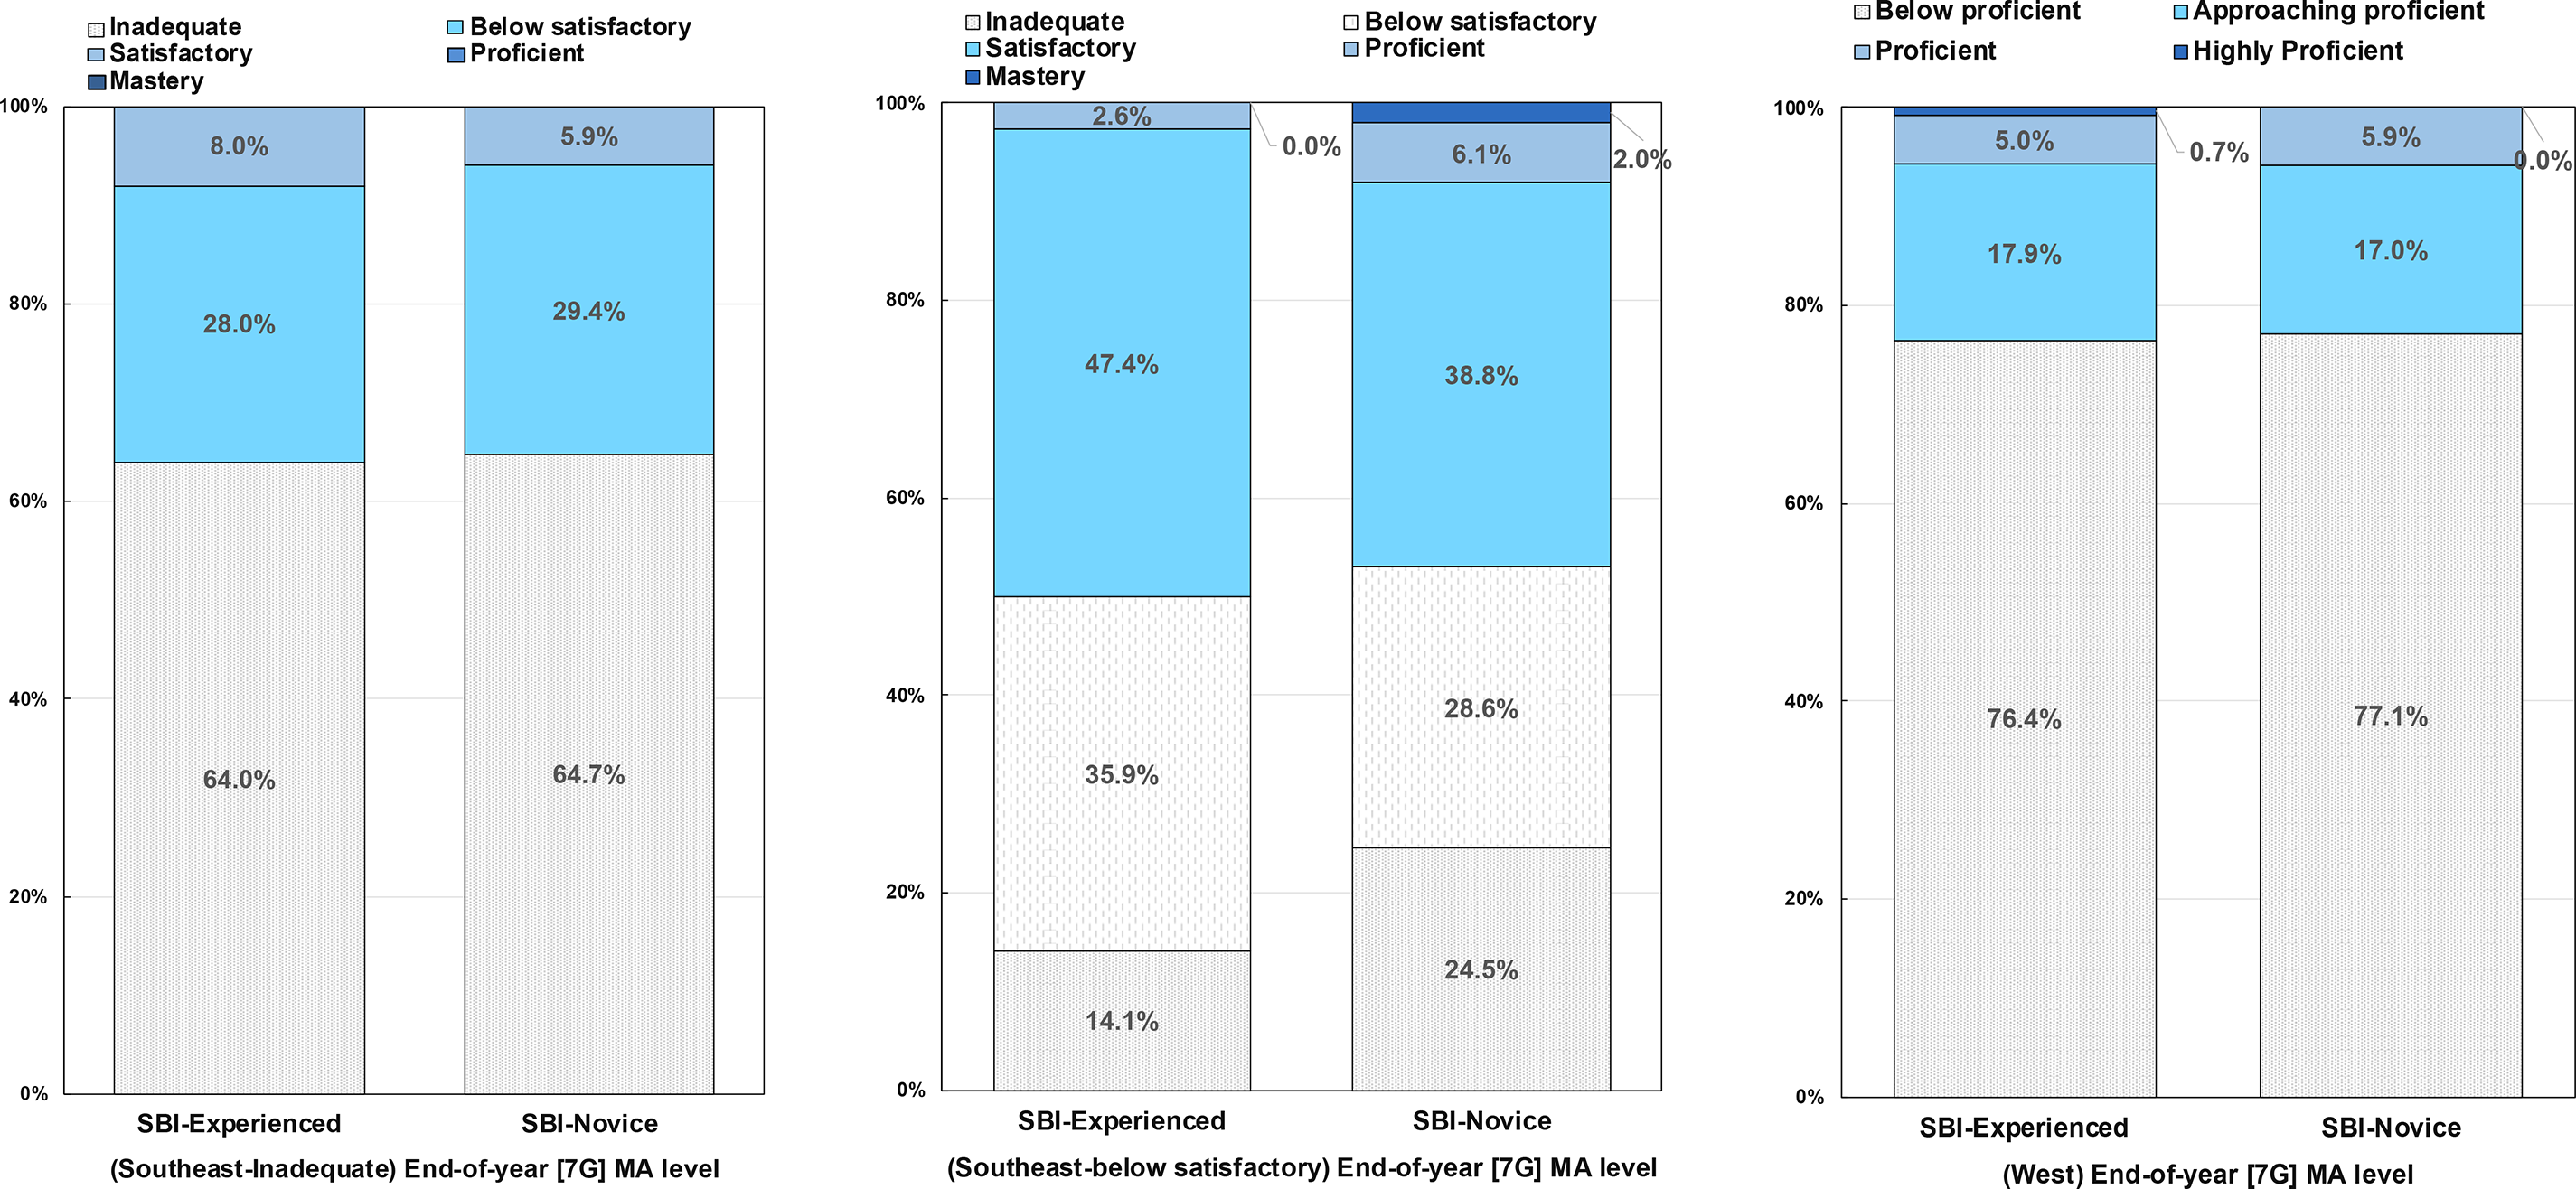
End-of-year (seventh grade) state mathematics achievement level by cohort (schema-based instruction [SBI]-experienced vs. SBI-novice). The left panel shows the distribution of students with mathematics learning difficulties (MD) in the southeastern state that scored at the inadequate level on the previous year’s state mathematics achievement (MA) test. The middle panel shows the distribution of students with MD in the southeastern state that scored below satisfactory on the previous year’s state MA test. The right panel shows the distribution of students with MD in the western state that scored below proficient level on the previous year’s state MA test. Blue-colored portions of the percent bars represent the percent of students who showed improvement in their MA level compared with their previous year’s performance.
Results for the subsample of students categorized as below proficient (nSBI-experienced = 140, nSBI-novice = 188) in the western state also revealed no significant differences between the two cohort conditions, χ2(3) = 1.49, p = .685. As seen in the right panel of Figure 1, the percent of students who showed improvement in their MA level and shifted into the no-risk categories by the end of the school year were 23.6% in Cohort 1 classrooms and 22.9% in Cohort 2 classrooms, χ2(1) = .02, p = .881. Taken together, these findings suggest that students with MD in both states benefited from SBI regardless of whether their teacher was SBI experienced or SBI novice.
Influence of the SBI PD Program on Teacher and Student Satisfaction
Tables S4 and S5 in Appendix B of the online supplementary materials present results of teachers’ and students’ satisfaction data. With regard to teachers’ perceptions about the SBI program and components, there were no significant differences between cohorts in both states: southeastern, t(17) = –.50, p = .627; western: t(28) = −.60, p = .557; on the total mean score and all individual items: southeastern, |ts| < 1.01, p values > .337; western, |ts| < 1.54, p values >.135. In the southeastern state, the mean scores across the 22 items were 3.47 (SD = .31) for SBI-experienced teachers and 3.54 (SD = .33) for SBI-novice teachers; in the western state, the mean scores were 3.32 (SD = .31) for SBI-experienced teachers and 3.41 (SD = .47) for SBI-novice teachers. Descriptive evidence suggested that both Cohort 1 and Cohort 2 teachers were positive in their comments about SBI program and resources.
Regarding student satisfaction with SBI, there was no statistically significant difference between cohorts on the total mean score in the two states: southeastern, t(266) = 1.93, p = .055; western, t(329) = .60, p = .550. In the southeastern state, the mean score across the nine items on the survey was 2.87 (SD = .59) for Cohort 1 classrooms and 2.72 (SD = .68) for Cohort 2 classrooms. In the western state, the mean score was 2.85 (SD = .59) for Cohort 1 classrooms and 2.81 (SD = .65) for Cohort 2 classrooms. However, results for both states indicated a statistically significant difference between cohorts on the individual item related to the use of schematic diagrams: southeastern, t(153) = 2.52, p = .013; western, t(329) = 1.99, p = .047, with Cohort 1 classrooms (southeastern, M = 3.06, SD = .62; western, M = 3.12, SD = .62) scoring higher than Cohort 2 classrooms (southeastern, M = 2.83, SD = .74; western, M = 2.97, SD = .69).
Discussion
Longitudinal evaluation is important because successful scale-up of interventions requires consistency over long periods of time to be cost-effective. This study provides a novel contribution to the literature by empirically examining the extent to which SBI-experienced teachers (Cohort 1) demonstrate sustained implementation fidelity to the core components of the SBI program 1 year past the end of the study without continued project support on the learning outcomes of students with MD, compared with learning outcomes of students with MD in classrooms of SBI-novice teachers (Cohort 2), who taught SBI for the first time with PD. Supporting existing studies (Jitendra, Harwell, et al., 2016; Jitendra, Harwell, & Im, 2021) that provided high-quality PD focused on proportional reasoning along with contextual support (e.g., instructional materials that support teachers in developing students’ proportional reasoning skills), both cohorts demonstrated similar levels of fidelity to the underlying program (Research Question 1), suggesting that the math content–targeted high-quality PD in these studies positively influenced teachers’ implementation of the PD practices in the classroom (cf. Copur-Gencturk et al., 2019; Schuchardt et al., 2017). Recall that we designed our SBI instructional materials (e.g., diagrams to highlight the mathematical structure of problems) to explicitly support teachers working with a broad range of learners. Alternatively, the sustainability effects of teacher PD may be related to Cohort 1 teachers’ perceived utility of the SBI program and their students’ learning gain (cf. Clements et al., 2015; Fishman et al., 2011, Klingner et al., 2001).
Regarding Question 2, results indicated cohort was not a significant predictor of the PPS posttest and delayed PPS posttest, suggesting that student learning was on average the same regardless of whether a teacher was an SBI-experienced or SBI-novice implementer. Consistent with the findings of Jitendra, Harwell, et al. (2016), our data indicated no evidence to support advantaged outcomes for students in either SBI-experienced- or SBI-novice-teacher implementers’ classrooms, which contrasts somewhat with Jitendra, Harwell, and Im (2021), who found significant differences between Cohort 1 and Cohort 2 classrooms on the PPS posttest, with students in Cohort 1 classrooms scoring higher than students in Cohort 2 classrooms. It is worth noting that Jitendra, Harwell, et al. (2016) provided PD to 42 Cohort 2 teachers at one site, whereas Jitendra, Harwell, and Im (2021) provided PD to small groups of teachers (7–18) at each site. The small-group arrangement may have enabled the leader to be more responsive to teacher interactions and to clarify materials in context to improve teacher practices and, consequently, student learning. In this study, there was minimal variation in the performance of students with MD from differences in teacher experience with SBI, suggesting the “holding power” of SBI in the sense that student learning did not drop off despite the SBI-experienced cohort not receiving any additional PD in the 2nd year.
Similarly, results indicated cohort was not a significant predictor of the GMADE posttest or end-of-year state achievement test, suggesting that student learning was on average the same regardless of whether a teacher was an SBI-experienced or SBI-novice implementer (Research Question 3). It is also worth noting that there is descriptive evidence some students with MD in both cohorts transitioned to the no-risk categories at the end of the year in terms of their MA level (see Figure 1). Taken together, these findings show that students in classrooms of both Cohort 1 and Cohort 2 teachers made comparable gains not only in PPS but also in overall mathematics problem solving and MA, suggesting that designing PD activities supported by effective instructional materials and teachers implementing units designed around proportional reasoning had a positive impact on student outcomes (e.g., Jitendra, Harwell, et al., 2016; Jitendra, Harwell, & Im, 2021).
Finally, results showed no differences across cohorts with regard to acceptability of SBI (Research Question 4). Consistent with Jitendra, Harwell, et al. (2016), Jitendra, Harwell, and Im (2021), and McMeeking et al., (2012), we posit that the high levels of teacher satisfaction with the underlying SBI program may explain fidelity of implementation to the program components. Additionally, it is possible that buy-in to the SBI program from teachers in both cohorts motivated their students and enhanced student attitudes about SBI. However, the finding that students in Cohort 1 classrooms reported higher levels of satisfaction with the use of schematic diagrams than students in Cohort 2 classrooms suggests that teachers who had experience with SBI may have mastered ways to work with and across a range of representations to motivate their students.
Although interesting, these results must be interpreted with caution. First, the combination of teacher reassignment and teacher attrition in the 2nd year of Jitendra, Harwell, and Im (2021) produced a nonequivalent, quasiexperimental, cluster design. However, as presented in the Results, our study shows evidence of pretest equivalence of both cohort classrooms on the distal measures and only a small difference on the proximal measure (PPS). Recall that for all outcomes, the pretest served as a student-level control variable. Relatedly, the relatively modest number of classrooms for the southeastern state (j = 19) may have produced statistical tests with less-than-acceptable levels of power, which could play an important role in the absence of cohort differences for classrooms in the western state. Second, we classified students as having MD based on end-of-the-year sixth-grade state MA test scores in each state, with variations in categories of achievement levels. Although there were more students in the southeastern state identified as having MD than in the western state, the results were similar in both states.
Third, given that the SBI teacher PD program included access to support resources (e.g., teacher guide, student materials), we cannot disentangle the PD components from the use of instructional materials to influence SBI-experienced teachers’ sustained implementation fidelity to the core components of the SBI program 1 year past the end of the study without continued project support and to affect student outcomes. Future research is warranted to examine whether students still benefit from instruction on proportional reasoning when teachers receive the same instructional materials but PD is reduced or eliminated. Fourth, the internal reliability of the student measures was below what is typically recommended and noticeably lower than the reliabilities reported by Jitendra, Harwell, et al. (2016) and Jitendra, Harwell, and Im (2021). The lower reliabilities may be partly or wholly due to the homogeneity of the sample of students in the current study (all have been identified as having MD), which, other things being equal, could reduce variability and lower reliability. Still, the lower reliabilities of the student measures in the current study add error to the analyses and thus represent an important limitation.
Contributions and Implications
Results of this study contribute to the research base in several ways. First, our study design (following two cohorts, SBI-experienced teachers and SBI-novice teachers, over time) allowed us to account for more than immediate teacher and learning outcomes of students with MD, which is important to address a program’s true effect (Liu & Phelps, 2020). Second, the SBI program in this study may have provided a coherent program of teaching and learning that promoted the significant levels of fidelity found in this study, which in turn impacted positive learning outcomes for students with MD. Teachers seemed to have made sense of the curricular activities (e.g., connecting the new problem to previously solved problems, highlighting the underlying problem structure using visual-schematic representations, generating an estimate prior to solving the problem, applying multiple solution strategies, checking the reasonableness of the solution) and were faithful to the underlying program as they became empowered in their knowledge of ways to support a broad range of learners. One implication, then, is that a coherent model of PD and effective instruction may provide the conditions for promoting sustainability in teacher practices (Darling-Hammond et al., 2017; Zehetmeier & Krainer, 2011).
Third, this study focused on a highly relevant population (i.e., students with MD) for the secondary analysis, which is important to inform evaluations of intervention effectiveness in research contexts. In an increasing climate of low expectations for students with MD served in general education classrooms, helping teachers understand the capacities of all students to learn challenging mathematics (ratios and proportions) using the SBI program, which has demonstrated improved student achievement, has important implications for teaching students with MD.
Fourth, our results converge with previous studies of students with MD to indicate that instructional efforts in general education classrooms targeted to meet the needs of a majority of students can be achieved with the integration of best practices in mathematics education and special education (e.g., Barnes et al., 2016; Clarke et al., 2011; Fuchs et al., 2016; Jitendra, Harwell, Karl, et al., 2017). More generally, findings from this study suggest that SBI may display the desired impact of a core mathematics program where students with MD can be successful in learning mathematics. This is consistent with previous research on rational numbers (e.g., Fuchs et al., 2017; Jitendra et al., 2018; Jitendra, Harwell, et al., 2016; Jitendra, Harwell, Dupuis, et al., 2017; Jitendra, Harwell, Karl, et al., 2017; Jitendra & Im, 2019). The findings also provide preliminary evidence that the SBI program might decrease the number of students classified as MD at entry into eighth grade because it implies better performance on mathematics tests. This finding, if supported by future research, would be important to students with MD and their families and would have a positive impact on schools in that it could provide ways to increase their ability to provide effective instructional support for all students. In summary, this study suggests that a coherent model of PD and instruction may provide the conditions for promoting sustainability in teacher practices and may be beneficial in supporting students with MD served in general education classrooms.
Supplemental Material
sj-docx-1-ecx-10.1177_00144029221094053 - Supplemental material for Sustainability of a Teacher Professional Development Program on Proportional Reasoning Skills of Students With Mathematics Difficulties
Supplemental material, sj-docx-1-ecx-10.1177_00144029221094053 for Sustainability of a Teacher Professional Development Program on Proportional Reasoning Skills of Students With Mathematics Difficulties by Asha K. Jitendra, Michael R. Harwell and Soo-hyun Im in Exceptional Children
Footnotes
Declaration of Conflicting Interests
Dr. Jitendra is the lead author of the SBI program. However, to ensure objectivity of findings, all scoring, entry and data analysis were conducted by research assistants and the methodologist, who do not have any interests that might be interpreted as influencing the research. The research assistant and methodologist independently reviewed the manuscript to ensure data analysis, findings, discussion, and interpretations were appropriate, accurate, and objective.
Funding
The research reported here was supported by the Institute of Education Sciences, U.S. Department of Education, through Grant #R305A110358. The opinions expressed are those of the authors and do not represent views of the Institute of Education Sciences or the U.S. Department of Education. We acknowledge the efforts of all teachers and students who participated in the study.
Supplemental Material
Supplemental material for this article is available online.
Manuscript received September 2021; accepted March 2022.
References
Supplementary Material
Please find the following supplemental material available below.
For Open Access articles published under a Creative Commons License, all supplemental material carries the same license as the article it is associated with.
For non-Open Access articles published, all supplemental material carries a non-exclusive license, and permission requests for re-use of supplemental material or any part of supplemental material shall be sent directly to the copyright owner as specified in the copyright notice associated with the article.