
Abstract
Racial inequality in school discipline is an important topic in education. Using nationwide data, this study identifies and examines “Inclusive Disciplinary Districts” (IDDs) in the United States. We use data from the Civil Rights Data Collection (CRDC) that provides district-level data for the years 2011 to 2012, 2013 to 2014, 2015 to 2016, and 2017 to 2018. The results indicate that suspension rates for Black students, the geographic region, student composition, and economic and social characteristics of IDDs differ from those of High Disciplinary Districts (HDDs) and Median Disciplinary Districts (MDDs). The South has a disproportionately lower share of IDDs and higher share of HDDs. IDDs tend to serve a lower proportion of low-income and Black students than HDDs. Income, racial income inequality, poverty and unemployment rates, crime rates, education levels, the proportion of single-mother households and the proportion of Black residents vary significantly across the neighborhoods of IDDs, MDDs, and HDDs. Differences between IDDs and HDDs are similar even when the sample of districts is limited to predominantly Black districts, predominantly Latinx districts, or predominantly low-income districts. There is notable variation in disciplinary outcomes across regions in the U.S and the findings raise concerns about school discipline policies and practices in the South.
Introduction
The prevalence of and disparities in students’ disciplinary outcomes, coupled with the adverse impact of exclusionary discipline (e.g., suspensions and expulsions) on student achievement and long-term outcomes, make school discipline one of the most pressing education policy and equity issues. The school discipline dilemma is an educational problem afflicting urban school districts nationwide (Welsh & Little, 2018; Welsh & Swain, 2020). There is no universal definition of urban education, thus urban education is defined in multifaceted ways using multiple factors such as location, enrollment, demographic composition, and disparities and educational inequality (Milner, 2012; Welsh & Swain, 2020). Notwithstanding, prior to the pandemic (2012–2018), urban districts (regardless of how urban districts are categorized) tend to have higher suspension rates (regardless of suspension type) than the national average (Welsh, 2025).
Racial disparities in discipline emerge in multiple ways, including differences in the overall prevalence of discipline, the proportion of students disciplined multiple times, the likelihood of being referred to the office, and the severity of consequences for similar infractions (Lewis & Diamond, 2015; Liu et al., 2023; Owens & McLanahan, 2019; Welsh, 2021, 2022a; Welsh et al. 2023). While the use of exclusionary discipline has declined over the past decade, racial inequities have persisted (Civil Rights Data Collection [CRDC], 2021; Leung-Gagné et al., 2022; Welsh, 2023; Welsh & Little, 2018). The resulting loss of instructional time contributes to achievement disparities between White students and their Black and Brown peers (Gregory et al., 2010; D. Losen & Whitaker, 2018; Welsh & Little, 2018). The negative effects of exclusionary discipline are well-documented, and there is growing consensus that students’ disciplinary experiences influence both academic achievement and long-term outcomes, including involvement in the juvenile justice system (Bacher-Hicks et al., 2019; Davison et al., 2022).
Despite numerous policy and program interventions, racial inequities in discipline remain a persistent issue across school districts (Welsh, 2022a; Welsh & Little, 2018). Reforming school discipline has become a complex challenge, as policymakers and educators attempt to balance demands for safe schools with concerns about racial disparities and the school-to-prison pipeline (Johnson et al., 2019; Welsh, 2023). The problem has been exacerbated by post-pandemic shifts in student behavior (Welsh, 2022b; Welsh & McGraw, 2025), an ongoing youth mental health crisis (Office of the U.S. Surgeon General, 2023), and increasing teacher and principal attrition due to perceived rising disorder in schools (Sparks, 2023). Some states have responded by reinstating zero-tolerance policies and implementing stricter security measures (Einhorn, 2022; Rodriguez & Welsh, 2022; 2025). Addressing these challenges requires identifying effective discipline reforms that both promote school safety and reduce racial disparities (Welsh & McGraw, 2025).
This study posits that the district level is pivotal in addressing disparities in school discipline. Although federal and state policies provide broad guidelines, school discipline is primarily administered at the district and school level (Curran & Finch, 2021; Identifying Reference, 2021, 2022). Districts play a central role in determining whether schools adopt punitive or restorative disciplinary approaches, shaping codes of conduct, and allocating support staff such as social workers and behavior specialists (Identifying Reference, 2021, 2022). Some states require monitoring of discipline disproportionalities, yet little attention has been paid to identifying districts that are successfully reducing disparities. While states like North Carolina track districts with “significant disproportionality” to provide additional support, little research has focused on districts that outperform expectations in discipline equity. Learning from these districts can inform more effective school discipline reforms.
The “beat the odds” approach—often applied to academic performance—has been largely absent from school discipline research (DeArmond et al., 2015; Jennings et al., 2015; Muijs et al., 2004; Partridge & Koon, 2017). Although a handful of studies have examined high- and low-suspending schools (Booth et al., 2012; Christle et al., 2004; Mukuria, 2002; Sartain et al., 2015; Welsh et al., 2023), fewer have investigated district-level differences. Most empirical studies of school discipline relied on state- or district-specific data, with limited research using national data to compare discipline outcomes across districts (Gage et al., 2021; Rodriguez & Welsh, 2022; Welsh & Little, 2018). However, prior work have highlighted significant within-state variation in suspension rates (Leung-Gagné et al., 2022), underscoring the importance of district-level analysis. Even though millions of students receive in-school suspensions (ISS) nationwide, out-of-school suspensions (OSS) typically receive the bulk of researchers’ and policymakers’ attention (Cholewa et al., 2018; Rodriguez & Welsh, 2022). The lion’s share of empirical studies examining school discipline patterns focus on OSS, and few studies have focused on ISS or differentiated between the two suspension types (Jabbari & Johnson, 2020; Lee, 2023; Leung-Gagné et al., 2022; Rodriguez & Welsh, 2022).
This study addresses that gap by analyzing four waves of nationwide district-level data from the Civil Rights Data Collection (CRDC) to identify and examine Inclusive Disciplinary Districts (IDDs). IDDs are districts that are beating the school discipline odds. In sum, IDDs are educational settings that have relatively low (typically districts in the lowest tercile of the selected sample) rates of prevalence and disparities in exclusionary discipline (both low overall suspension rates and small racial disparities). The identification of these positive outliers captures districts that have desirable disciplinary outcomes for Black students. The concept of IDDs builds on Gregory et al.’s (2017) Framework for Increasing Equity in School Discipline and applies an asset-based approach to discipline disparities. We focus on both OSS and ISS as well as regional differences across the urbanicity of school districts. For instance, the South has the highest number of the largest urban districts (urban-intensive). Similarly, more of the fastest growing urban districts (urban-emergent) are in the South than in any other region. This paper is guided by the following research questions:
How do geographic region, school district student composition, and neighborhood characteristics vary between IDDs and contrasting district disciplinary contexts? Do these relationships differ for majority-Black districts?
How do geographic region, school district student composition, and neighborhood characteristics predict IDD status and contrasting district disciplinary profiles? Do these relationships differ for majority-Black districts?
Our findings provide a snapshot of district-level discipline prior to the onset of the COVID-19 pandemic, offering insights that may inform school discipline reform strategies. The study illuminates priorities for urban school district and school leaders as they address disparities in students’ disciplinary outcomes and provides inspiration for reverse engineering success in school discipline. Identifying states and regions with low prevalence and disparities can highlight exemplars for policymakers and practitioners. While much of the existing research focuses on disparities, relatively few national studies have applied an asset-based approach to identifying school discipline exemplars (Welsh et al., 2023). Understanding how certain districts have successfully minimized both the prevalence of and disparities in students’ disciplinary outcomes provides a promising path toward more effective, equity-driven school discipline reforms. Scholars may use these findings to conduct follow-up studies on the contexts and practices of IDDs, whereas policymakers and district leaders may adapt successful strategies from these districts to their own school discipline challenges. By highlighting districts that “beat the odds,” this study advances efforts to mitigate racial disparities and improve educational equity across districts.
Conceptualizing and Operationalizing Inclusive Disciplinary Districts
Building on prior work on Inclusive Disciplinary Schools (Welsh et al., 2023), we define an IDD as a district with both low overall suspension rates and small racial disparities, particularly for Black students. Black students continue to face the most significant disparities in exclusionary discipline, making their experiences a critical social justice issue (Welsh, 2025; Welsh et al., 2023; Welsh & McGraw, 2025). Reducing suspension rates for Black students is central to school discipline reforms (Cruz et al., 2021; Gregory et al., 2021; Welsh et al., 2023), as recent evidence illustrated that witnessing peers receive suspensions for minor infractions fosters a climate of fear and expectation of unfair treatment (Del Toro & Wang, 2023). Although Latinx and Native American students also experience disproportionate discipline in certain contexts, Black-White disparities remain the most pronounced (Leung-Gagné et al., 2022; Welsh, 2022a). In 2017 to 2018, Black students represented 15.1% of K-12 enrollment but accounted for 38.8% of expulsions, 38.2% of OSS recipients, and 31.4% of ISS recipients (CRDC, 2021). Preliminary analyses of the latest CRDC data (2021–2022) suggest that Black boys have a higher prevalence of suspensions than Black girls. Black boys were 8% of the K-12 student enrollment but 18% of students who received one or more ISS and 22% of students who received one or more OSS. Black girls were 7% of K-12 student enrollment but 11% of students who received one or more ISS and 13% of students who received one or more OSS.
IDDs are districts that have successfully counteracted racial threat in school discipline (Edwards, 2016; Welch & Payne, 2010; Welsh et al., 2025), demonstrating limited use of exclusionary discipline despite serving a high proportion of Black students. Prior research has primarily examined high-suspending schools and their characteristics (Christle et al., 2004; Jabbari & Johnson, 2020; D. J. Losen & Martinez, 2013; Mukuria, 2002), or contrasted low- and high-suspending schools (Booth et al., 2012; Mukuria, 2002; Sartain et al., 2015). Most studies on discipline disparities have focused on school-level differences, with less attention to district-level variation (Welsh et al., 2023). However, districts play a crucial role in shaping disciplinary policies (Welsh, 2022c), making it essential to extend the asset-based approach to this educational governance level.
Operationalizing IDDs
Several factors shape disciplinary patterns in IDDs, including the student population served, school environments, educator diversity and qualifications, and neighborhood contexts (Christle et al., 2004; Jabbari & Johnson, 2020; Welsh et al., 2023). External factors—such as students’ home neighborhoods and family circumstances—also influence behavior and disciplinary responses (Kysar-Moon, 2022; Miner & Clarke-Stewart, 2008; Sheldon & Epstein, 2002; Welsh, 2022a; Welsh & Little, 2018).
Following Welsh et al. (2023), we operationalize IDDs using both discipline prevalence and racial disparities, focusing on ISSs and OSSs due to the lack of national data on Office Discipline Referrals (ODRs). Our analysis examines four district types: all districts, predominantly Black districts, predominantly Latinx districts, and predominantly FRPL-eligible districts. This approach accounts for well-established influences on discipline, such as racial and socioeconomic composition.
Comparing School Discipline in Districts Nationwide
Few studies have examined school discipline disparities using national district-level data. Prior work has primarily linked discipline gaps to achievement disparities (Gopalan, 2019; Pearman et al., 2019) and found that larger Black-White academic gaps correlate with larger discipline disparities, particularly in districts with high educational attainment and socioeconomic inequality. However, these studies focused on disparities rather than overall suspension prevalence.
Most national reports on school discipline use only one wave of CRDC data (CRDC, 2021; Government Accountability Office [GAO], 2018). A recent Child Trends report (Ryberg et al., 2021) analyzed four CRDC waves, showing that despite declining suspensions since 2011 to 2012, Black students and students with disabilities remain disproportionately disciplined. Leung-Gagné et al. (2022) extended this analysis to historical trends, finding that suspension rates doubled from 1973 to 2010 before declining post-2010. We build on these studies by incorporating ISSs, as research increasingly highlights the need to examine both suspension types and their relationship (Noltemeyer et al., 2015; Welsh, 2022a).
Finally, the connection between school discipline and surrounding communities remains underexplored (Girvan et al., 2021; Sheldon & Epstein, 2002; Welsh & Little, 2018). Studies on neighborhood effects have offered mixed findings (Gray et al., 2017; Kirk, 2009; Lee, 2023; Leventhal & Brooks-Gunn, 2004; Limbos & Casteel, 2008; Pearman, 2023). Some suggested that schools adopting non-punitive approaches tend to be in higher-educated, lower-poverty neighborhoods (Gray et al., 2017), while others have highlighted the disproportionate impact of poverty on student suspensions (Sartain et al., 2015).
This study identifies IDDs and examines how district and neighborhood characteristics shape disciplinary patterns. By leveraging a national longitudinal dataset, we contribute to a growing body of research on district-level discipline disparities. Unlike prior district-level studies, which focus solely on discipline disparities (Gopalan, 2019; Pearman et al., 2019), our IDD framework considers both prevalence and disparities of both ISS and OSS. A key contribution of this study is its insights into how neighborhood characteristics correlate with suspensions, offering new perspectives for policymakers and educators.
Data and Methods
Data
This analysis utilizes publicly available data from the CRDC for the 2011 to 2012, 2013 to 2014, 2015 to 2016, and 2017 to 2018 academic years. The dataset includes total student enrollment, enrollment disaggregated by race, ISS and OSS by race, and counts of single and multiple OSS incidents. The CRDC covers approximately 13,500 school districts nationwide, with data missing for about 250 districts (2%). Since the pandemic, the CRDC have made available data for the year 2020 to 2021 (the pandemic delayed data collection for 2019 to 2020 by a year). 2021 to 2022 marks the first full year of in-person learning in the aftermath of the pandemic and similar to the Government Accountability Office (GAO), we opt not to use 2020 to 2021 data due to extensive data missingness associated with remote learning during the pandemic. We focus on the pre-COVID trends (2012–2018), with the intention of updating our analysis with the 2021 to 2022 data as soon as it is available to illustrate how post-COVID trends may be similar or different to pre-COVID years (2021–2022 CRDC data was not available yet at the time of writing).
Appendix Table A1 details missing data by region. About one-third of districts lack ISS or OSS data, while 63% are missing expulsion data. Districts with partial data availability (10% of all districts) report significantly higher discipline rates and disparities (about 25% higher). Districts with no available data tend to have larger Black or Latinx populations, higher poverty levels, and are more often located in the South. This suggests our results likely understate the prevalence and racial disparities in school discipline.
Key data limitations include the absence of national ODR data, a critical disciplinary measure (Rodriguez & Welsh, 2022, Welsh, 2023), and the biennial nature of CRDC data, limiting the study’s temporal granularity.
District and Neighborhood Characteristics
In addition to discipline data, we incorporate district-level community economic and social indicators from SEDA. These include student demographic composition (race, FRPL-eligibility, special education status, English Language Learner (ELL) status), total enrollment, revenue per student, student-teacher ratio, charter school enrollment share, and socioeconomic indicators such as average household income, Black-White income gap, poverty rate, unemployment rate, crime rate, and educational attainment.
We also integrate academic performance data from the SEDA National Assessment of Educational Progress (NAEP). We use district-grade scale scores, which standardize achievement levels across districts, indicating the approximate grade-level ability of the average student (e.g., a score of 7 in math suggests an average seventh-grade proficiency). Sample descriptives are presented in Appendix Table A2.
Measuring Prevalence and Disparities in Exclusionary Discipline
We calculate discipline rates by dividing discipline incidents by enrollment, disaggregating by race for ISS and OSS. OSS calculations aggregate single and multiple OSS instances to capture the total number of students experiencing OSS.
To measure disparities, we use the Absolute Risk Difference (ARD) method (Rodriguez & Welsh, 2022), defined as:

For example, if a district has a Black OSS risk index of 0.35 and a White OSS risk index of 0.10, the Black-White OSS ARD is 0.25, meaning Black students are 25% more likely to receive OSS than White students in that district. ARD is preferred for its interpretability and alignment with federal policy (Rodriguez & Welsh, 2022), though it does not capture relative disparities, which we address by reporting ARD alongside discipline rates.
Operationalizing IDD and Comparison Districts
An IDD is defined as a district in the bottom quartile for both ISS and OSS prevalence as well as Black-White disparities in ISS and OSS (measured by ARD). We create four dichotomous indicators (two for prevalence, two for disparities) and classify IDDs as districts meeting all four criteria.
We contrast IDDs with High Disciplinary Districts (HDDs), defined as districts in the top quartile for both discipline prevalence and racial disparities. Median Disciplinary Districts (MDDs) comprise all other districts.
Of 12,053 districts with discipline data from 2012 to 2018, 185 districts (2%) are classified as IDDs, 369 districts (3%) as HDDs, and 11,499 districts (95%) as MDDs. IDDs and HDDs exhibit stark contrasts: IDDs have an average ISS rate of 1.28% and a Black-White ISS ARD of −1.72%, while HDDs have an ISS rate of 16.41% and a Black-White ISS ARD of 17.92%. For OSS, IDDs have a rate of 1.36% and a Black-White OSS ARD of −1.84%, whereas HDDs have an OSS rate of 14.19% and a Black-White OSS ARD of 17.67%. National averages are 5.42% for ISS, 5.03% for Black-White ISS ARD, 5.08% for OSS, and 5.27% for Black-White OSS ARD, with MDDs closely aligning with these figures.
Among 793 majority-Black districts, none qualify as IDDs, while 60 are HDDs. Conversely, of 5,031 majority-White districts, 79 are IDDs, and 129 are HDDs. Majority-Black districts are more likely to be classified as HDDs. Restricting to majority-Black districts results in 36 IDDs, 716 MDDs, and 41 HDDs.
Analytic Strategy
To address our first research question, we compare IDDs, MDDs, and HDDs using summary statistics and ANOVA to test for significant mean differences across district characteristics (e.g., student demographics, achievement, and neighborhood conditions).
For our second research question, we estimate multinomial logistic regression models predicting district classification (IDD, MDD, or HDD), treating MDD as the reference category. Independent variables include district-level student composition, achievement, and size, as well as neighborhood economic, social, and crime indicators. We control for geographic region (South, West, Midwest, Northeast) and urbanicity (urban, suburban, town, rural).
All models are estimated in Stata using mlogit, adjusting for district and year fixed effects. We then re-run the models focusing solely on majority-Black districts to assess whether district characteristics predict IDD or HDD classification differently in these contexts.
Results
Characteristics of IDDs, MDDs, and HDDs
We begin by examining the geographic distribution of IDDs and HDDs. Table 1 shows the number of IDD and HDD districts by state and region, for all districts (Columns 1 and 2) and predominantly Black districts (Columns 3 and 4). The Northeast and West have slightly more IDDs than HDDs, while the Midwest has more HDDs, and the South has significantly more HDDs than IDDs. Thus, IDDs are more common in the Northeast, West, and Midwest, while HDDs are most prevalent in the South. For predominantly Black districts, HDDs are again most concentrated in the South, with IDDs more likely in the Northeast and Midwest. The West has some IDDs but no HDDs, though the region has few majority-Black districts.
Number of IDDs and HDDs by Region and State for All Districts and Predominantly Black Districts.
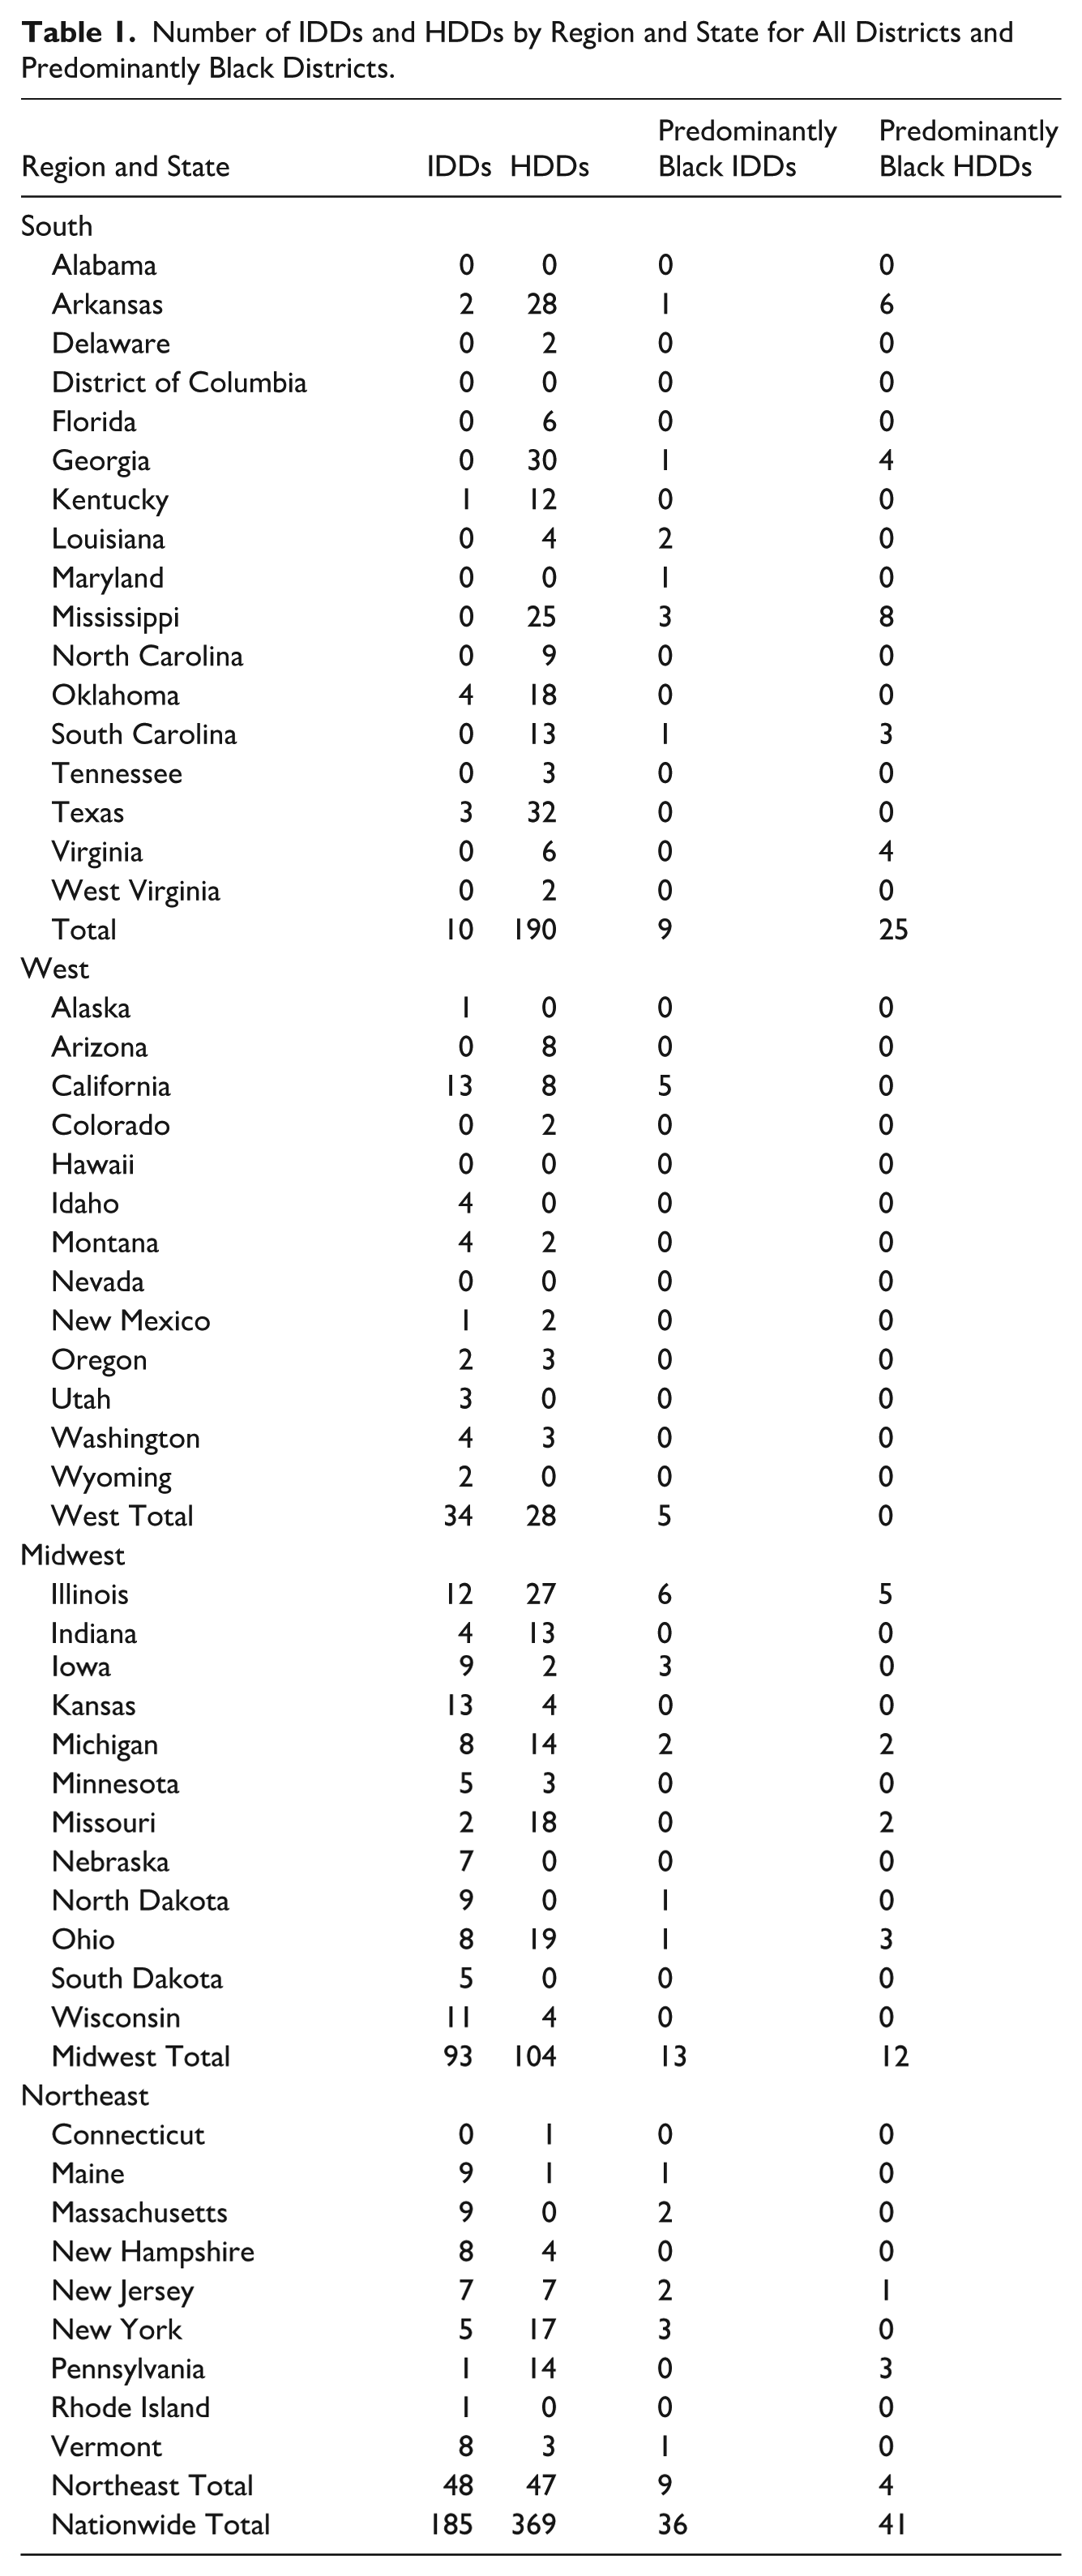
Demographic and economic differences between regions help contextualize these patterns. The Midwest and West have similar income, poverty, and unemployment levels, while the Northeast has higher income and lower poverty and unemployment, and the South has lower income and higher poverty and unemployment. The Midwest and Northeast have similar proportions of Black residents, but the South has the highest, and the West the lowest.
We then examine the types of districts in IDD and HDD categories, focusing on urbanicity and demographics. IDDs are more likely to be rural, with more White students and fewer Black students compared to the general population. HDDs are more likely to be urban, with fewer White students and more Black students. These patterns suggest that differences between IDD and HDD districts are largely driven by the student populations they serve. To explore this further, we also analyze predominantly Black districts to isolate those with similar student demographics but differing disciplinary outcomes (Table 2).
Number of IDD and HDD districts by Urbanicity and by Racial Composition of Population.
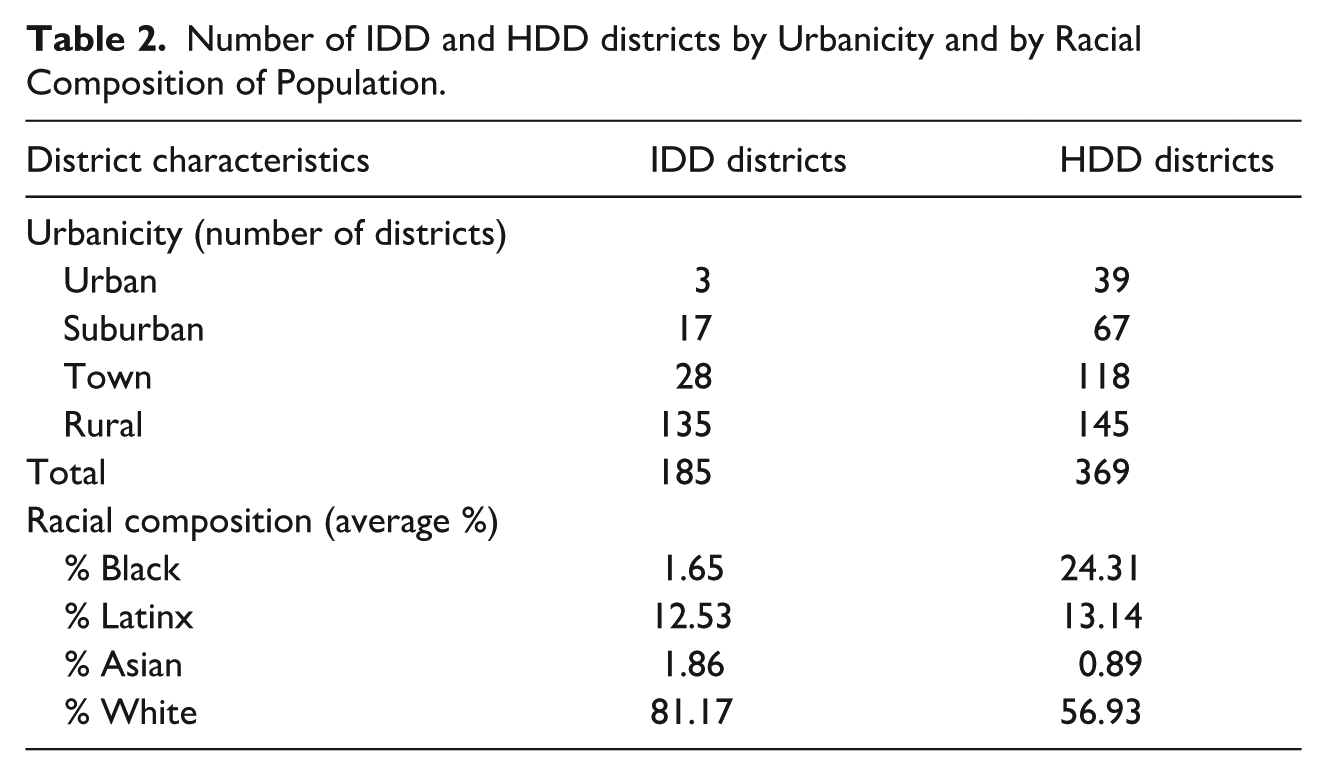
Table 3 shows the average characteristics of IDD, HDD, and MDD districts. IDD and HDD are located in different neighborhoods, with significant differences in racial composition, achievement, and district characteristics. IDDs tend to serve more economically advantaged areas, with fewer Black students and residents, higher proportions of White and Asian students, better student achievement, less racial income inequality, and stronger economic outcomes compared to MDD and HDD districts. IDDs are smaller in enrollment, have more revenue per student, lower student-teacher ratios, and fewer students attending charter schools. While IDDs and MDDs have similar household income, HDDs have much lower income. IDDs also serve areas with fewer single-mother households. Overall, HDDs serve under-resourced communities with higher poverty and lower income, while IDDs are located in neighborhoods with lower crime and unemployment.
Differences in Characteristics of IDD, MDD, and HDD Schools.
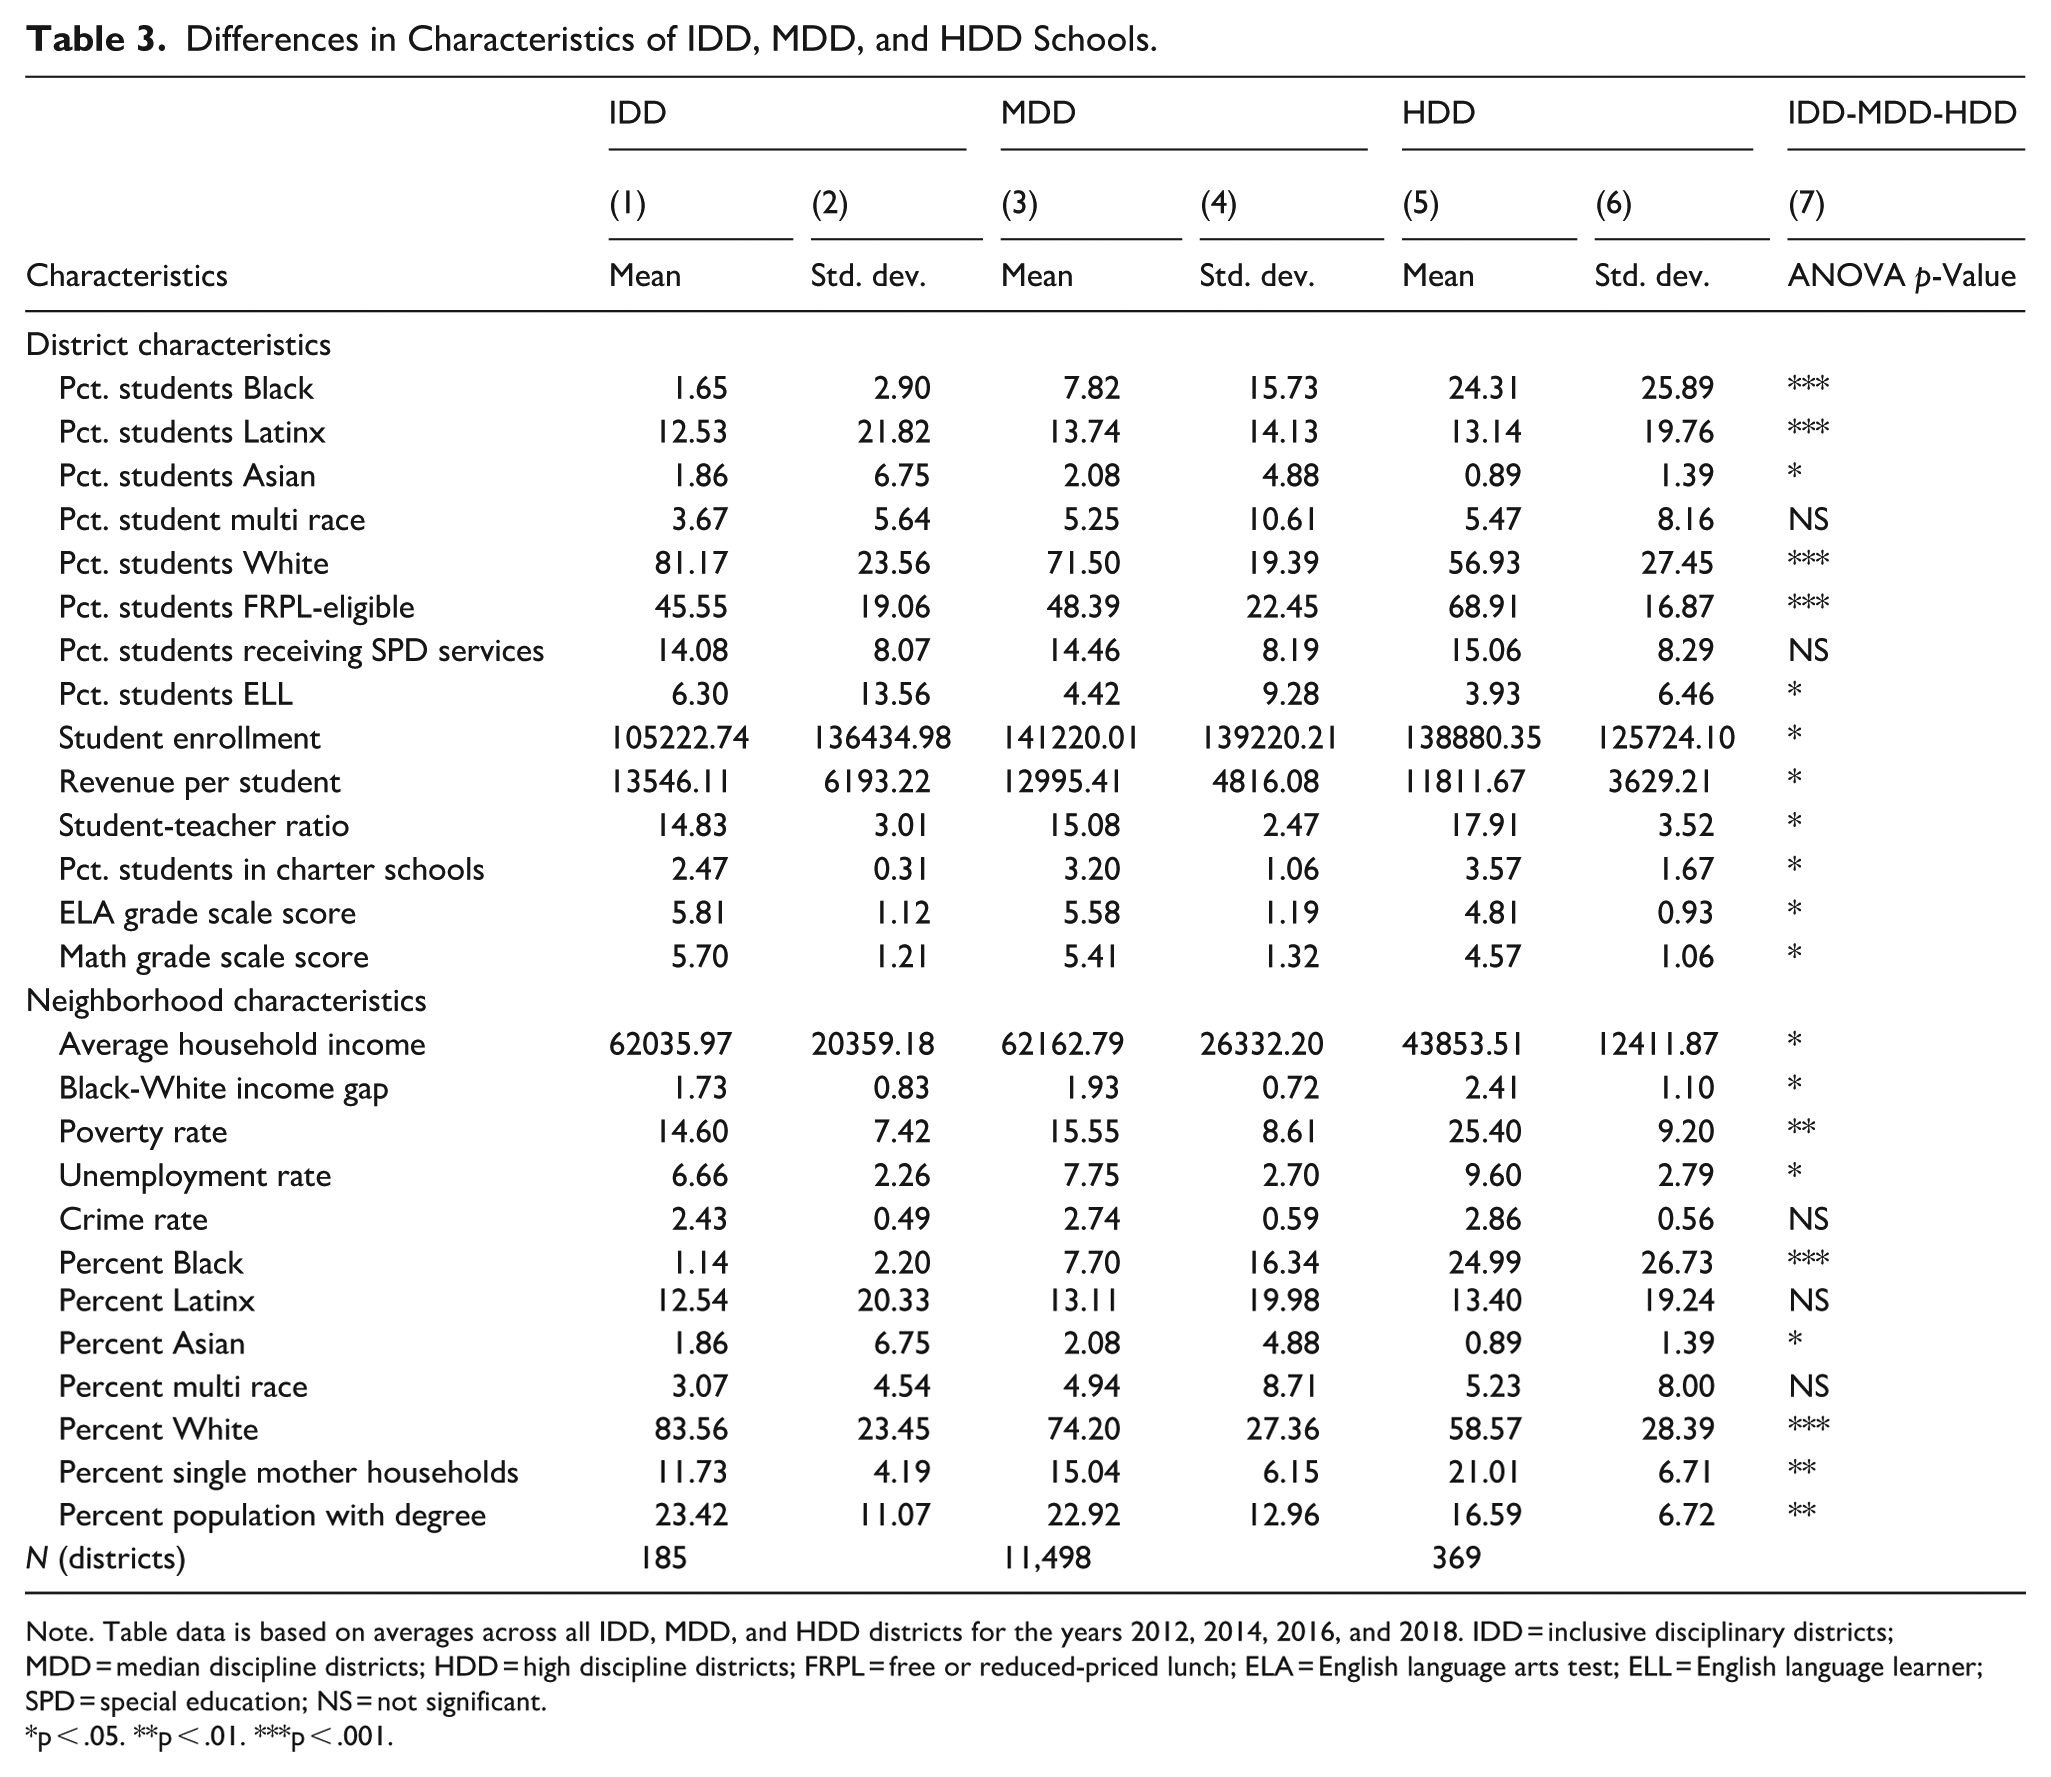
Note. Table data is based on averages across all IDD, MDD, and HDD districts for the years 2012, 2014, 2016, and 2018. IDD = inclusive disciplinary districts; MDD = median discipline districts; HDD = high discipline districts; FRPL = free or reduced-priced lunch; ELA = English language arts test; ELL = English language learner; SPD = special education; NS = not significant.
p < .05. **p < .01. ***p < .001.
We conduct a similar analysis for Table 3 by region and urbanicity (results available upon request). The findings are generally consistent across regions, with the most notable difference being larger disparities in the percentage of Black students and residents in the South, where HDDs have higher proportions of Black populations compared to IDDs. The difference in FRPL-eligible students is smaller in the Northeast, West, and rural districts.
Overall, IDDs and HDDs differ significantly in terms of region, urbanicity, student racial and socioeconomic composition, and neighborhood indicators, with IDDs serving less marginalized populations.
Predicting IDD and HDD Status
Table 4 presents regression results in odds ratio format (values below 1 indicate a lower likelihood of being an IDD or HDD, and values above 1 indicate a higher likelihood). Column 1 shows the likelihood of a district being IDD, and Column 2 shows the likelihood of a district being HDD, with MDD as the base category. Columns 3 and 4 show the same information for majority Black districts only.
Multinomial Logistic Regression Estimates (Odds Ratios) Predicting Probability of District Being IDD and HDD for All Districts and Predominantly Black Districts.
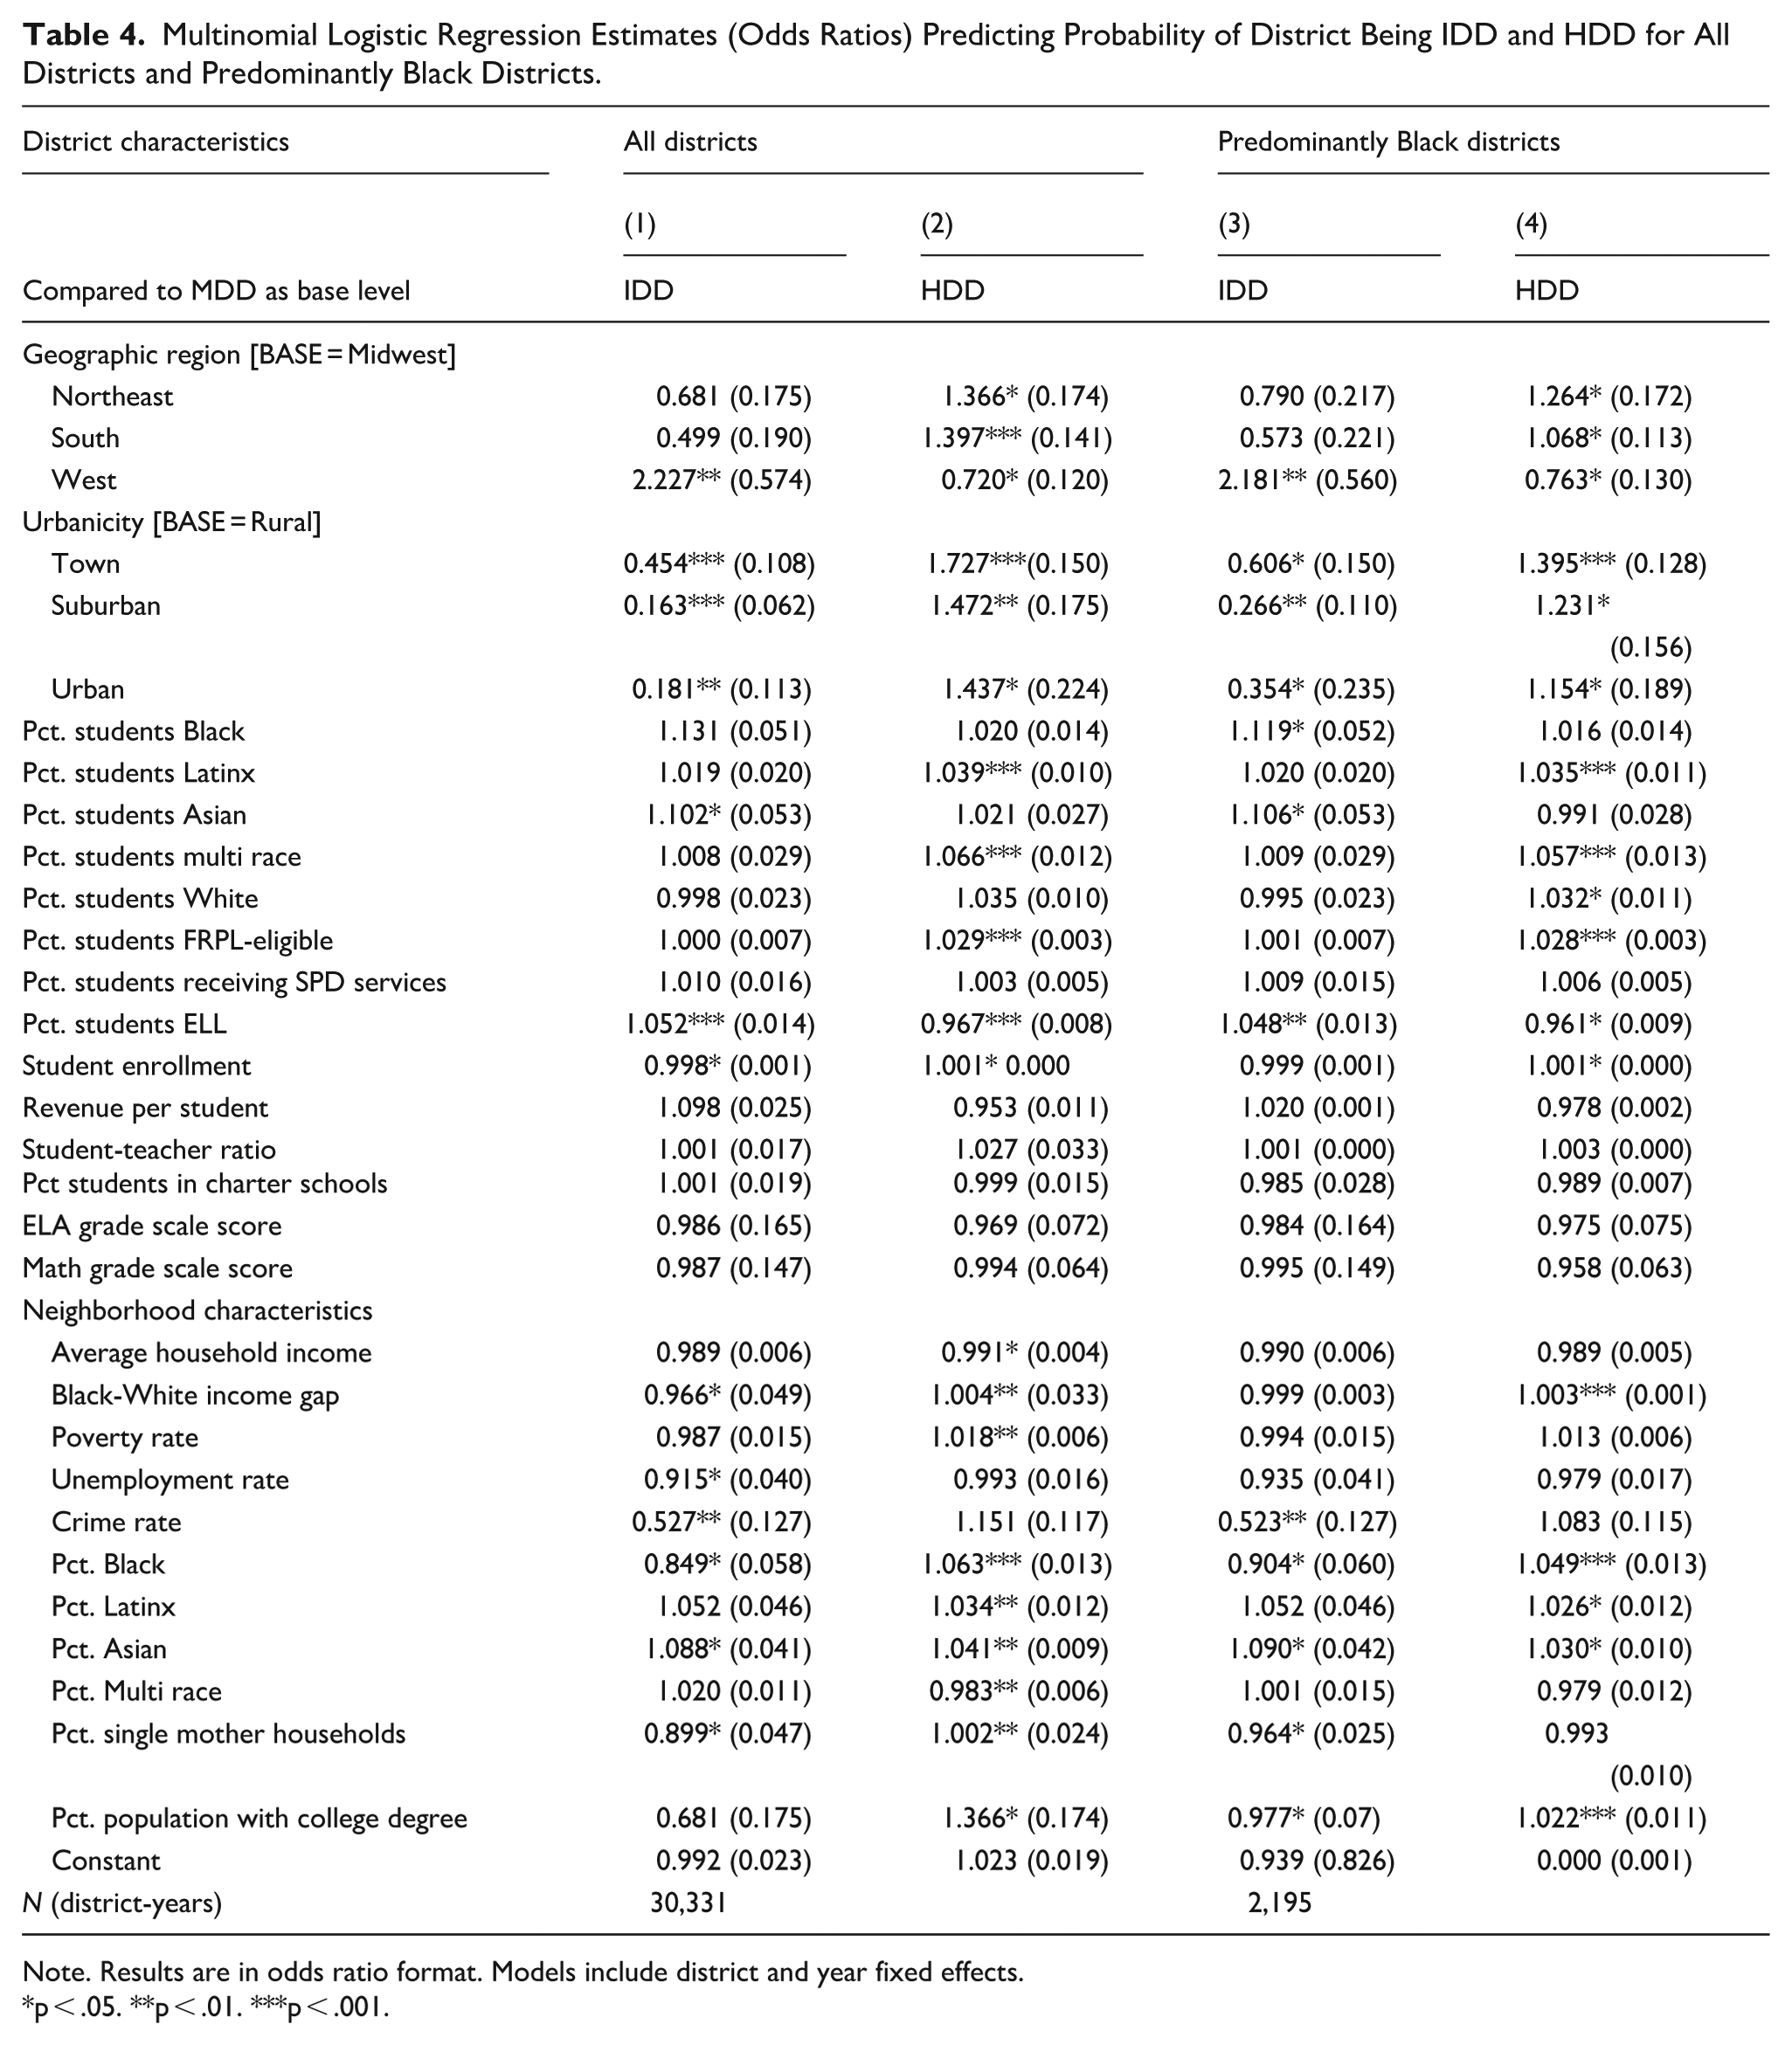
Note. Results are in odds ratio format. Models include district and year fixed effects.
p < .05. **p < .01. ***p < .001.
Districts in the West are more likely to be IDD and less likely to be HDD, while districts in the South and Northeast are more likely to be HDD, relative to the Midwest. This suggests that regional and state differences influence district disciplinary outcomes beyond socioeconomic characteristics. The Northeast’s regression result differs from the descriptive analysis, with the inclusion of neighborhood variables making districts in the Northeast more likely to be HDD. This indicates that region-level differences in disciplinary outcomes may be partly explained by neighborhood characteristics like income and unemployment.
Urban, suburban, and town districts are all less likely to be IDD and more likely to be HDD compared to rural districts. Suburban areas show the most reduced odds of being IDD, while town areas have the highest odds of being HDD. Districts with more Latinx, multi-race, and FRPL-eligible students are more likely to be HDD. The proportion of Asian students is positively associated with IDD status, and the proportion of ELL students is positively related to IDD and negatively to HDD. Notably, the proportion of Black students is not significantly related to either IDD or HDD.
Smaller districts are more likely to be IDD and less likely to be HDD. Revenue per student, student-teacher ratios, and charter school enrollment are not significantly related to IDD or HDD status. District-level ELA and math achievement are also not significantly related, suggesting that IDDs are not necessarily high-performing academically.
Neighborhood characteristics influencing IDD include smaller Black-White income disparities, lower unemployment and crime rates, and lower proportions of Black residents. HDDs are more likely in areas with larger Black-White income gaps, lower income, higher poverty, more Black, Latinx, and Asian residents, and higher proportions of single-mother households. The unexpected findings regarding Asian residents and education levels warrant further exploration, but our results align with prior research showing that Black-White disparities in discipline and academic performance are larger in districts with higher education levels (Gopalan, 2019; Hung et al., 2020). The percent of Black residents, not Black students, is significant in the model.
Regression results for the entire sample and majority-Black districts are similar, with some differences. For predominantly Black districts, the proportion of Black students significantly predicts IDD status, unlike for all districts. Neighborhood indicators have a weaker relationship with IDD-HDD status in majority-Black districts. For example, average income, poverty, and unemployment do not predict IDD or HDD status in these districts, though larger Black-White income gaps still correlate with HDD status. Predominantly Black IDDs appear to serve populations with similar economic characteristics as other IDDs, indicating that economic advantage has less of an effect on the likelihood of being IDD in predominantly Black districts.
Specification Checks
We perform specification checks to test the robustness of our results (tables available upon request). Analyses for majority-Latinx and predominantly FRPL-eligible districts reveal only subtle differences. In majority-Latinx districts, the proportion of Latinx students and residents no longer significantly predicts HDD status. In predominantly FRPL districts, the proportion of residents with college degrees no longer predicts HDD status.
Next, we replicate the principal component analysis (PCA) approach from Sartain et al. (2015) using our defining characteristics for IDD districts. The PCA approach classifies all previously identified IDD and HDD districts the same, but also includes more districts in both categories, resulting in a correlation of about .9. This broader set of districts, which includes those with more average disciplinary outcomes, is less discerning in identifying school discipline exemplars.
We conduct ANOVA and regression analyses by urbanicity but find only small significant differences. The differences between IDD, MDD, and HDD districts are largely consistent across urban categories. The proportion of Latinx residents is not significant in Towns or Rural areas, while FRPL-eligibility more strongly predicts IDD or HDD status in Urban and Suburban districts.
We also run models by region to explore potential regional variations. While most variables are similarly significant across regions, there are a few notable differences. In the South, the percentage of Black residents and students is not significant, whereas in other regions, higher proportions of Black students and residents increase the likelihood of being HDD and decrease the likelihood of being IDD. Additionally, neighborhood variables (income and poverty) are not significant in the Northeast or South regions when predicting IDD or HDD status.
Finally, districts in more educated neighborhoods are more likely to be HDD. This may reflect gentrifying neighborhoods, where active, vocal parents demand more punitive discipline, as documented in prior research (Pearman, 2023).
Discussion
Racial inequality remains a critical issue in education. This study examines the characteristics of IDDs—districts that “beat the school discipline odds.” IDDs and HDDs serve different populations, with HDDs predominantly serving disadvantaged students, consistent with existing research linking school discipline outcomes to race and socioeconomic background (Welsh & Little, 2018; Welsh, 2022a). IDDs tend to be smaller, rural, and serve more White students, while HDDs are larger, urban, and serve more students of color and low-income students. This may also be interpreted as evidence of racial threat at the district level (Welch & Payne, 2010, 2018; Welsh et al., 2025), with higher proportions of Latinx and Black students leading to greater use of exclusionary discipline. Additionally, districts with more Asian students are more likely to be IDDs, supporting the model minority hypothesis (Welsh, 2025; Welsh et al., 2024).
Even when limiting the sample to majority-Black or majority-Latinx districts, differences between IDDs and HDDs remain, suggesting similar characteristics of districts that reduce exclusionary discipline, regardless of racial composition. However, neighborhood economic conditions appear to have a weaker relationship with IDD/HDD status in predominantly Black districts.
Our findings that HDDs tend to have higher educational attainment align with Gopalan (2019), who found that racial discipline disparities are larger in more educated areas. We also find that IDDs have smaller Black-White income gaps and HDDs have larger ones. However, we don’t find that higher income or per-student revenue improve discipline outcomes or that charter schools and single-parent households significantly influence discipline outcomes, as Gopalan (2019) suggested. Our finding that a higher proportion of Black residents increases the likelihood of HDD contrasts with Gopalan’s (2019) finding that Black-White discipline disparities are smaller in districts with more Black residents. These differences in results may stem from differences in data and methodologies: for instance, we analyze multiple discipline metrics with longitudinal data, while Gopalan (2019) used cross-sectional data and focused on disparities.
Our study also differs from Welsh et al. (2023), which found few significant neighborhood predictors for school-level discipline. We find that neighborhood factors—such as income, poverty, and unemployment—are significant predictors for IDD and HDD status. Additionally, we note that districts with more residents with college degrees are more likely to be HDDs, contrary to Identifying Reference’s (2023) findings. These differences may reflect our use of national data, compared to Identifying Reference’s (2023) focus on an “urban intensive district.”
This study highlights the complex relationship between academics and school discipline. Our findings suggest that high academic performance does not correlate with IDD status, and that district-level academic achievement does not predict IDD or HDD status. IDDs are not necessarily high-performing academically. The smaller size of IDDs may help reduce suspensions by allowing districts to address students’ needs more effectively. We find no significant relationship between discipline outcomes and per-pupil expenditure, student-teacher ratios, or charter school enrollment, suggesting that these factors do not explain variations in exclusionary discipline across districts.
The study reveals regional patterns in discipline, with the South having higher prevalence and disparities in exclusionary discipline. IDDs are less likely to be in the South, whereas HDDs are concentrated in the South, even among predominantly Black districts. Urban districts also tend to have higher prevalence of and disparities in both ISS and OSS, highlighting the role of geographic location in shaping disciplinary practices. This study underscores the need to address the unique disciplinary challenges in the South and consider how space-and-place-based factors may shape disciplinary outcomes.
Directions for Future Research
This study highlights districts at opposite ends of the school discipline spectrum, offering opportunities for policymakers and researchers to support HDDs and learn from IDDs. The IDD/HDD framework ensures that districts with clear discipline patterns across multiple measures are identified, avoiding outliers based on individual data points.
Future research should explore the socio-ecological implications of school discipline, including how neighborhoods influence discipline practices and how reforms may shape these communities. Understanding the complex relationship between district racial composition, economic disadvantage, and discipline disparities is critical. Investigating why some regions exhibit vastly different school discipline outcomes, possibly due to cultural differences, is also important (Milner, 2012; Welsh et al., 2019; Welsh & Swain, 2020).
Moreover, a more diverse context for studying school discipline reforms is needed. Most research on exclusionary discipline comes from a few large urban districts and states (e.g., Arkansas, Oregon, New York City, Los Angeles, Philadelphia; Welsh et al., 2023), as well as from programs like PBIS and restorative justice in limited locations (California, Georgia, Oregon, Florida). Future studies should examine rural and suburban districts, as well as more granular categorizations of urban areas, to better understand how urbanicity relates to IDD and HDD status (Milner, 2012; Welsh & Swain, 2020).
Additionally, qualitative and mixed-methods research on IDDs is essential to uncover the factors behind successful disciplinary outcomes. The West region, for example, demonstrates favorable discipline outcomes and warrants further investigation. Future studies could further explore the differences between IDDs, MDDs, and HDDs, examining whether differences in discipline are due to student behavior or how students are disciplined. Research on district-level policies and practices that reduce exclusionary discipline, as well as how these factors relate to state and regional characteristics, will help inform future school discipline reforms.
Footnotes
Appendix
Sample Descriptives.
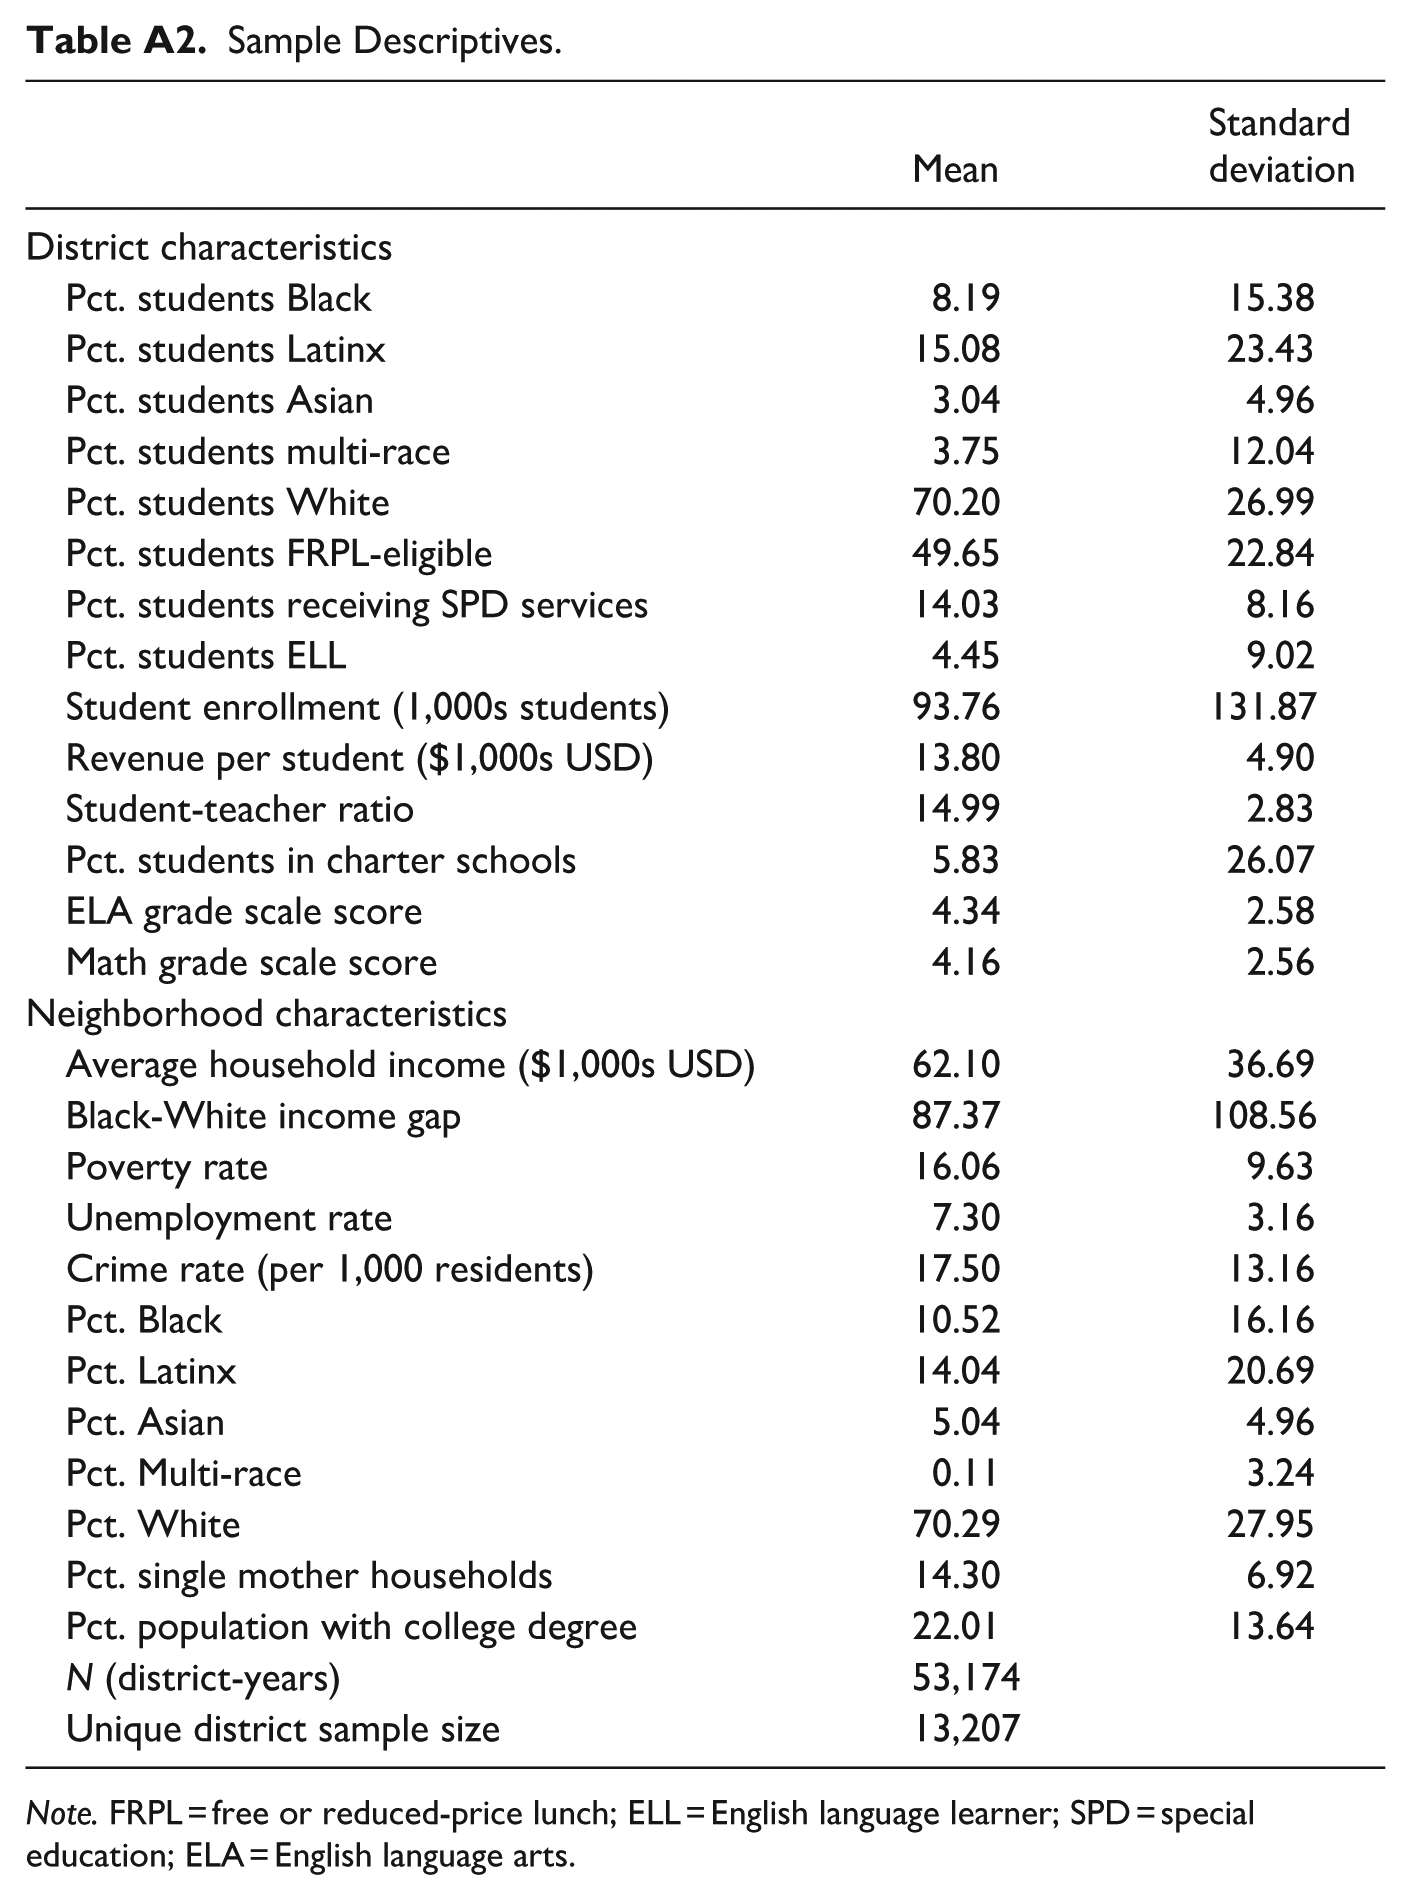
| Mean | Standard deviation | |
|---|---|---|
| District characteristics | ||
| Pct. students Black | 8.19 | 15.38 |
| Pct. students Latinx | 15.08 | 23.43 |
| Pct. students Asian | 3.04 | 4.96 |
| Pct. students multi-race | 3.75 | 12.04 |
| Pct. students White | 70.20 | 26.99 |
| Pct. students FRPL-eligible | 49.65 | 22.84 |
| Pct. students receiving SPD services | 14.03 | 8.16 |
| Pct. students ELL | 4.45 | 9.02 |
| Student enrollment (1,000s students) | 93.76 | 131.87 |
| Revenue per student ($1,000s USD) | 13.80 | 4.90 |
| Student-teacher ratio | 14.99 | 2.83 |
| Pct. students in charter schools | 5.83 | 26.07 |
| ELA grade scale score | 4.34 | 2.58 |
| Math grade scale score | 4.16 | 2.56 |
| Neighborhood characteristics | ||
| Average household income ($1,000s USD) | 62.10 | 36.69 |
| Black-White income gap | 87.37 | 108.56 |
| Poverty rate | 16.06 | 9.63 |
| Unemployment rate | 7.30 | 3.16 |
| Crime rate (per 1,000 residents) | 17.50 | 13.16 |
| Pct. Black | 10.52 | 16.16 |
| Pct. Latinx | 14.04 | 20.69 |
| Pct. Asian | 5.04 | 4.96 |
| Pct. Multi-race | 0.11 | 3.24 |
| Pct. White | 70.29 | 27.95 |
| Pct. single mother households | 14.30 | 6.92 |
| Pct. population with college degree | 22.01 | 13.64 |
| N (district-years) | 53,174 | |
| Unique district sample size | 13,207 | |
Note. FRPL = free or reduced-price lunch; ELL = English language learner; SPD = special education; ELA = English language arts.
Funding
The authors received no financial support for the research, authorship, and/or publication of this article.
Declaration of Conflicting Interests
The authors declared no potential conflicts of interest with respect to the research, authorship, and/or publication of this article.