
Abstract
Among many by-products of Web 2.0 come the wide range of potential image and text datasets within social media and content sharing platforms that speak of how people live, what they do, and what they care about. These datasets are imperfect and biased in many ways, but those flaws make them complementary to data derived from conventional social science methods and thus potentially useful for triangulation in complex decision-making contexts. Yet the online environment is highly mutable, and so the datasets are less reliable than censuses or other standard data types leveraged in social impact assessment. Over the past decade, we have innovated numerous methods for deploying Instagram datasets in investigating management or development alternatives. This article synthesizes work from three Canadian decision contexts – hydroelectric dam construction or removal; dyke realignment or wetland restoration; and integrating renewable energy into vineyard landscapes – to illustrate some of the methods we have applied to social impact assessment questions using Instagram that may be transferrable to other social media platforms and contexts: thematic (manual coding, machine vision, natural language processing/sentiment analysis, statistical analysis), spatial (hotspot mapping, cultural ecosystem modeling), and visual (word clouds, saliency mapping, collage). We conclude with a set of cautions and next steps for the domain.
Introduction
Social impact assessment (SIA) is used within environmental assessment processes to understand and plan how to mitigate or manage the potential impacts that development can cause for nearby residents (Vanclay et al., 2015). SIA often involves desk-based research leveraging census data to understand local demographics and economic conditions using standard statistical techniques such as multiplier effects and straight line analysis, but can also involve primary data collection such as surveys, interviews, public meetings, and comparative case studies (Asselin and Parkins, 2009; Parkins and Mitchell, 2016). Yet protest and resistance has begun to displace participation (Clermont et al., 2019). A recent review of hydropower SIA documents in Canada indicated that professional practice has not kept pace with research in SIA methods (da Silva et al., 2021). Ex-post monitoring of social impacts is also rare, leading some researchers to turn to media coverage to understand how development plays out in local areas, an approach that can be challenging given the often rural contexts involved (Pimentel da Silva et al., 2021).
Novel digital SIA approaches do exist to understand how people live in and value a place and anticipate how those people might be impacted by development but are still largely in the research domain (Sherren et al., 2017). Basic digital functions have been adopted in SIA, as everywhere, to replace analog tools such as typewriters, filing cabinets, mail, and calculators. But the transformative opportunities presented by Web 2.0 (dynamic and user-driven applications such as social media) or Web 3.0 (introducing elements that are open, decentralized, and machine-intelligent) are not yet part of SIA practice (Sherren et al., accepted). For instance, a Danish study recently found that social media is mostly used in SIA for ‘branding and one-way communication’ (Aaen et al., 2018), though others have found that social media is used collaboratively by community members mobilizing to engage in SIA (Sinclair et al., 2017). We do not talk about such ‘active’ SIA work on social media in this article.
We argue that social media and other media sharing platforms also present significant potential to supply datasets to expand the insight achievable in SIA. It is increasingly clear that social media is not just a weak proxy for ‘real life’ (Jurgenson, 2019). People are not the same online as they are in other settings such as public meetings, but such datasets can still help us understand how people live, what they do, and what they care about (and understand when those may be or have been changed or disrupted) (Chen et al., 2019). Yet social media datasets are underutilized in SIA, because of the mutability of those datasets in terms of accessibility, platform rules and demographics of use; the limited technical skillsets of those undertaking SIA work; and uncertainties in terms of ethical and legal practice (Chen et al., 2021). Over the past decade, we have developed and leveraged a range of methods to deploy Instagram images and text in researching the social impact of transitions in renewable energy and coastal adaptation. In this article, we describe some approaches that can be used alone, or chained together, to enrich (not replace) more conventionally derived SIA insight. The techniques are transferrable to other social media platforms with similar text or image contents. We draw on research using social media in three Canadian case study areas and discuss the challenges and opportunities with respect to this set of methods.
Cases
This is not an empirical article, but insights are drawn from three case study areas or issues (Figure 1), often with multiple methods deployed in each. Readers are referred to the original papers or theses for additional details on the cases, as cited throughout.
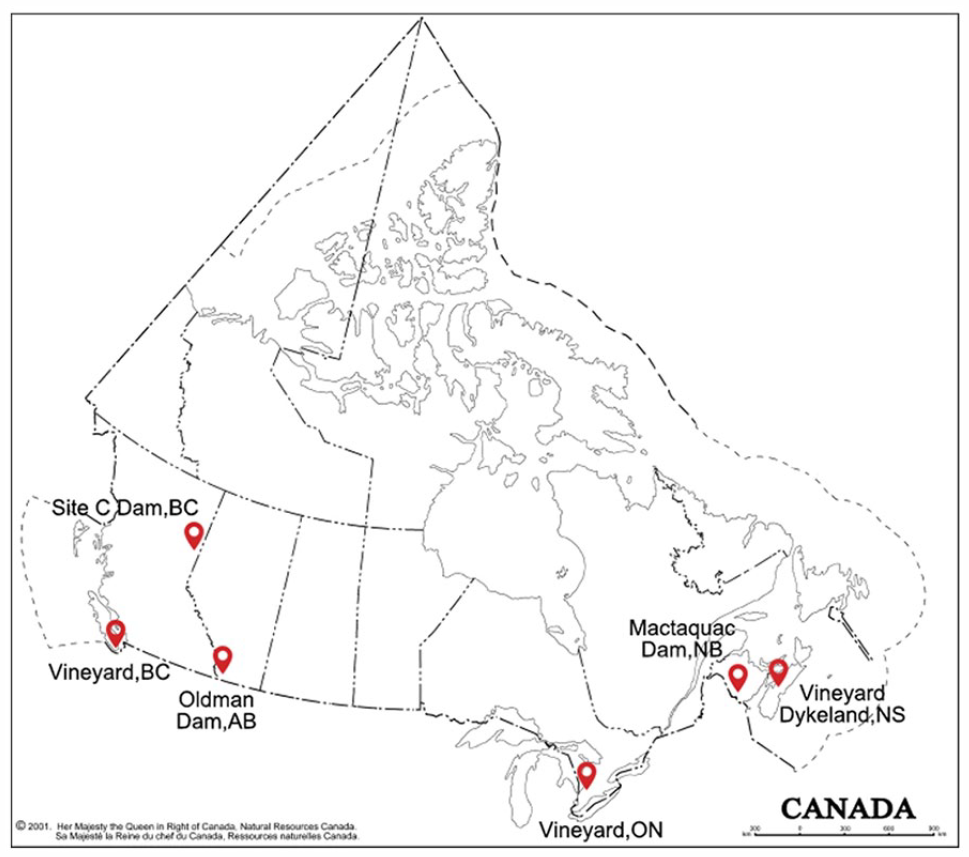
Locator map of the cases being leveraged in this article including Hydroelectric dam construction or removal (Mactaquac Dam, Site C Dam, Oldman Dam), Dyke realignment and wetland restoration (Dykeland) and Integrating renewable energy into vineyard landscapes (Vineyard).
Hydroelectric dam construction or removal
Hydroelectric power (hydropower) is the dominant electricity supply in Canada, at over 60% of total annual generation (International Hydropower Association, 2020). Hydropower often encounters resistance related to visual disruptions, landscape changes, and displacement (Chen et al., 2018). Social media images can help to track the longitudinal changes of hydropower-related landscapes and lifestyles as experienced by nearby residents: not just the post-dam reservoirs, but what came before construction, and the restoration that could follow dam removal.
We used Instagram posts, including photos, textual captions, and geo-locations, to understand the younger generation’s lifestyles and landscape values around current and proposed hydroelectric dams and their reservoirs, the Mactaquac Dam in New Brunswick and the Site C Dam in British Columbia (BC), respectively (Chen et al., 2018, 2019). A year of geocoded posts was gathered using Netlytic from both headponds (actual and planned). The resulting posts were filtered, manually coded, and statistically associated to understand patterns. That work is currently being extended using machine learning (ML) technology, via parallel studies that use natural language processing (NLP) to probe textual data, and convolutional neural networks (CNN, i.e. computer vision) for images and video analysis. Below, this work will be called the ‘hydropower case’.
Dyke realignment and wetland restoration
Dykelands are areas of tidal wetland that have been dyked and drained for agriculture, in some areas of the Bay of Fundy since the 1600s. Rising sea levels due to climate change presents challenges to maintaining and reinforcing dykelands (Chen et al., 2020), so managers have to decide which dykes to reinforce, which to realign or remove, and where to restore dykelands back to wetlands. In these rural areas it can be hard to establish dykeland values and use, such as those encoded in the cultural ecosystem services (CES) framework, so we have looked in part to text and photo information contained in social media data to understand people’s uses and perspectives on different landscapes.
We analyzed 4 months of Instagram data to understand the CES categories and delivery patterns provided by the dykelands and tidal wetlands of the Bay of Fundy, first using manual methods including keyword filtering, manual image inspection, and statistical analysis (Chen et al., 2020). The text from these posts was processed to identify locally relevant sets of keywords for CES encoding using NLP, used in conjunction with the geospatial model SolVES to generate spatially explicit maps of cultural services (Zhao et al., 2023). Below, this work will be called the ‘dykeland/wetland case’.
Integrating renewable energy into vineyard landscapes
Rural areas are often considered ideal locations for renewable energy because of their sparse population (Poggi et al., 2018), but solar panels or wind turbines can be seen to conflict with amenity-based economic development such as second homes and local food and drink. Vineyards are emerging as sources of economic development in rural settings across Canada (McIntyre et al., 2019), and with visitor numbers come social media posts. Such posts can be used to understand what is important to people about a vineyard visit, if people visiting vineyards near renewable energy are including the infrastructure in their pictures, and if they photograph it whether it has an evident impact on their experience.
We used scraping tools to gather data from Instagram in wine regions including BC, Ontario (ON), and Nova Scotia (NS) to explore these questions, including analytical methods such as manual coding, statistical analysis, collage, photo editing, and saliency mapping (Mohammadi, 2021; Mohammadi et al., 2023). For one analysis we gathered all data for specific wine region hashtags but used timestamps, image, and text contents and account details to select a balanced mix of recent vineyard visitor and marketer posts including landscapes. For another, we used spatial analysis to identify vineyards near wind turbines and then those locations to extract posts and look manually for those including turbines. Below, this case study will be called the ‘vineyard/energy case’.
Evolving methods
In the above-applied problem domains, we have deployed three main categories of methods – thematic, spatial and visual – although individual studies often chain multiple methods together. We have used ‘lifestyle’ social media – specifically Instagram where people share their day-to-day life – rather than ‘opinion’ social media such as Twitter. We use Instagram because we have been more interested in how people live and how that may be affected by development, but also for practical reasons: the former tends to be geocoded to locations critical to our work, which are rural locations that rarely have dedicated much less popular hashtags. By contrast, platforms like Twitter have been increasingly leveraged in political expression, activism, and campaigning, serving as ‘a medium for talking and fighting about politics, organizing collective action, and showing support for, or critique of politicians and political issues’ (Jungherr, 2015: 16). Instagram posts include elements such as text and images that are common to many social media or sharing platforms, and thus the approaches we describe here are highly transferrable.
Thematic
Thematic analysis describes the process of generating categorical insight from qualitative data otherwise not amenable to quantification, for example, text datasets such as Twitter tweets or Instagram image captions, or the images themselves. Possible methods include manual, statistical, and computational tools.
Manual
Thematic coding is a popular method used in qualitative analysis in social science, including manual coding often for small datasets and automatic for larger ones (Chen et al., 2021). Leveraging software such as QSR NVivo or QDA Miner, researchers can use an inductive approach to generate theories or a deductive one to test them. Social media data, by nature, can be large, and thematic coding can help to reduce its complexity and develop an aggregate picture. However, manual coding can be time-consuming and labor-intensive. In the hydropower case, we spent 1 year manually filtering and coding 1793 Instagram posts for the Mactaquac case and 319 for the Site C, including captions and image contents. Where data are too large or time is too short, scholars may have to apply various subsampling strategies to reduce the data size for manual coding, such as randomized subsampling, narrowing to a shorter data collection time window, and using limited keywords (hashtags) to retrieve data (Chen et al., 2021). Resampling may also be advisable to reduce the impact of particularly high-posting behavior on the dataset. In the vineyard/energy case we started by scraping 30,000 posts across the NS and ON sites, everything ever posted for the two locations, but sampled only the most recent year and from each site chose at random 50 posts from visitors and 50 posts from industry insiders (such as vineyard owners) for detailed analysis.
Thematic coding is an efficient approach to understand social impacts that have been caused or anticipate those that might be caused by energy projects. In our hydropower case, we manually coded landscape features, human activities, and values from Instagram posts that were geo-tagged to the areas of dams and their (potential or actual) reservoirs. The results indicated that aesthetic value was most often expressed in both the pre-dam (i.e. the Site C Dam) and the post-dam (i.e. the Mactaquac Dam) landscapes, which speaks to the reason some people use Instagram (to share pretty pictures), but also suggested appreciation of both landscapes including adaptation to the relatively recent (1968) flooding of the reservoir at Mactaquac (Chen et al., 2018). While water, trees and varying topography were captured in both sites, the ‘domestication’ of the dam Mactaquac landscape relative to Site C was evident in more frequent capture of anthropogenic infrastructure. In our vineyard/energy case, we performed manual sentiment analysis for the vineyards in BC and NS where energy infrastructure was visible, and we found that infrastructure like wind turbines and solar panels installed in the visible distances of vineyards were not likely to trigger negative responses (Mohammadi et al., 2023).
Statistical
Relatively simple patterns can be discerned using thematic coding and conveyed with simple counts or quotations, but more complex pattern development will often require statistical analysis. For example, multiple correspondence analysis (MCA) is a multivariate statistical analysis to summarize a large dataset with multiple categorical variables into fewer numeric summary variables (it is based on principal component analysis, which only works on quantitative data, and correspondence analysis which is limited to two categorical variables). The main purpose of MCA is to reduce the complexity of analyzing and visualizing a large dataset by retaining only the most important information, so that a pattern of interrelationship among the variables can be recognized (Abdi and Valentin, 2007; Abdi and Williams, 2010). Hierarchical cluster analysis (HCA) is another multivariate statistical technique to group observations into clusters where each cluster is different from the others and all observations within a cluster have similarities. A common statistical analysis approach is to conduct HCA on the results of an MCA, a process known as hierarchical clustering on principal components (HCPC). MCA identifies the most distinguishing characteristics of your dataset (reducing the dimensionality), and HCA helps identify the similarities that remain and generate visual clusters (Argüelles et al., 2014). This approach is not always appropriate (e.g. if MCA shows only weak correlations).
We used HCPC in the vineyard/energy case and the dykeland/wetland case (Figure 2). In the vineyard/energy case, we found that the ‘vineyard experience’ is similar across geographies, given similar features and activities coded for images in the ON and NS vineyards, but also that visitors and industry insiders post similarly. This similarity suggested to us that there may be a recursive relationship between the two, what Ryan (2002) calls a ‘hermeneutic circle’, that images captured organically by users may be responding to those projected by marketers, and vice versa (Mohammadi, 2021). If this is true, marketers concerned about a wind turbine or solar panel near their vineyard could merely brag about it on Instagram and it might become a feature of the visitor experience. In the dykeland/wetland case, statistical analysis allowed us to discern distinct gender differences in who was using each of the alternative landscape options, and the uses were also different: men were using the wetland landscape for wildlife photography, while women were using the dykes and dykelands for active lifestyle and being with others, for instance (Chen et al., 2020). Such differences are important to understand to achieve equity in SIA outcomes.
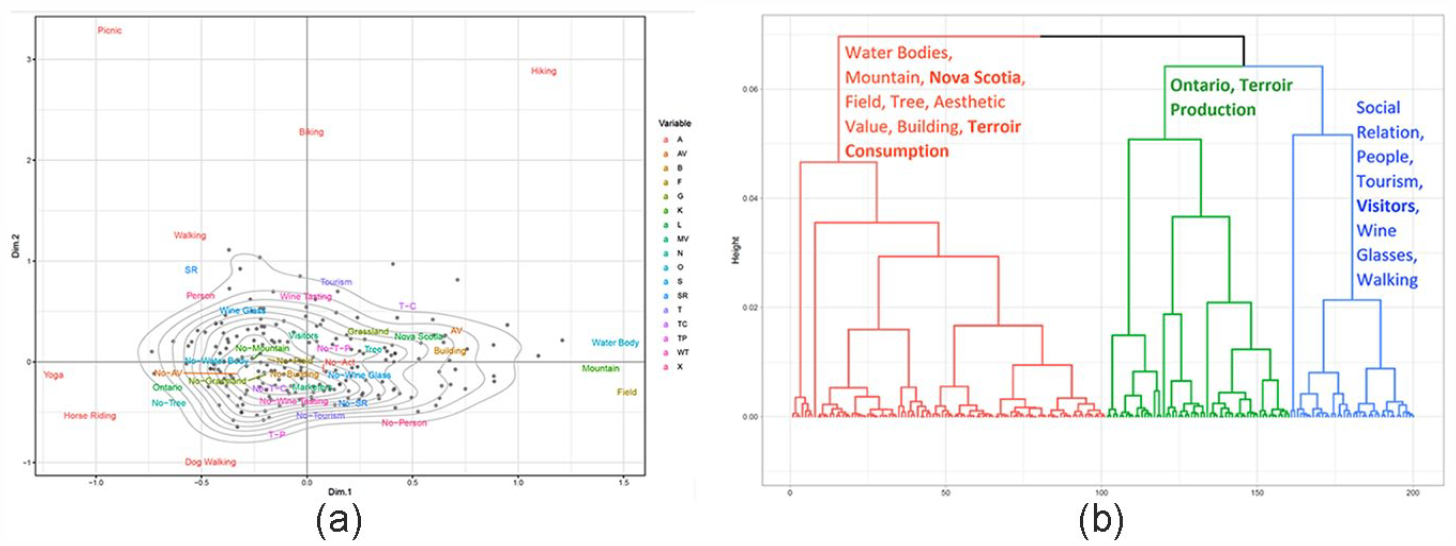
Statistical analysis of manually coded Instagram imagery from the vineyard case study, including (a) MCA Plots of the association between variables in the case studies and (b) cluster dendrograms of the association between variables in the case studies based on all data.
In the hydropower case, manually coded instances of landscape features, human activities, and landscape values were associated by Z-scores to establish what codes were more likely to be assigned to a single image than would be predicted given the prevalence of each code in the dataset overall. This method was adapted from Li and Stepchenkova’s (2012) work in tourism. It helped us to understand the relationships between different landscape features, activities, and values, anticipating the potential chain reactions if a single feature would be impacted by the hydropower proposal. For example, we identified that the aesthetic value in the Mactaquac area was significantly associated with riparian land along the reservoir. Thus, the dam removal proposal active at the time in Mactaquac (but no longer) might depreciate the aesthetic value of the current local landscape depending on the restoration plan. Similarly, the reservoir at Site C will cover the farmland and riparian land that we found were associated with aesthetics and users’ sense of home (Chen et al., 2019).
Computational
We acknowledge there is a blurry line between statistical data analysis and machine learning techniques, both often completed using R or Python. Our nomenclature is not intended to contribute to a semantic debate; rather, we recognize there is clearly a substantial jump from hierarchical clustering to the advanced capabilities of neural networks and the substantial computation required by sophisticated NLP.
NLP extracts the elements of interest from a large amount of text (Nazir et al., 2017). It allows the machine to process a natural language and translate it to a format that the machine understands and can process (Ghazizadeh and Zhu, 2020; Rajput, 2020). Thematic analysis using NLP analyzes text to extract themes or keywords to identify the topic, sentiment, or other important properties of the text. NLP borrows heavily from foundational subjects of study such as statistics, probability theory, and theory of computation (Ranjan et al., 2016). In general, the NLP process is conducted in four phases: text preprocessing, text representation, model training, and model evaluation. These NLP phases are usually performed by using existing automated tools (e.g. Google Cloud NLP, IBM Watson, and Microsoft Azure) or open-source software libraries, which package commonly used algorithms to be easily re-usable (e.g. in R or Python). For instance, a study by Brown et al. (2020) used R to investigate public landscape values and perceptions expressed on Twitter about culturally relevant places, such as parks, scenic vistas, and waterways. In the hydropower case, we are developing a machine learning approach to identifying public interaction with hydropower landscapes based on Instagram text posts, using a dictionary which assigns sentiments based on text of the post (SentiWordNet) to understand public sentiment and part-of-speech analysis to reveal human activities.
The most widely used machine learning is based on artificial neural networks, inspired by biological neural networks that work in the human brain (Heaton, 2015; Louridas and Ebert, 2016). Computer vision uses CNN to downsize an image while retaining the patterns of visual objects which can be identified based on the similarity of their features to features the neural network has previously ‘learned’ to recognize. Commercial computer vision products are well-developed and ready to use, such as Google Cloud Vision and Microsoft Azure. However, these pre-trained models are often not sufficient for anything but the most general image recognition tasks. Ongoing work on the hydropower case explores whether we can develop and successfully train a CNN model to identify landscape features from Instagram photos and videos with acceptable accuracy, compared with pre-trained commercial tools.
Spatial
Spatial analysis leverages the coordinates present in geocoded posts (a subset of all posts) on platforms such as Instagram, inferring from the location and contents of such posts the geographic patterns of landscape values or ecosystem service delivery. Other than the options discussed below, additional methods exist for using social media images including viewshed analysis (calculations of the footprint of photos on terrain) (for a review, see Zhang et al., 2020). Two we have deployed is hotspot mapping (i.e. photo density) and CES modeling (Figure 3).
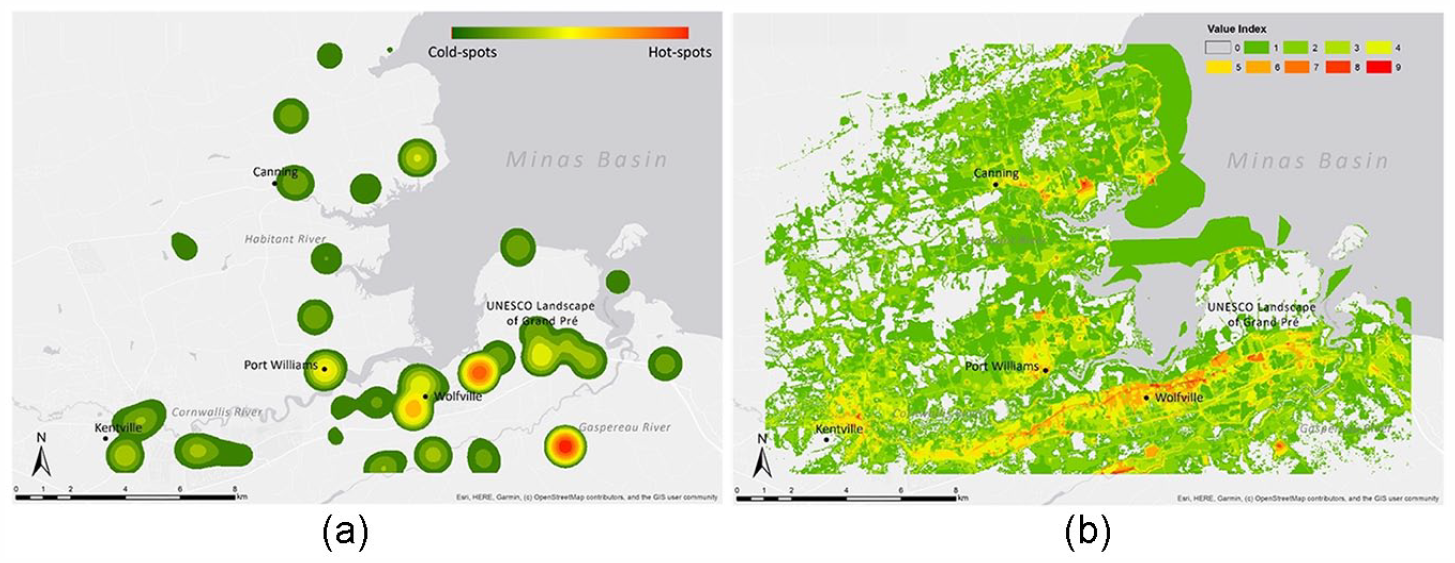
Comparative (a) hotspot (i.e. photo density) and (b) CES output maps from SolVES modeling for the service ‘sense of place and terroir’ from the dykeland/wetland case.
Hotspot mapping is a widely used technique that helps to display current patterns of social phenomena, such as CES and public participation GIS, as well as predict future events (Brown and Weber, 2012; Plieninger et al., 2013). Leveraging hotspot mapping in SIA can spatially aggregate place-specific perceptions, public attitudes, and preferences of various stakeholders, while preserving diversities among people, communities, and places (de Vries et al., 2013). There are many mature methods (e.g. Getis-Ord and Kernel density) that follow the same principle: the significance is weighted by a spatial matrix through calculations of location-specific counts and the distances of neighboring counts (Hart and Zandbergen, 2014). To overcome the problem of small sample data size in conventional data collection like surveys and interviews, the profusion of social media data can provide more aggregated and smooth social patterns. In the hydropower case, we used kernel density analysis to map the perceived landscape values manually coded from Instagram posts, revealing the locations where these values were most present (Chen et al., 2018). The results can help researchers understand the spatial patterns in their data, for instance, how they are influenced by population density, but also can help decision-makers to predict how proposed projects can impact locals and visitors by changing the landscapes and land uses.
CES assessment and mapping can be used to identify spatial units of service provision, areas where trade-offs and synergies occur, and priority areas that require targeted management (Vorstius Anne and Spray, 2015). The SolVES model, jointly developed by the USGS Geoscience and Environmental Change Science Center, is a tool for assessing, quantifying, and mapping various CES (Sherrouse and Semmens, 2015). Typically, from a combination of spatial and nonspatial responses to social surveys, SolVES develops a quantitative 10-point value index. Geotagged social media data can provide a large amount of point-level data, often from demographics under-reached by traditional social science methods. In the dykeland/wetland case, after completing text searches to associate CES keywords to point-level social media data, these data points were entered into SolVES as if they were survey data. We then compared CES spatial delivery patterns for dykelands and tidal wetlands through spatial overlays of target landscapes and CES modeling results. The findings can provide trade-off information when making decisions about dykelands.
Visual
Visual approaches include ways of summarizing, editing or processing social media post contents, images, and captions, to generate or communicate insight, for instance, to help identify important terms, highlight important features, or understand the implications of certain features in a posted image.
Much Big Data research (by comparison with the ‘small data’ methods described under manual coding) using social media revolves around word use and NLP, but it can be difficult in novel problems or domains to know which words will be important to look at. Visual exploration tools, like word clouds where words are displayed in size proportional to their frequency, can help identify terms that are endogenous to a context but otherwise unfamiliar to the researcher or SIA practitioner. Single terms alone can often be ambiguous in their usage. An n-gram is a word list of n length, so a 2 gram (or bigram) is a two-word pair, which tends to be much less ambiguous. Words clouds of 1- and 2-grams were used in the dykeland/wetland case to identify the words and word pairs within the captions of geocoded Instagram posts suitable to associate with each CES before the spatial analysis (Zhao et al., 2023).
Visual analysis tools can be used in numerous ways relevant to SIA, beyond computer vision. It has been relatively common to use photographs in studies of landscape quality, for instance, in photo-based surveys, and such photographs could be gleaned from users on social media (with permissions sought for use). Sometimes those photos are edited to remove or add features, for use in experimental treatments to understand the implications of target infrastructure (Molnarova et al., 2012). Where photo-based surveys suffer from issues of cost, response rate, and subjectivity, saliency maps may provide additional insight. Saliency maps are photo-processing techniques that provide a grayscale picture of each cell in an input image, indicating how prominent it is to the human eye (Xu and Wittkopf, 2014). In the vineyard/energy case study, we found images of wind turbines and solar panels captured in Instagram posts at vineyards, digitally removed the infrastructure, and calculated the impact that the infrastructure removal had on the salience of that part of the image it had comprised (Mohammadi et al., 2023). The approach illustrated that solar panels are generally less prominent, even where large in the image, compared with wind turbines of a similar size. This technology-specific insight can inform SIA.
Visual presentation tools can also help communicate patterns to an audience. For example, social media research has obligations to respect both privacy and copyright. Including sample images in research using social media provides a vicarious sense of the dataset, but risks violating privacy and copyright (Chen et al., 2021). If individuals cannot be individually reached to secure permission, as is sometimes the case with social media, an alternative may be the use of collage with publicly available images. In the vineyard/energy case study we found through manual coding that linear vine patterns dominated the landscape photos captured by visitors. Instead of including one such image as an example, we mosaicked 16 different posted images together to convey its dominance without revealing any individual one (Mohammadi, 2021) (Figure 4). On the horizon lie new approaches for such visualization within the domain of ‘generative AI’: programs such as DALL-E that do text-to-image mapping with surprising realism. Thus sample images could be generated for publication without reference to any specific user post, though the artificial intelligence (AI) may have ‘learned’ how to do it (i.e. been trained) using such owned content.
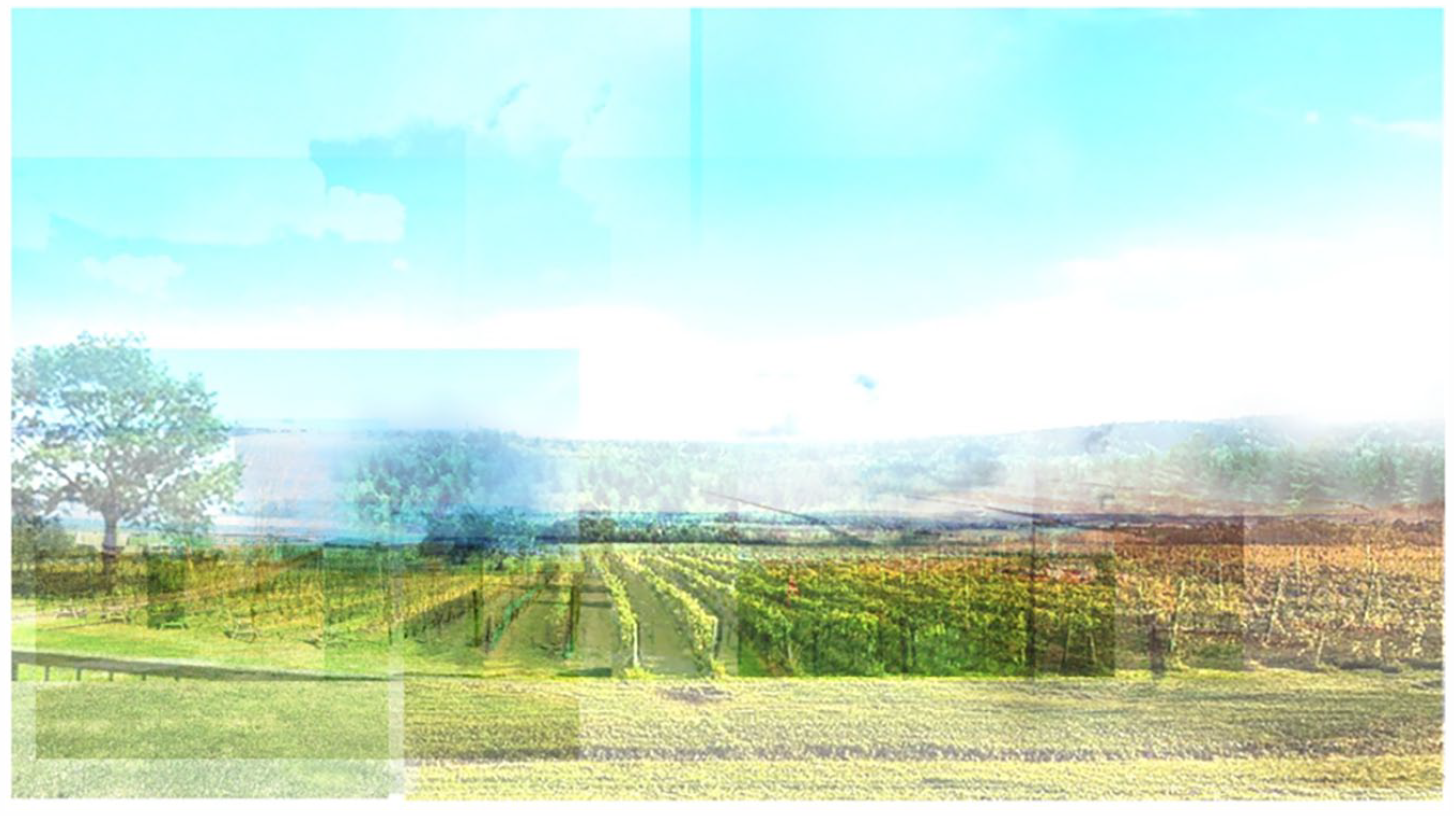
Collage, made using photo-editing of 16 different Instagram photos of the top-coded feature in the vineyard case study, linear vines, including a seasonal progression from left to right. Visual methods such as these could help balance copyright and privacy expectations of users in data presentation.
Integrated workflows
Typically, a viable social media SIA approach will involve chaining multiple of these methods. Sample workflows are shown in Figure 5 for the hydropower case. This figure shows how key steps such as data collection, filtering or re-sampling, analysis, and visualization can draw on a range of elements of the data corpus itself as well as a range of variously complex approaches. Analysis and visualization are combined because in a real process there is often iteration between those phases, and indeed the visualization can inform analysis in the first instance. For instance, visualizations such as word clouds can be used in early decision-making about filtering or coding.
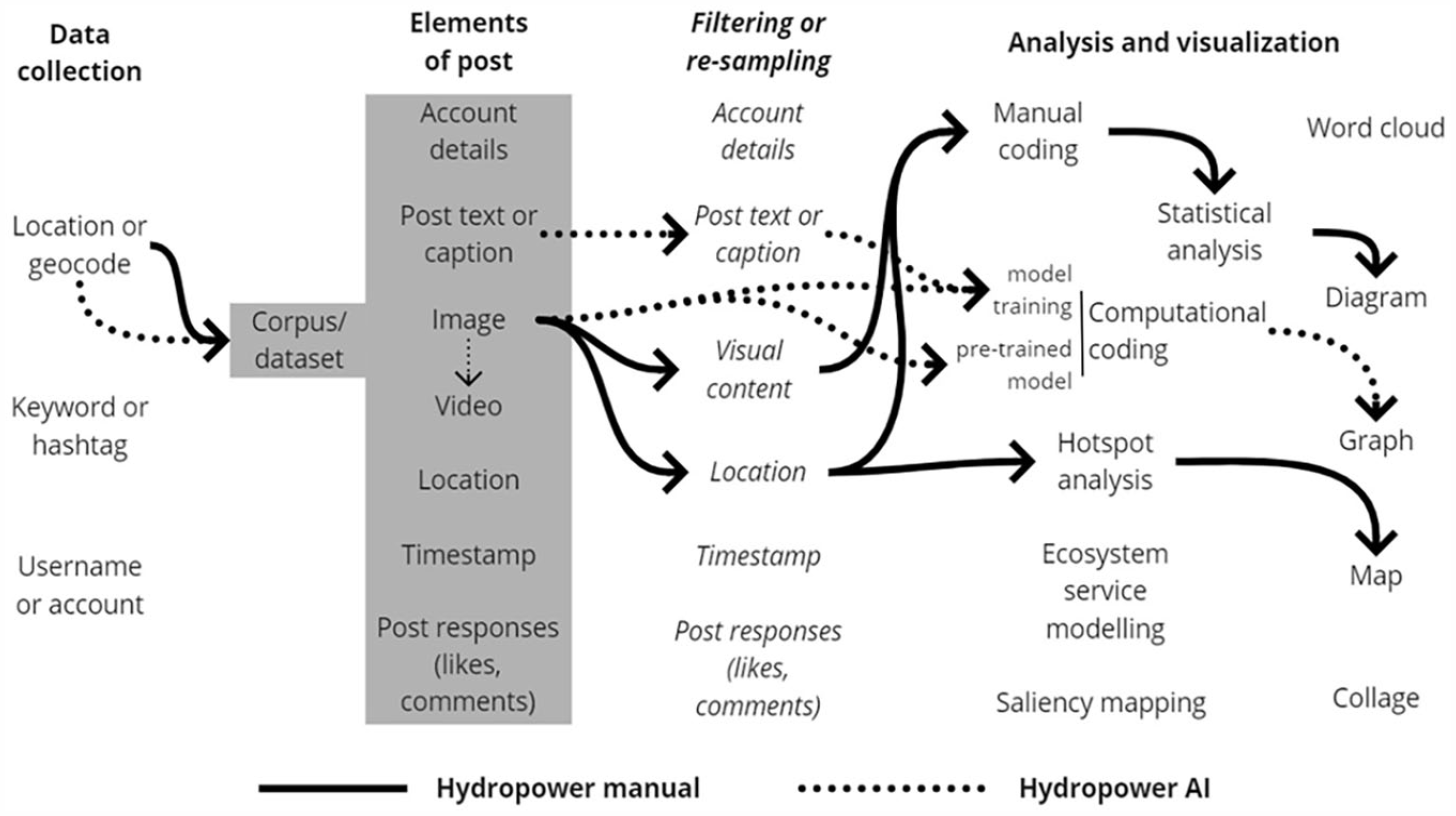
Sample workflows from the hydropower case presented, including manual and AI approaches.
Conclusions, challenges, and opportunities
SIA practice has not yet engaged with the potential presented by social media platforms such as Instagram. We presented lessons for SIA on addressing this gap based on a decade of work across Canada on three resource management case studies. As we have demonstrated using Instagram, a wide range of approaches exist for gathering, analyzing, and generating insight from social media data, some of which is ill-suited to the typical social scientist’s toolkit, such as computer programming. Collaboration can help overcome skill-based challenges, but many others remain if we are to fully take advantage of the opportunities social media presents for SIA practice. The main challenges include social media data accessibility, bias in social media samples, data noise, the mutable online environment, steep learning curves, and legal risks. The opportunities include video analysis, improving accessibility to deep learning approaches, and more active engagement with social media users on SIA.
Challenges
Social media data accessibility for research has narrowed during the past decade, though this varies by platform (e.g. Twitter has become more open while Facebook has set increasing restrictions) (Freelon, 2018). Social media platforms have not been proactive in ensuring researchers have access to their data. Although collaborations between academic and technology companies have been attempted (e.g. Social Science One, a program hosted by Harvard University to share Facebook data with researchers), the wider research community has yet to benefit due to the complicated application and review processes involved (Acker and Kreisberg, 2020). There are steps that researchers, social media platforms, and governments can take to address this problem, but specific to SIA there is a strong case for a legislated requirement to provide access to social media data to support the impact assessment of public projects.
Bias in social media data samples is pervasive for many reasons. Not only does the digital divide happen between people who use social media and those who do not, but different platforms have various user groups: Twitter has more than half of its users older than 29, while Instagram has more younger users with only 35% above age 29 (Pew Research Center, 2021). Motivations differ for using different social media platforms, like Twitter for engaging in public discourses and Instagram for documenting daily lives (Chen et al., 2018). The choice of social media dataset should be deliberate, and data should be triangulated using other methods or data sources for important topics such as SIA (Sherren et al., 2017). For instance, the gendered observations present in the dykeland/wetland case were consistent with those emerging from survey-based work a few years earlier (Chen et al., 2020; Sherren et al., 2016).
Another social media data challenge for SIA is noise, including irrelevant (e.g. marketing) and meaningless ‘babble’, oversampling from a single account, misleading contributions from bot accounts (i.e. automated programs engaged in social media to mimic human users), and situations where geo-location information is mismatched with the visual content (Chen et al., 2021). In the example of the hydropower case, many landscape photos were uploaded in and tagged to hotels and restaurants due to Wi-Fi accessibility at those sites (Chen et al., 2018), and our NLP analysis found unexpected high posting behavior about bodybuilding in Site C and yoga and dog grooming in Mactaquac. Strategies applied to filter raw data are often more delicate and complicated in social media-sourced research than in conventional methods. That said, a certain amount of data noise is inevitable, and must be considered before reaching any conclusions. Dominant themes in large datasets are less affected by noise; small datasets are more easily skewed. When leveraging machine power and algorithms in large-scale data filtering and analysis, social scientists who have little computing background can easily face data challenges and risk producing biased results. Choosing an unsuitable model or using inappropriate training sets can steer SIA to erroneous conclusions (Männistö et al., 2022). For instance, when using pre-trained and commercial AI products (e.g. Google Cloud Visions), the results may not always be satisfying but we are not able to adjust the algorithms behind them (Vigl et al., 2021). Machine learning methods have a significant computation footprint, especially for video and image data, placing constant pressure on projects with limited funding.
The ever-changing online environment and the fast-mutating social media platforms present researchers and policymakers interested in SIA with difficulties in drawing longitudinal insights and demand collaboration among themselves (e.g. data and skill sharing) and with computer scientists (e.g. data collection and analysis model building). Discontinuities in data accessibility caused by changing popularity of plaforms, API changes and fast-altering and -deleting posting behavior on social media challenge researchers who conduct long-term studies (Walker, 2017). Instead of heavily depending on a single unstable data source, combining multiple methods and data sources (e.g., conventional media) may tell more complete and true stories (Pimentel da Silva et al., 2021). Regardless of data type, the learning curve to master programming and building machine learning models is steep, and knowledge and skills acquired can be quickly outdated. While computational social scientists are more comfortable with this work, we believe a more general strategy is interdisciplinary collaboration. In several of our projects, students from social science and computer science backgrounds have worked together on data collection from Instagram and machine learning analysis.
While there were early concerns about the validity of using social media data in sociology research, the use of social media data has significantly increased, especially since 2017 (Chen et al., 2021; Ghermandi and Sinclair, 2019). The current conversation is less about the potential value of social media data and more on the unclear ethical and legal grounds. Conventional research ethics review may not serve social media data well in the context of ‘public data’ and ‘research participants’. There are legal risks regarding violating terms of service, overusing APIs, and benefiting from scraping tools. Researchers have received cease-and-desist letters (Horwitz, 2020), and lawsuits remain possible until these issues are addressed.
Opportunities
Analysis of social media data for SIA has focused on text, and more recently images. Video is increasingly being shared through social media platforms as well as open webcams, and these datasets offer opportunities to monitor development landscapes and public experiences, including for post-construction infrastructure monitoring. In computer vision, ‘human activity recognition’ concerns the classification or prediction of human action. Using the technology, video samples can be analyzed to assess human activity and how it is changing, and what we can infer about lifestyles, values, and perceptions. In addition to videos shared on social media, video monitoring of sites of interest (with appropriate signage and ethics approvals) could provide a novel source of information both pre- and post-construction.
Social scientists work within the constraints and possibilities of a fast-growing social media landscape. Just recently, Meta launched a new platform to rival Twitter, called Threads, and Twitter has been bought by Elon Musk and renamed X. To tackle the difficulties that appear in data collection and analysis of large-sized datasets, programming, machine learning, and deep learning technologies are often required. We framed this as a challenge first, but it is also an opportunity: social scientists who have non-technical backgrounds have increasingly sought opportunities to work with computer scientists or trained themselves as computational social scientists (Steen-Johnsen and Enjolras, 2015; Weller and Kinder-Kurlanda, 2015). For those not technically inclined, there are many user-friendly tools available, such as Voyant Tools for text analysis and Google Cloud Vision for image feature detection. Some of these tools are cost-prohibitive when dealing with large amounts of data, however. In the future, the publishing of algorithms in easy-to-use formats and sharing of models are expected to reduce the technical barriers for a wider research and practitioner community.
Potential collaboration between academics and social media companies may benefit SIA and society at large, if the data can be legally, ethically, wisely, and innovatively used for social good. Although technology companies lack the motivation to share data pro bono, some have funded projects such as Social Science One, a university-hosted organization to help scholars to retrieve research data from Facebook (King and Persily, 2020). For industry collaboration, such projects are a good place to begin, but they are not enough: less influence from industry in the decision-making of data distribution is necessary to retain researcher independence. We also believe there is a role for government to intervene to secure access to such datasets for public good research.
Finally, the passive gathering of information as described here falls far short of the public participation in SIA envisioned by The Practitioner’s Guide to Federal Impact Assessments under the Impact Assessment Act (Impact Assessment Agency of Canada, 2020). Although active uses of social media are excluded from this article, that mode presents additional untapped opportunities for SIA. Citizen science is popular in the natural sciences but rare in social science (Heiss and Matthes, 2017; Tauginienė et al., 2020). It is possible that we can develop an SIA protocol that broadens participation, particularly within youth audiences, if we work largely within popular platforms, rather than extracting data for analysis outside. Such approaches should critically amplify local voices as expressed online (e.g. through sharing functions, hashtags, etc.) rather than imposing outsider (or proponent) views or scenarios for comment or feedback.
Footnotes
Funding
The authors disclosed receipt of the following financial support for the research, authorship, and/or publication of this article: Funding is acknowledged from a Social Sciences and Humanities Research Council of Canada (SSHRC) Insight Grant (435-2018-1018, 2018-2022) (YC and KPG), a SSHRC Insight Development Grant (430-2018-0035, 2018-2020) (MM), Nova Scotia Graduate Scholarship (YC, KPG), Parya Scholarship (MM), and the China Scholarship Council (QZ). Additional thanks to collaborators John Parkins and Keahna Margeson for related discussions.