
Abstract
Understanding whose eyes make up the ambient population is an important development of crime opportunities research. We hypothesize that regularity at train stations will influence place-awareness and therefore the balance between potential crime offenders, targets, and victims in the ambient population. Drawing on one year of travel card and police-recorded crime data we examine the association between percentage of regular passengers and crime at 134 train stations, controlling for land use and neighborhood social demographic characteristics. We find regularity has a buffering impact on theft and property damage at stations but this effect is curvilinear in the case of theft. Regularity was not associated with assault or motor vehicle crime, we discuss implications for theory and practice.
Introduction
Public transit networks operate as the veins of the city by distributing passengers from one station to another at scheduled intervals throughout the day. While transit stations can evoke connotations of crowds, chaos, and crime risk, a sizeable proportion of passenger behavior is highly routinized (Foell et al., 2016). Regular passengers, those who frequent the same stations at similar times on multiple days of the week, emerge as a function of social structures, and place-time appointed activities that constrain daily mobility and facilitate repeated use of the same places (Hagerstrand, 1970). Regularity, relative to irregular travel, is associated with prior place knowledge and may influence opportunities for crime at stations by altering the balance between potential offenders, targets, and guardians in the ambient population (Wo et al., 2022). Regularity can increase awareness of place norms and routines, which for individuals with some crime readiness, can facilitate crime offending (Brantingham & Brantingham, 1993; Kinney et al., 2008). However, it is also possible that place awareness and sociality developed through regularity can increase passengers’ willingness and capacity to act as informal crime guardians (Felson, 1995; Reynald, 2010, 2011; Solymosi, 2018).
Guardians are individuals who can deter crime through presence, monitoring, and informal intervention (Felson, 1995; Reynald, 2010). Guardianship can be active or passive and individuals vary in their capacity and willingness to act as crime guardians in a given situation (Hipp, 2016; Hollis-Peel & Welsh, 2014; Pattillo, 1998; Reynald, 2010, 2011). Research shows that regularity at places in residential neighborhoods, can facilitate sociability with fellow residents which can help generate a sense of community, shared identity, and collective morality that increases guardianship (Blokland, 2003; Lofland, 1998; Williams & Hipp, 2019). Thus, at transit stations, opportunities for crime may also vary depending on the proportion of regular compared to irregular passengers.
The link between transit stations and crime is well established. Scheduled services coupled with the compact, often enclosed, physical environments of transit platforms make stations primary points of convergence for individuals engaged in travel within any urban environment (Gallison & Andresen, 2017). When other elements of the social and physical context, such as poor lighting (La Vigne, 1996; Loukaitou-Sideris et al., 2001), crowdedness (Ceccato & Uittenbogaard, 2014), and/or co-location with risky facilities (Block & Davis, 1996; Ceccato, 2013; Newton et al., 2015; Zahnow & Corcoran, 2019) combine to provide a conducive setting, this convergence can readily result in a crime event. Spatio-temporal patterns of crime across transit networks loosely accord with the Pareto principle (Eck et al., 2007), with the majority of crime events occurring at a small number of risky stations, within a particular time-window (Ceccato & Uittenbogaard, 2014; Newton et al., 2014; Uittenbogaard & Ceccato, 2014). Temporally, crime at transit stations tends to cluster on late evenings and weekends (Uittenbogaard & Ceccato, 2014) outside the hours of the regular daily commute and when the ambient passenger population is low. A number of studies investigate the association between passenger presence (Zahnow & Corcoran, 2019; Zhang et al., 2022), population flows (Boivin & Felson, 2018; Uittenbogaard & Ceccato, 2015), crowdedness (Ceccato et al., 2022), and crime at transit stations. Results demonstrate that the relationship between passenger presence and crime is highly dependent on crime type. While property offences, such as pick-pocketing and theft from persons, are positively associated with ambient population volume (Ceccato et al., 2015; Loukaitou-Sideris et al., 2001; Newton et al., 2015; Zahnow & Corcoran, 2019), violent offences tend to occur at stations and/or times when the ambient population is low or absent (Ceccato et al., 2022; Ceccato & Uittenbogaard, 2014; Mohamed & Stanek, 2020).
Routine activity (Cohen & Felson, 1979) and crime pattern theories (Brantingham & Brantingham, 1995) provide the foundations for understanding how the presence and volume of people at places (i.e., the ambient population) can influence crime. Yet, much remains unknown about the extent to which people in the ambient population come to occupy particular crime roles (Hipp & Williams, 2020). To date studies on crime at urban places such as transit stations, do not account for variations in the regularity or intensity of place frequentation among the ambient population. Empirically, these studies assume members of the ambient population possess equal potential to act as either one of the crime offender, target, or guardian.
The aim of this study is to examine the extent to which passenger regularity, relative to irregular travel, is associated with crime occurring at train stations across a city network, while accounting for the neighborhood, land use, and spatial context of the station. Using smart card travel data aggregated to the station level and crime data across 134 train stations we investigate the association between the weekly proportion of regular passengers at stations and the presence of theft, property damage, assaults, and motor vehicle crimes occurring at stations (100 m radius from the station centroid encompassing station platform, entry, and attached car park). We estimate mixed effects logistic regression models accounting for within station variation in weekly rider regularity and between station variation in co-located land use and neighborhood sociodemographic characteristics.
Research suggests that public and place familiarity developed through regular presence at places like stations can strengthen sense of community and collective morality (Blokland, 2003; Lofland, 1998; Oldenburg, 1989; Williams & Hipp, 2019). Applying this perspective, regular individuals in the ambient population may be more likely to act as informal crime guardians. Drawing on this perspective we hypothesize that a higher percentage of regular passengers may reduce the likelihood of crime at train stations by (1) facilitating guardianship and (2) reducing anonymity. However, crime pattern theory suggests that individuals with a crime-readiness who frequent places may have a heightened place-awareness that makes them more likely to be a potential offender (Brantingham & Brantingham, 1995). Thus, we suggest that in some contexts or conditions regularity may be associated with higher crime. Specifically, we suggest that when overall passenger volume is high and stations are crowded, higher regularity may be associated with greater likelihood of crime because the station environment may (1) afford anonymity to be retained; and (2) fail to support sense of temporary community, and therefore active guardianship, that emerges through familiarity and recognition of shared purpose (Augé & Conley, 2002; Sztompka, 1999).
Regularity is at the center of daily life and plays an essential role in both pro-social and deviant behaviors. A better understanding of the extent to which regularity relative to irregularity at places influences crime, dependent on the broader locational context, can help to establish interventions to better leverage ambient populations for crime prevention and public safety. This study can begin to understand the importance of regularity for safety at micro-places and inform scholarship on temporary place-communities.
Background Literature
Crime at Transit Stations
As central nodes of population flow, transit stations provide the necessary ingredients for crime; the convergence of crime-ready individuals and attractive targets in the absence of capable guardians (Cohen & Felson, 1979). Empirical evidence links transit stations, to heightened crime risk due to their propensity to generate high population flow around scheduled service times at regular intervals throughout the day. By virtue of this legitimate function, transit stations bring potential offenders and targets into contact in the context of the enclosed station environment facilitating opportunities for crime. Crime is highest at stations where the social and physical characteristics of the station (for example, poor visibility, low lighting, absence of passenger interaction), its surrounding environment and the neighborhood in which it is located impede guardianship capacity, facilitate offender anonymity and increase the volume of attractive targets (Block & Block, 2000; Ceccato et al., 2015; Hart & Miethe, 2014; Loukaitou-Sideris et al., 2002; Newton et al., 2014).
Transit stations that are located nearby risky land uses or facilities such as bars, shops, car parks, and schools are more likely to experience crime because these co-located facilities generate high flows of visitors who serve as attractive targets (Adams et al., 2015; Boivin & Felson, 2018; Ceccato et al., 2022). For example, while New York subway stations co-located with schools experience peaks in robberies at approximately 3 pm, subway stations co-located with late night trading centers experience highest robbery at 1am, correlating with the centers’ closing time (Herrmann, 2015). In both cases the temporal robbery peaks, reflect the operating times and subsequent population flows related to the nearby risky facilities. Crime targets at stations can include other passengers and employees (person offences) or the station facilities (property damage). Different types of crime tend to cluster at and around stations, under different spatial and temporal conditions (Ceccato et al., 2022). Bus stops co-located with parks, schools, and open public spaces, experience higher levels of damage and vandalism (Newton & Bowers, 2007), as do those located near liquor stores, alleys, and vacant buildings (Loukaitou-sideris, 1999). Alternately, bus stops co-located with car parks are at higher risk of theft and drug offences (Zahnow & Corcoran, 2019).
Station location, in relation to the city center and characteristics of the neighborhood in which stations are located can also influence crime risk. Stations located in city centers tend to experience higher crime than middle and end stations (Newton et al., 2014). Stations on the network periphery tend to experience higher property-based offences such as vandalism and damage, particularly in the late evening when they are denuded of passengers. Alternately, stations in the inner-city record higher person-targeted crimes including pickpocketing and robbery (Ceccato et al., 2013). This is likely due to passenger volume and the malignant mix (Adams et al., 2015) of facilities and land uses located nearby stations in city centers. The mix of risky facilities located nearby stations in inner-city neighborhoods can increase passenger flow into the late evening and may radiate crime onto the station (Bowers, 2014; Hart & Miethe, 2014). Low levels of residential land use in inner-city neighborhoods can also impede informal guardianship at stations and facilitate offender anonymity (Taylor et al., 1995). Violence, including robbery and assault, are higher at transit stations located in socially disorganized neighborhoods (Loukaitou-Sideris et al., 2002) where informal guardianship (collective efficacy) is low (Gerell, 2018; Hart & Miethe, 2014).
Scholarship suggests, crime opportunities in transit environments are inherently linked to population flows (Gallison & Andresen, 2017). Contextual conditions across spatial and temporal scales influence the presence and absence of passengers at times and stations and in turn this effects crime. Empirical research has documented the association between crime risk at stations and population flows, also referred to as crowdedness (Ceccato et al., 2022), passenger presence (Zahnow & Corcoran, 2019; Zhang et al., 2022) and ambient population. These studies have demonstrated that the association between passenger volume and crime at stations is complex. While a larger ambient population in transit environments can deter some types of crime (e.g., vandalism, damage), when the volume of passengers surpasses a particular level, crowds may impede visual sightlines and the ability to identify individuals thereby increasing opportunities for other crime types (e.g., pickpocketing, groping). Evidence shows that nearly empty transit environments have higher risk of violent and sexual assaults (Mohamed & Stanek, 2020), robberies (Clarke et al., 1996), and social disorder such as nuisance (Ceccato et al., 2013; Zahnow & Corcoran, 2019). These findings suggest that the absence of other passengers to act as crime guardians can increase the likelihood of crime (Ceccato et al., 2022). At the other end of the continuum, large ambient populations in transit environments can increase the risk of pickpocketing and theft (Ceccato et al., 2015; Loukaitou-Sideris et al., 2002). This relationship reveals that the capacity of present passengers to act as guardians may be impeded when crowd density is too high. It is worth noting that the curvilinear effect of the crowd on crime at stations is not apparent in all settings. Gaylord and Galliher (1991) found that in Hong Kong, all crime decreased with crowdedness.
These studies shed some light on the influence of ambient populations at stations on crime but the extent to which individuals within the population qualify as a potential offender, suitable target, or capable guardian remains unclear (Hipp & Williams, 2020). The characteristics of a place and the neighborhood that surrounds it can influence motivations to commit crime and guard against it. Studying ambient populations at the neighborhood level, Song et al. (2021) found that when ambient population was measured as visitors, employees, and residents, visitor presence was more strongly associated with higher crime in neighborhood grids then employee or resident presence. Similarly, Wo et al. (2022) study of geo-tagged twitter data revealed found that when the composition of the ambient population, measured as density of Twitter users within a neighborhood block, comprised a greater percentage of insiders, described as individuals who were frequently located within the neighborhood, compared to infrequent visitors (outsiders) crime was lower. This emerging work begins to demonstrate that regularity or familiarity with place among people in the ambient population can influence how the crowd effects crime risk. Likely, this occurs by influencing the extent to which individuals in the ambient population occupy the role of potential offender, target, or guardian (Hipp & Williams, 2020). Song et al. (2021) suggest that visitors are more strongly related to higher crime because their lack of place awareness makes them attractive target for thieves. Wo et al. (2022) interpret their findings to suggest that insiders, represent potential guardians while outsiders are more likely to be potential offenders. They suggest this is because infrequent visitors (outsiders) maintain anonymity and weak attachments to the area which reduces the likelihood of detection. Alternately, insiders, those who spend most of their time in the neighborhood would be aware of the social norms, have an investment to maintaining the collective good of the neighborhood and therefore be more likely to represent a potential guardian.
Studies on social places within residential neighborhoods also find that frequent and/or regular visitation can generate opportunities for sociability and the development shared social norms (Oldenburg, 1989; Williams & Hipp, 2019). Applying this logic, regularity may reduce opportunities for crime at stations by facilitating cohesion and active guardianship among the ambient population (Solymosi, 2018). Ethnographic and observational studies conducted within transit environments support this perspective (Augé & Conley, 2002; Benediktsson et al., 2020; Connor & Tewksbury, 2012). Connor and Tewksbury (2012) argue that regular passengers come to recognize each other as fellow transit riders and collectively engage in behaviors that encourage conformity (Connor & Tewksbury, 2012; Ocejo & Tonnelat, 2013). Regularity at transit stations affords repeated encounters with fellow passengers which supports a sense of public familiarity (Blokland, 2003): 93), temporary community, and collective morality (Blokland, 2003; Lofland, 1973; Sztompka, 1999). Social order impressed by even a small temporary community can enforce obligatory conformity by others who are less familiar with the setting (Augé & Conley, 2002). Benediktsson et al. (2020) describe how passive and superficial interactions between passengers effectively maintains social order and a sense of conviviality on New York subways. However, they also note that when passenger volume becomes too high this mechanism of informal guardianship and social control is stymied and instead anonymity is afforded by the crowd (Benediktsson et al., 2020).
Current Study
Understanding the social impacts of daily mobility at every day places is necessary to better leverage ambient populations for crime prevention and public safety. In this paper we draw on one year of smart card travel data and police-recorded crime data to examine the association between the weekly percentage of regular passengers and recorded theft, property damage, assault, and motor vehicle crime at train stations (100 m radius from centroids). We include measures to capture co-located land use at the station level and social demographic characteristics at the neighborhood level. Regularity at stations can increase awareness of opportunities for crime that when coupled with some crime readiness, the presence of a suitable target and the absence of capable guardianship may trigger a crime event (Newton et al., 2014). Yet, crime may be hindered when regularity among the station population is sufficiently high to facilitate guardianship. Regularity may enhance guardianship willingness and capacity by (1) reducing perceived anonymity among potential offenders; (2) increasing capacity to monitor and identify unusual behavior, (3) enhancing sense of temporary community and willingness to act as a guardian.
Methods and Data
Study Site
Brisbane City is the state capital of Queensland and is the third largest city in Australia with a population of approximately 2.4 million at the most recent census (ABS, 2021). The Greater Brisbane Region comprises inner city areas that are dominated by commercial and retail land use and outer suburban regions that are largely low density residential. The Greater Brisbane Region is connected by a passenger train network that extends from the Brisbane City center to the Sunshine Coast in the north, Gold Coast in the south and inland to Ipswich City (Australian Bureau of Statistics, 2016). It comprises 137 1 passenger stations located within 96 statistical areas level 2 (SA2s) (referred to in this study as neighborhoods). In 66 of the 96 neighborhoods in the study, there is one train station. In 26 neighborhoods there are two train stations and in six neighborhoods there are three train stations. The closest two stations in the network are located 1.4 km (Euclidian distance) apart (see Figure 1 for map of Greater Brisbane Region train network).
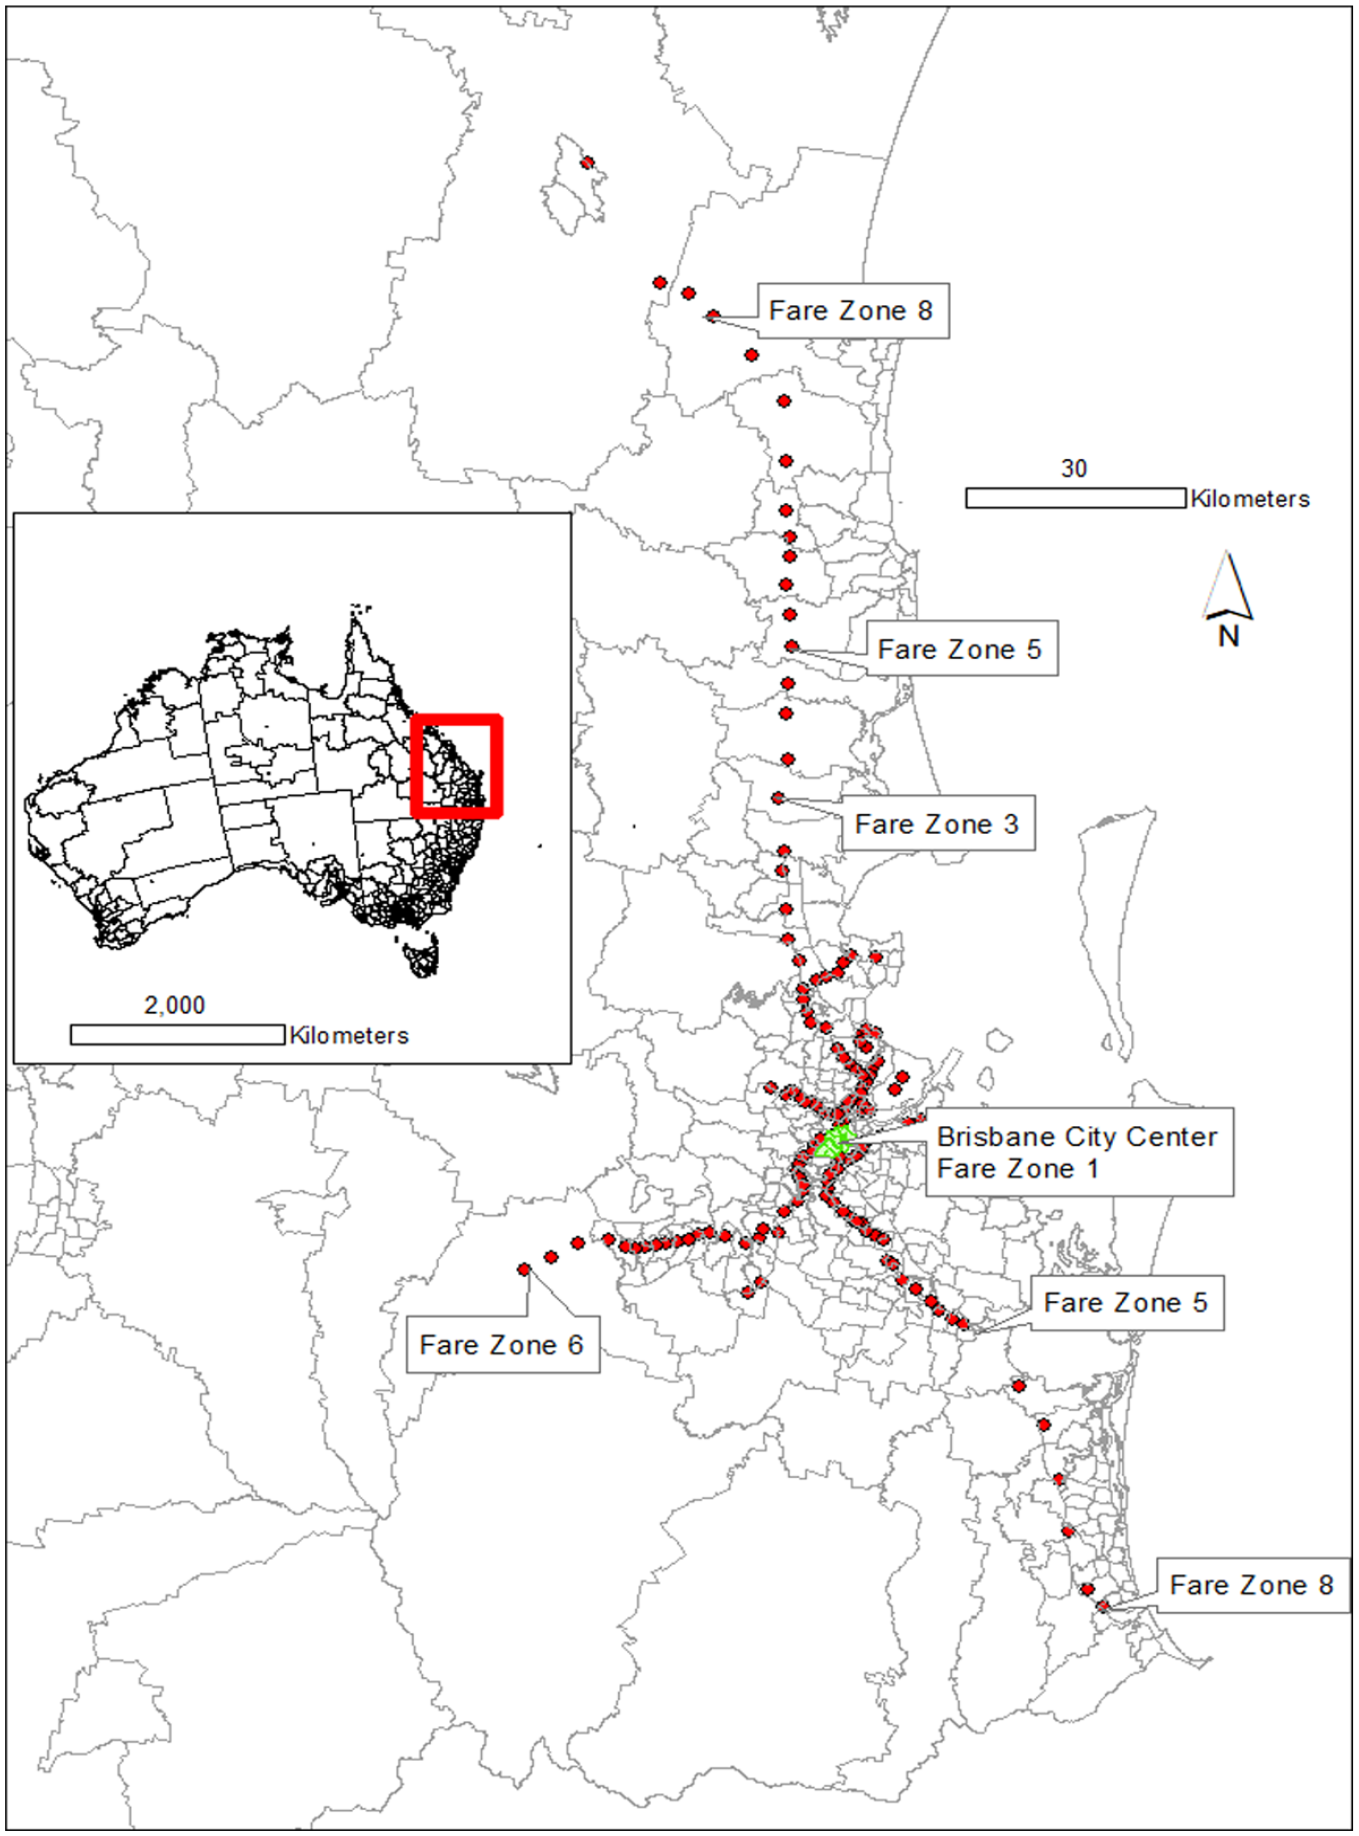
Map depicting the study site: Greater Brisbane Region train network and neighborhood locations. Fare zones increase with distance from the Brisbane City Center.
Data
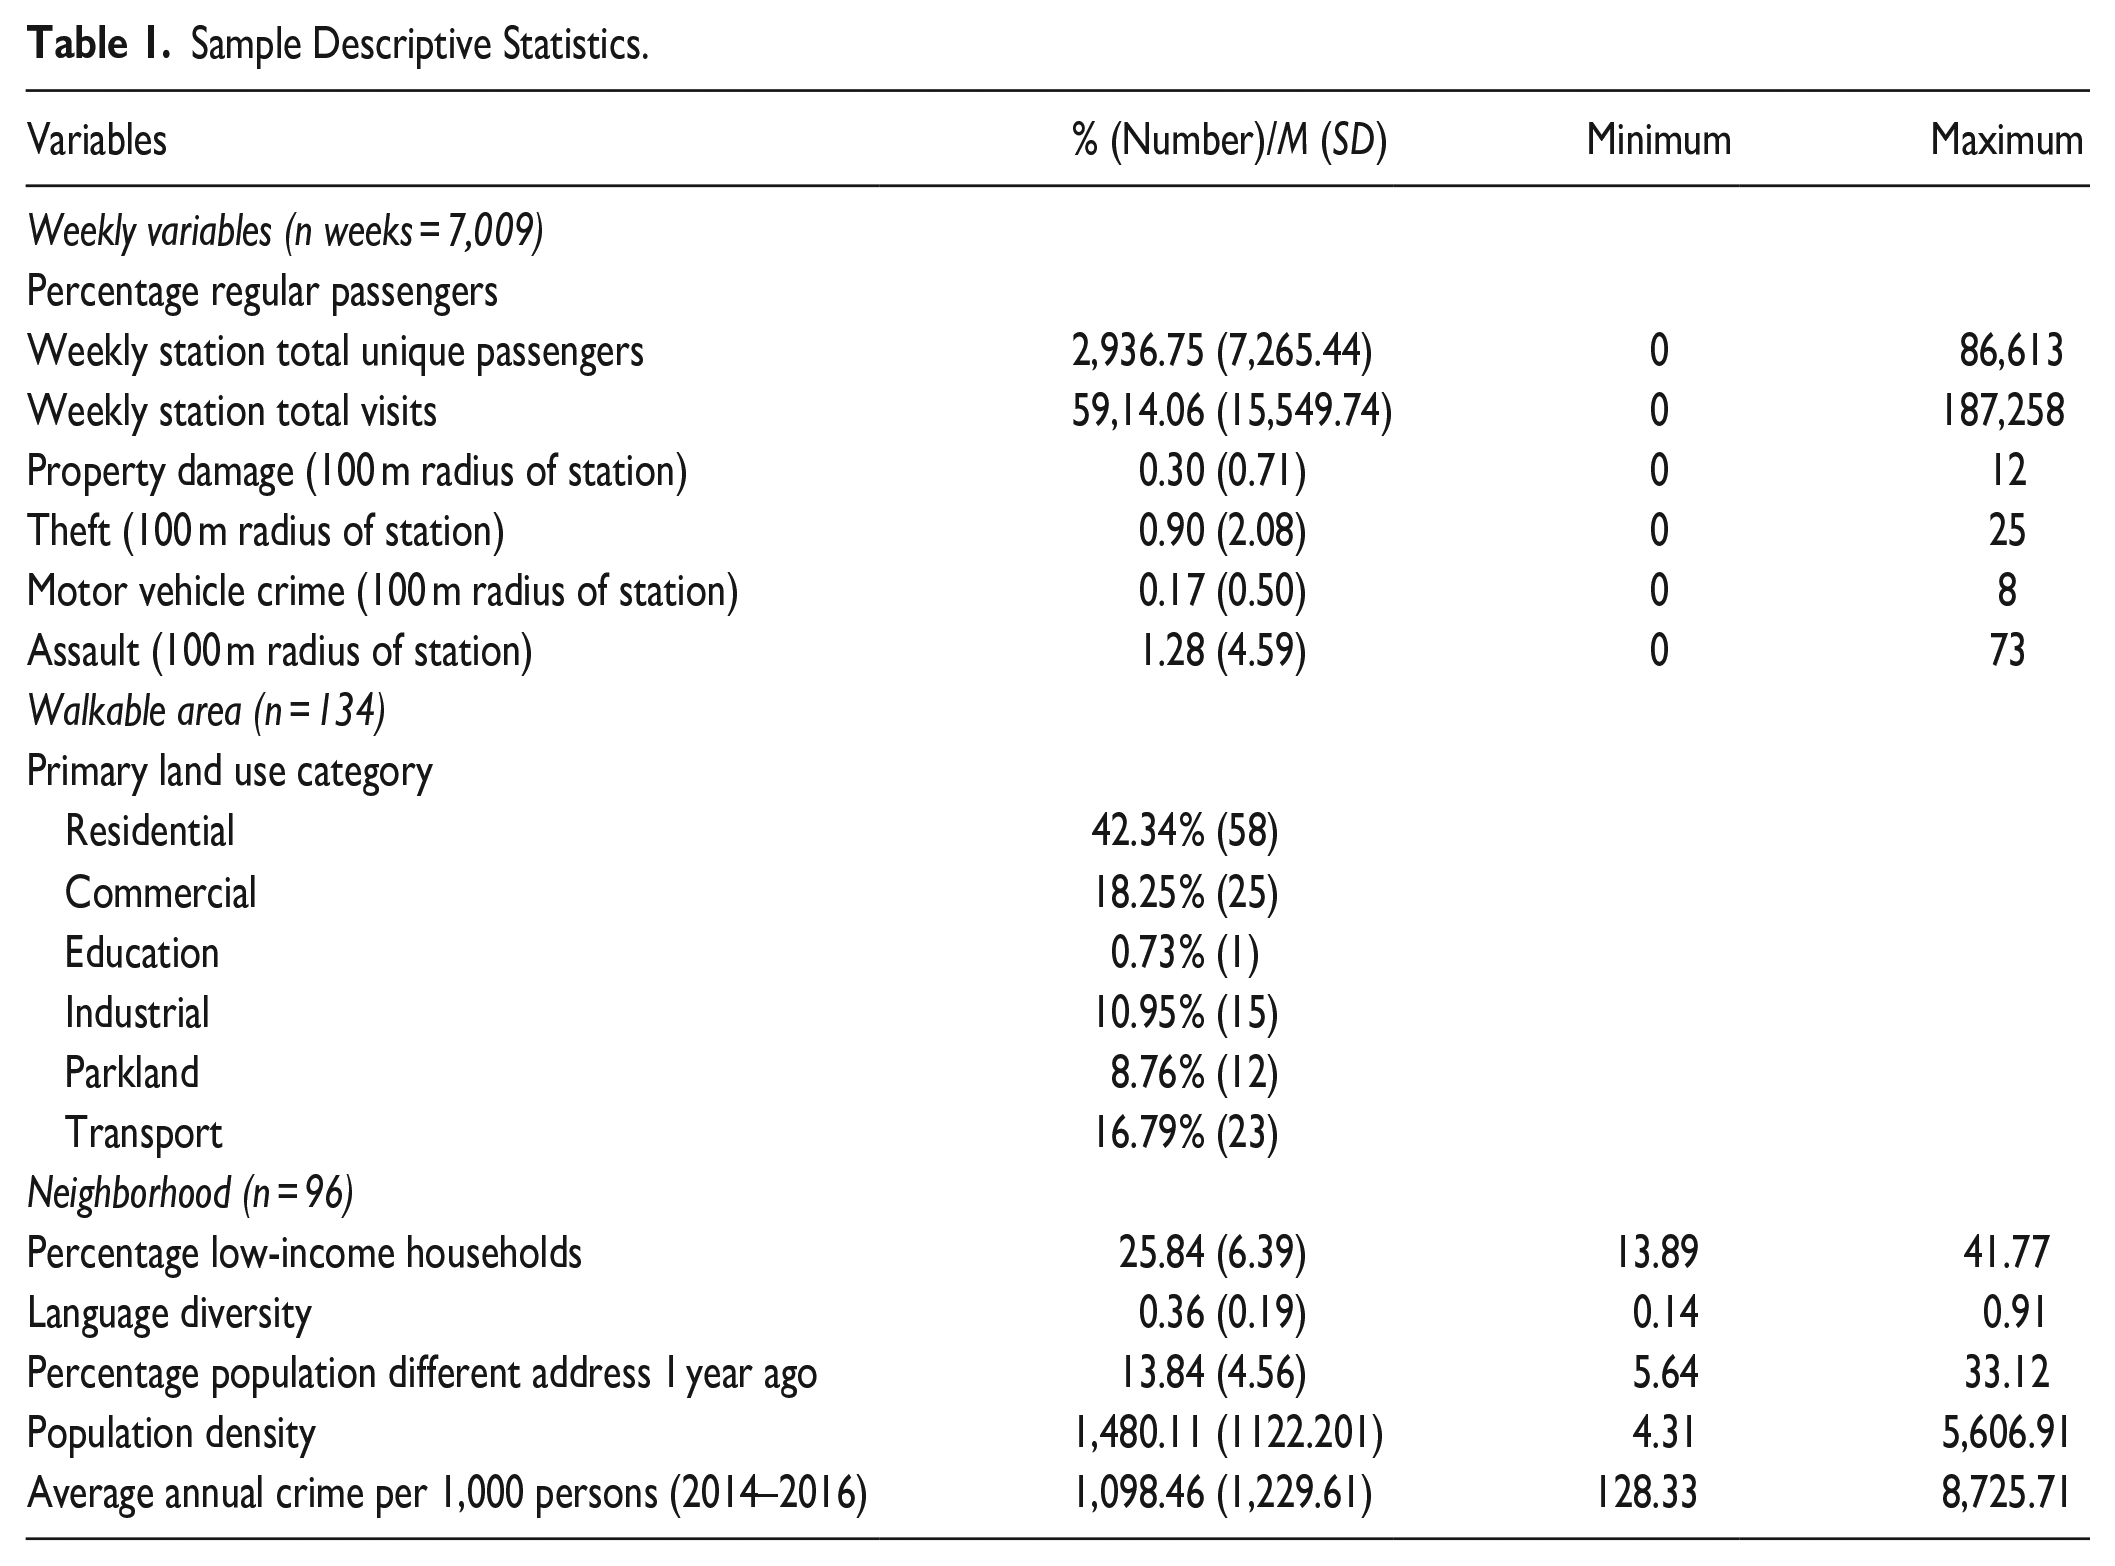
The data for this study are drawn from four sources: Queensland Police Service recorded crime; Queensland Department of Transport and Main Roads travel card data, Queensland Valuation and Sales 2011, and the Australian Bureau of Statistics 2016 census data. Summary statistics for all variables used in the analyses are displayed in Table 1.
Sample Descriptive Statistics.
Dependent Variables
Crime
The dependent variables for this study are crimes recorded by the Queensland Police Service (Queensland Police Service, 2022). The dependent variable is the presence of crime in a given week (i) at a particular station (j). Queensland crime data are openly available to the public and accessible via API or at the following website: https://www.police.qld.gov.au/maps-and-statistics. Based on the literature (Kooi, 2013; Loukaitou-Sideris et al., 2002) we purposively selected four types of crime 2 that occur in high volume at and around transit stations and represent two property target offences (property damage and motor vehicle crimes) and two person-target offences (assault and theft from a person). Crime data were extracted as incident coordinates from Queensland Police Service crime data for the period July 2015 through to June 2016. Incident coordinates were geocoded to a 100 m Euclidian distance extending from the centroid of train stations, capturing train station platform, entry, and attached car park.
The dependent variables are indicator variables noting the presence of theft from persons, property damage, motor vehicle crimes and assaults geocoded as occurring within the 100 m radius of each station (n = 134) in week i at station j. Theft refers to theft from a person and excludes break and enter at a residential property and robbery. Property damage is the destruction of public or private property, caused by a person who is not the owner, intentionally and without lawful excuse. This category includes graffiti and vandalism, among other minor offences and excludes arson. Motor vehicle crimes includes theft of a motor vehicle, stealing from a motor vehicle, and unlawful use of a motor vehicle. Assault includes common and serious physical assault but excludes sexual assault.
Given the high prevalence of trip chaining 3 and the capacity for train stations to act as “convergence settings” (Madensen & Eck, 2012) and/or crime radiators and absorbers (Bowers, 2014) we also considered crime measured at 400 m buffers from train stations. As a form of sensitivity analyses we estimated all models using the 400 m buffer measures. The findings were significantly different for the 100 and 400 m areas around stations. Given we propose regularity may influence the propensity for crime by facilitating familiarity with people and social norms at stations, and that regularity is measured by touch-on from the smart card at the train station centroid itself, we selected 100 m as the most appropriate buffer distance to measure crime.
Independent Variables
Regularity
The primary independent variable in this study is the percentage of regular passengers at each station per week. We computed this variable drawing on data generated from the Queensland Department of Transport and Main Roads’ go card smart card system. The go card is a pre-paid travel card that records passenger trips on public transport throughout Queensland. Trips are registered when passengers touch on and off at each station upon alighting and disembarking trains, buses, and ferries. The location coordinates and date–time stamp of each trip are recorded. We geocoded passenger alighting and disembarking points to stations at particular times and computed regularity, defined as attending the station on five or more occasions within a 7-day period.
Drawing on these data we computed the percentage of total weekly passengers who were regulars at the station level for each week between July 1 2015 and June 30 2016. Regularity is computed using boarding data only. Prior to computing our measure of regulars we examined the literature on definitions of regularity. There is a lack of consistency in the literature around what is means to be a regular visitor or commuter. However, there is consistent acknowledgement of the 5-day work and school week which are associated with obligatory commutes and an implicit sense of regularity. Drawing on this literature alongside the results of our sensitivity analyses that revealed models were similar for when regularity was defined as either attends the station on three or more occasions in 7 days (see Supplementary Material) or attends the station on five or more occasions within 7 day we computed regularity based on the definition of regular as attending the station on five or more occasions within 7 days.
The computation of the variable included in the model is the number of total passengers who visited the station on five or more occasions within a 7-day period divided by the total number of unique passengers at a station during that week. Our weekly regular passengers variable is a continuous variable ranging from 0% to 49.6% (M = 21.13%, SD = 12.05). We also include the quadratic term in the models to examine the non-linear association between regular passengers and the presence of crime at stations.
Primary Land Use
Co-located land use may impact crime at stations by influencing population flows and the propensity for individuals to be potential offenders, guardians, or targets (Bowers, 2014; Eck et al., 2007; Franquez et al., 2013; Groff & Lockwood, 2014; Newton, 2018). We include a measure of the primary land use 4 at the station location using the mesh block land type. Mesh blocks are the smallest geographical area defined by the ABS (see https://www.abs.gov.au/ausstats/) and form the building blocks of all other spatial units delineated by the ABS. Mesh blocks contain a single land use type (e.g., commercial, residential, and education) and contain approximately 30 to 60 dwellings (74% of mesh blocks containing a transit station are classified as residential). Each station is allocated one of: residential, commercial, education, industrial, parkland, or transport land use. Residential land use is the base category in all regression models.
Distance From City Center
Distance from the city center is captured using fare zone. Stations in the Queensland train network are separated into fare zones which delineate their distance from the city center. Fare zones range from 1 to 8 and represent increasing distance from the city.
Neighborhood Characteristics
To control for social-demographic characteristics of the station neighborhood known to influence informal guardianship (Reynald, 2011; Reynald & Elffers, 2009), crime, and disorder (Gerell, 2018; Sampson et al., 1997), we incorporate four variables drawn from the ABS census 2016. We include measures of disadvantage (% low income households); language diversity (Blau index language spoken at home); residential instability (% residents at a different address one year ago); and population density. We also include a measure of neighborhood crime rate drawn from the Queensland Police data. This is the average annual total 5 crime rate per 1,000 residents over a three year period (2014–2016).
Analytic Strategy
We estimate mixed effects logistic regression models at the station-week level with random effects at the level of the station. Given the clustered nature of these data (i.e., weeks nested within stations), we compute multilevel logistic regression models to examine the association between weekly regularity at stations, also accounting for variation between stations that may affect crime. We fit a mixed-effects binomial logistic regression model with a random intercept at the station level, using the melogit command in Stata 17 (StataCorp, 2021). We account for similarity within neighborhoods utilizing the clustered variance structures. Given we have a binary outcome yij {0, 1} observed on week i, with i = 1,2,. . .,Nj, within station j, with j = 1,2,. . .,N, and being Pij = Pr(yij = 1) is the probability that yij takes on the value of 1 (i.e., the week is associated with a recorded crime), the model is defined in terms of the natural logarithm of the odds ratio (logit), indicated as ln(Pij/1 − Pij). The two-level random intercepts logistic regression model can be expressed as a linear function of the explanatory variables using the single equation mixed model formulation (Rabe-Hesketh, Skrondal & Pickles, 2004):

where
We conducted a number of sensitivity tests. We conducted all analyses using a 400 m buffer around stations to measure crime in addition to the 100 m measures. The results differed between the selected distances. Given the aim of this paper is to investigate the process of regularity, and subsequent familiarity, at the station itself and the source of our measure of regularity is collected at the station centroid we selected the 100 m buffer as most appropriate. The 400 m buffer results are available from the authors on request. We also conducted all analyses using the definition of regular passenger as attending the station on three or more occasions within a 7 day period. The results reflect those resulting from the analyses using the measure computed using the five or more occasions definition of regularity. The results of the models using the three occasion’s measure of regularity are included in the Supplemental Material.
Results
The final analytic sample comprised 7,099 weeks nested within 134 stations clustered within 96 neighborhoods. On average, across all stations in the network, 21.13% of weekly passengers are regulars who visit the station five times or more per week. The occurrence of crime is a relatively infrequent event at train stations in Greater Brisbane. Theft occurs on 6.55% (n = 465) of total weeks, property damage is recorded on 3.01% (n = 214) of total weeks and both motor vehicle crimes and assaults are recorded on 2.07% (n = 147) of weeks. Table 1 summarizes the descriptive statistics for each of the measures included in the regression analyses. The results of the mixed effects logistic regression models are presented in Table 2.
Mixed-Effects Logistic Regression Models Estimating Presence of Crime at Stations.
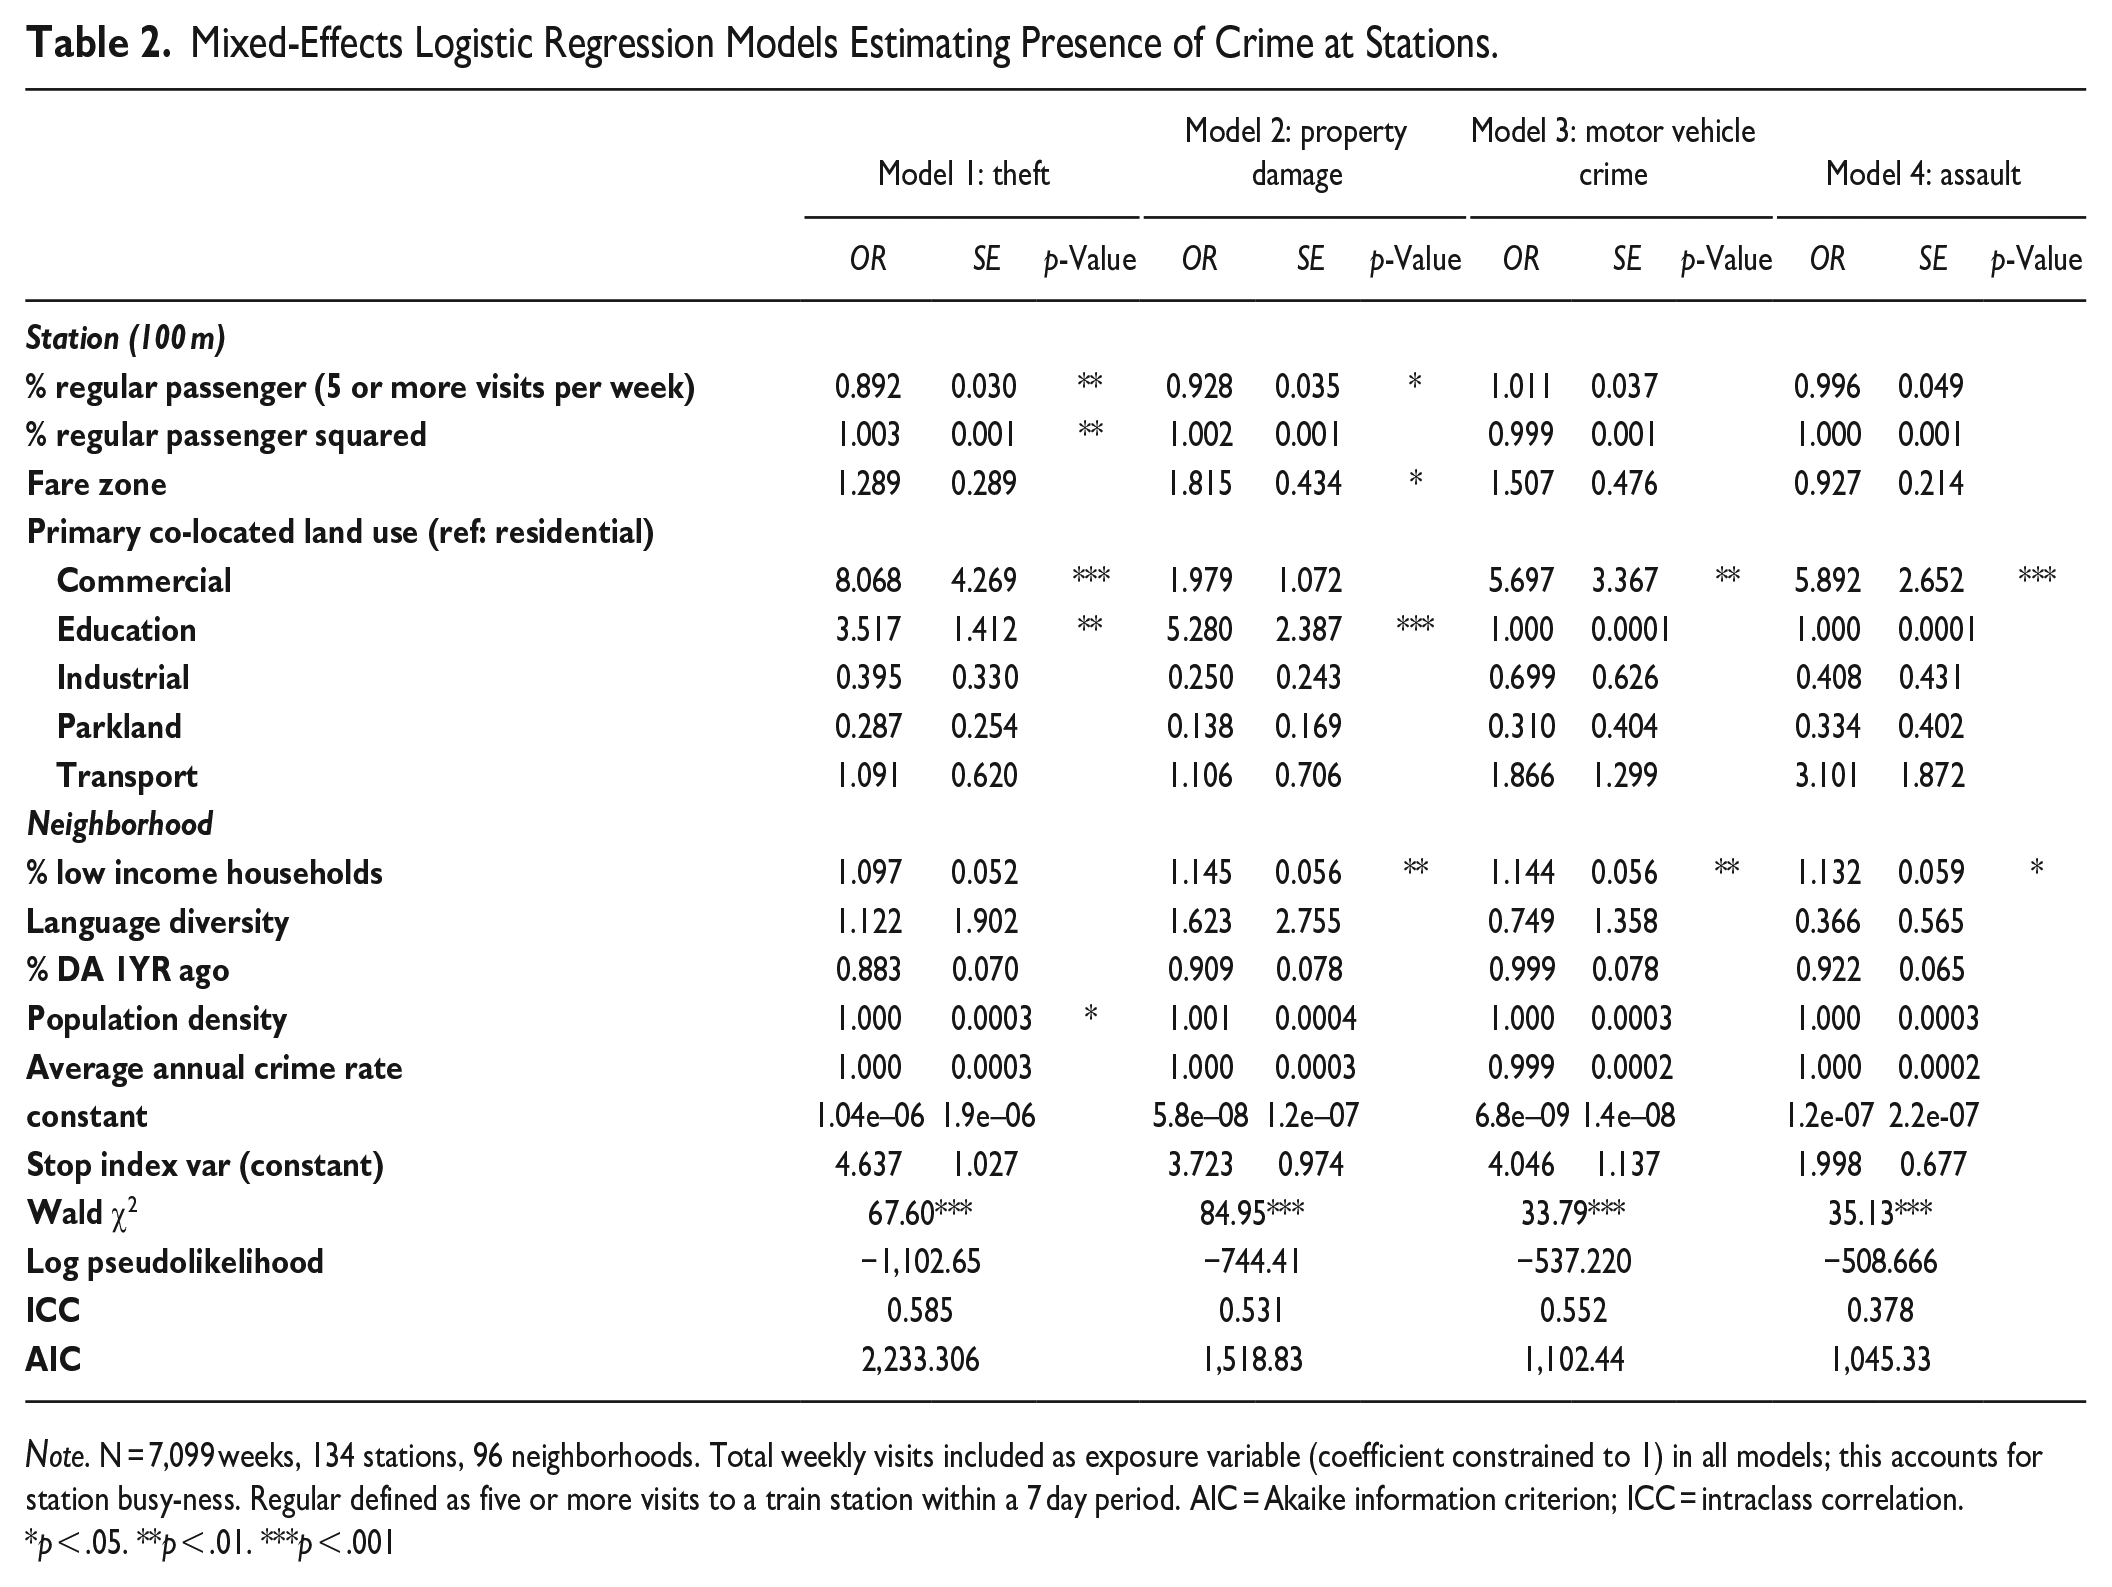
Note. N = 7,099 weeks, 134 stations, 96 neighborhoods. Total weekly visits included as exposure variable (coefficient constrained to 1) in all models; this accounts for station busy-ness. Regular defined as five or more visits to a train station within a 7 day period. AIC = Akaike information criterion; ICC = intraclass correlation.
*p < .05. **p < .01. ***p < .001
Model 1 (Table 2) examines the association between regular passengers and theft at train stations. The results demonstrate that for every one percentage point increase in weekly regular passengers—that is passengers who attend the station five times or more that week—the relative risk of a theft occurring at the station on that week declines by 11%. However, the co-ocurring positive association between the quadratic term of regular passengers and the odds of theft suggests the relationship between regular passengers and theft is curvilinear (OR = 1.003, p < .01). Thus, the protective influence of regular passengers on the odds of theft diminishes as the percentage of regular passengers increases (see Figure 2). In addition to regular passengers, primary co-located landuse plays a role in the odds of theft at stations. Compared to stations located on residential blocks, train stations co-located with commercial establishments (including shops, bars, restaurants) have approximately eight times greater odds of theft (OR = 8.07, p < .001), while train stations co-located with schools have 3.5 times greater odds of theft than residential stations (OR = 3.52, p < .01).
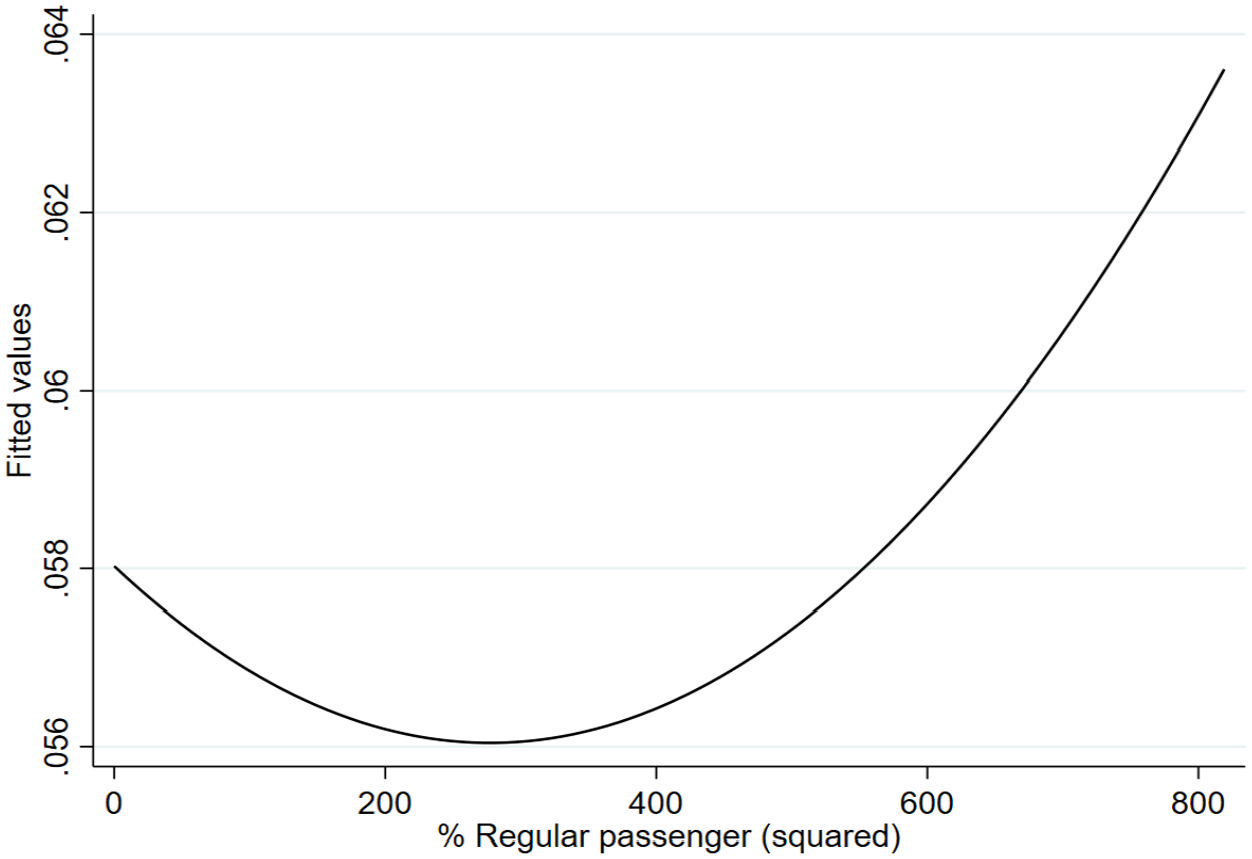
Graph depicting non-linear relationship between regular passengers and probability of theft at stations.
Model 2 examines the association between regular passengers and property damage at train stations. Similar to model 1, there is evidence of a protective effect of regular passengers on property crime at train stations. With every one percentage point increase in regular passengers the relative risk of property damage decreases by approximately 7% (OR = 0.93, p < .05). There is no evidence of significant curvilinear effect of regular passengers on property damage. Compared to the train stations located in residential areas, those co-located with schools are 5.28 times more likely to experience property damage (OR = 5.28, p < .001). The relative risk of property damage is greater at stations located further from the city center. For every one unit increase in fare zone the relative risk of property damage increases by 81%, (OR = 1.81, p < .05). Property damage is also more likely to occur at train stations located in lower income neighborhoods (OR = 1.15, p < .01).
In Model 3 we estimate the effect of regular passengers on motor vehicle crimes at stations. Two factors in the model significantly influence the odds of motor vehicle crimes at train stations. Compared to train stations located in residential areas, train stations co-located with commercial establishments have 5.7 times greater odds of experiencing motor vehicle crimes. This is likely because commercial establishments such as shops have large car parks that provide a pool of targets for motor vehicle offences. The relative risk of motor vehicle crime is also higher at train stations located in neighborhoods with higher percentage of low-income households. For every one percentage point increase in low-income households the relative risk of motor vehicle crimes at train stations increases by 14% (OR = 1.144, p < .01). There is no evidence that regular passengers is associated with the odds of motor vehicle theft at train stations. In Model 3 neither the linear nor the quadratic relationship between regularity and the odds of motor vehicle crime was statistically significant at the 0.05 level.
In Model 4 we estimate the association between regular passengers and assault. The results of model 4 are similar to those of model 3. There is no evidence of either a linear or curvilinear association between regular passengers and assault. Compared to train stations located in residential areas, train stations co-located with commercial establishments are 5.9 times more likely to experience assaults (OR = 5.89, p < .001). This finding is not surprising given that commercial land use includes bars and drinking establishments which are noted as facilitators of violence (Groff & Lockwood, 2014). Train stations located in neighborhoods with higher percentage of low-income households also have higher odds of assault (OR = 1.13, p < .05).
Discussion
Regularity, relative to irregular travel on public transit networks may influence passenger behavior with implications for crime and safety. Transit stations are consistently associated with crime risk (Ceccato et al., 2022) due to their capacity to generate population flows and facilitate the convergence of potential crime offenders and targets (Ceccato & Uittenbogaard, 2014; Newton et al., 2014). When capable guardianship is low at transit stations, be it due to crowding (Uittenbogaard, 2015), poor station design (Loukaitou-sideris, 1999), low platform occupancy (Ceccato et al., 2013; Clarke et al., 1996), or lack of monitoring by present others (Felson, 1995), this convergence can result in crime events. Many studies that draw on crime opportunities theories empirically assume that all members of the ambient population at places like stations have equal likelihood of participating in a crime event as an offender, target, or crime guardian (Hipp & Williams, 2020). These studies examine the volume of individuals at places within a time-window without accounting for the repetitive nature of routine activities and the influence of regularity on people-place relations.
Regularity at places can influence place awareness (Brantingham & Brantingham, 1995), public familiarity and perceived anonymity (Blokland, 2003; Lofland, 1998). In this study we hypothesized that regularity, relative to irregular travel, would influence crime at stations. We also hypothesized that the effect of regularity on crime would vary across stations in the transit network dependent on their location and environmental context. Using travel card data we identified the percentage of weekly passengers at train stations across the Greater Brisbane train network (N = 134) who were regulars, defined as visiting the station on five or more occasions within a 7-day period, and examined the association between regularity and crime after controlling for station busyness, co-located land use and neighborhood socio-demographic characteristics. Our study resulted in three key findings that can inform our understanding of the relationship between regularity and social outcomes at places and provide insights into the potential power of place-regulars for crime guardianship.
First, we found that the percentage of regular passengers was associated with reduced odds of both theft and property damage at train stations. While the association between regular passengers and property damage was linear with higher percentage of regular passengers associated with reduced odds of property damage, the relationship between regular passengers and theft was curvilinear. This suggests that beyond a certain threshold further increases in percentage of regular passengers no longer provides additional benefits for reducing the odds of theft and indeed may even facilitate theft. There are two potential explanations for our findings, the first being that regular passengers may have greater guardianship capacity than irregular travellers, therefore are able to demonstrate monitoring and behavioral compliance in a way that encourages others to conform and puts potential offenders’ anonymity at risk. Second, if potential offenders are indeed themselves regular passengers, they may feel part of the temporary community of regulars therefore perceive a moral obligation to avoid targeting other members of this temporary community (fellow regulars). However, in the case of theft, it appears that when the percentage of regulars becomes too large to afford a sense of familiarity and recognition between individual passengers, the influence of regularity is diluted and the crowd once again provides a cloak of anonymity. This finding aligns with previous studies that show large ambient populations at transit stations can provide easy targets for pickpockets and increase the risk of theft (Ceccato et al., 2022; Song et al., 2019, 2021).
Second, we found that there was no association between passenger regularity and motor vehicle offences or assaults. One explanation for this pertains to target availability within the confines of the train station. Motor vehicle crimes can occur in the car parking facilities attached to the train station or a co-located shop, bar, or restaurant. However, these offences cannot occur on the station itself due to lack of targets. Thus, motor vehicle offences may be unaffected by regularity as they occur beyond the gaze of passengers awaiting their train on the station platform who may otherwise provide guardianship through monitoring for such crimes as theft and property damage (Felson & Boba, 2010). There was also no evidence that regularity influences the odds of assault at train stations. A possible explanation for this finding relates to passengers’ willingness to act as guardians against violent crime, compared to property-based offences. Individuals may choose not to act as guardians in situations where they lack confidence or have concerns for their own personal safety (Reynald, 2010). Thus, violent offences including assaults may been seen to fall outside the purview of the informal guardian in public places like train stations and remain unaffected by the presence of regular passengers.
An alternative explanation for the lack of association between regular passengers and both motor vehicle crimes and assaults is the low occurrence of these offences in the data. We acknowledge that the infrequent occurrence of these offences at train stations in the Greater Brisbane region may have impeded our capacity to identify significant associations and suggest that further research is required over a larger transit network and a longer time period to reproduce and consolidate the findings presented here.
The third key finding of our study highlights the role of co-located land uses in generating and attracting crime at train stations. The odds of theft, assault, and motor vehicle crimes were all higher at stations that were co-located with commercial land use, compared to stations that were in residential areas. The link between shops, bars, and restaurants and heightened crime risk is well documented in the literature on risky facilities (Groff & Lockwood, 2014). These land uses facilitate crime because they are nodes of population coalescence that bring potential offenders into contact with attractive targets in the context of legitimate activities (Brantingham & Brantingham 1995; Corcoran et al., 2021; Song et al., 2019). For example, shops are associated with heightened risk of theft because individuals who have made recent purchases are attractive targets. Similarly, bars are associated with higher odds of violence because intoxicated patrons can be vulnerable to aggression and/or victimization (Block & Block, 2000). In the case of motor vehicle crimes, car parking facilities located at commercial establishments provide unoccupied targets for car theft and theft from motor vehicles. When train stations are co-located with commercial facilities the malignant mix of the two crime generators coupled with the high level of accessibility provided by train stations, can serve to multiply the crime risk that would be associated with one of the facilities in isolation (Adams et al., 2015). This finding may indicate the importance of designing transit environments to align with the principles of situational crime prevention (Clarke, 1997) and Crime Prevention through Environmental Design (Cozens & van der Linde, 2015). These physical design strategies can ensure train station environments maximize guardianship potential through enhanced sight-lines, improved lighting, and visible signs of security. The results also suggest considering mixed land use transit hubs (also referred to as transit-orientated development see Cervero, 2012) in place of commercial only precincts for the location of train stations. Incorporating Jacobs’ (1961) idea of eyes on the street, mixed use transit hubs that locate train stations within mixed service and residential developments can enhance guardianship at all times of the day and may also increase the percentage of regular passenger using the transit station (residents from the co-located building).
Limitations and Future Research
While this study adds to the literature by examining the association between regularity and crime at transit stations, there are a number of limitations. First, regularity is measured at the station-week level. It is valuable to examine the lasting influence of regularity, established across a week at the station level, on the rational offender. Much like hot-spots policing it was expected that regularity at intervals throughout the week would give a sense that the station, overall, was guarded and that there may be people monitoring the station at any time. To the rational offender, this was expected to increase perceived risk and make the station a less attractive crime target. Yet, it is also important to understand how patterns of regularity and associated crime vary throughout the day. Exploring patterns of regularity throughout different periods of the day and, in particular, at peak compared to off-peak travel times would also provide useful insights into the co-located facilities and travel purposes that are most tightly coupled with regularity and its association with lower, or indeed higher, crime. Examining the influence of regularity at finer temporal granularities is an area for future research.
A second limitation is that our measure of regularity is objective and captured using travel card data. The more proximate precipitator of passenger behavior is their self-perceived regularity. Survey data is required to investigate the extent to which perceptions of regularity vary across passengers depending upon their travel routines. Given that empirical definitions of regularity in regards to visitation are almost absent from the literature, this would help to ground-truth measures of regularity and more accurately assess its impact on behavioral and social outcomes.
Finally, we acknowledge that here we investigate only one transit network with 134 stations and we do not actually measure guardianship, victimization, or offending behaviors of travel card holders, therefore we can only propose theoretically informed interpretations of the associations between regularity and crime at stations. From the analyses presented here we cannot speak directly to the influence of regularity on guardianship at stations. Such a study would require survey data to investigate perceptions, attitudes, and actual behaviors of passengers at transit stations. This is an important area to pursue if we are to establish a more in depth understanding of whose eyes are on the street; offender, guardian, or target.
Conclusions
Despite the limitations noted above, this study adds to the literature in two ways. First, we demonstrate a link between place-based routine and crime at places in the urban context. This is an important addition to the emerging research on ambient populations and delineating between potential offenders, targets, and guardianship based on information that can be elicited from big data sources. Second, we build on the burgeoning public transit research to further emphasize the need to consider different approaches to station and network safety that focus on the whole of journey approach and factor station design, immediate environment and station neighborhood characteristics into crime prevention planning. The findings presented here draw attention to issues associated with malignant mixes of land uses while at the same time demonstrating that there may be promise in mixed transit hubs that maximize potential for regularity and consistent eyes on the street (Jacobs, 1961). Where changes to the permanent land use is not possible, the use of mobile food-trucks, regular stalls, or morning coffee events at train stations could help to establish a sense of temporary community among regular passengers at stations by providing a unitary focus for passengers to encourage interaction and in turn guardianship capacity. Engaging more meaningfully with the transit community to cultivate a group of regular passenger who recognize each other and can act as aware, willing guardians can help to generate safer transit environments. Given that safety is a primary barrier to public transit use, establishing safety is vital for reducing reliance on public vehicles and facilitating environmentally sustainable transport options.
The strategies outline above are just some of the possible interventions transit policy makers can consider to, enhance regularity at train stations and facilitate the conversion of regularity into crime prevention benefits. Theoretically, the question of whose eyes are on the street is a complex one that requires greater research attention. Studies, such as this one are a starting point and can provide some insights into the complexities of what makes members of the ambient population at places more likely to represent offenders, targets, and guardians, in this case, by empirically demonstrating the influence of regularity on the effect of the crowd on crime.
Supplemental Material
sj-docx-1-cad-10.1177_00111287231160737 – Supplemental material for Examining Train Stations as Crime Generators and the Protective Effect of “Regular” Riders
Supplemental material, sj-docx-1-cad-10.1177_00111287231160737 for Examining Train Stations as Crime Generators and the Protective Effect of “Regular” Riders by Renee Zahnow in Crime & Delinquency
Footnotes
Acknowledgements
The authors would like to thank Queensland Department of Transport for providing access to the data required to complete this study.
Declaration of Conflicting Interests
The author declared no potential conflicts of interest with respect to the research, authorship, and/or publication of this article.
Funding
The author disclosed receipt of the following financial support for the research, authorship, and/or publication of this article: This research was supported by an Australian Research Council DECRA fellowship fund (DE200100359).
Supplemental Material
Supplemental material for this article is available online.
Notes
Author Biography
References
Supplementary Material
Please find the following supplemental material available below.
For Open Access articles published under a Creative Commons License, all supplemental material carries the same license as the article it is associated with.
For non-Open Access articles published, all supplemental material carries a non-exclusive license, and permission requests for re-use of supplemental material or any part of supplemental material shall be sent directly to the copyright owner as specified in the copyright notice associated with the article.