
Abstract
Performing censuses on stigmatized or vulnerable populations is challenging, however, for such populations partial enumeration is often possible using different lists or sources. If the sources overlap then multiple systems estimation (MSE) methods can be applied to obtain an estimate of the total population. These are typically expressed by a log-linear model which permits positive/negative dependencies between lists. This paper considers issues that arise for the application of MSE to modern slavery where there is little to no overlap of individuals across lists. We investigate the robustness of MSE in terms of the importance of each list and the impact of combining lists on the estimation process. We undertake a simulation study and consider real national modern slavery data from the UK and Romania.
Introduction
Modern forms of slavery persist in the 21st century despite the legislative successes of 19th century reformers in having predominantly abolished traditional slavery. Documenting and quantifying the prevalence of modern slavery is a challenging task for many reasons but not least due to the hidden nature of individuals who would be classed in this category and how victims of modern slavery are defined. Further, the nature of modern slavery means that international boundaries may be crossed with many modern slavery victims also victims of illegal trafficking (Cruyff et al., 2017; van Dijk et al., 2017 explain the context to human trafficking). However, the problem is significantly wider that the exploitation of illegal immigrants—for example, 16% of the UK’s identified potential victims of modern slavery are its own citizens. The own-citizen percentage was higher still at 32% for the 2,121 potential victims in 2017 who were children (Home Office, 2018). Major other countries-of-origin for UK-identified victims include Albania and Vietnam but these two, together with the UK itself, may have a different representation within the totality of victims (non-identified as well as identified) of modern slavery in the UK. Hence, policy initiatives for the prevention of human trafficking that have been directed at Albania and Vietnam might need re-orientation when UK’s unidentified victims are estimated by where they originated from.
In the UK, all police forces report identified victims of modern slavery to the National Crime Agency (NCA). Support, ranging in duration from 7 to 13 weeks, is available for “probable-cause” victims unless or until their final-status is determined otherwise. Overlaps between the list held by UK’s NCA and those of other service providers arise both because of the support on offer to probable-cause victims, or because these services may have referred identified potential victims to NCA for appraisal of their eligibility for support, or because police action could rescue further victims. It is this overlap of individuals observed by the different sources that permits the use of multiple systems estimation (MSE) for estimating the difficult to obtain total prevalence and associated measure of the problem within society. See Bird and King (2018) for a review of multiple systems estimation and their application to different populations; Jewell et al. (2013) for an application to estimating nonmilitary deaths in conflict; and Silverman (2020), and references therein, for discussion of their application to modern slavery.
Complexities can occur for modern slavery data as the term covers a range of different types of modern slavery, including for example, domestic/physical labour and forced prostitution. The characteristics of the type of victimisation typically varies by gender (e.g., physical vs. domestic labour) and age-group (child vs. adult female prostitution); and is also likely to determine how many other victims belong to the same cluster as the listed victim, for example, many adult males engaged in physical labour, may be co-located and controlled by a gang-master; solo female domestic slave; or a clutch of sex workers who travel between premises in different towns and may include children in their number. Professionals in different capacities may report suspect activity to authorities. For example, doctors who are made aware that a child is at risk of prostitution, or that victims of human trafficking are held at a specific location, may (or be required to) inform the relevant authorities so that a rescue can be attempted by the police. Considerations pertain to non-governmental voluntary organizations including those which might, in less extreme circumstances, be unwilling to cross-refer leading to minimal overlap between different lists, for example, in relation to voluntary organizations giving refuge to escapee women versus males, or to adults versus children.
We focus on the common issue of limited or minimal overlap (where relatively few individuals are observed across the different lists used) within modern slavery application of MSE. Multiple lists with limited or minimal overlap can occur for numerous reasons, and affect different subsets of the population. For example, as discussed above, this may be the case for lists that are held by different non-governmental voluntary organizations. This, in turn, can lead to a number of different issues when applying a MSE approach, including models being unidentifiable with inestimable parameters (Sharifi Far et al., 2019) and potentially unstable estimation of the total population size. Further, demographic information or contextual data, such as type of victimization that victims of modern slavery are subjected to and whether drug dependent, may be important determinants of capture-propensity on some but not all lists, or the interaction between different lists. If such information is available, MSE can be extended to directly incorporate such factors (King et al., 2005 demonstrates the case of MSE applied to injecting drug users). However, this leads to a further reduction in the overlaps observed between the different lists, potentially exacerbating the issues further, and introducing a greater number of parameters to estimate. Thus, within this paper, we do not consider such characteristics further, and focus on the standard cross-classification of individuals across the different lists.
Our aim in this paper is to investigate, by simulation and empirically, the impact of lists with minimal overlaps for capture-recapture estimation of victims of modern slavery, and methods to combat effects of such phenomena on population size estimation.
Methods
We consider standard log-linear models for MSE, where we are able to explicitly account for dependencies between lists via associated log-linear interaction terms (Fienberg, 1972). We investigate the effect on population size estimation where there is limited overlap between the lists relating to the two specific methods of (i) list omission and (ii) list combination. In particular, we shall consider an approach where we assess the influence of the lists on the estimation process by removing each list in turn from the analysis; and the impact of combining two lists where there is limited overlap between the lists. We begin by defining the models and associated MSE approach.
Multiple Systems Estimation
We begin by describing the general framework for MSE. Let
Let
Letting µ denote the column vector of the mean cell counts, µ

where
This modelling structure permits the estimation of the total population size as follows: the log-linear parameters,
To discriminate between competing models and conduct the model selection step, it is conventional to use Akaike’s information criterion, AIC (Akaike, 1974), where,

such that
In practice, it may not be feasible to fit every possible model (including/excluding interaction terms) to the data. If the dataset features many sources, the number of possible models becomes prohibitive and so a model search algorithm is typically implemented. For example, adding/removing interaction terms in a systematic manner until no improvement in the model is detected. In this paper, we use a model selection procedure using the AIC statistic and estimate the total population size from the single “best” model in order to investigate the issues of combining and omitting lists without the additional confounding with model-averaging issues. In particular, we are interested in the influence of each individual list on the total population estimate.
List Influence
The pattern of the observed data, in terms of the number of individuals observed in the cross-classification across different lists is the underpinning principle permitting the estimation of the total population size via MSE. In general, situations can arise whereby, for example, there is a dominant list where a substantial proportion of individuals are observed by this single source (Cormack et al., 2000); there is substantial dependence between lists (either positive or negative: see, for example, Jones et al. (2014)); or limited overlap across lists leading to sparse contingency tables, that is, tables with a large number of zero counts (Chan et al., 2020; Sharifi Far, 2017). We focus on this last case of minimal overlap between the different lists. Issues encountered in this scenario include model fitting complexity, including for example, model identifiability and parameter redundancy (Chan et al., 2020; Fienberg & Rinaldo, 2012; Sharifi Far et al., 2019; Silverman, 2020; Vincent et al., forthcoming).
To investigate the influence of the different lists on the statistical analysis, and focussing in particular on the estimation of the total population size, we consider both a (i) “leave-one-out” approach and (ii) combining lists approach.
Leave-one-out approach
The leave-one-out approach involves cycling through each possible list, removing the given list, constructing the reduced incomplete contingency table from the remaining sources before conducting the statistical analysis to obtain the total population size estimate as described above. In particular, we obtain the MLE of the total population size for the model deemed optimal via the AIC statistic and an associated 95% CI. When there are
Combining lists approach
In some cases, we may wish to combine two lists into a single list prior to analysing the contingency table. For example, we focus on the particular case where we may wish to do this due to the limited (or even lack of any) overlap between two (or more) of the sources used within the analysis. The new list then essentially corresponds to individuals observed by source
Case Studies
We consider two case studies relating to data from the UK and Romania, both with five sources. Both of these cases have minimal overlap between some of the sources. For the Romanian data, one of the lists is dominant and contains the majority of the observations.
UK Data
We consider the data presented by Silverman (2014) relating to modern slavery in the UK. The data contains five different sources corresponding to: Local Authority (LA); Non-Government organisations (NG); Police Force and/or National Crime Agency (PF); Government Organisations (GO); and the General Public (GP). For further information, including discussion of combining the police force and National Crime Agency as a single list, see Silverman (2014). The data are presented in Table 1. We note that there is no overlap between the lists LA and GP, that is, no individuals are recorded by both of these sources, and, in general, there is very little overlap between GP and the other remaining lists. Given these data, it can be shown that the interaction between LA and GP (and all higher order interactions) cannot be estimated (Sharifi Far, 2017). In our analyzes, due to the sparsity of the contingency table, we restrict the interactions to only two-way interactions between lists. When modelling the five lists, all the two-way interactions, except the LA and GP interaction, are estimable.
UK Modern Slavery Data of Non-Zero Contingency Table Cell Entries.
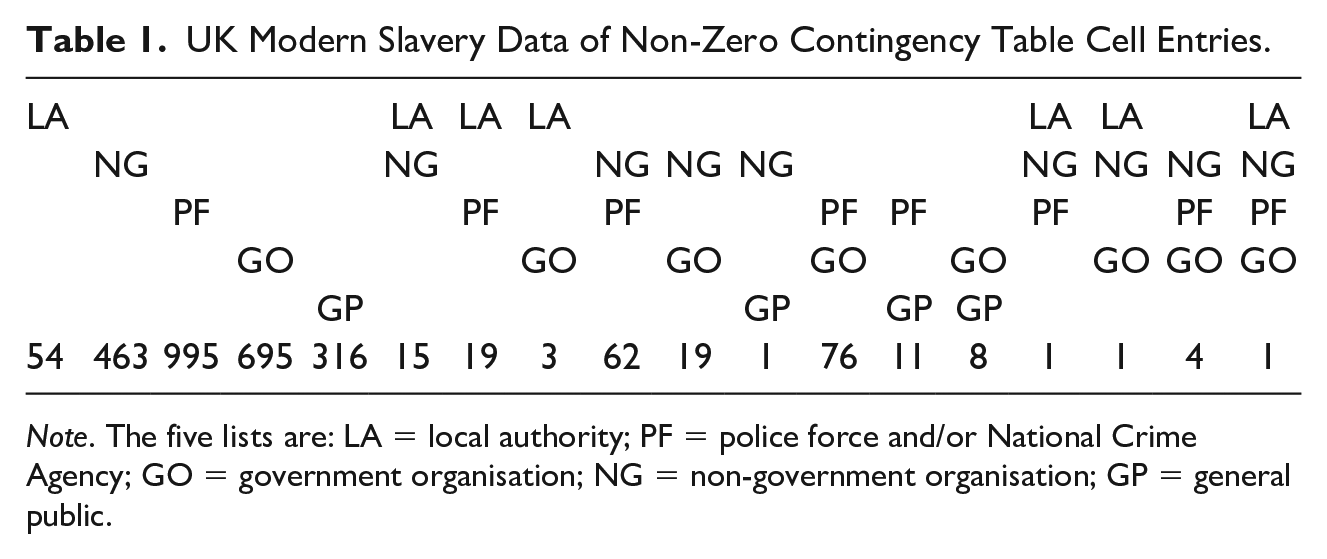
Note. The five lists are: LA = local authority; PF = police force and/or National Crime Agency; GO = government organisation; NG = non-government organisation; GP = general public.
Full data analysis
We initially analyze the full five-list dataset, in order to consider the robustness of the total population estimate when investigating the two issues of (i) removing each list in turn; and (ii) combining GP with each of the remaining lists in turn. We consider a model search algorithm using the AIC statistic to compare competing models. We restrict the set of models to those with two-way interactions, omitting the
Omitting lists: “Leave-one-out”
We consider the influence of each list on the estimate of the population size, by omitting each list in turn. The estimates and 95% CIs are presented in Table 2, along with the sign of the included interaction terms. The population size estimates are highly variable for the different omitted lists. Identifying structured patterns within the output is non-trivial: omitting lists masks patterns in the cell entries, for example, a previous overlap between two lists becomes an observation in a single list when one of the sources is left-out, and different models (and interactions) will be identified given these changes. In all cases where interactions are chosen in both the full five-list and reduced four-list dataset analyzes, the direction of the interactions remains consistent (except for
MLEs and Associated 95% CIs for the Total Population Size for the UK Data, and Corresponding Model Selected in Terms of Interaction Terms Present with Associated Estimated Sign of the Interaction.
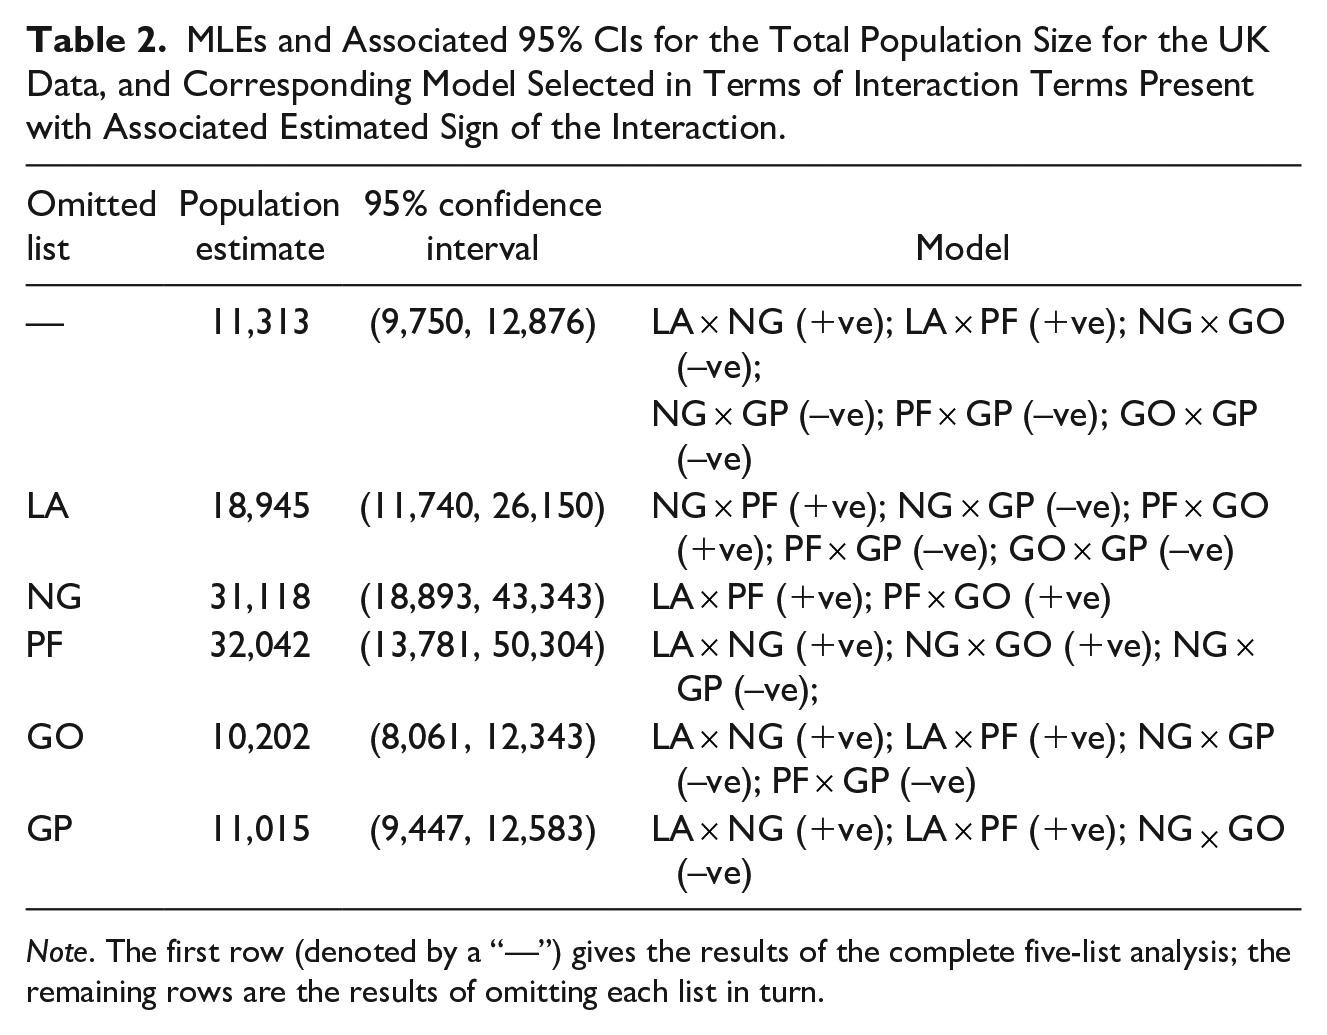
Note. The first row (denoted by a “—”) gives the results of the complete five-list analysis; the remaining rows are the results of omitting each list in turn.
Combining lists
The GP list has very little overlap with the other lists and no overlap with LA. Therefore, we combine this list with each of the other lists in turn and estimate the total population size from the reduced contingency table. The corresponding MLEs of the population size, 95% CIs and selected interaction terms are given in Table 3. To clearly denote which lists have been combined we “dot product” the list names, for example, the combination of GP and LA is denoted by “GP.LA”. The largest deviation from the population size estimate of the five-list dataset is observed when LA and GP are combined. These two lists have no overlap and their interactions with the other lists are in opposite directions. This appears to have resulted in some interactions cancelling each other out. For instance, in the five-list analysis GP
MLEs and 95% CIs of the Population Size for the UK Data Given the Model Selected, and Corresponding Model Selected in Terms of Interaction Terms Present (Estimated Sign).
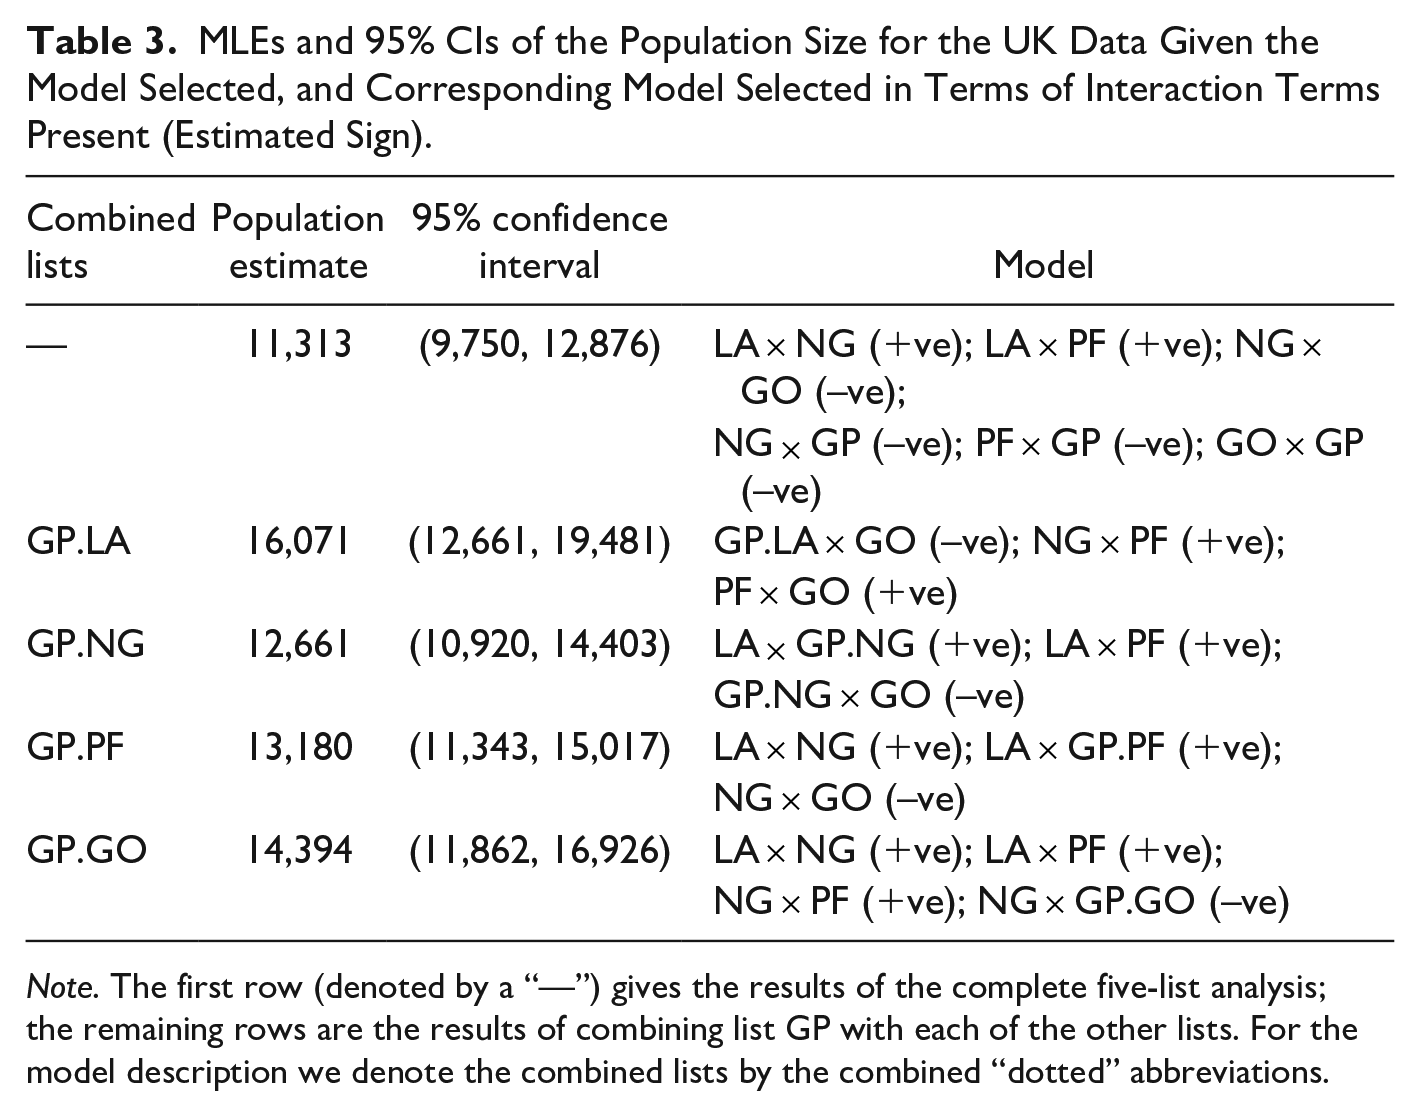
Note. The first row (denoted by a “—”) gives the results of the complete five-list analysis; the remaining rows are the results of combining list GP with each of the other lists. For the model description we denote the combined lists by the combined “dotted” abbreviations.
Romania Data
We consider data collected for Romania in 2015. Five lists are included corresponding to: Police/agency against trafficking in persons and border police (PF), International organization for Migration (IM), Non-Governmental organisations (NG), Foreign Authorities (FA), and Other (OT). A total of 879 individuals are observed, with the majority of these obtained by list PF (a total of 806 individuals are observed by PF; of these 758 are only identified by PF). Thus, PF dominates the other lists. IM observes a total of 48 individuals (one individual is unique to IM); NG observes 25 individuals (19 of these are observed by at least one other list); FA observes 72 individuals (all these individuals are observed by at least one other list); and OT has 66 individuals (with 34 only observed by OT).
Full data analysis
We conduct an analysis of the full five-list dataset. We restrict the model search to those including two-way interactions, and use the AIC statistic to determine the interactions present. The model selected as “best” had interactions:
Omitting lists: “Leave-one-out”
The population size estimates, 95% CIs and selected model when each list is omitted in turn, are given in Table 4. Removing the dominant list PF (of which 86% of the individuals on this list are only seen on this list) leads to a substantial decrease in the estimate of the total population. This is unsurprising given the dominance of this list in observing individuals. In particular, this source alone records 74% of all individuals observed; and 68% of all individuals observed are only observed by this list. Omitting the other lists leads to estimates similar to the estimate obtained when using all five lists. We note that removing the OT list leads to a larger and highly imprecise estimate of the population size. In line with the observations from the UK data, there is generally agreement across the different omissions in the interactions identified: where an interaction is identified to be present, the sign of the interaction remains consistent whenever the interaction is detected. On removing lists that have a negative interaction with the dominant list PF (i.e. IM, NG, and OT) the interaction terms identified are typically those identified by the five-list analysis with those featuring the omitted list removed. For list FA which originally displayed a positive interaction with the dominant list PF, and contains no unique individuals, the selection of interactions is somewhat different amongst the remaining lists.
Results for the Romanian Data in Terms of the MLEs and Associated 95% CIs for the Total Population Size Given the Model Selected, and Corresponding Model Selected in Terms of Interaction Terms Present with Associated Estimated Sign of the Interaction.
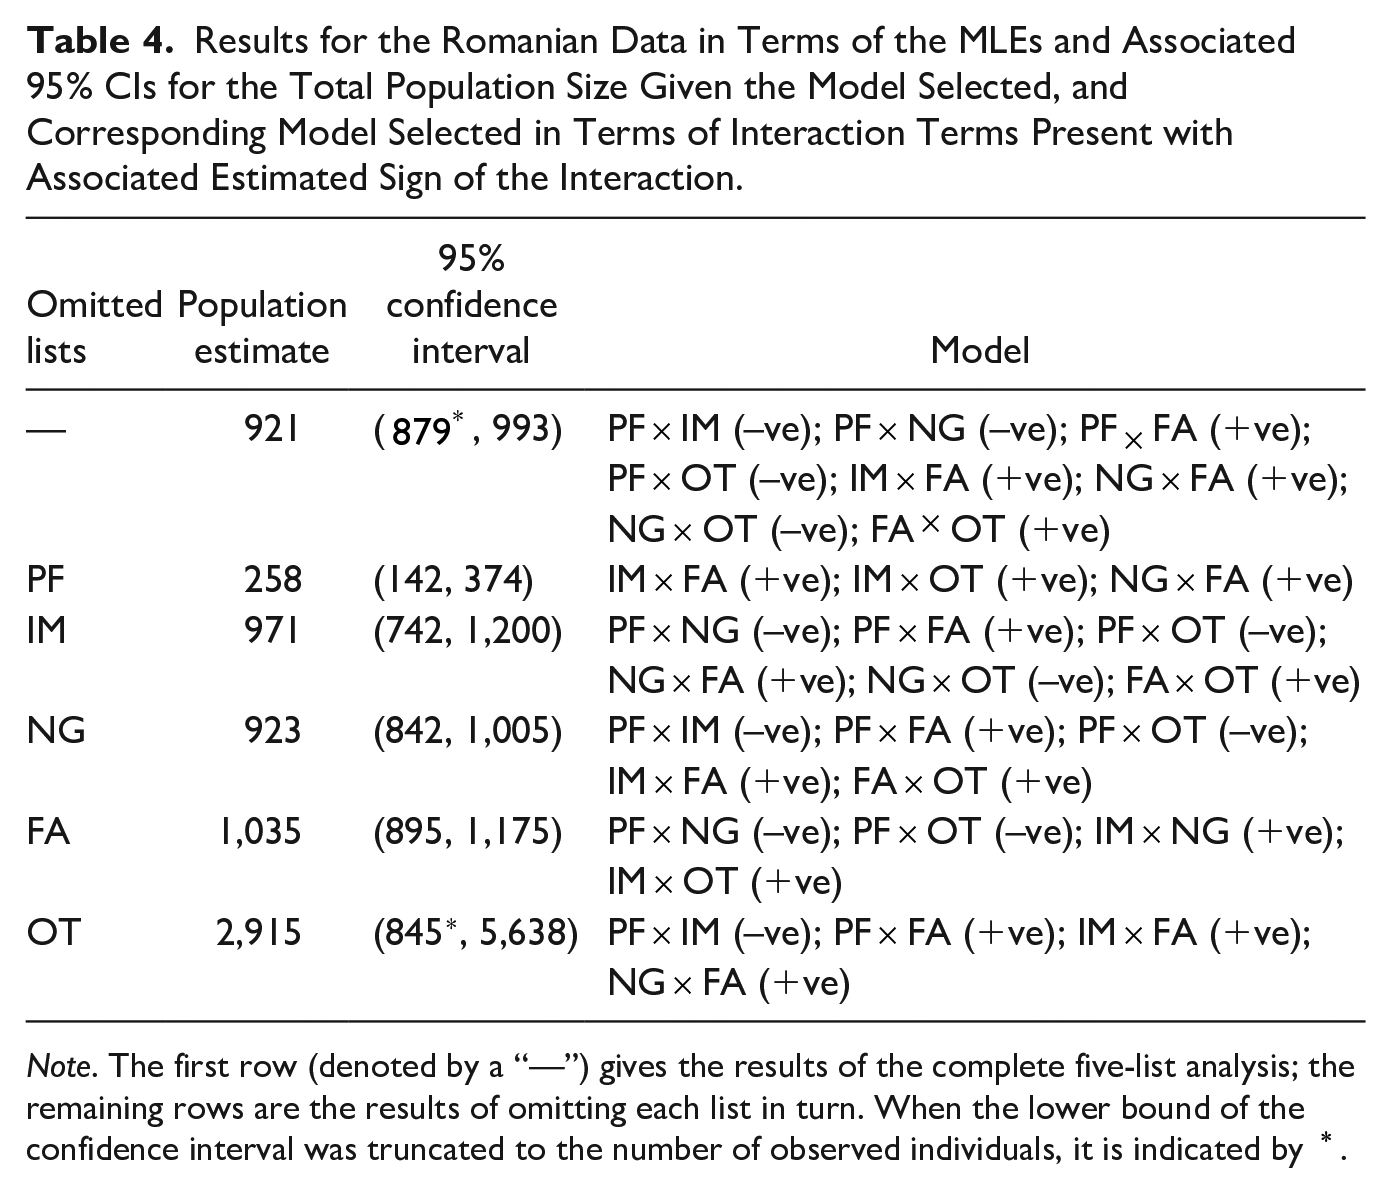
Note. The first row (denoted by a “—”) gives the results of the complete five-list analysis; the remaining rows are the results of omitting each list in turn. When the lower bound of the confidence interval was truncated to the number of observed individuals, it is
Combining lists
For the Romanian data, PF has minimal overlap with the other lists: only 48 individuals observed by list PF are observed by another list, which corresponds to only 6% of individuals observed by PF. We investigate the effect of combining PF with each of the other lists. Whilst this approach is similar to that of the UK data (combining with a minimally overlapping list), here there is a structural difference in that the list also accounts for the majority of observations. The corresponding results are given in Table 5. The estimates obtained in each of the combined list analyzes are reasonably consistent with substantially overlapping 95% CIs (compared with the estimate using all five lists). The largest discrepancy arises when combining list PF with list FA. This is potentially due to the complex relationship between these two lists: of the eight interactions identified in the five-list analysis, seven feature PF, FA, or both. Once again the interactions identified (and associated sign) are remain fairly consistent across analyzes. As for the UK data, the combining of lists leads to less variable estimates of population size compared to omitting lists.
Results for the Romanian Data in Terms of the MLEs and Associated 95% CIs for the Total Population Size Given the Model Selected, and Corresponding Model Selected in Terms of Interaction Terms Present with Associated Estimated Sign of the Interaction.
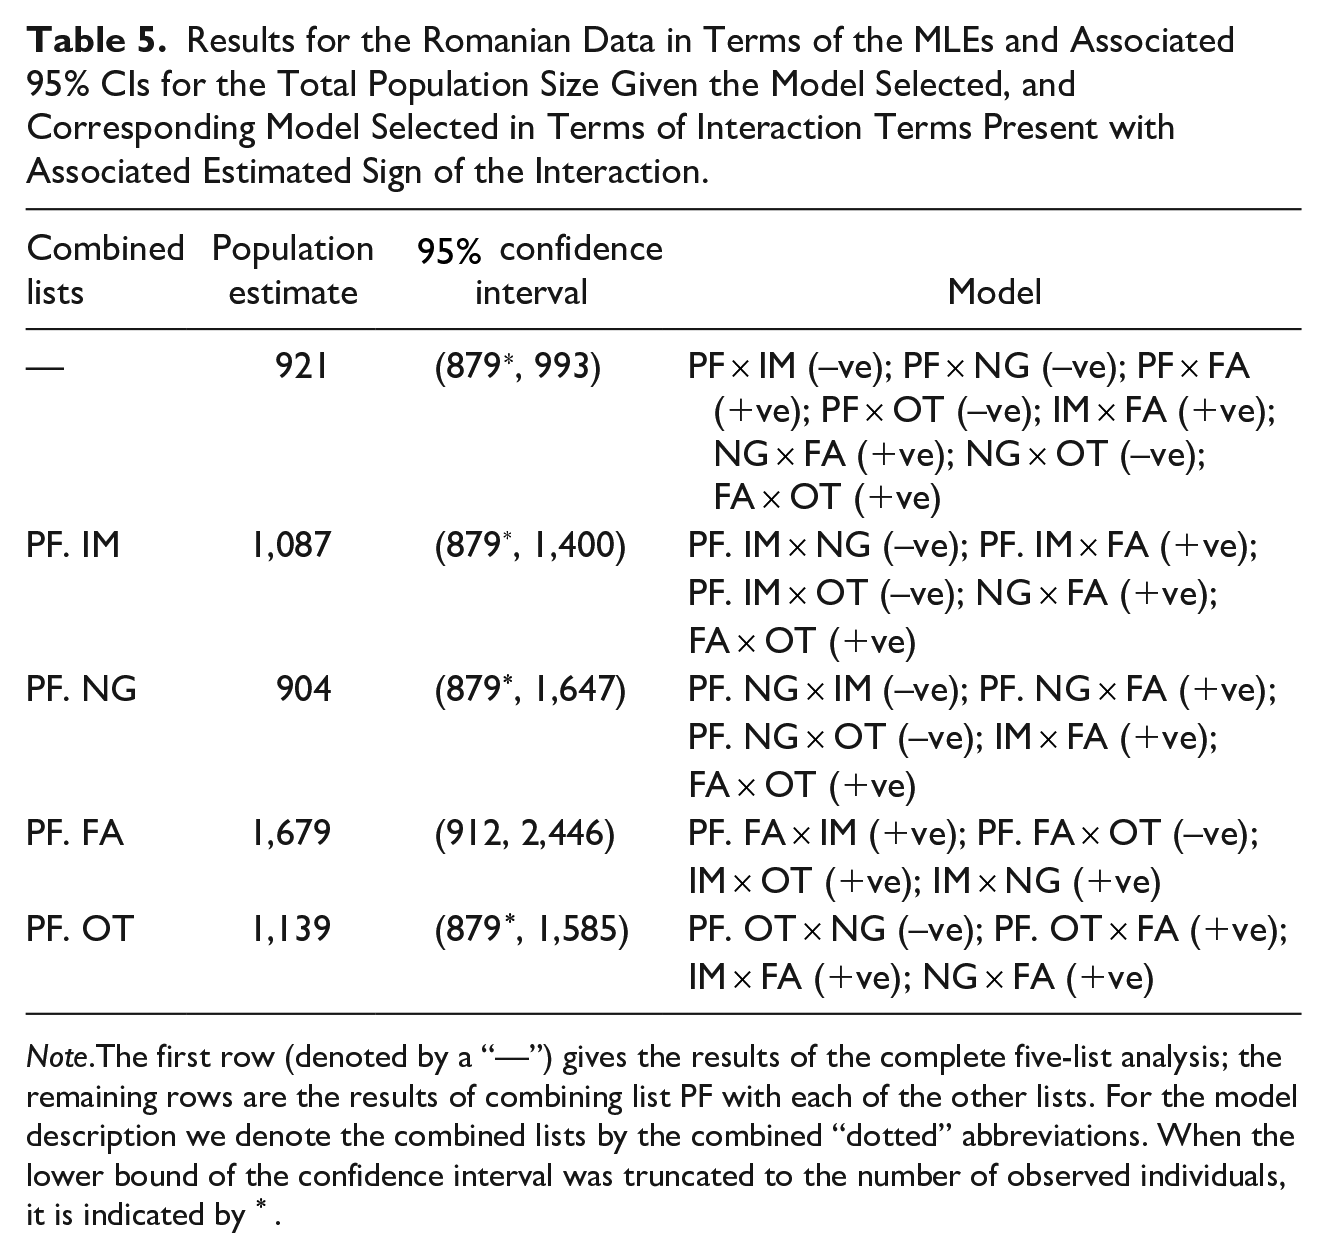
Note.The first row (denoted by a “—”) gives the results of the complete five-list analysis; the remaining rows are the results of combining list PF with each of the other lists. For the model description we denote the combined lists by the combined “dotted” abbreviations. When the lower bound of the confidence interval was truncated to the number of observed individuals, it is
The case studies suggest that analyzes should be conducted with some caution in the presence of minimally overlapping sources. In particular, omitting sources with limited overlap can lead to different behaviors in the estimate of the population size. Alternatively, combining a list with limited overlap to another list appears to provide less variable estimates. Thus, how we deal with such sources can have a significant impact on the population size estimate—and some sensitivity of the analyzes should be conducted. To investigate the impact further where the observed contingency tables are more “controlled”, we conduct a simulation study, motivated by the larger UK data.
Simulation Study
The simulation study is motivated by the UK dataset with five sources, which represents a common structure between the victims-of-slavery sources—in particular when there are two sources for which no individuals are observed in common (sources LA and GP). We use the fitted model to the full five-list data analysis (so that there are six interaction terms with non-zero effects) as the generating model within the simulation study and use the same list names for simplicity. We set the true population size to be equal to 11,313. We generate 500 datasets from the given (conditional Multinomial) model. Only the cell count corresponding to cell
Omitting Lists: “Leave-one-out”
For each simulated dataset we calculate the ratio of both the population estimate omitting the given source to the estimated total using all five lists; and the true population size (11,313). We plot these estimates against two further statistics corresponding to (i) the proportion of the total number of observed individuals by the source that is subsequently omitted; and (ii) the proportion of overlap for the given list that is omitted (i.e., the proportion of individuals observed by the given list that are also observed by at least one other list). These results are plotted in Figure 1, where the left-hand plots, (a) and (c), correspond to the associated population size ratio for the estimate using all five lists plotted against (i); and the right-hand plots (b) and (d), correspond to the population size ratio for the estimate with the true simulated population size plotted against (ii). The black dots show the same quantities for the original UK data.
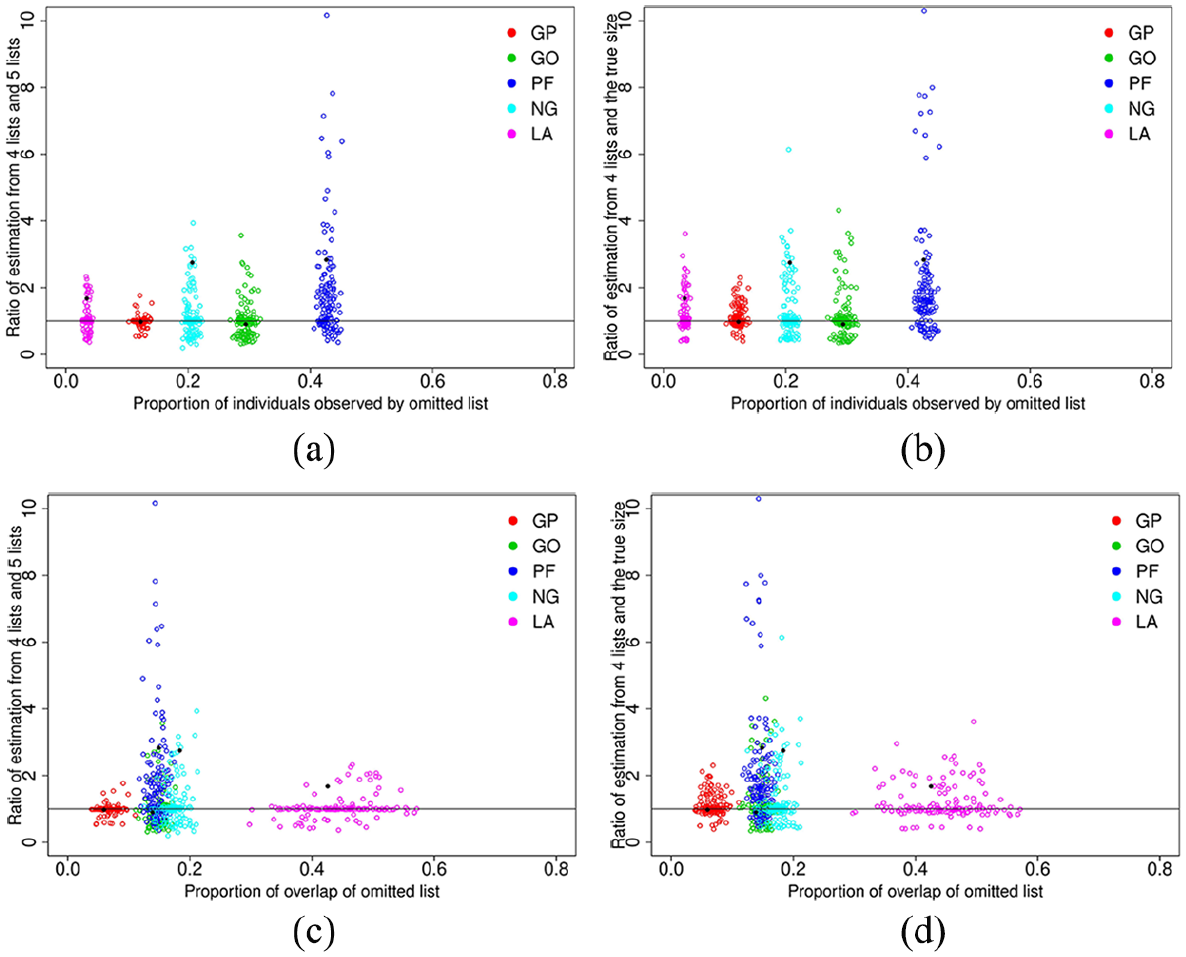
Ratio of estimated total population size using only four of the lists to the estimate obtained using all five lists plotted against proportion of individuals observed by omitted list (a) or proportion of overlap of omitted list (c); and similar plot for the ratio of estimated total population size against true simulated value plotted against proportion of individuals observed by omitted list (b) or proportion of overlap of omitted list (d). The black dots show the same quantities for the original UK data.
The relationships observed in the plots are similar when considering the true population size; or the estimated population size using all five lists (i.e., the columns in the figure are similar): although, the variability appears to be slightly greater when using the true population size. In general, the greater the proportion of individuals observed by a given list, then omitting that list leads to a greater variability in the estimate of the population size. Further, within this simulation study the variability of the estimates appears to be more dependent on the number of individuals observed by the given list that is omitted, as opposed to the proportion of overlap for that list—this is demonstrated by relatively similar estimates for LA and GP which observe the smallest number of individuals but have very different overlap patterns. Finally, we comment that there does not appear to be any structural over or under estimate of the population size when omitting any of the particular lists. However, we do note that underestimates do have a lower bound (i.e., the total number of individuals observed by the sources); whereas overestimates have no such bound and thus overestimates may be larger in magnitude.
To investigate further the performance of the estimates, we consider the 95% CIs of the estimated population sizes and compare these with the true simulated population size. When considering all five lists, 69% of the 95% CIs contained the true value of the parameter. This is less than the nominal 95% level that we would expect and would indicate perhaps that there are further potential issues (e.g., relating to model selection; see below for further discussion). However, we are primarily concerned with the impact of omitting each list, and thus we use this 69% as a comparison when we subsequently omit each list. The coverage probabilities in each case correspond to: 69%, 63%, 41%, 58%, and 63% when removing GP, GO, PF, NG, and LA, respectively. Further, the median of the length of these CIs for the models with five lists is 3,341. Similarly, the median of the length of the 95% CIs after removing GP, GO, PF, NG, LA is respectively 3,451, 5,076, 12,058, 4,277, 3,402. Thus, omitting the list GP leads to very similar performance as the full five lists (in terms of coverage and precision of the estimate) and suggests that the additional information that this list provides is minimal. Omitting lists GO, LA, and NG leads to a relatively similar reduction in performance in terms of reduced coverage probabilities and precision. However, omitting list PF leads to a significant decrease in performance—this list also corresponds to the list that observes the greatest number of individuals.
Finally, we consider the impact of the model selection process by simply using the generating model or alternative form of the model. For the generated and alternative models for the reduced four-list sources when omitting a list, the coverage probabilities were significantly higher and equal to 97% with using the five lists and 97%, 93%, 100%, 96%, and 91% when removing GP, GO, PF, NG, and LA, respectively. Further, the median of the length of the 95% CIs are increased to: 14,483 with five lists, 15,049, 22,105, 55,400, 31,362, 20,781 after removing GP, GO, PF, NG, and LA. Thus model selection has a significant impact on the performance of the MSE approach—we return to this issue in the discussion section.
Combining Lists
For each simulated dataset, the list GP is combined with each of the other four lists in turn and the associated total population size is estimated. Figure 2 provides the corresponding plots of the ratio of the estimated population size using the combined lists compared to the estimated total using all five lists (in the left-hand plots); and the true population size used to simulate the data (in the right-hand plots), compared to the percentage of overlap of the source GP with the list it is combined with. The black dots show the same quantities for the original UK data. As for the above case of omitting the lists there is greater variability in the ratio of the estimated population size with the true value, compared to the case when we consider the estimated value using all five lists. Interestingly, within this simulation study there appears to be a clear and consistent overestimate of the total population size when we combine the GP list with the LA list—for which in the real UK data there was no overlap observed. However, combining the list GP with the other lists (GO, PF, and NG) appears to provide less biased estimates of the total population size, and a reduced level of variability in the ratios. There also appears to be a slight decrease in the variability of the estimated ratio as the proportion of overlap of the combined lists increases.
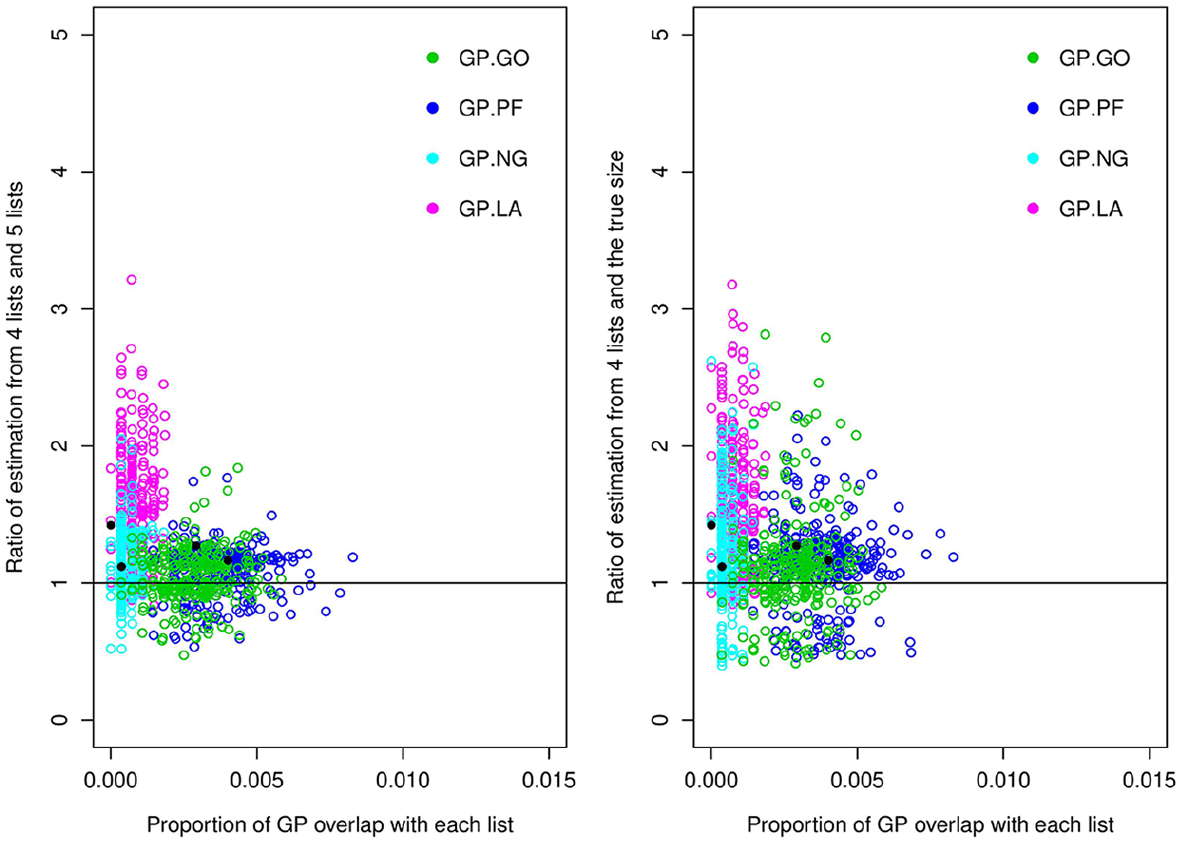
Ratio of estimated population size using four lists with GP combined with each source in turn with (i) the estimated population size using all five sources (on the left-hand side); and (ii) the true population size used to simulate the data, compared with the percentage of the list GP overlap with the given list it is combined with. The black dots show the same quantities for the original UK data.
For the set of retained datasets, the 95% CIs for the estimated population size using all the five lists, include the true value of the population size in 67% of the simulated datasets, with a median length of 3,281. After combining GP with LA, NG, PF, GO this coverage probability is reduced to 23%, 51%, 33,%, and 54%, respectively. The median length of the 95% CIs were 7,480, 4,033, 3,814, 4,058, respectively after combining GP with LA, NG, PF, and GO. Thus combining GP with each of the other sources leads to substantially worse performance in terms of coverage probabilities, particularly for LA and PF. With regard to LA (for which this has very small overlap across the simulations), not only does combining the GP list with the LA list lead to poor estimation of the total population size (i.e., a general overestimate and substantially reduced confidence interval performance) but the uncertainty of the estimate is also relatively large. Finally, to provide some insight into the impact of model selection within the analyzes we also consider the generating and associated alternative models. In these cases the coverage probability are significantly increased to 90% (for the generating model) when using the five lists and 92%, 97%, 94%, and 93% after combining GP with LA, NG, PF, and GO, respectively, for the reduced model. The corresponding median length of the 95% CIs are also increased to 13,310 when using all five lists, and 24,055, 15,702, 15,868, 15,183 after combining GP with LA, NG, PF, and GO, respectively. This is a similar observation as for the case of omitting lists but without any a large increase in the size and variability of the length of the CIs.
The simulation studies suggest that the population size estimates can be sensitive to a number of different factors, including the number of sources that we include in the analysis and how we define a single source (i.e., a combined source). In general, assuming that we fit the generating model or the alternative version of this model (when we omit or combine a list) the corresponding population size estimates appear to be reasonable with generally good coverage probabilities. However, when adding the associated model search algorithm (using the AIC statistic as the criteria) the performance drops significantly and also appears to overestimate the precision of the resulting estimates.
Discussion
Collecting data from the different (and potentially diverse) sources and conducting the collation across the different lists requires resources. These resources may be limited, for example, in terms of person time or money. Thus, understanding the importance of different lists can have a direct impact on future data collection, and allocation of resources. Questions may particularly be raised in relation to sources that, for example, observe only a relatively small number of individuals, or those which have minimal overlap with other sources, since MSE relies on overlap between courses in order to estimate the total population size. This latter situation is very common in modern slavery applications—in this paper we considered the robustness of MSE in the case of small overlap between sources.
To reduce the minimal overlap between sources two approaches can be adopted: remove a source; or combine a source with another. This latter step may be done prior to any analysis being conducted, as may be done not only where there is minimal overlap but also in the opposite case where the overlap is substantial as was the case with UK data where the police force data was combined with the National Crime Agency data (Silverman, 2014). The analyzes conducted within this paper suggests a note of caution with regard to the application of MSE to modern slavery data. In particular changes to the lists (omitting a list or combining two lists) could potentially have a significant impact on the total population size estimate—although combining lists appeared to have a lesser effect than simply omitting a list. Overall the model selection algorithm implemented—and in particular the use of the AIC statistic commonly used within MSE approaches, see Coumans et al. (2017); Silverman (2014); Van der Heijden et al. (2012)—had a significant effect on the performance of the MSE. It is possible that several competing models may be regarded to fit the observed data equally well but yet have very different estimates for the population size. These observations lead us to make the following minimum recommendations when implementing an MSE approach:
Fit multiple models to the data to investigate the sensitivity of the estimates to the different models—this would particularly include “similar” (i.e., neighbouring) models;
Investigate the robustness of the estimate by omitting each source in turn and repeating the analysis;
Combine pairs of sources together and again investigate the robustness of the parameter estimates; and
Conduct a simulation study to gain an understanding of the performance of the analyzes (e.g., using the MLEs of the fitted model as the generating model, as for the simulation study conducted within this paper based on the UK data).
The above aim to provide a greater understanding of the particular dataset and analysis. If similar estimates are obtained under the different scenarios there is some reassurance in the approach being robust. However, deviations may indicate some particular interesting aspect of the data. For example in our case for PF from the Romanian data lead to a significant decrease in the population estimate—and on inspection this was most likely due to the large number of (unique) individuals observed by this source. This in turn may be investigated to understand why so many individuals are only observed by PF, for example.
The simulation study suggests that the use of the AIC statistic as the model selection criteria may not be optimal, leading to poor coverage estimates of the true population size and over-confidence in the estimate. Alternative criteria exist, such as the Bayesian information criterion (BIC; Schwarz, 1978) and Focused information criterion (FIC; Claeskens & Hjort, 2003). Thus these different criteria could also be investigated within the exploratory analyzes and added to the list of recommendations above. Further, with regard to model selection, an additional approach to consider includes a model-averaging approach, and thus removing the reliance on a single model. A weighted average over the set of plausible models can be calculated, so that the population size estimate includes both parameter and model uncertainty. See for example, Buckland et al. (1997) in the classical framework and Hoeting et al. (1999); King and Brooks (2001); Madigan and York (1997) in the Bayesian framework. If the set of plausible models all provide similar estimates of the total population size, then so too will the model-averaged estimate; however if the estimates differ between models the model-averaged approach will provide a weighted point estimate but typically have an associated significantly larger uncertainty interval to convey this additional uncertainty. In this latter circumstance it is useful to not only provide a single model-averaged estimate but also the set of most likely models and their associated estimate.
Another issue that we have not considered within this data analyzes but may arise relates to cross-referrals, where one (or more lists) may refer individuals to other agencies but not vice-versa leading to asymmetry. For example, cross-referrals by another list to police may almost always be made when a child is or has been at risk. Cross-referral is also more likely when there is the prospect that an intelligence-led police raid could lead to the rescue of a clutch of other victims of modern slavery (Bird, 2019). Reports on MSE estimation of modern slavery, such as in Serbia and Ireland (23 Romanian men exploited in a waste recycling plant), for the United Nations Office on Drugs and Crime mention the context of annual counts for rescued victims being inflated by a particularly successful police operation. More generally, we acknowledge that MSE needs to evolve to take into account the underlying networks by which victims came to be listed. For example, a rescued victim may provide information leading to the rescue of other individuals, so that individuals are not independent of each other. Hence, in addition to list-membership and (selective) cross-referrals, consideration may also need to be given to the size and context of the rescued victim-network that selective cross-referral gives rise to. The current presentation of the data in terms of simply the presence of individuals on different lists discards the temporal information, so that it is not possible to take into account (or estimate) referrals between lists; or possible relationships between identifications. Worthington et al. (2019) discuss similarities with ecological capture-recapture data where such temporal information is available and could provide insight/motivation for extended MSE models if such temporal information is available for modern slavery data. The challenges of modern slavery motivates further developments of MSE to incorporate the above particular complexities of the different processes acting on the and between the different lists used to identify victims.
Footnotes
Declaration of Conflicting Interests
The author(s) declared no potential conflicts of interest with respect to the research, authorship, and/or publication of this article.
Funding
The author(s) received no financial support for the research, authorship, and/or publication of this article.