
Abstract
Benchmarking theories argue voters use information about other countries’ performances, usually on the economy and obtained through experience or media, to evaluate their own governments. Yet existing observational evidence is relatively fragile and struggles to distinguish how people become more knowledgeable. Using a pre-registered experiment, we showed UK respondents a chart displaying the UK’s exceptionally high cumulative COVID-19 deaths either in isolation or alongside European countries with fewer deaths. Mimicking widely-circulated charts, this visual treatment enhances our study’s external validity and tests the media-based channel for benchmarking. Aligned with pre-registered expectations, seeing the UK as “worst of the bunch” compared to UK-only data caused more negative government evaluations. Unexpectedly, partisanship did not moderate the information effects, while exploratory tests revealed the visuals generated more negative evaluations among respondents with high political trust. Our study shows international comparisons in visual forms can change domestic opinion, and on matters beyond strictly economic performance.
There has been long-standing interest in when and how voters ascribe responsibility for handling crises to different political actors, including their own governments (Hobolt & Tilley, 2014; Malhotra & Kuo, 2008). Although polarization along partisan lines also shapes patterns of blame attribution (Lyons & Jaeger, 2014) as well as other political outcomes (Iyengar et al., 2019), voters take information about incumbents’ performance into account when forming attitudes (Carlin et al., 2021). Explaining how citizens use such information to hold their governments accountable is central for democratic functioning—particularly during crises (Bol et al., 2021; Jørgensen et al., 2021).
In the context of economic voting during downturns, benchmarking provides a potentially powerful mechanism by which citizens use comparative information to evaluate the economic performance of their own government against others, punishing incumbents’ underperformance while rewarding overperformance compared to international peers (Aytaç, 2018b; Besley & Case, 1995; Powell & Whitten, 1993). Benchmarking has also been applied more widely to explain changes in support for European integration (De Vries, 2018; Martini & Walter, 2023). Yet the arguments for its presence attract several criticisms. Theoretically, its cognitively demanding assumptions strongly contrast with the common depiction of citizens as being generally uninformed about political and economic issues (e.g., Achen & Bartels, 2016; Lupia, 2015). Expecting voters to understand and act upon complicated economic data may set an unrealistically high bar. Empirically, much of the recent evidence for benchmarking relies on observational data involving choices of modeling and interpretation that subsequent re-analyses have shown to produce relatively fragile results, finding that alternative specifications using the same data produce null outcomes (Arel-Bundock et al., 2021).
While defenders of benchmarking have issued rebuttals to these charges, e.g., in Aytaç (2018a) and Kayser and Peress (2021), we cite the issues primarily as examples of how finding evidence of benchmarking in observational data can be difficult, which in turn suggests a need to also use experimental approaches (Healy & Malhotra, 2013). As it turns out, the limited field and survey experimental evidence available suggests a greater plausibility for benchmarking in diverse contexts involving both hypothetical and realistic task environments (Aytaç, 2020; Bhandari et al., 2021; Hansen et al., 2015; Hart & Matthews, 2022). Therefore, the questions of whether citizens benchmark their governments’ performances, how they do so, and under what circumstances are hardly settled.
In this paper, we contribute understanding about the benchmarking mechanism as a way by which voters form attitudes about their governments’ performances—which has implications for subsequent behaviors and preferences. We do this by both building on the recent and fruitful focus on experimental approaches and using the case of COVID-19 which affords unique opportunities for exploring the micro-foundations of benchmarking. Specifically, we ask (1) whether information about a country’s cumulative number of COVID-19 mortalities presented in isolation impacts how people perceive their government’s handling of the crisis, and (2) whether these perceptions change when comparative information about other countries’ own cumulative mortalities are included as well.
Drawing upon a pre-registered survey experiment (N = 2917 UK citizens) fielded in the UK through the wake of its first wave in July 2020, which was globally one of the worst in terms of mortality, we present two sets of findings. First, in line with our pre-registered expectation, people punished the incumbent government when its relatively poor standing among peers as the “worst of the bunch” in terms of cumulative deaths was made visible. Specifically, those who saw a graph that depicted the UK’s COVID-19 cumulative mortality figures plotted alongside those of nine other European countries—all of which had similar leveling trajectories but fewer deaths overall than the UK at the time—expressed modestly more negative evaluations of the government’s handling of the pandemic compared to those who saw the same graph without the comparative benchmarks. The direction and size of this main effect (about 0.1 of a standard deviation) corresponds with recent work on benchmarking during the pandemic (Becher et al., 2023 in France, Germany, and the UK; Martinez-Bravo & Sanz, 2023 in Spain; Shin & Park, 2022 in South Korea).
Second, we show that levels of political trust, but not partisanship, moderated respondents’ evaluation of government performance given cumulative mortality data. Against our pre-registered expectation, we did not find heterogeneity with respect to partisanship in either of the conditions: effects among respondents supporting opposition parties were not more unfavorable compared to those supporting the incumbent Conservative party. However, in exploratory analysis separate from the pre-registered hypotheses, we found that high levels of political trust were associated with significantly more critical evaluations of government in both information conditions, compared to the effect at mean levels of trust. This suggests that political trust may have acted as an expectation of a certain level of performance that was frustrated, rather than as a buffer of goodwill able to absorb perceived government failures.
Our design and case make several advances on existing work. First, since the spread of COVID-19 is a type of crisis on a scale previously unknown to most voters, it enables us to specifically assess whether and for whom providing explicitly comparative information matters for patterns of blame attribution. Economic benchmarking theories outline two possible means by which voters obtain this information: either from previous experience of economic turbulence (Lewis-Beck & Stegmaier, 2000) or from external sources including elites and media that “pre-benchmark” (Kayser & Peress, 2012) information in how they selectively report on the economy. By virtue of the unique global situation presented by the pandemic, our study provides a clearer test of whether conveying comparative information in modes mirroring those found in media has the expected benchmarking effect.
Second, throughout the pandemic to date, quantitative information has been particularly salient, arguably more so than in previous crises studied by political scientists such as the 2008 economic recession or natural disasters such as Hurricane Katrina. Moreover, this information has taken highly visual forms in media that clearly convey comparative dimensions (Falisse & McAteer, 2022; Financial Times, 2020; Roser et al., 2021) that elites have used for political purposes (Pentzold, Fechner, and Zuber 2021). For example, when the UK stopped displaying its national mortality figures against other European countries during its daily broadcasts from May 2020 onwards, the opposition party leader Sir Keir Starmer claimed “when we did not have the highest number in Europe, the slides were used for comparison purposes, and as soon as we hit that unenviable place, they have been dropped” (Hansard, 2020). This presents a clear political implication which we aim to test in this study: comparative benchmarks should matter for public evaluations depending on what they reveal about incumbents (Allen et al., 2024). For context, the UK continues to have the highest number of mortalities attributed to COVID-19 in Europe, standing at over 233,000 deaths as of December 14, 2023 (UK Government, 2023) placing it sixth globally (Our World in Data, 2024). Yet despite the obvious relevance of visual media for communicating information, few experimental studies have considered this format for benchmarking during COVID-19, with the exception of Martinez-Bravo and Sanz (2023) who use bar charts displaying proportions of COVID-19 contact tracers by region in Spain to indicate relative differences in this service. Crepaz and Arikan (2021) do convey Irish COVID-19 statistics in a visual dashboard, but their primary concern involves the effects of information disclosure rather than benchmarking in the sense we are pursuing. To be clear, given our design which did not include a text-only information condition, we do not make claims about the distinctive effect of visuals compared to textual formats.
Third, our pre-registered experimental approach addresses concerns about how to attribute shifts in information to the expectations presented by benchmarking. Cross-sectional data—and decisions about how to separate signals of international performances from national ones—pose significant challenges to making causal claims. By contrast, we designed our treatments to tightly focus on the presence of comparative data presented in simple and visual forms that typify those used in digital media (Engebretsen and Kennedy 2020). Therefore, we contribute evidence of whether and how different forms of information impacts outcomes of significance to politics, and theoretically develop micro-foundational understanding about visual aspects of benchmarking.
Benchmarking and Evaluations of Incumbents During Crises
Our overall theoretical argument is that visual information revealing one country’s relatively worse performance compared to its peers (a form of “benchmarking”) causes citizens of that country to evaluate their government more negatively. We do so in three steps. First, we outline the assumptions of, and evidence bases for the benchmarking mechanism as a way of explaining incumbent evaluations—originally developed in contexts of retrospective economic voting. Second, we extend this logic into the visual realm and the domain of COVID-19. Third, we consider how partisanship and prior knowledge, which are factors shown to matter for patterns of blame attribution during crises, potentially place scope conditions on the effects of providing factual information on attitudes regarding government performance.
Benchmarking as an Explanation of Incumbent Evaluations
It is well-established that voters tend to punish incumbents during moments of crisis, either by blaming them for the problem or its perceived mishandling, rejecting them at the ballot box, or both (Ahlquist et al., 2020; Hobolt, 2015). But how and on what basis do they exert this accountability? A prominent debate considers whether evaluations of the government and attributions of responsibility are sensitive to information made available either through media or politicians themselves (Carlin et al., 2021; Damstra et al., 2020; Green et al., 2020; Malhotra & Kuo, 2008; Yagci & Oyvat, 2020). On the one hand, evidence suggests that citizens do take incumbents’ prior performance into account when casting their votes, particularly on economic issues (Lewis-Beck & Stegmaier, 2000; Nadeau et al., 2012). On the other hand, there are good reasons to doubt the extent to which voters can and do behave this way. Theoretically, such retrospective voting relies on people being able to accurately sense, sort, and act upon information—a requirement standing at odds with extant observations about widespread ignorance and misperceptions among electorates on a host of issues (Achen & Bartels, 2016; Lupia, 2015). In response, a third way argues that, while voters can take past performance into account as they evaluate their governments, this process faces several threats and scope conditions which may still result in mistakes (Duch & Stevenson, 2010; Healy & Malhotra, 2013).
Aligned with this middle option, we aim to develop the micro-foundations of benchmarking as a potential mechanism that links shifts in available information to evaluations. Benchmarking theories argue that, when voters learn about other peer countries’ economic performances, they use this knowledge to form reference points from which they measure and either reward or punish their own government’s performance (Aytaç, 2018b; Kayser & Peress, 2012; Powell & Whitten, 1993). Voters obtain this knowledge in two possible ways: either from previous experience of economic turbulence (Lewis-Beck & Stegmaier, 2000) or from external sources including elites and media that “pre-benchmark” (Kayser & Peress, 2012) information in how they selectively report on the economy. Therefore, voters should respond in predictable ways to information about their country’s performance depending on the availability of relevant benchmarks and what those benchmarks reveal about the relative status of incumbents.
Yet this intuition, while appealing, has attracted criticism for reasons related to the broader debate on retrospective voting which benchmarking aims to explain. First, the evidence base for benchmarking largely comprises analyses of observational survey data that subsequent studies have shown to be fragile in the face of alternative model specifications and ways of separating national performance measures from global ones for which there no clear consensus (Arel-Bundock et al., 2021). Second, empirically distinguishing the predicted micro-foundations of prior experience from pre-benchmarking by elites is difficult to do using such cross-sectional data about economic issues. Third, regardless of which side one takes on these empirical questions, standard views on benchmarking still assume voters can accurately sense and evaluate abstract information, which may set an unreasonably high bar of competency.
Experimental approaches help to overcome the first of these concerns while probing the scope conditions under which benchmarking may occur (Healy & Malhotra, 2013). By exogenously providing information in controlled settings that is explicitly comparative, experiments can complement efforts to identify the causal effect of benchmarks. Indeed, recent work suggest that voters engage in behaviors consistent with benchmarking in both hypothetical and realistic situations (Aytaç, 2020; Bhandari et al., 2021; Hansen et al., 2015; Hart & Matthews, 2022). Yet this does not address the second and third concerns.
Here is where our choice of issue domain and experimental design—detailed in the “Data and Methods” section—uniquely positions us to contribute to theories of benchmarking. Specifically, we use the context of COVID-19 which presents a valuable case for examining the media-based channel of benchmarking. This is because, as a global crisis whose scale and magnitude was previously unknown to electorates, respondents would not have had prior experience of pandemic-related events which could have also informed their evaluations. 1 Meanwhile, as we explain later, the timing of our experiment at the end of the first global wave in July 2020 but prior to widespread announcement of the successful Oxford/AstraZeneca vaccine means that we can be confident that our results reflect the opinions of UK-based respondents on how the government had handled a novel crisis that still did not have a clear end, as opposed to rewarding it for quickly producing a viable vaccine.
Relatedly, our visual treatment enhances the ecological and external validity of the experiment with respect to the media-based channel. Graphical visualizations that distill messages from complicated data are increasingly accessible by the public in various media (de Haan et al., 2018; Engebretsen and Kennedy 2020) and potentially impact political behaviors by changing the informational bases of voters’ decisions (Allen, 2023; Young et al., 2018). As such, people are not assessing an entire complex dataset, but rather a simplified rendering that draws attention to key aspects for them (Amit-Danhi, 2022). This aligns with the expectation that media “pre-benchmark” (Kayser & Peress, 2012) information in the ways they selectively report on the economy. Moreover, the comparative line graphs showing COVID-19 mortalities which we replicate in our experiment were particularly visible and widely referenced, including in daily national UK press conferences during the first wave (Allen et al., 2024), and usually accompanied by commands to “flatten the curve” (Pentzold, Fechner, and Zuber 2021). As countries’ case records extended, these visuals served as sources of information that citizens could draw upon to evaluate how well their government was handling the pandemic compared to other countries. 2
To date, research suggests a strong plausibility for benchmarking occurring during the first wave of the pandemic. For instance, evidence drawn from European surveys about incumbent support during the early stages of the pandemic suggests that citizens were already paying attention to events happening in other countries—such as Italy’s lockdown in March 2020—even as their own governments’ course of action was unclear (De Vries et al., 2021). Meanwhile, observational survey data from South Korea in April 2020 demonstrates how citizens holding more favorable views of the government’s relative COVID-19 performance were more likely to express higher presidential approval ratings (Shin & Park, 2022). This pattern coincides with results from cross-national observational European data (Bol et al., 2021) and experimental data collected across France, Germany, and the UK (Becher et al., 2023) around the same time.
Factors that Moderate Information Processing: Knowledge and Partisanship
However, there are two important factors that potentially moderate how citizens process information, coming from the distinct yet related literature examining how voters attribute blame to their governments during crises. First, people holding different levels of political knowledge engage in different patterns of blame attribution, with less knowledgeable individuals being more likely to blame a government currently in office—even if it had little to do with a given crises—because it is more immediately familiar and proximate to the problem at hand (Gomez & Wilson, 2008; Luskin, 1987). Conversely, more knowledgeable individuals tend to divide responsibility among several recipients, especially in complex crises with multiple actors.
Second, partisanship can lead to biases in blame attribution: partisans opposite to the incumbent are more likely to attribute fault to the government and negatively evaluate its performance (Hellwig & Coffey, 2011; Tilley & Hobolt, 2011). This has been shown to also occur in moments of economic crisis (Bisgaard, 2015): while citizens may agree on factual statements about a situation, they still resort to partisan reasoning as they form opinions and assign blame (De Vries et al., 2018; Lyons & Jaeger, 2014). However, whether this reasoning held during the early period of the COVID-19 pandemic in which we conducted our study is unclear. On the one hand, during the initial wave of the pandemic, research from the US context suggested that partisans viewed the pandemic through very different lenses: in March 2020, Democrats were much more likely to adopt behaviors in line with public health guidance compared to Republicans, as well as express greater concern about the pandemic’s consequences for themselves and the country (Gadarian et al., 2020). Meanwhile, longitudinal survey evidence from European countries including the UK shows how citizens who voted for the incumbent government in the previous national election were more likely to support their government’s handling of the crisis during 2020 (Jørgensen et al., 2021). On the other hand, experimental evidence from the US around the same time as our study shows that emphasizing then-President Trump’s handling of the pandemic did not impact beliefs, attitudes, or behavioral intentions (Spälti et al., 2021).
Hypotheses: Visual Comparative Benchmarks Change How Voters Evaluate Government Performance
Given this background, our study considers whether such visual representations of longitudinal information about cumulative COVID-19 mortalities impacts evaluations of incumbents even after accounting for a variety of factors including partisan leanings and self-perceived numeracy. 3 Although leaders often initially benefit from “rally-round-the-flag” effects in the face of shocks and crises (Mueller, 1970), voters evaluations generally turn negative as time goes on. This has also been in the case with COVID-19: multiple presidents and prime ministers saw large increases in their public support immediately after the World Health Organization declared COVID-19 to be a pandemic and governments imposed restrictions such as lockdowns (Bol et al., 2021; Jennings, 2020) that have since worn off (e.g., Johansson et al., 2021).
Within this context, our pre-registered hypothesis was that high mortality figures—more than 40,000 in the UK at the time of our experiment—would be perceived as a straightforward sign of the government’s failure in handling the crisis.
4
Moreover, if benchmarking were occurring, seeing information confirming a country’s status as the worst-performing among peers on this metric should cause even more negative evaluations.
However, we acknowledge the potential for partisan motivated reasoning to bias how some respondents will interpret the information (Bisgaard, 2015), although recent work questions the likelihood of heterogeneous effects (Coppock, 2022). Respondents whose partisanship matches the government might be more likely to discount the negative information, and consequently be less likely to attribute blame for the situation to the government’s actions (Jørgensen et al., 2021). As such, we expected these effects would interact with partisanship:
We also implemented an exploratory interaction hypothesis after data collection, following from work that emerged at the beginning of the pandemic and during our period of analysis on the role of political trust in shaping attitudes and preferences (Bavel et al., 2020; Devine et al., 2021, 2023). Considering this work, we examined whether respondents’ levels of political trust mattered for the information treatment effects. Prior scholarship shows how, in ordinary times, citizens’ levels of trust in government institutions matter for their perceptions of performance: less trust leads to less positive evaluations (Chanley et al., 2000). Global perceptions during the initial wave of COVID-19 also displayed a positive association between levels of trust and evaluations of how governments were handling the pandemic (Lazarus et al., 2020; Narlikar & Sottilotta, 2021). Moreover, experimentally disclosing information about the dynamics of the early stages of the pandemic—including comparative information displayed in visual dashboards that typified publicly available outputs at the time—appeared to create a feedback loop whereby people holding already low levels of trust expressed even more negative views of authorities (Crepaz & Arikan, 2021).
Therefore, we expected that respondents holding lower levels of trust in government would be more affected by information conveying high mortality levels. Since high-trusters would presumably be pre-disposed to believe that government generally has their best interests at heart, this pre-dispositioning would serve to cushion to blow of the suggestion that government is not performing at the level that it ought. We operationalized high levels of trust as one standard deviation above the mean on our trust scale (see Data and Methods) and took the contrast to be the mean level of trust.
Data and Methods
Experimental Design and Treatments
We designed and pre-registered a between-subjects survey experiment in which we randomly assigned respondents to one of three conditions. 5 In the Control condition, respondents answered standard sociodemographic and political questions, as well as a series of questions measuring personal contact with COVID-19, knowledge of COVID-19 (World Health Organization n.d), trust in government (using a battery validated by Devine et al., 2020), and self-perceived numeracy (using a version of the Subjective Numeracy Test validated by McNaughton et al., 2015). 6 We included self-perceived numeracy because this might condition how people engage with statistical data, and constructed our scale using mean responses in line with established practices. Meanwhile, we constructed scales for personal contact with and knowledge of COVID-19 using Item Response Theory (IRT) and the R package mirt (Chalmers, 2012) since these also potentially matter for government evaluations as we describe in the theory section (Jørgensen et al., 2021). 7
Meanwhile, participants in the UK-only condition saw an image depicting cumulative mortality data for the UK since 50 cumulative deaths were recorded in the country (upper panel of Figure 1).
8
We plotted this on a linear scale because we thought it would be more accessible to respondents than logarithmic scales, and experimental evidence suggests scaling choice does not impact our outcome of interest (Sevi et al., 2020). Finally, in the Comparative condition, respondents saw an identical image (lower panel of Figure 1) containing three key differences: (1) cumulative deaths plotted for nine additional European countries, (2) an additional subtitle saying, “Top ten European countries,” and (3) an additional footnote explaining that “country data is aligned by stage of the outbreak.” These differences drew attention to the comparative nature of the image, as well as the UK’s unique position as having the most COVID-19 mortalities relative to other European countries as of July 15, 2020. Treatment images used in the UK-only (top) and Comparative (bottom) experimental conditions.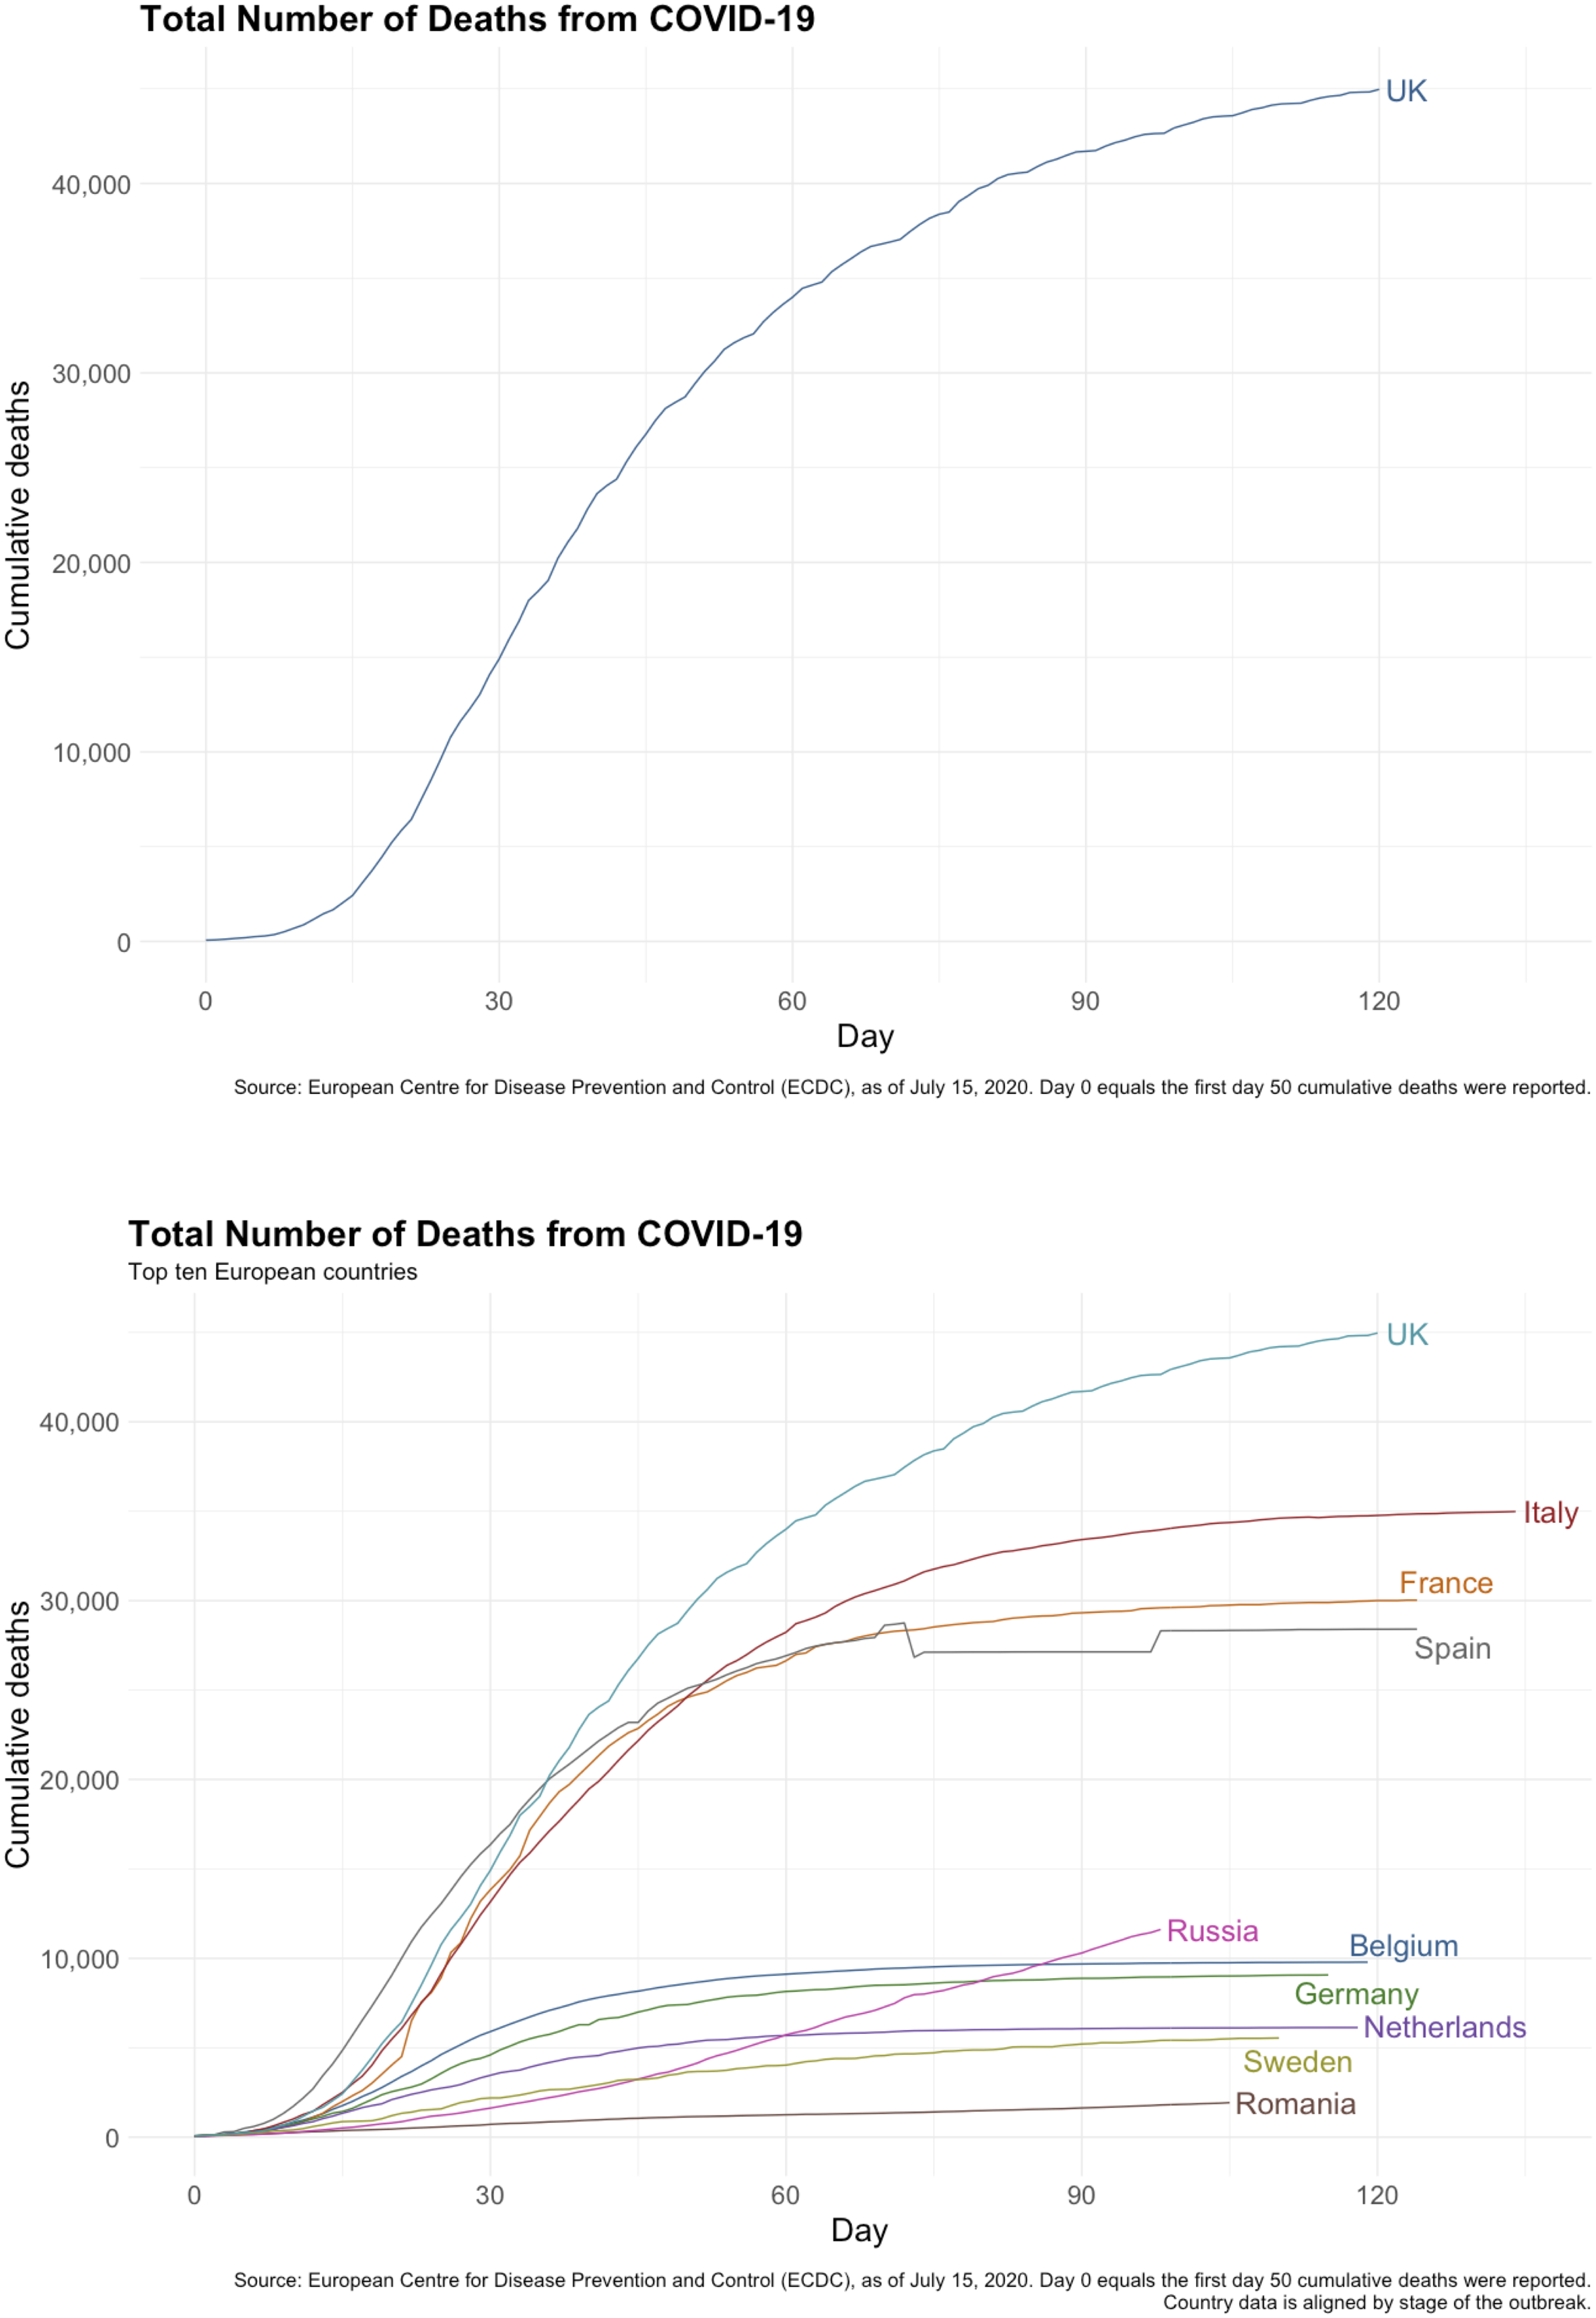
Sampling Procedures
We recruited 3018 participants between July 15–17, 2020 using Prolific.ac, which holds an established UK panel that displays advantages over other options such as MTurk in terms of respondent diversity, pre-screening, and data quality (Peer et al., 2017, 2022). Fieldwork concluded before the widespread public announcement of the successful Oxford/AstraZeneca vaccine trial on July 20, 2020 (Folegatti et al., 2020). This removes concerns about our results being influenced by favorable news about the positive results of the trial, which was prominently funded and promoted by the government. We aimed to achieve a sample that was representative of the UK population in terms of gender and non-White ethnic minority categories. Ethnicity was important because widely-publicized evidence shows Black, Asian, and other ethnic minority groups are more likely to die from COVID-19 than White British or White Irish patients in England (Aldridge et al., 2020). Comparing our sample to the June 2020 wave of the British Election Study (BES), commonly viewed as a gold-standard survey dataset for the UK electorate, we observe how our sample is somewhat younger, more educated, more likely to support the Labour Party, and more likely to have voted “Remain” in the 2016 EU referendum than reported in the BES sample (see Table 1 in the supporting information). Nevertheless, as reported in the supporting information and pre-registered plan, we have adjusted for these and other covariates, all of which were measured pre-treatment. We set up 12 calls for participants on Prolific, with each call corresponding to one cell in the cross-tabulated survey targets and opening at different times which were for all intents and purposes random. Participants responding to one call were not notified of the others, so participants could only enter through one of the links. Differences among our three groups along gender and ethnicity were minimal. 9
Following our pre-registration protocol, we dropped respondents who spent fewer than 5 seconds on either treatment image page (0 respondents), which we reasoned was a minimal amount of time to look at the graph. We also disqualified any respondents who managed to take the survey twice (3 respondents comprising 6 observations), and any who failed to register their age (3 respondents)—a disqualification we had not pre-registered, but one we deemed more reasonable than attempting to impute these participants’ ages. At the pre-registration stage, we decided to remove respondents who failed a manipulation check at the end of the survey: we asked individuals to indicate whether one or many countries were displayed in the image they had seen earlier, and dropped those answering differently from the treatment group to which they were assigned (i.e., anyone answering “many” in the UK-only group or “one” in the Comparative group, 92 respondents in total). However, acknowledging that dropping respondents who fail a post-treatment manipulation check can introduce bias (Montgomery et al., 2018), we also conducted the analysis using the full sample which deviated from our pre-registered plan. Our results remain the same under those conditions, except for two instances where non-significant estimates become significant (see footnotes 13 and 17). Our final sample comprised 2917 respondents: 1001 in the Control, 921 in the UK-only group, and 995 in the Comparative group.
Outcome Variable: Government Evaluation
We report treatment effects for the outcome of perception of government performance, which is a continuous IRT model scale analyzed by way of a linear model. 10 This outcome is measured by agreement with six statements on a 1–5 scale, 1 being “strongly disagree” and 5 being “strongly agree.” These items, taken from an Ipsos (2020) poll fielded earlier in the pandemic, include statements such as “The UK government has done a good job of protecting UK residents through its response to the coronavirus” and “The UK government’s plan has adapted well to the changing scientific information and situation.” Note that, since this scale had not been pre-validated through previous studies, we followed our pre-analysis plan and only used the subset of items that made for a valid IRT model (see Supporting Information).
Results
Main Effect: Do Mortality Statistics Change Government Evaluations?
Our first step involves asking whether the information treatments had effects on perceptions of how the government was handling the pandemic. Following our pre-registration plan, we fitted a linear model using lm in R’s stats package (R Core Team, 2018) to estimate the (main) effect of being in one of the treatment groups, compared to the control, while holding constant all covariates.
11
Figure 2 (top two lines) shows our main effect on government performance. Treatment effects plotted with 95% Wald confidence intervals using robust standard errors and Holm correction for multiple comparisons.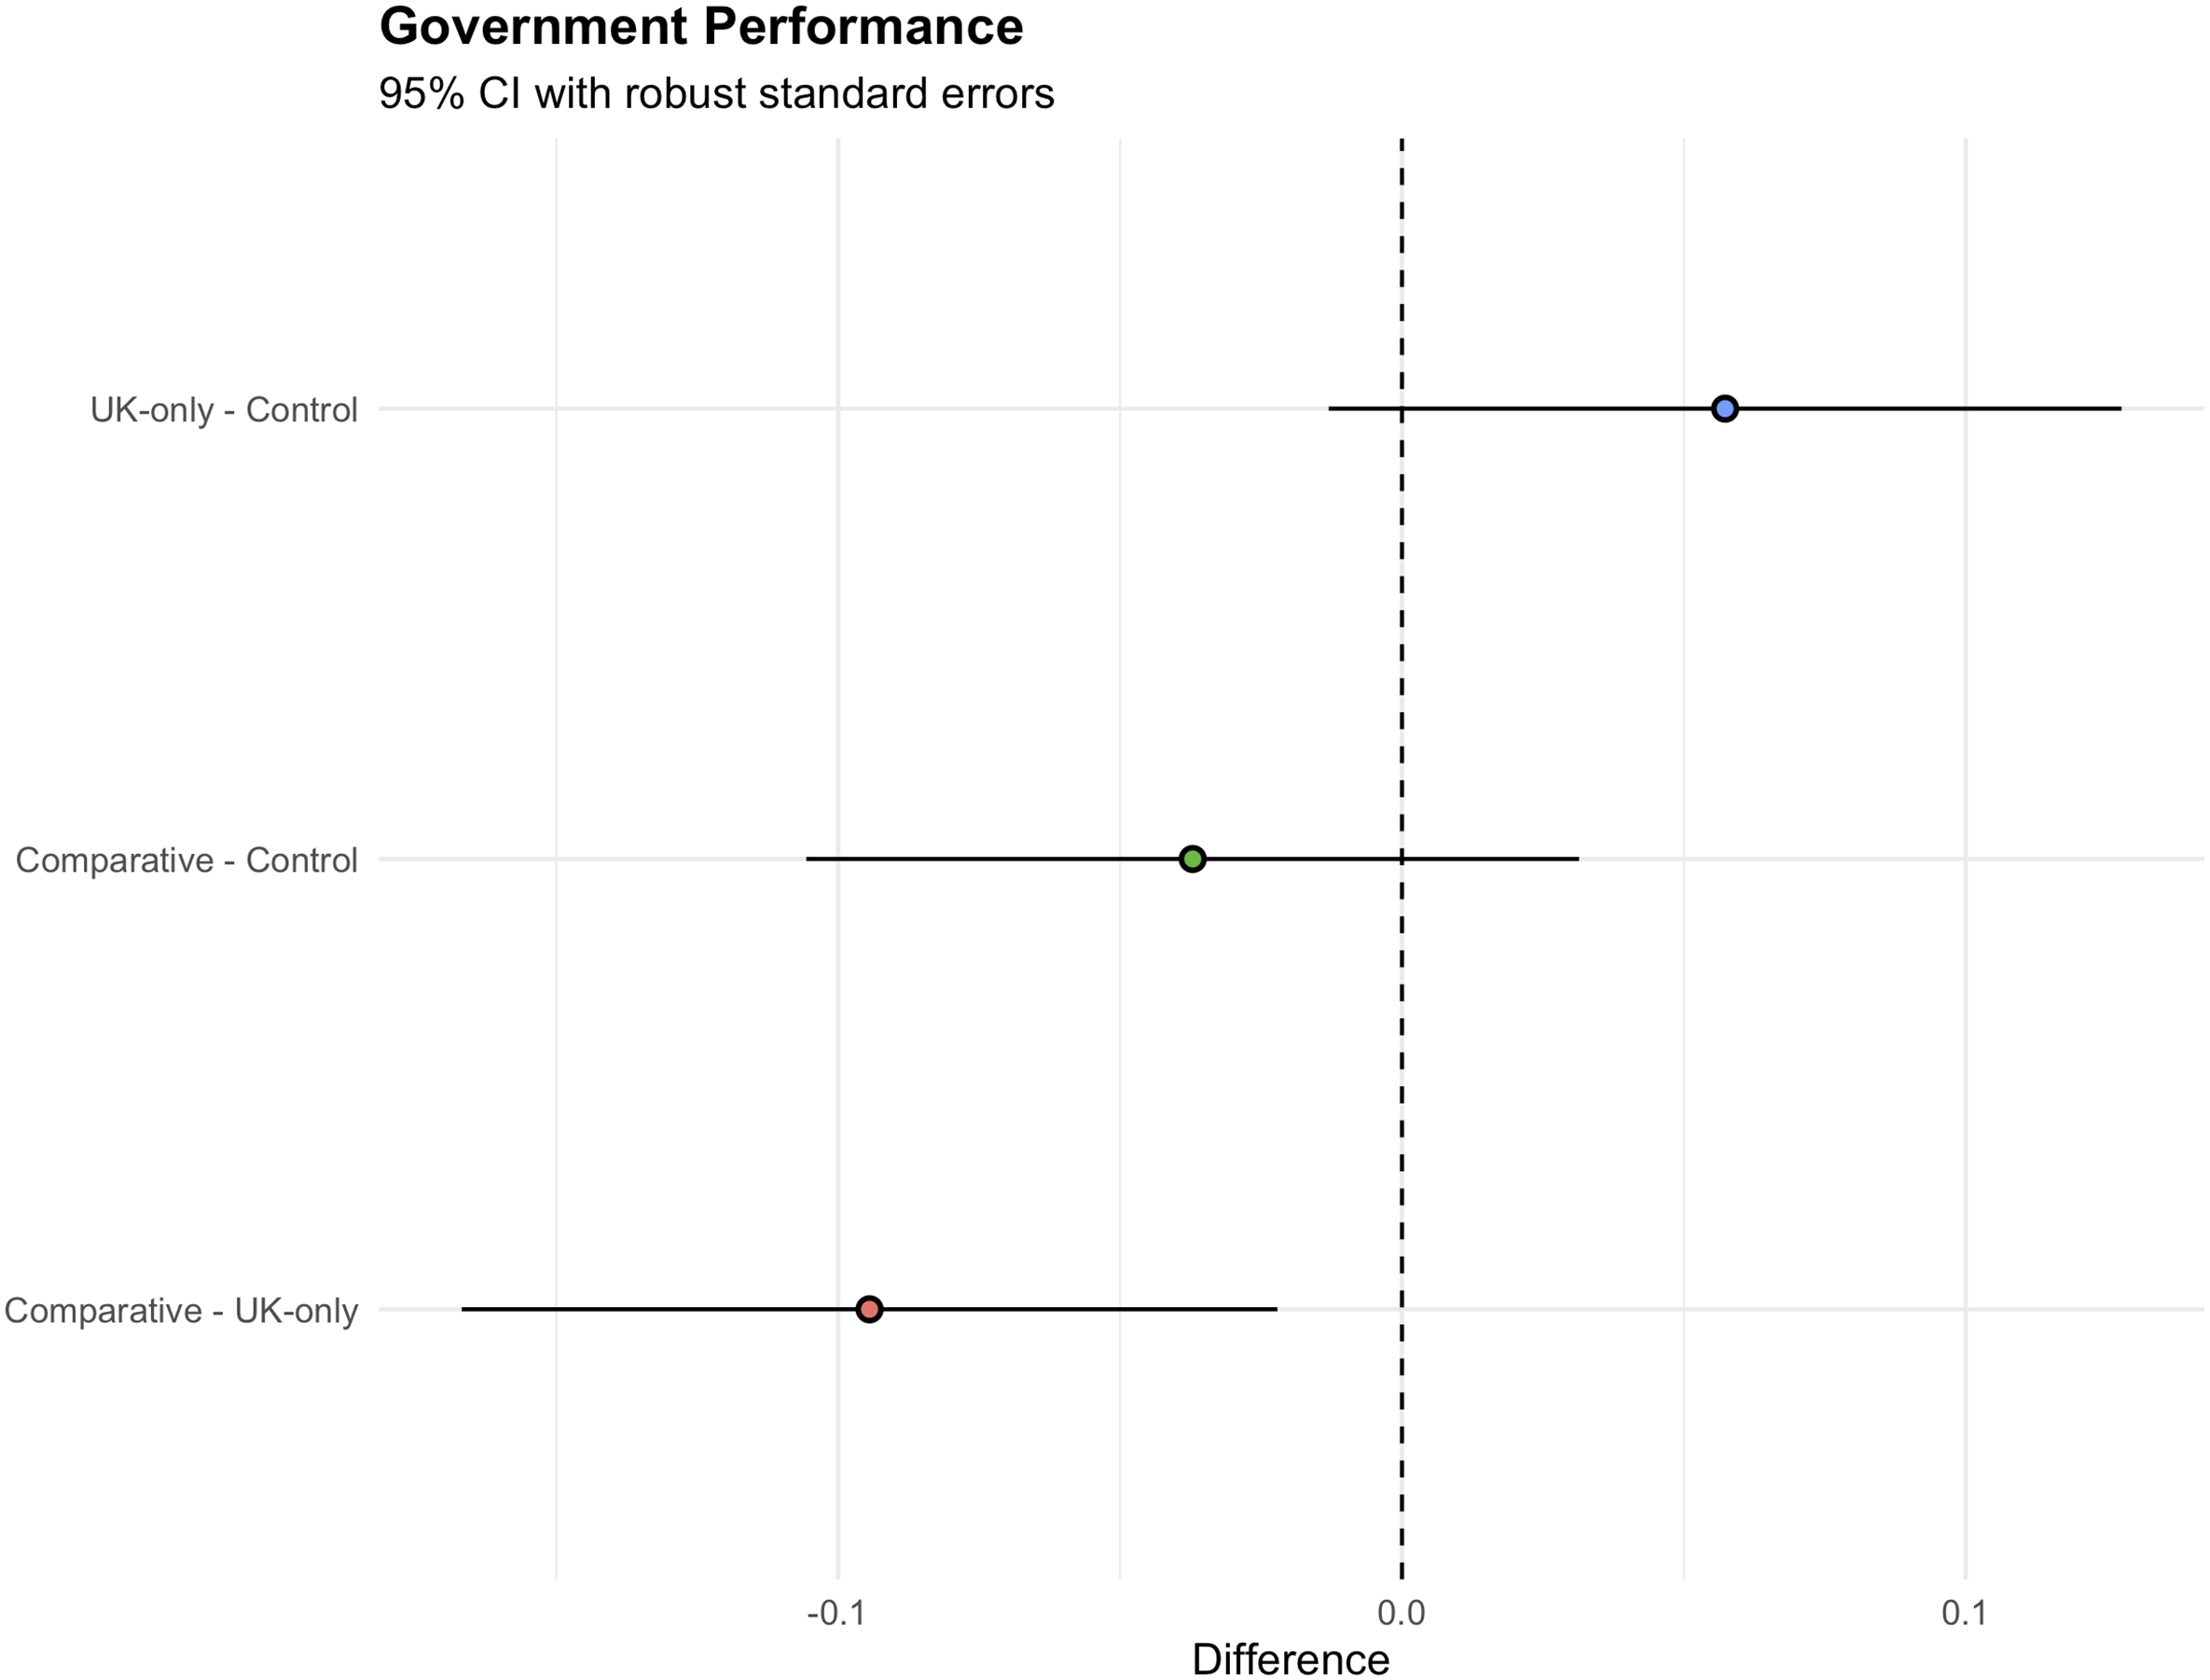
The information contained in the treatments impacted respondents’ evaluations of the government, but not entirely in the ways we had hypothesized. 12 Neither treatment group expressed more negative evaluations that reached our pre-registered significance level (p < .05) compared to the control group, which does not lend support for H1a (high mortalities). Rather, seeing the UK’s mortality data in isolation may have led respondents to evaluate the government more positively than those in the control condition, although this estimate also did not reach our pre-registered level of significance when restricted to those who did not fail the manipulation check (p = .057). 13 Our logic at the pre-registration stage was that the high cumulative numbers of COVID-19 deaths in the UK (i.e., gross levels) would be the most salient feature of the UK-only graph, and therefore cause more negative evaluations of the government in charge. However, it appears that the rate of growth might have been more salient for respondents in the UK-only condition, who as a result perhaps rewarded the government for its apparent success at “flattening the curve.” Reflecting on this, we acknowledge how public health officials and media had widely promoted this objective in the early part of the pandemic (Roberts, 2020).
Comparing the two information conditions provides more direct evidence that benchmarking is occurring, and that the rate of growth was probably the more salient feature in the UK-only image (bottom line in Figure 2). The difference between the UK-only and Comparative treatment conditions is statistically significant and follows the direction hypothesized in H1b (benchmarking): respondents seeing the UK’s cumulative mortalities set against other European countries—all of which were lower for most of the period covered—expressed more negative evaluations of the UK government than those seeing the UK figures in isolation by 0.09 standard deviations (SE (robust) = 0.031, p = .007). 14
We argue this is evidence of benchmarking because the only meaningful difference between these treatments was the presence of lines indicating other countries’ mortality data that were all lower than the UK in terms of their levels but practically identical in terms of their slopes (rates of change). In this instance, comparative data appears to cause respondents to punish the government, although to a modest degree which seems sensible given expectations about the ability of a single graphic to substantially change attitudes in an information-rich environment. 15 Given that most of the other countries also had flattened their own mortality curves, this marker of success—rewarded in the absence of comparisons by the first treatment group—no longer seems distinctive and positive. Instead, information signaling peers’ performance serves as a reference point for critical evaluations.
While we have argued that our visual treatment design and the pandemic context of the study provide a uniquely relevant test for the media-based channel of benchmarking, knowledge of and experience with COVID-19 during the first wave of 2020 prior to our experiment may still have been relevant for respondents’ evaluations of the government (see footnote 1). To check for this possibility, we ran additional models in an exploratory (i.e. not pre-registered) manner which interacted each treatment with respondents’ IRT scores on the pre-treatment COVID-19 contact and knowledge batteries (Tables 7 and 8 respectively in the Supporting Information). In both instances, we do not find significant interaction effects: respondents who had more personal contact with the pandemic, or knew more about COVID-19, did not express different evaluations compared to those with less contact or knowledge respectively after seeing either treatment.
The Roles of Political Trust and Partisanship in Evaluating Government Performance
As suggested by prior theories of blame attribution, our main information treatment effects on government evaluation may interact with different levels of trust in government and partisanship. In terms of partisanship, we hypothesized at the pre-registration stage that there would be a significant difference in effect on perceptions of government performance among partisan subgroups, with the effect among supporters of the incumbent Conservative party being towards more positive evaluations compared to the effect among supporters of opposition parties or no party. Figure 3 shows how none of the differences were significant.
16
Therefore, we reject H2a (partisanship). This null finding corroborates experimental evidence of attitudes held by heterogeneous groups moving in the same direction on account of exogenously-varied information treatments (Becher et al., 2023; Coppock, 2022). Difference in treatment effect on government performance by partisanship and treatment (UK-Only and Comparative) compared with Conservatives, with 95% Wald confidence intervals using robust standard errors.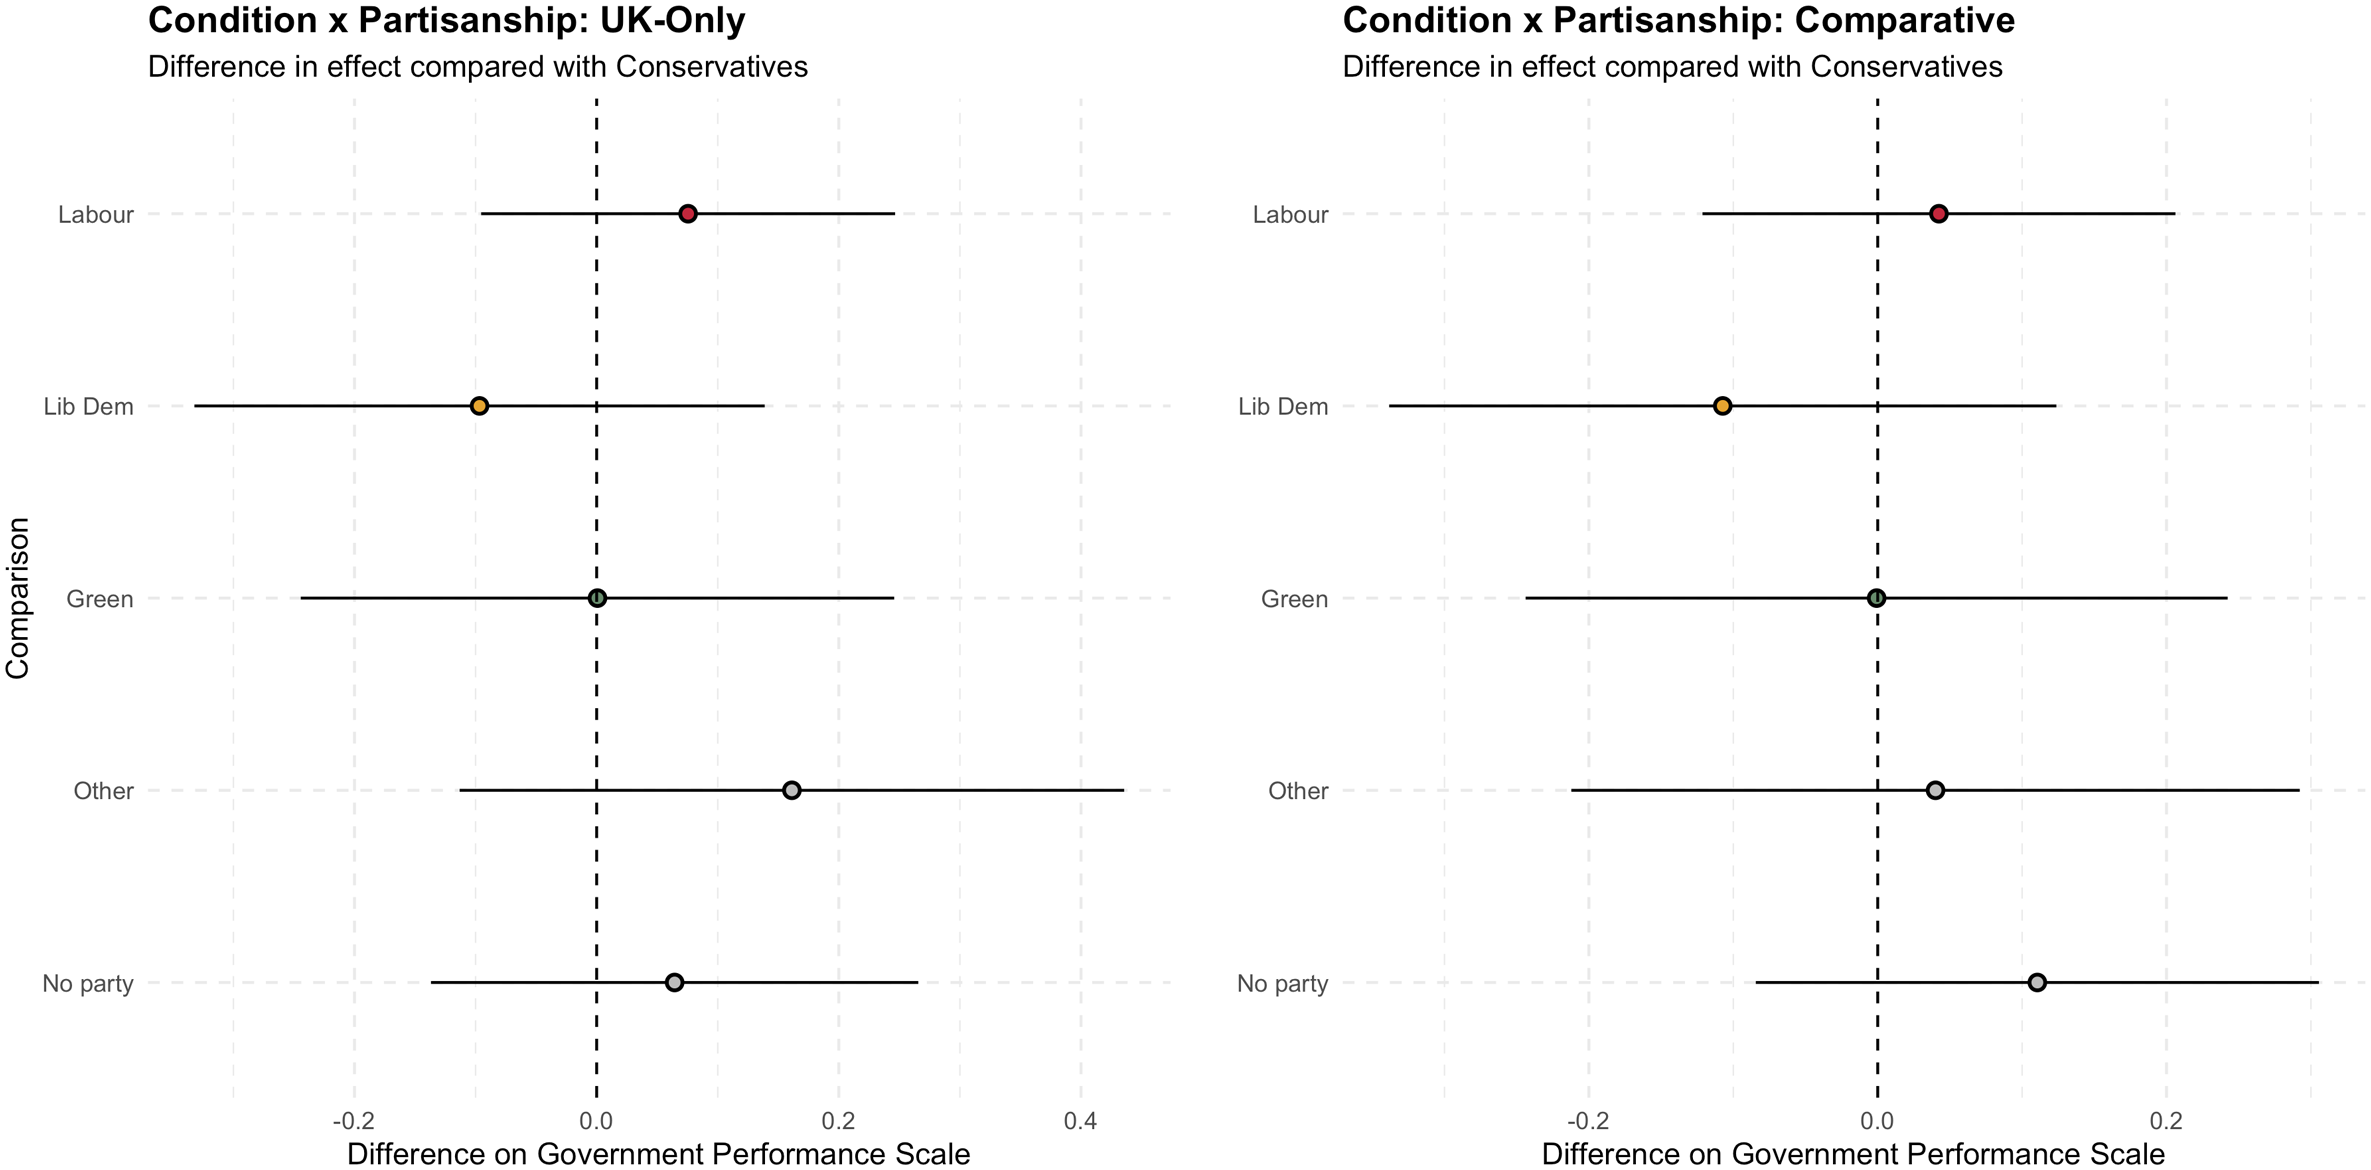
Next, contrary to what we had hypothesized in an exploratory manner, the moderating effect among high-trust participants—i.e., those who were one standard deviation above the mean on the political trust scale—in both treatment conditions was towards less favorable views of government performance, compared to those at the mean level of trust. Consequently, we reject H2b (political trust). Specifically, while perceptions of government performance on behalf of participants exhibiting mean levels of trust in the two conditions were not significantly different from the control (B = 0.056, SE (robust) = 0.030, p-value = .063 for UK-only; B = −0.037, SE (robust) = 0.029, p-value = .209 for Comparative),
17
there was a significant difference in effect introduced by the interaction term (B = −0.108, SE (robust) = 0.031, p-value = .001 for UK-only; and B = −0.078, SE (robust) = 0.031, p-value = .013 for Comparative) when comparing those at the mean level of trust to those one standard deviation above that mean.
18
This interaction can also be seen from the distinct slopes in Figure 4. The effect of each condition (UK-Only and Comparative) on perceptions of government performance compared to Control at different levels of trust (0 corresponds to the estimated mean level of trust in the population). 95% confidence intervals calculated with robust standard errors.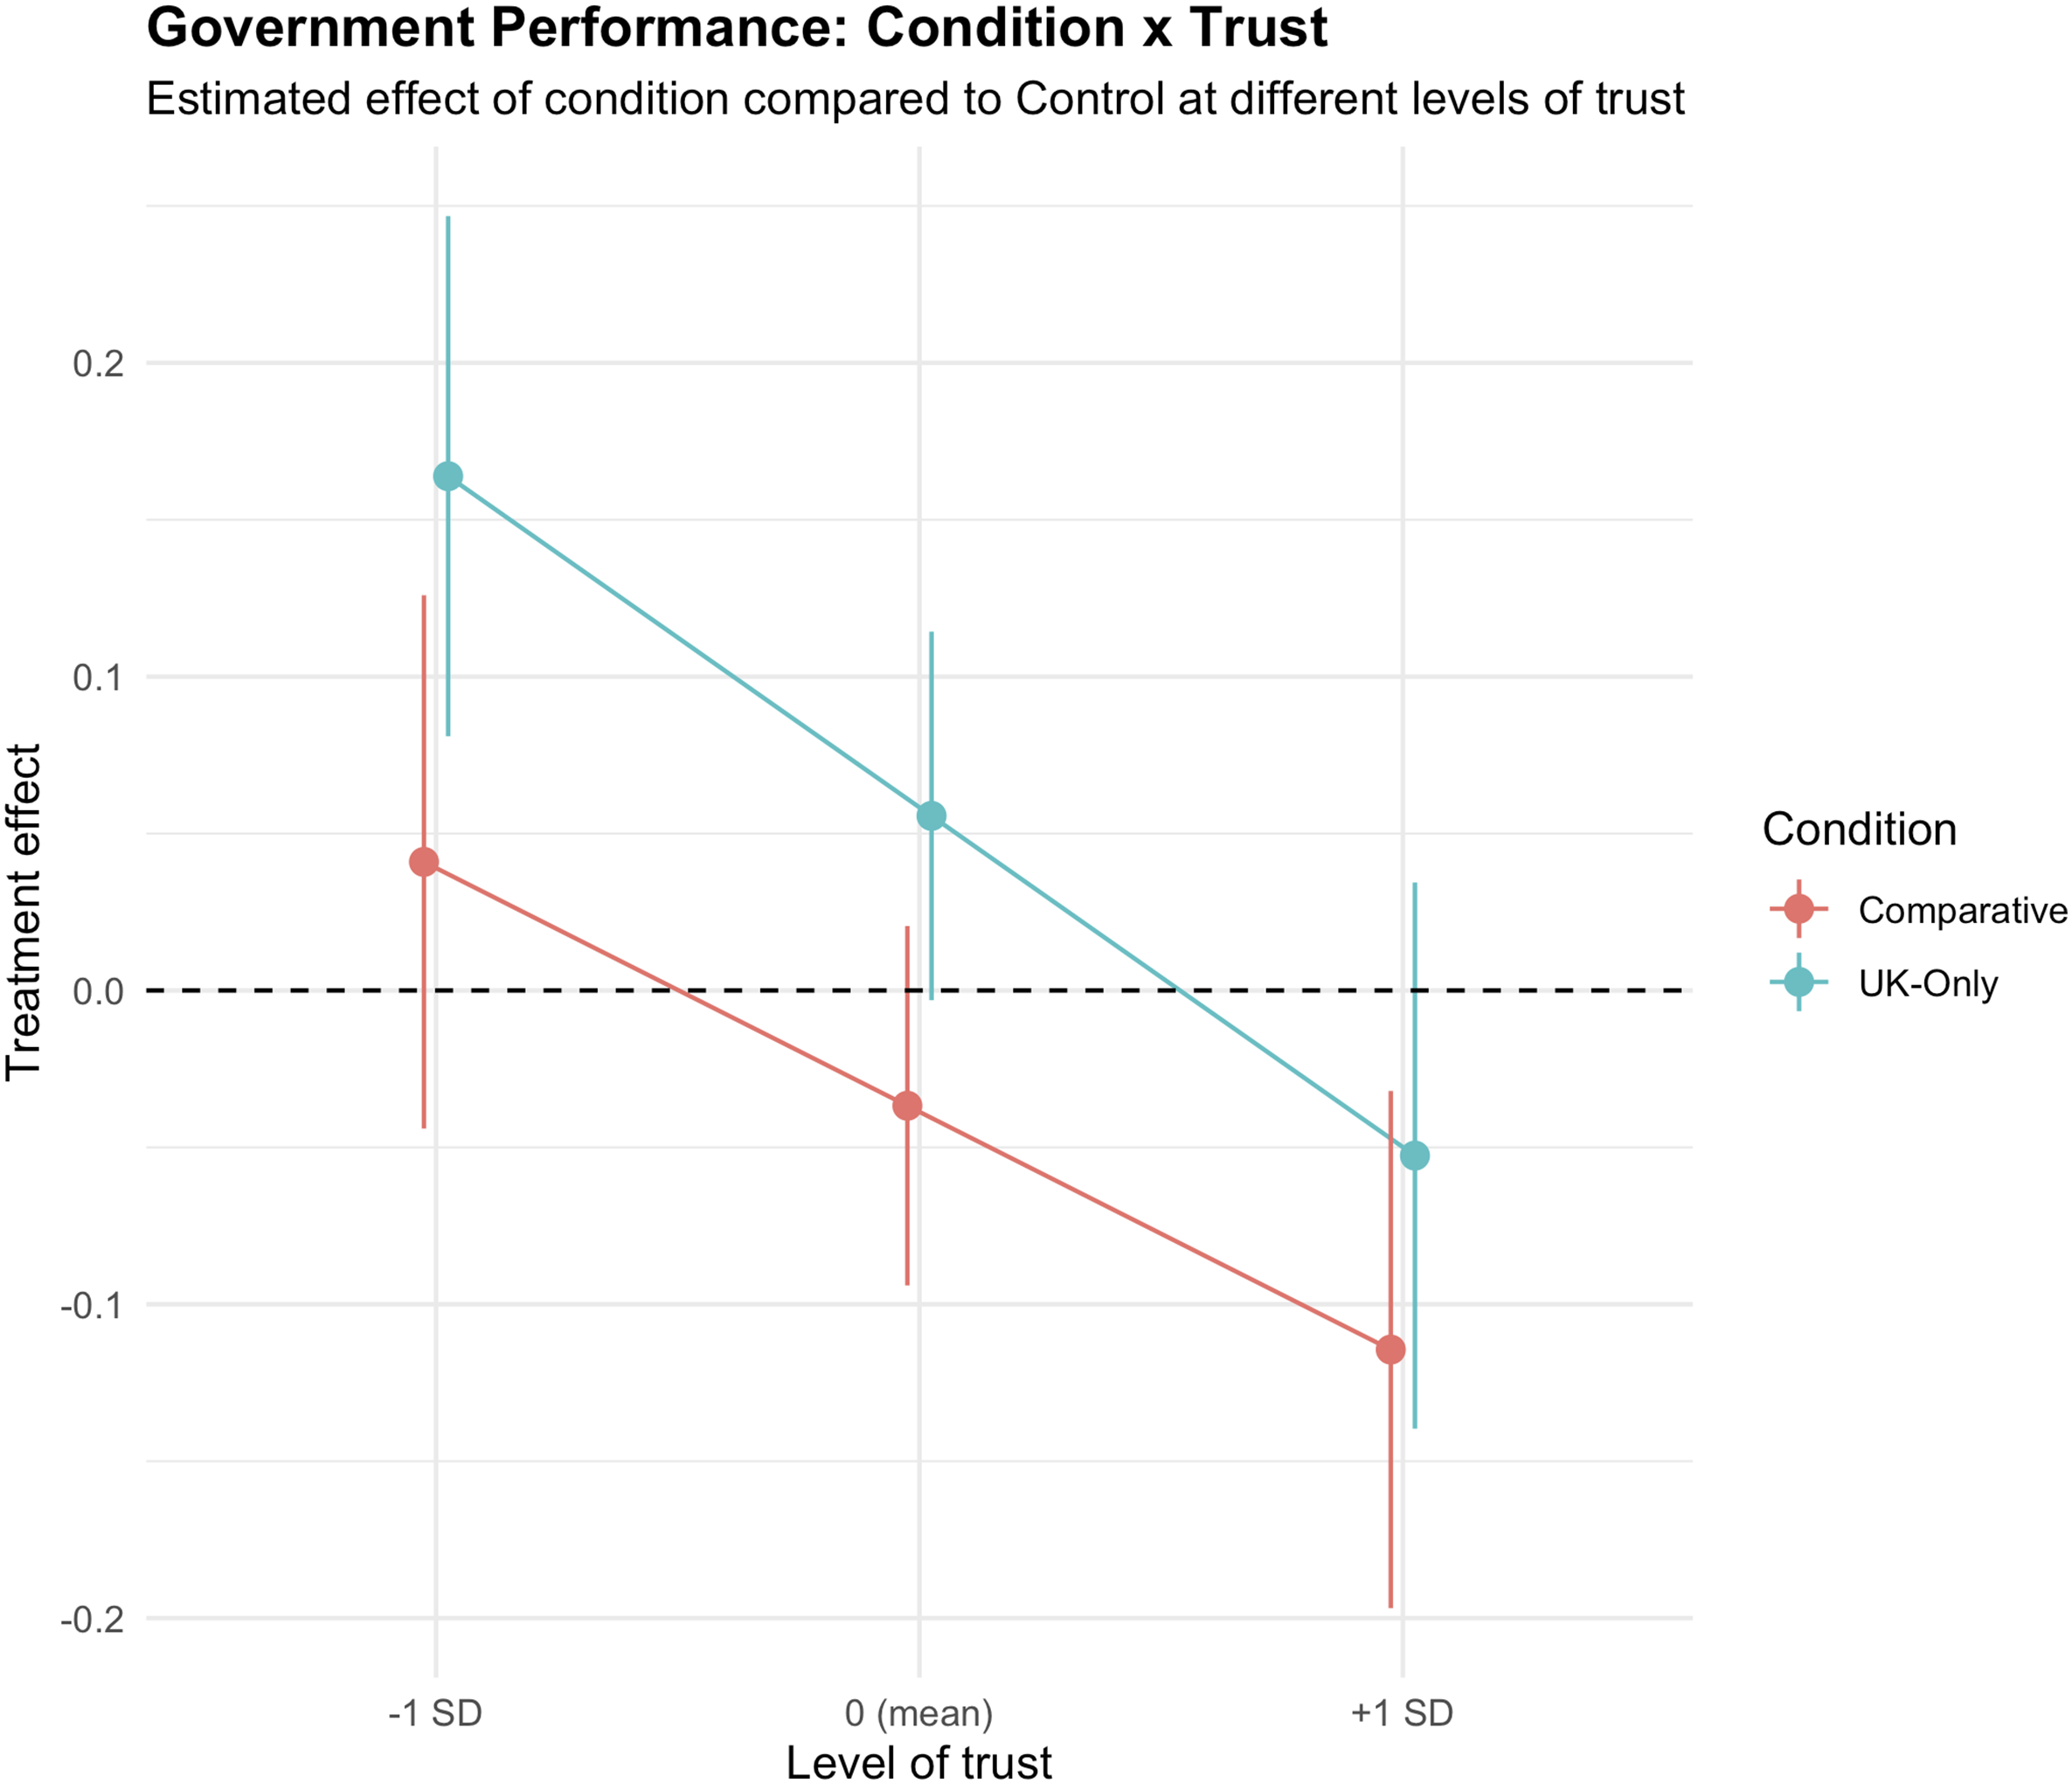
This is noteworthy because it questions the assumption that high levels of trust serve as a buffer of goodwill that protects people’s sense that government is performing at the level that it ought. Had that been the case, we should have seen a positive coefficient value for the trust interaction, making for a steeper slope for the treatment slopes than the control slope. Instead, the perceptions of respondents exhibiting high levels of trust seem not so much protected by the presence of trust as making it vulnerable to disappointment. Returning to prior research into the causes of political trust lends some support to this: if citizens’ trust in government institutions is informed by perceptions of good performance on the part of those same institutions (Mishler & Rose, 2001), then information drawing attention to those perceptions being violated is likely to have negative consequences. By contrast, low trust individuals perhaps do not assume that government will perform well to begin with, are less vulnerable to disappointment as a result, and—as in the UK-only condition—therefore might have been unexpectedly surprised that the government was successfully flattening the curve.
Discussion
At the outset of the paper, we highlighted the example of an opposition politician in the UK pointing out apparent selectivity on the part of the incumbent government when it came to reporting COVID-19 mortalities. The implication was clear: comparison is politically useful if it shows the government in a positive light compared to its neighbors. Indeed, several countries’ governments invoked their comparative performance on several COVID-19 metrics over time, notably New Zealand under Prime Minister Jacinda Ardern who received widespread public praise for her initial handling of the crisis (Gilray, 2021). This is consistent with existing theories of benchmarking as applied in the domain of economics, which suggest that voters are sensitive to comparative economic information because it provides a reference point that contextualizes how their own governments are performing, particularly during downturns (Besley & Case, 1995; Kayser & Peress, 2012). However, there are important theoretical and empirical challenges to this argument, notably the consequences of complex modeling choices (Arel-Bundock et al., 2021). Moreover, we know relatively little about the micro-foundational role of media in pre-benchmarking comparative information, since distinguishing this from prior knowledge or experience is difficult using cross-sectional data about economic issues.
We have addressed these problems by way of a pre-registered experiment using the novel context of visually communicating public health statistics during COVID-19, a different kind of crisis compared to those previously studied by political scientists interested in benchmarking. Specifically, using the case of the UK—a country that has had exceptionally high numbers of COVID-19 deaths among European countries—we expected that visualizing these alarming statistics at the time of our experiment in a simple way would cause respondents to express more negative evaluations of the government’s handling of the crisis. This expectation was partly borne out by our results. First, when respondents lacked international data that could have served as benchmarks, respondents seemingly focused on the rate of growth rather than gross levels. As a result, when compared to participants in the Comparative condition, respondents rewarded the incumbent administration for apparently flattening the country’s mortality curve. However, when other European countries’ own flattening trajectories were visible in the comparative condition, the UK’s status as “worst of the bunch” in terms of cumulative mortalities likely became more salient. Consequently, and in line with expectations of benchmarking, respondents punished the incumbent government in the form of modestly lower performance ratings compared to those seeing UK-only data, on the order of about 0.1 of a standard deviation on our IRT scale measuring government approval. This modest effect size—which matches what Becher et al. (2023) find in their pooled experimental results across France, Germany and the UK—seems reasonable given expectations about the power of a single graphic in an information-rich environment to change citizens’ attitudes. Therefore, as to whether it was advisable for the UK government to drop comparisons of its national mortality figures with other European countries from its daily press briefings, this would seem to have been a well-calculated move from a political point of view.
More fundamentally, our study makes two theoretical contributions: on the one hand, to understanding the scope conditions of when (and which) voters attribute blame to their governments during crises; and on the other hand, to understanding about benchmarking as a specific means by which voters respond to information as they evaluate their governments’ performances. First, focusing on blame attribution, we find that levels of trust in government likely moderates who engages with information and with what effects. We found a significant interaction between our treatments and levels of trust on perceptions of government performance, with the effect among high-trust participants in both treatment conditions being towards less favorable views of government performance, compared to the effect at mean levels of trust. This suggests that public trust is not necessarily a reservoir of goodwill that governments can tap into in tough times. Rather, any trust gained by perceptions of unexpectedly good performance might just be raising the bar and in so doing create expectations that can easily be frustrated when government no longer performs at the level that they have led people to expect.
Notably, our results with respect to trust differ from other experimental work conducted slightly earlier in Ireland, which found that respondents already holding low levels of trust in government were more likely to ascribe even less trust in government after seeing detailed information about COVID-19—including how Ireland’s cases compared to other countries (Crepaz & Arikan, 2021). One possible explanation lies in the complexity of information displayed in each study: while Crepaz and Arikan (2021) find that pre-treatment levels of trust significantly interact with the effects of their “high information” treatment which provided nearly a dozen data series in a dashboard format, they do not find a similar interaction effect for their “low information” treatment which only showed Irish data about tests, cases, patients in intensive care, and mortalities. If concerns about greater information disclosure actually leading to less public trust are warranted (Worthy, 2010), then it is possible that exposing respondents to large amounts of data—particularly about anxiety-inducing and previously unfamiliar topics such as hospitalization rates—might trigger suspicion and have further consequences for behaviors. This is partially seen in the context of COVID-19: survey experimental evidence among US and Danish citizens showed how transparent yet negative communication about the pandemic lowered respondents’ acceptance of vaccines, but actually increased their levels of trust in health authorities (Petersen et al., 2021).
Another possible explanation lies in the extent to which respondents associated the treatments with either the political or administrative arms of the state. Crepaz and Arikan (2021) intentionally based their treatment dashboards on an existing website managed by the Irish Department of Health. By contrast, our treatment only referenced the non-partisan European Centre for Disease Prevention and Control as the source of the data, and did not use any established branding or formatting that could be connected to the UK government’s COVID-19 messaging (see Figure 1). Public opinion scholarship demonstrates how audiences turn to messengers they perceive to be credible for guidance on which forms of information they should believe (e.g., Druckman, 2001). Therefore, showing low-trust respondents a message imitating a website backed by a government they already do not believe to be credible might indeed lead to more negative evaluations, whereas a message lacking clear branding—or indicating a non-partisan messenger—could have no or even opposite effects. As such, we think these sets of findings may be consonant with each other, while also warranting further investigation to account for treatment complexity and perceived messenger partisanship.
Second, our findings also add to theorization about benchmarking as a means of explaining how voters hold their governments to account using external information on a host of politically relevant issues, while also lending urgency for taking international comparison seriously as a rhetorical and political tool (Broome et al., 2018) —one that is increasingly applied to matters extending beyond economic performance as other empirical studies have shown (De Vries, 2018; Martini & Walter, 2023). Actors in media and policymaking can readily access comparative datasets relating to other areas of governance such as international development (Bandola-Gill et al., 2022) and security (Baele et al., 2017). This raises the stakes for understanding whether accessing these resources matter for how citizens evaluate their governments’ performances—and ultimately processes of selecting and sanctioning politicians by way of voting behaviors which flow from these evaluations. On this front, more evidence on which benchmarks citizens pay attention towards—and whether these choices are related to prior beliefs—is needed (Becher et al., 2023).
We have also demonstrated the importance of comparative and visual representations of data as specific types of information to which voters can respond. While much work on information effects using observational data has shown how becoming more informed about political and economic issues is associated with shifts in attitudes and voting behaviors (Ahlstrom-Vij, 2021; Carlin et al., 2021), these findings are largely based on implicitly national and text-based forms of information. By contrast, our study highlights how citizens’ information environments are increasingly international while also involving new media that aim to make complex information more understandable in a form of pre-benchmarking (Bekkers & Moody, 2014; Engebretsen and Kennedy 2020). Future work should consider how and to what extent these kinds of visual media impact political perceptions, attitudes, and preferences.
At their broadest level, our results show how factual information matters for government evaluations despite several unique features of the COVID-19 pandemic compared to previous economic and humanitarian crises studied by political scientists such as 9/11 and Hurricane Katrina: a global and acutely-felt event that generated extraordinary restrictions on mobility and daily life; an unprecedented salience of statistical information conveyed by mass media and political rhetoric; and an explicitly comparative dimension to that information which was used to support conclusions about countries’ relative performances. As such, future work will need to trace how and in what ways the political behavioral impacts of this crisis differ from established theories about blame attribution.
Supplemental Material
Supplemental Material - Worst of the Bunch: Visual Comparative Benchmarks Change Evaluations of Government Performance
Supplemental Material for Worst of the Bunch: Visual Comparative Benchmarks Change Evaluations of Government Performance by William L. Allen and Kristoffer Ahlstrom-Vij in Comparative Political Studies
Footnotes
Acknowledgments
Previous versions of this paper were presented at the 2020 virtual conference “Political Trust in Crises” (University of Southampton, October 22–23), the 2021 virtual European Political Science Association Annual Meeting (June 24–25), and the 2023 International Communication Association Annual Conference (Toronto, May 25–29). We would like to thank the discussants and participants at these events for their valuable feedback.
Declaration of Conflicting Interests
The authors declared no potential conflicts of interest with respect to the research, authorship, and/or publication of this article.
Funding
The authors disclosed receipt of the following financial support for the research, authorship, and/or publication of this article: Funding for the survey experiment was provided by Birkbeck, University of London and Magdalen College, University of Oxford. William Allen acknowledges support from the British Academy (grant number PF21\210066).
Data Availability Statement
Data and replication materials are available in the Harvard Dataverse at https://doi.org/10.7910/DVN/VMZIPF (Allen and Ahlstrom-Vij, 2024).
Supplemental Material
Supplemental material for this article is available online.
Notes
Author Biographies
References
Supplementary Material
Please find the following supplemental material available below.
For Open Access articles published under a Creative Commons License, all supplemental material carries the same license as the article it is associated with.
For non-Open Access articles published, all supplemental material carries a non-exclusive license, and permission requests for re-use of supplemental material or any part of supplemental material shall be sent directly to the copyright owner as specified in the copyright notice associated with the article.