
Abstract
Rising Δ9-tetrahydrocannabinol concentrations in modern cannabis invites investigation of the teratological implications of prenatal cannabis exposure. Data from Colorado Responds to Children with Special Needs (CRCSN), National Survey of Drug Use and Health, and Drug Enforcement Agency was analyzed. Seven, 40, and 2 defects were rising, flat, and falling, respectively, and 10/12 summary indices rose. Atrial septal defect, spina bifida, microcephalus, Down’s syndrome, ventricular septal defect, and patent ductus arteriosus rose, and along with central nervous system, cardiovascular, genitourinary, respiratory, chromosomal, and musculoskeletal defects rose 5 to 37 times faster than the birth rate (3.3%) to generate an excess of 11 753 (22%) major anomalies. Cannabis was the only drug whose use grew from 2000 to 2014 while pain relievers, cocaine, alcohol, and tobacco did not. The correlation of cannabis use with major defects in 2014 (2019 dataset) was R = .77, P = .0011. Multiple cannabinoids were linked with summary measures of congenital anomalies and were robust to multivariate adjustment.
Keywords
Introduction
While the teratogenic activities of cannabis have been investigated since the 1960s,1,2 substantially higher levels of Δ9-tetrahydrocannabinol of currently used cannabis 3 suggests that the neonatal epidemiology of former years requires reexamination.4,5
Urgency for epidemiological reassessment achieves particular currency in view of recent US data indicating that 24% of pregnant Californian teenagers test positive for cannabinoids, 6 that 69% of pregnant Coloradan mothers have cannabis recommended to them by cannabis dispensaries, 7 and that 161 000 pregnant women across the United States admitted to cannabis use during their pregnancy. 8
In such a context, experience from flagship states such as Colorado, which has been a pioneer in US cannabis use and also supports a detailed and public database of congenital defects, is invaluable to ascertain current trends and likely future directions. Cannabis was permitted for medicinal use from November 2000 and was decreed legal in November 2011 with full effect from 2014.
Colorado also has one other considerable advantage that greatly simplifies the statistical analysis of its data, as during the period 2000 to 2014, nationally representative datasets indicate that the use of other drugs was static or falling. In this sense, therefore, the Coloradan context is ideal from a statistical and public health perspective to ascertain current teratological trends while statistically isolating the effect of rising cannabinoid exposure to facilitate the study of prenatal cannabis exposure (PCE).
This study explores the presence of any overall trends in the pattern of Coloradan congenital anomalies data and investigates the extent to which ecologically documented drug use trends explained some of this variance.
Methods
Data
Data on birth defects in Colorado were taken from the Colorado Responds to Children with Special Needs (CRCSN) online database as single data points in January 2019. 9 Total 2013 defect data were taken from the April 2018 CRCSN dataset. Data on drug use were taken from the National Survey of Drug Use and Health (NSDUH) conducted annually by the Substance Abuse and Mental Health Administration (SAMHSA). 8 Data on cannabinoid concentration were taken from the National Drug Enforcement Agency seizures10,11 and multiplied by annual cannabis use to derive state-wide cannabinoid exposure.
Relationship to Cannabis
Defects were classified as cannabis-related if strong published evidence had previously identified a relationship to cannabis exposure. Papers from Centers for Disease Control and Prevention (CDC) and National Birth Defects Prevention Network (NBDPN) have established that anencephaly,12,13 diaphragmatic hernia, esophageal atresia with or without tracheoesophageal fistula, and gastroschisis are cannabis-related. 12 A joint statement by the American Academy of Pediatrics and the American Heart Association linked Ebstein’s anomaly and ventricular septal defect (VSD) with cannabis use. 14 A large 2007 epidemiological study from Hawaii also linked encephalocele, hypoplastic left heart, syndactyly, reduction deformity of the upper limbs, hydrocephaly, cleft lip and cleft palate both separately and together, anotia/microtia, tetralogy of Fallot, pyloric stenosis, microcephaly, pulmonary valve atresia and/or stenosis, large bowel or rectal atresias or stenosis, obstructive genitourinary defect, polydactyly, atrial septal defect (ASD), and trisomy 21 with PCE. 15 Although this study is an outlier in terms of the literature, this list of defects was accepted as being cannabis-related in view of its high predictive value and pointed real-world applicability particularly in the United States (see Results and Discussion sections).
Statistics
Data were processed in “R” v3.5.2 and “R Studio” v1.1.463 from the Central “R” Archive Network. Model reduction was conducted by the classical method with progressive removal of the least significant term. Models were compared by analysis of variance (ANOVA). Model parameters were compared with the “purrr” and “broom” packages. Regression line slope change was assessed with the “segmented” package. Differing quantitative scales were adjusted using the “scales” package. The “nlme” package was used for mixed-effects regression. Principal components analysis was conducted using the “psych” package. P < .05 was considered significant.
Ethics
The study was approved by the Human Research Ethics Committees of South City Medical Centre and the University of Western Australia.
Results
The January 2019 CRCSN dataset consists of annual numbers and rates on 49 defects for each of the years 2000 through 2014 and comprises 746 data points together with 180 data points relating to 13 summary indices by major organ system. These defects are graphed by time in Figures 1 and 2.
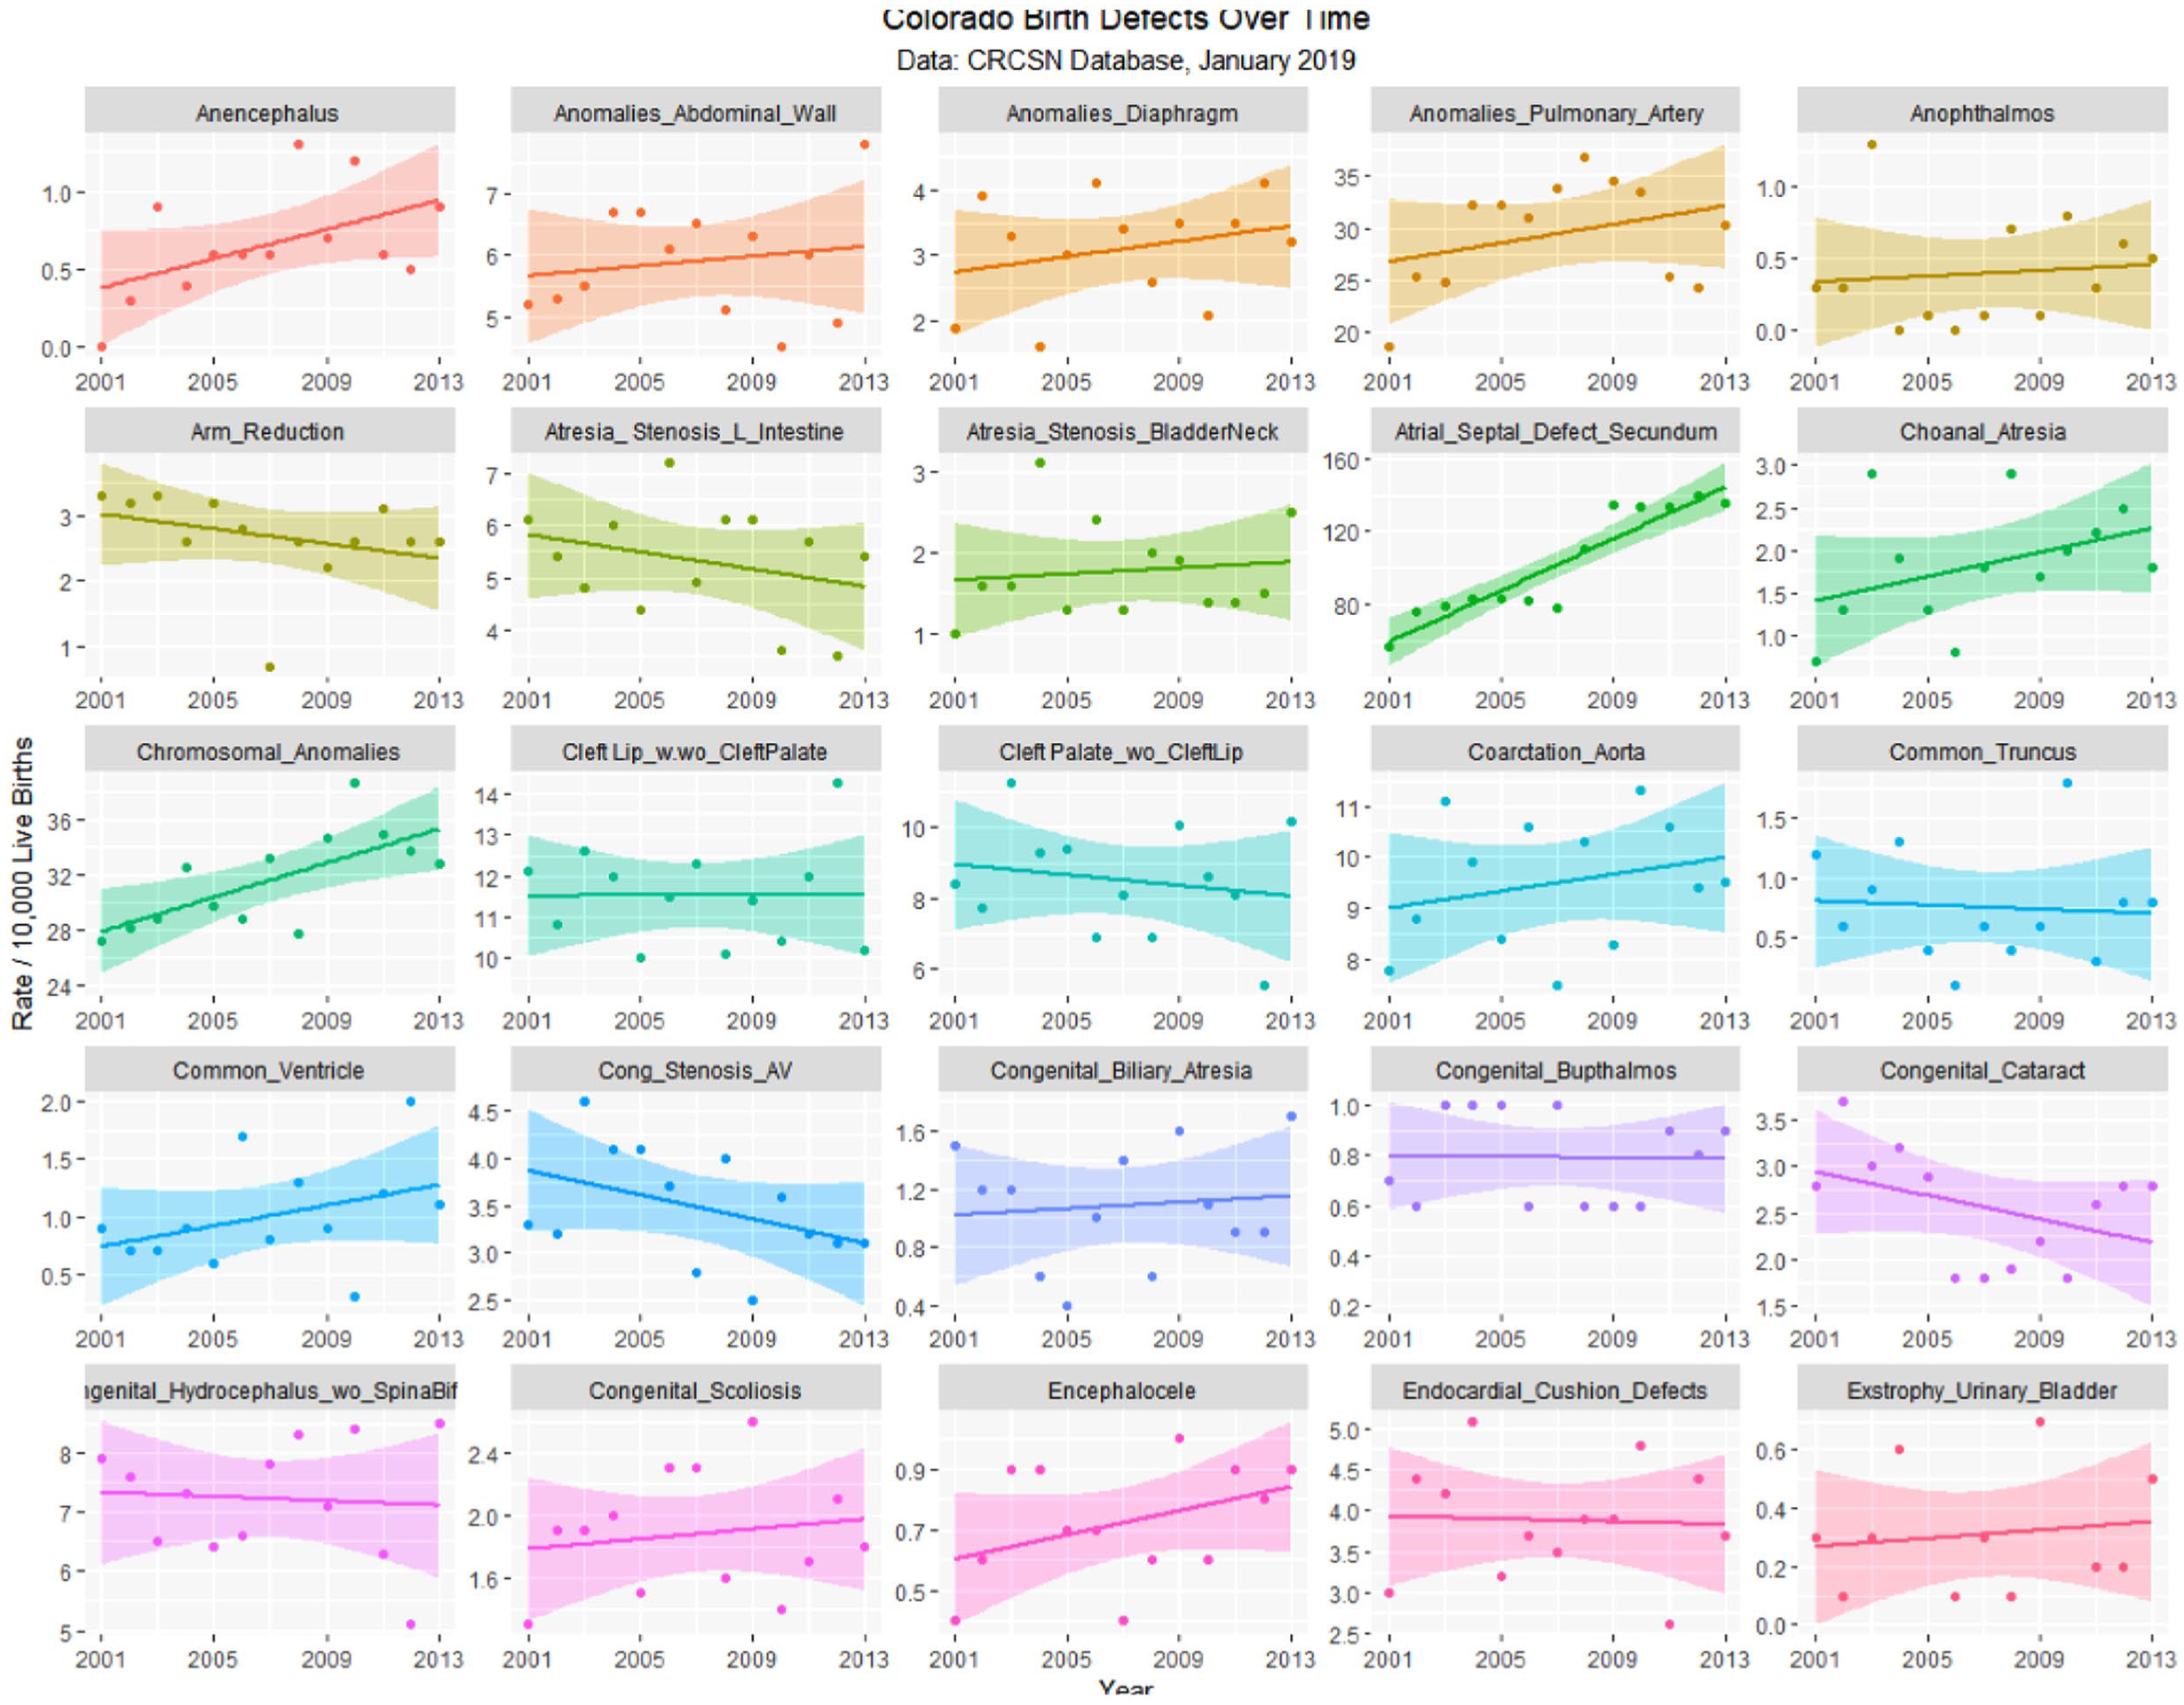
Colorado congenital defects A-E by time, regression lines fitted.
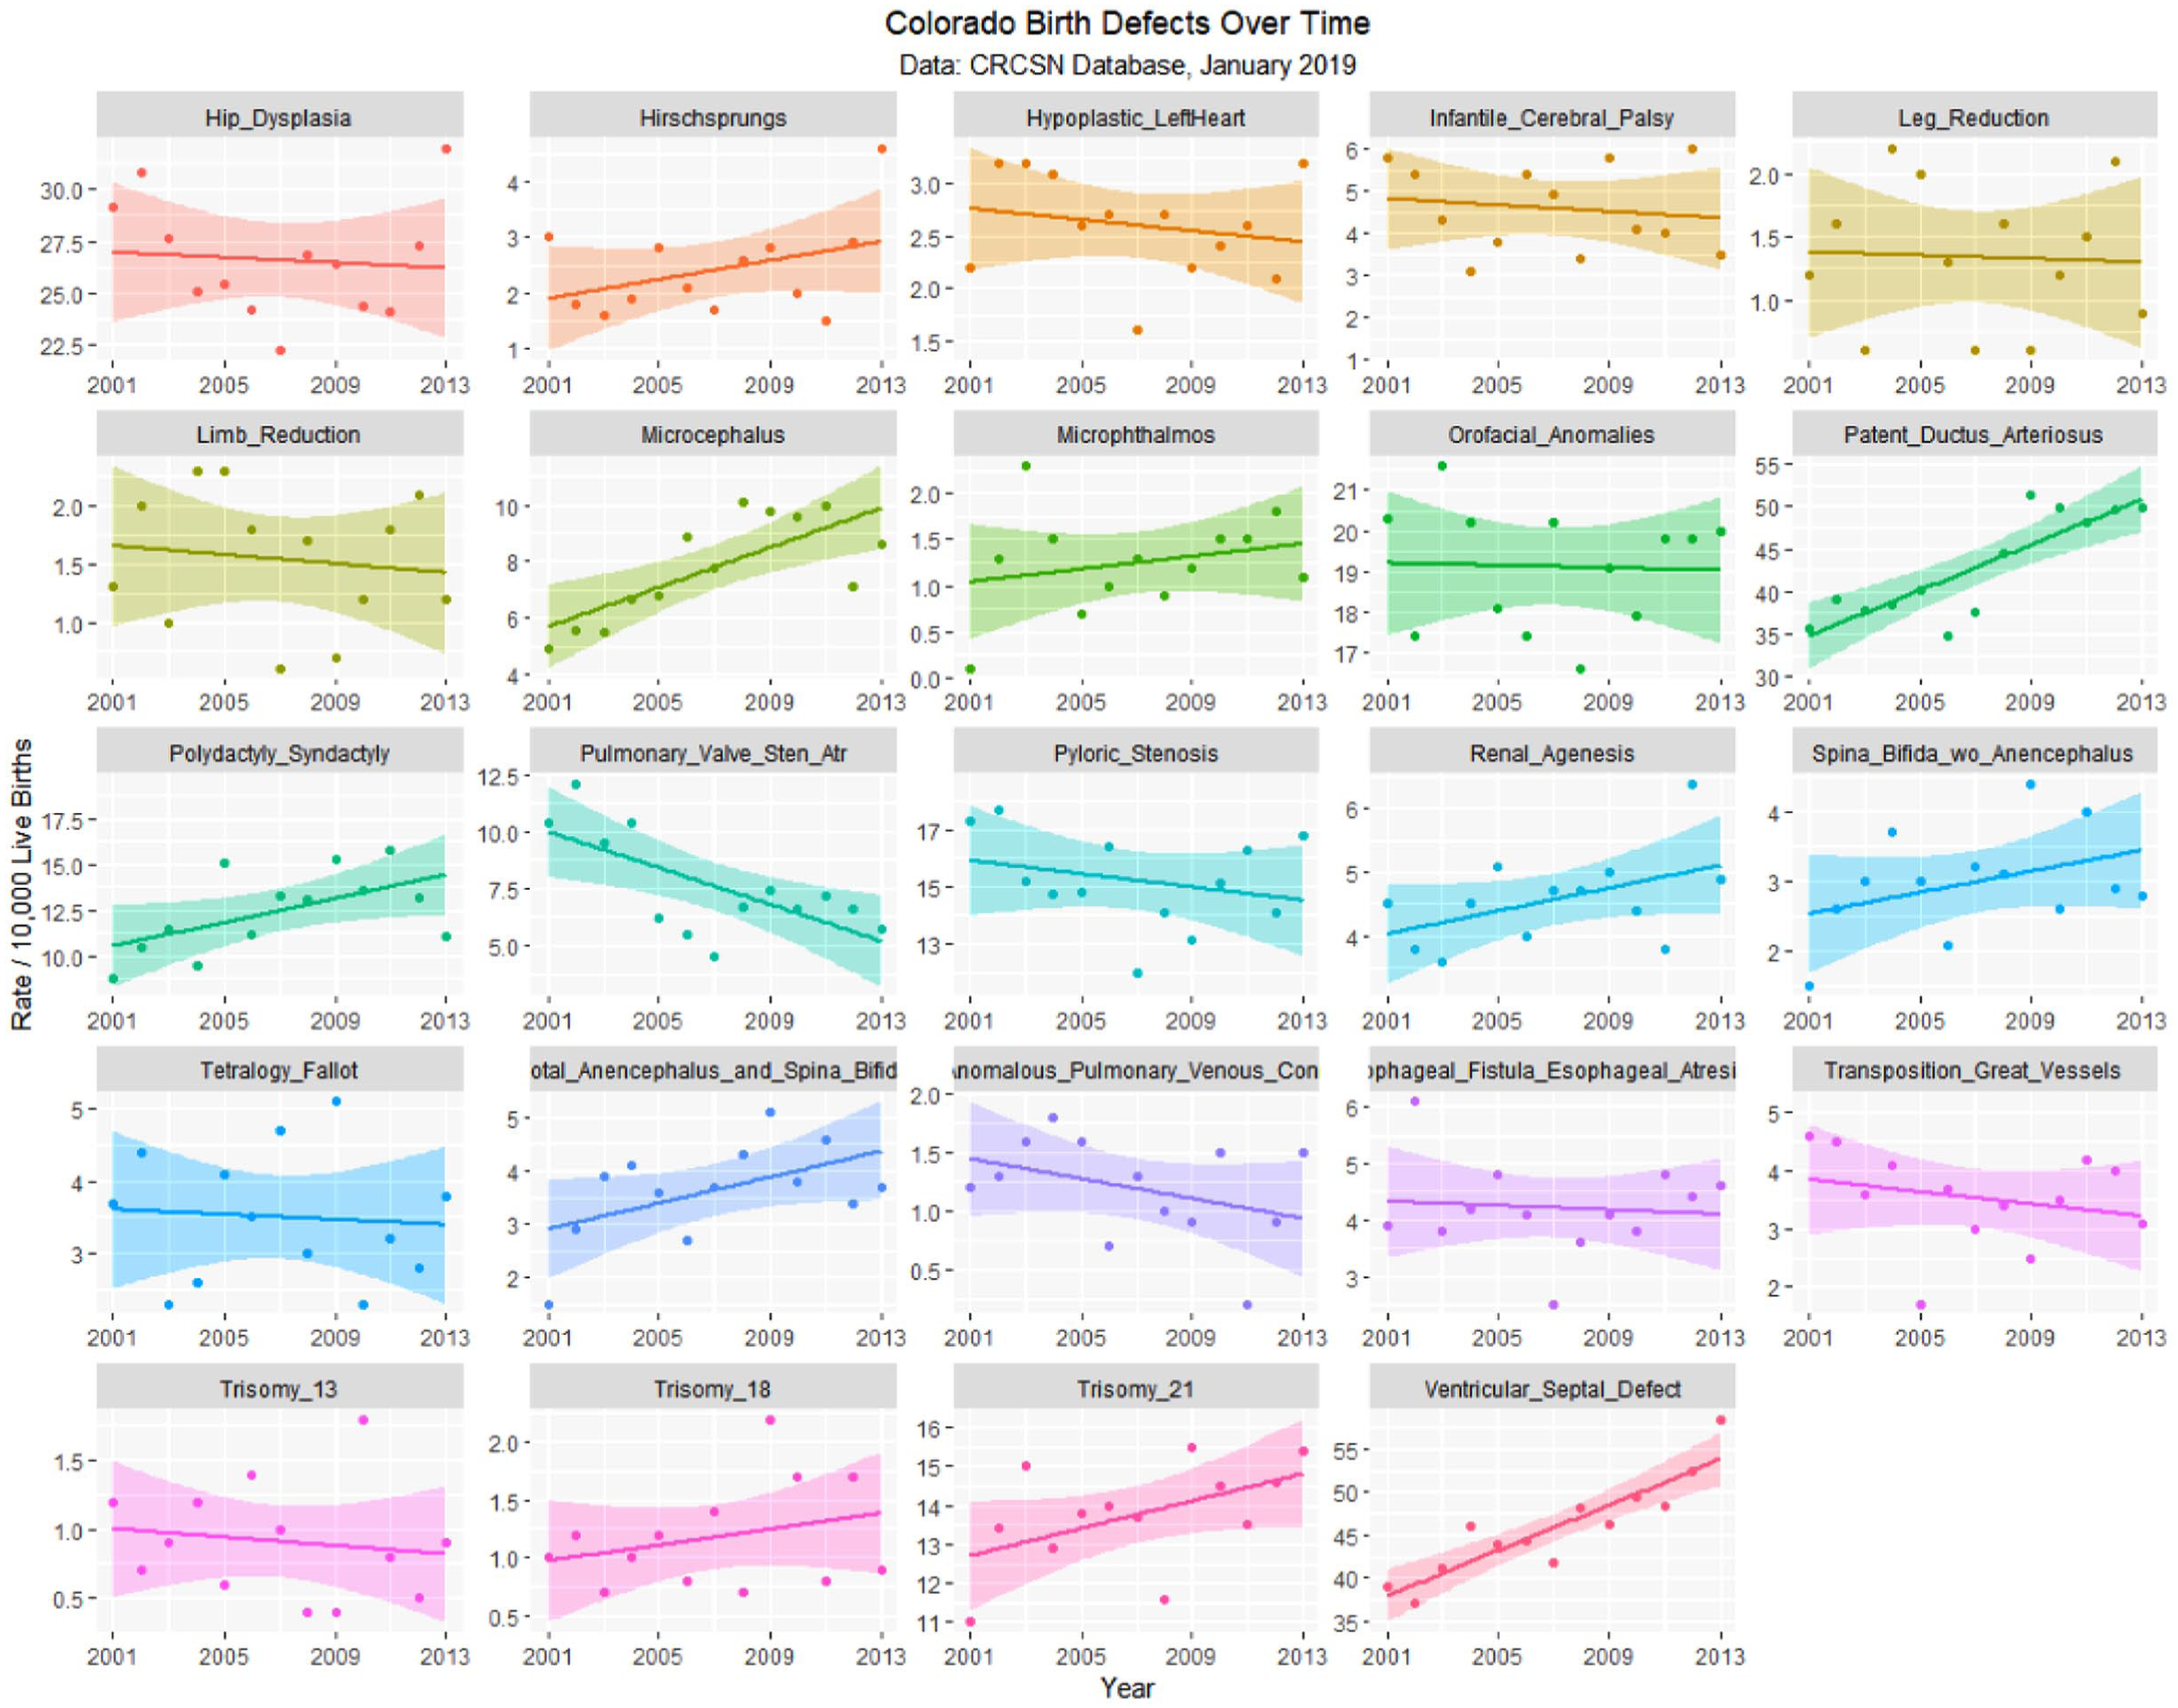
Colorado congenital defects H-V by time, regression lines fitted.
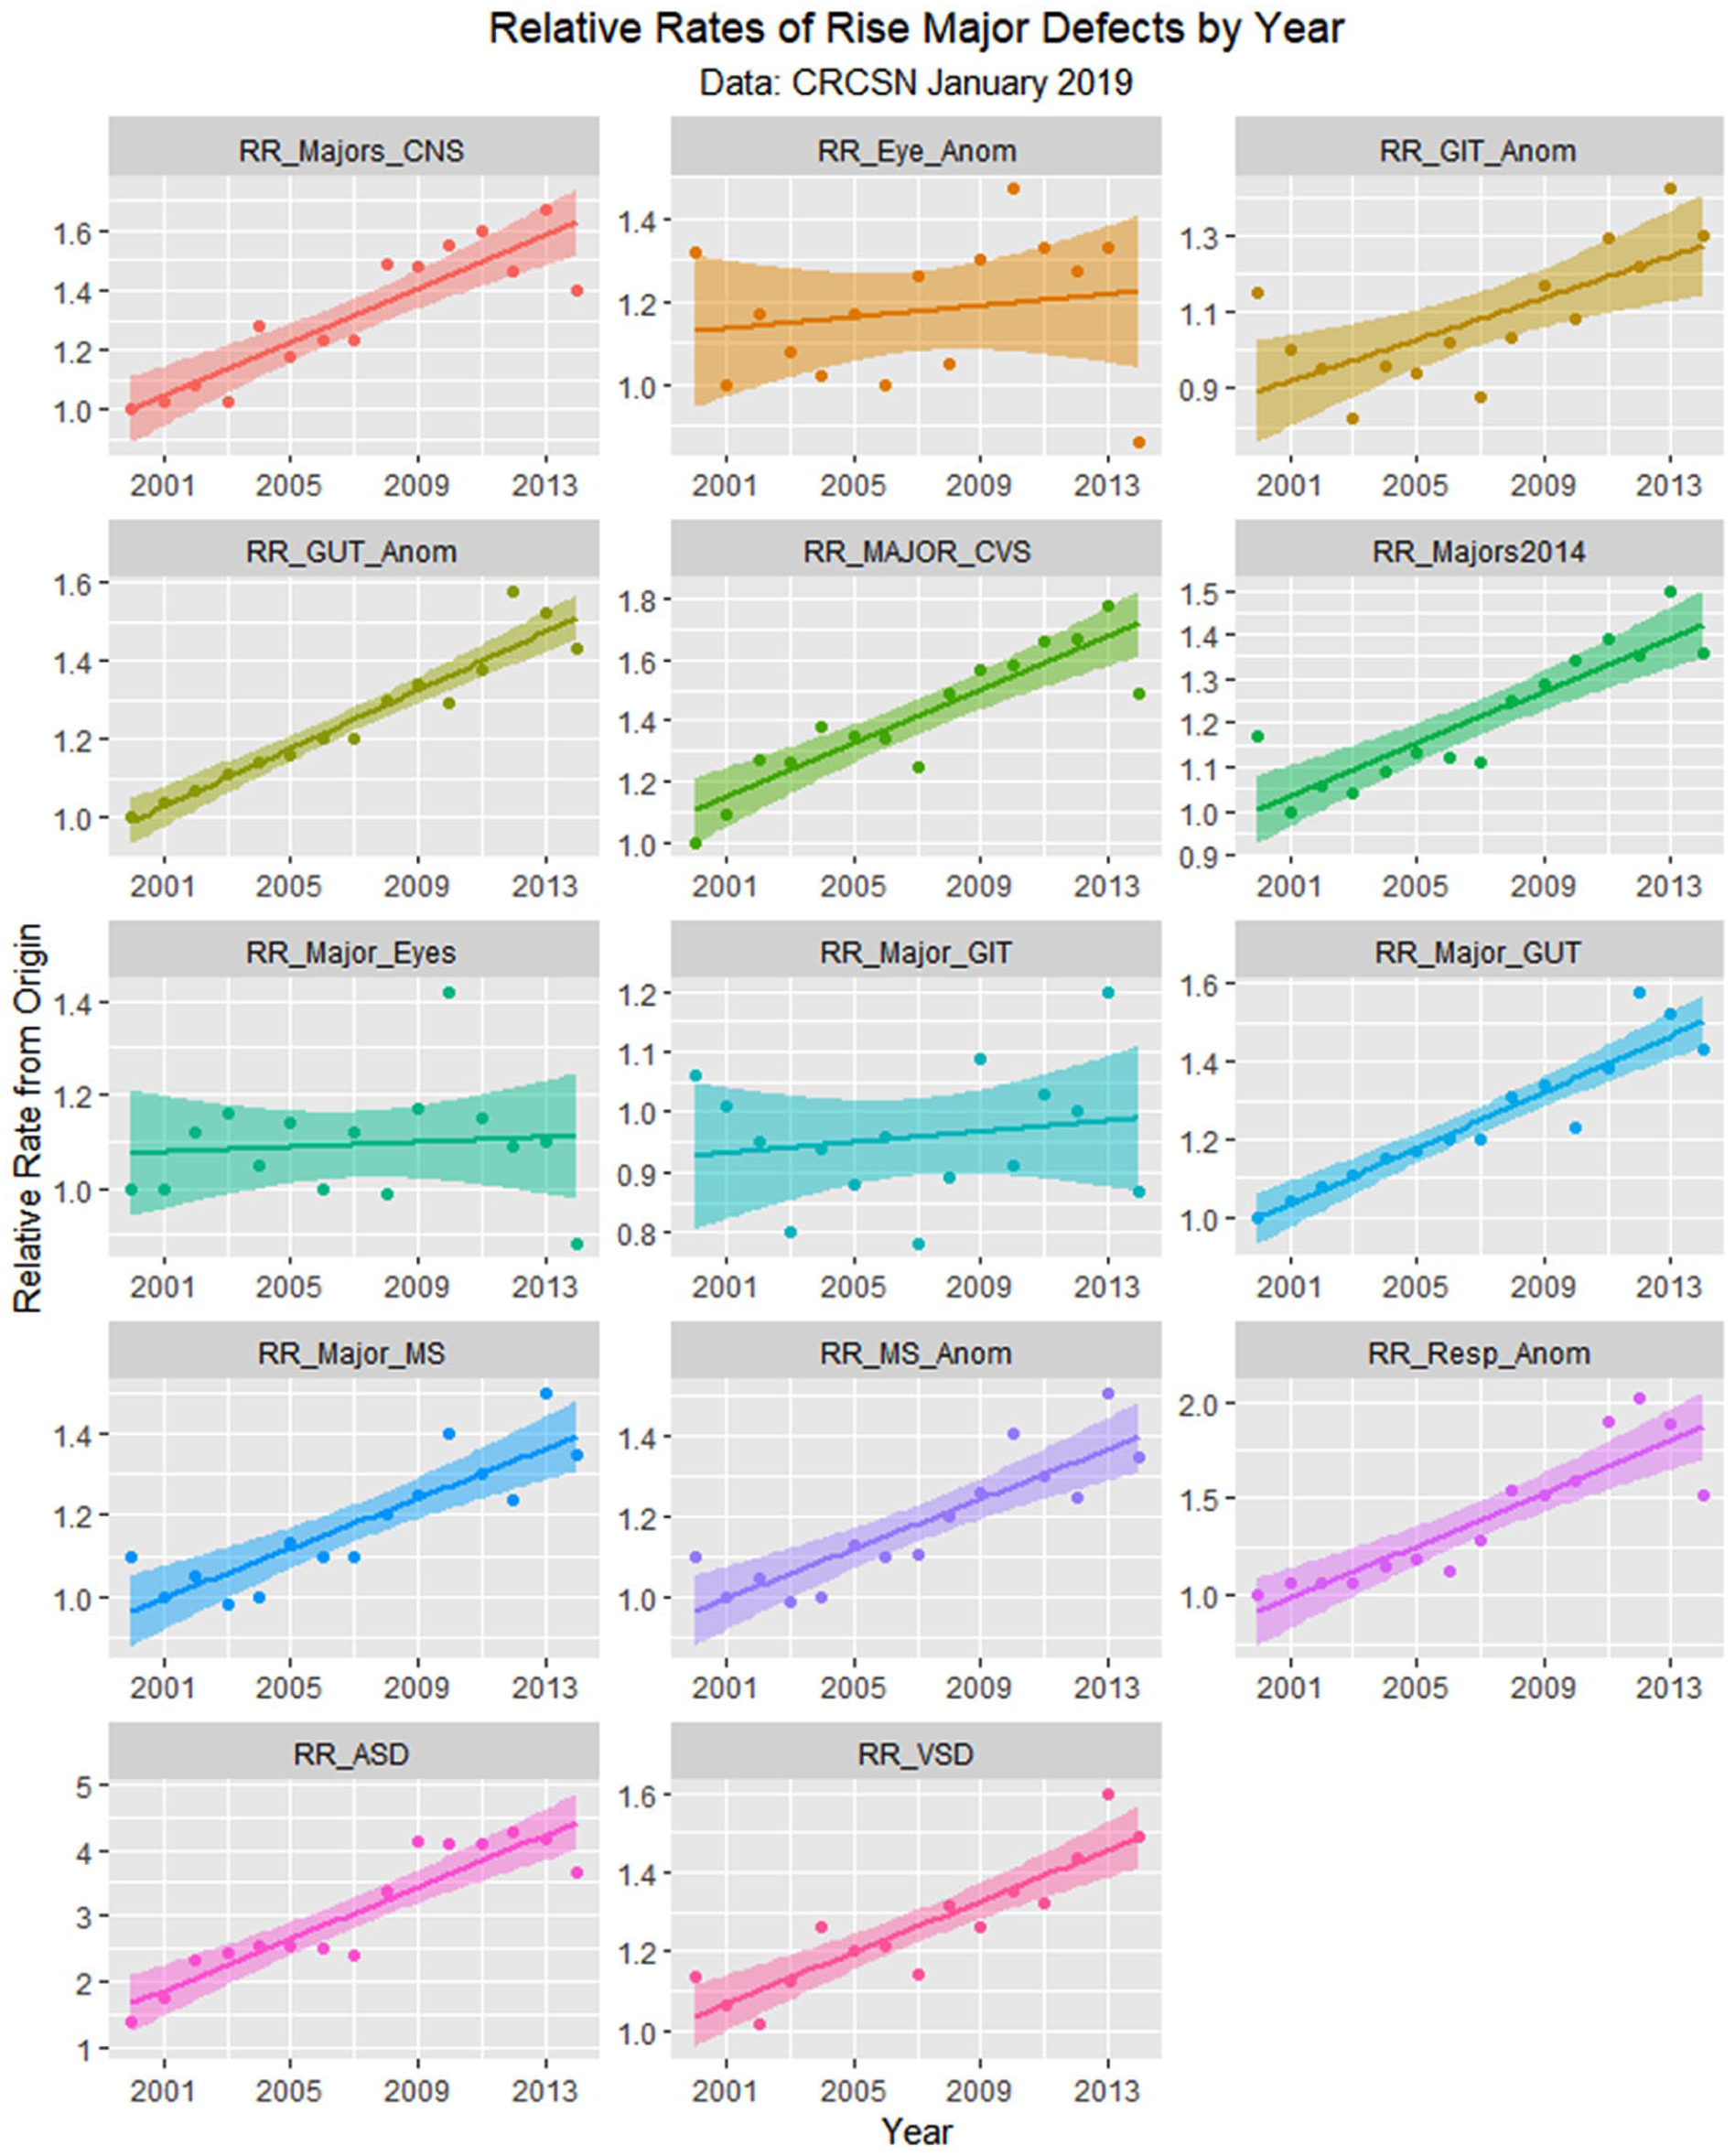
Table 1 lists the slope and confidence intervals of these time-dependent changes. Seven defects are noted to be significantly rising and 2 significantly falling. Table 2 repeats this exercise for the major defect summary groups. Nine of 11 slopes are noted to be rising. Supplementary Figures 1 and 2 (available online) present loess curves for these data.
Time-Dependent Trends of CRCSN Defects.
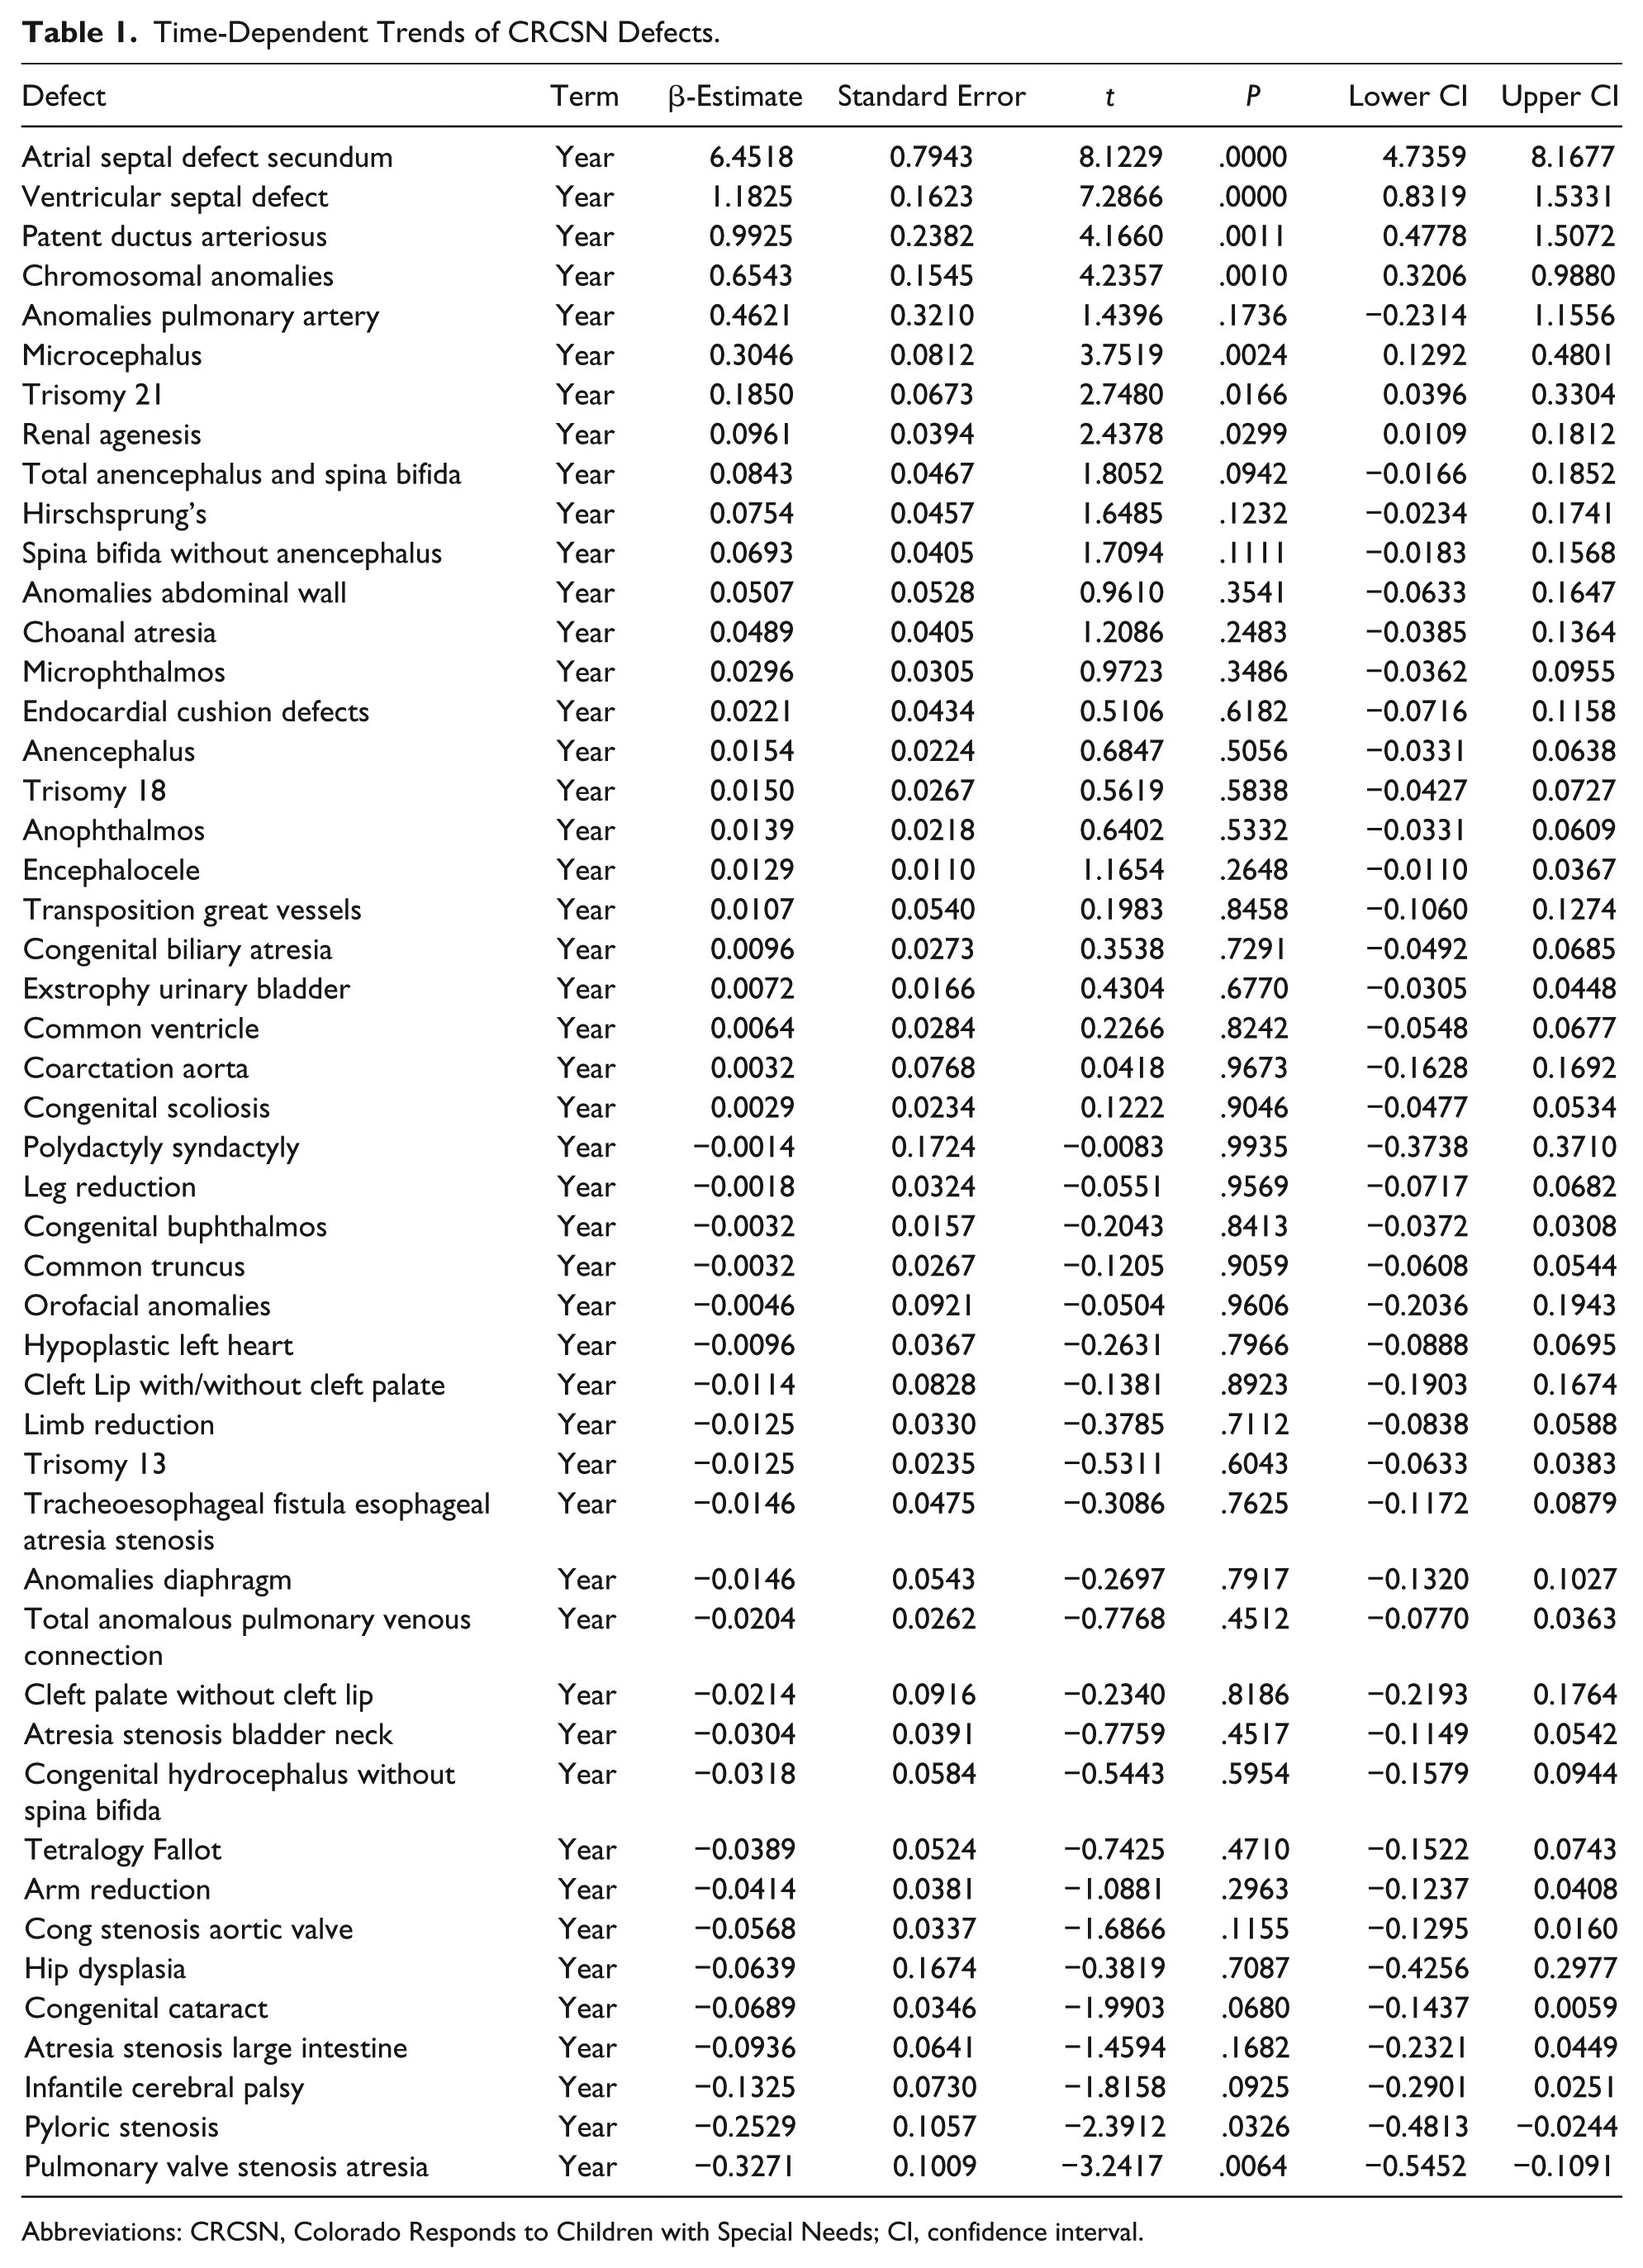
Abbreviations: CRCSN, Colorado Responds to Children with Special Needs; CI, confidence interval.
Time-Dependent Trends of CRCSN Major Defect Classes.
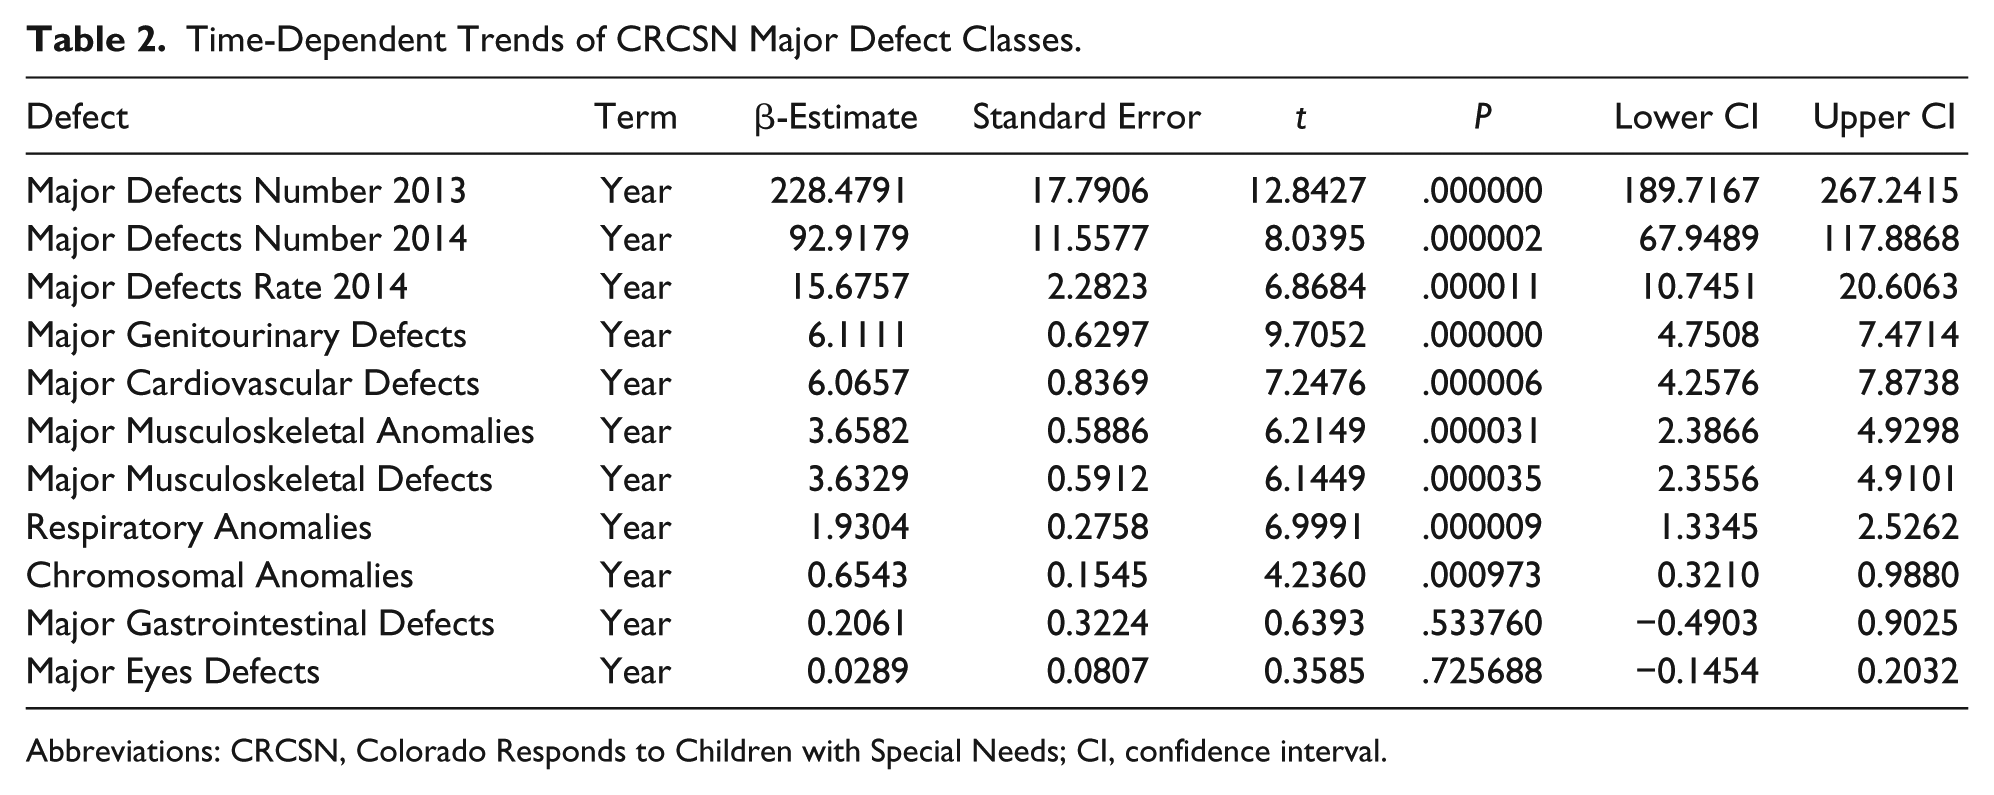
Abbreviations: CRCSN, Colorado Responds to Children with Special Needs; CI, confidence interval.
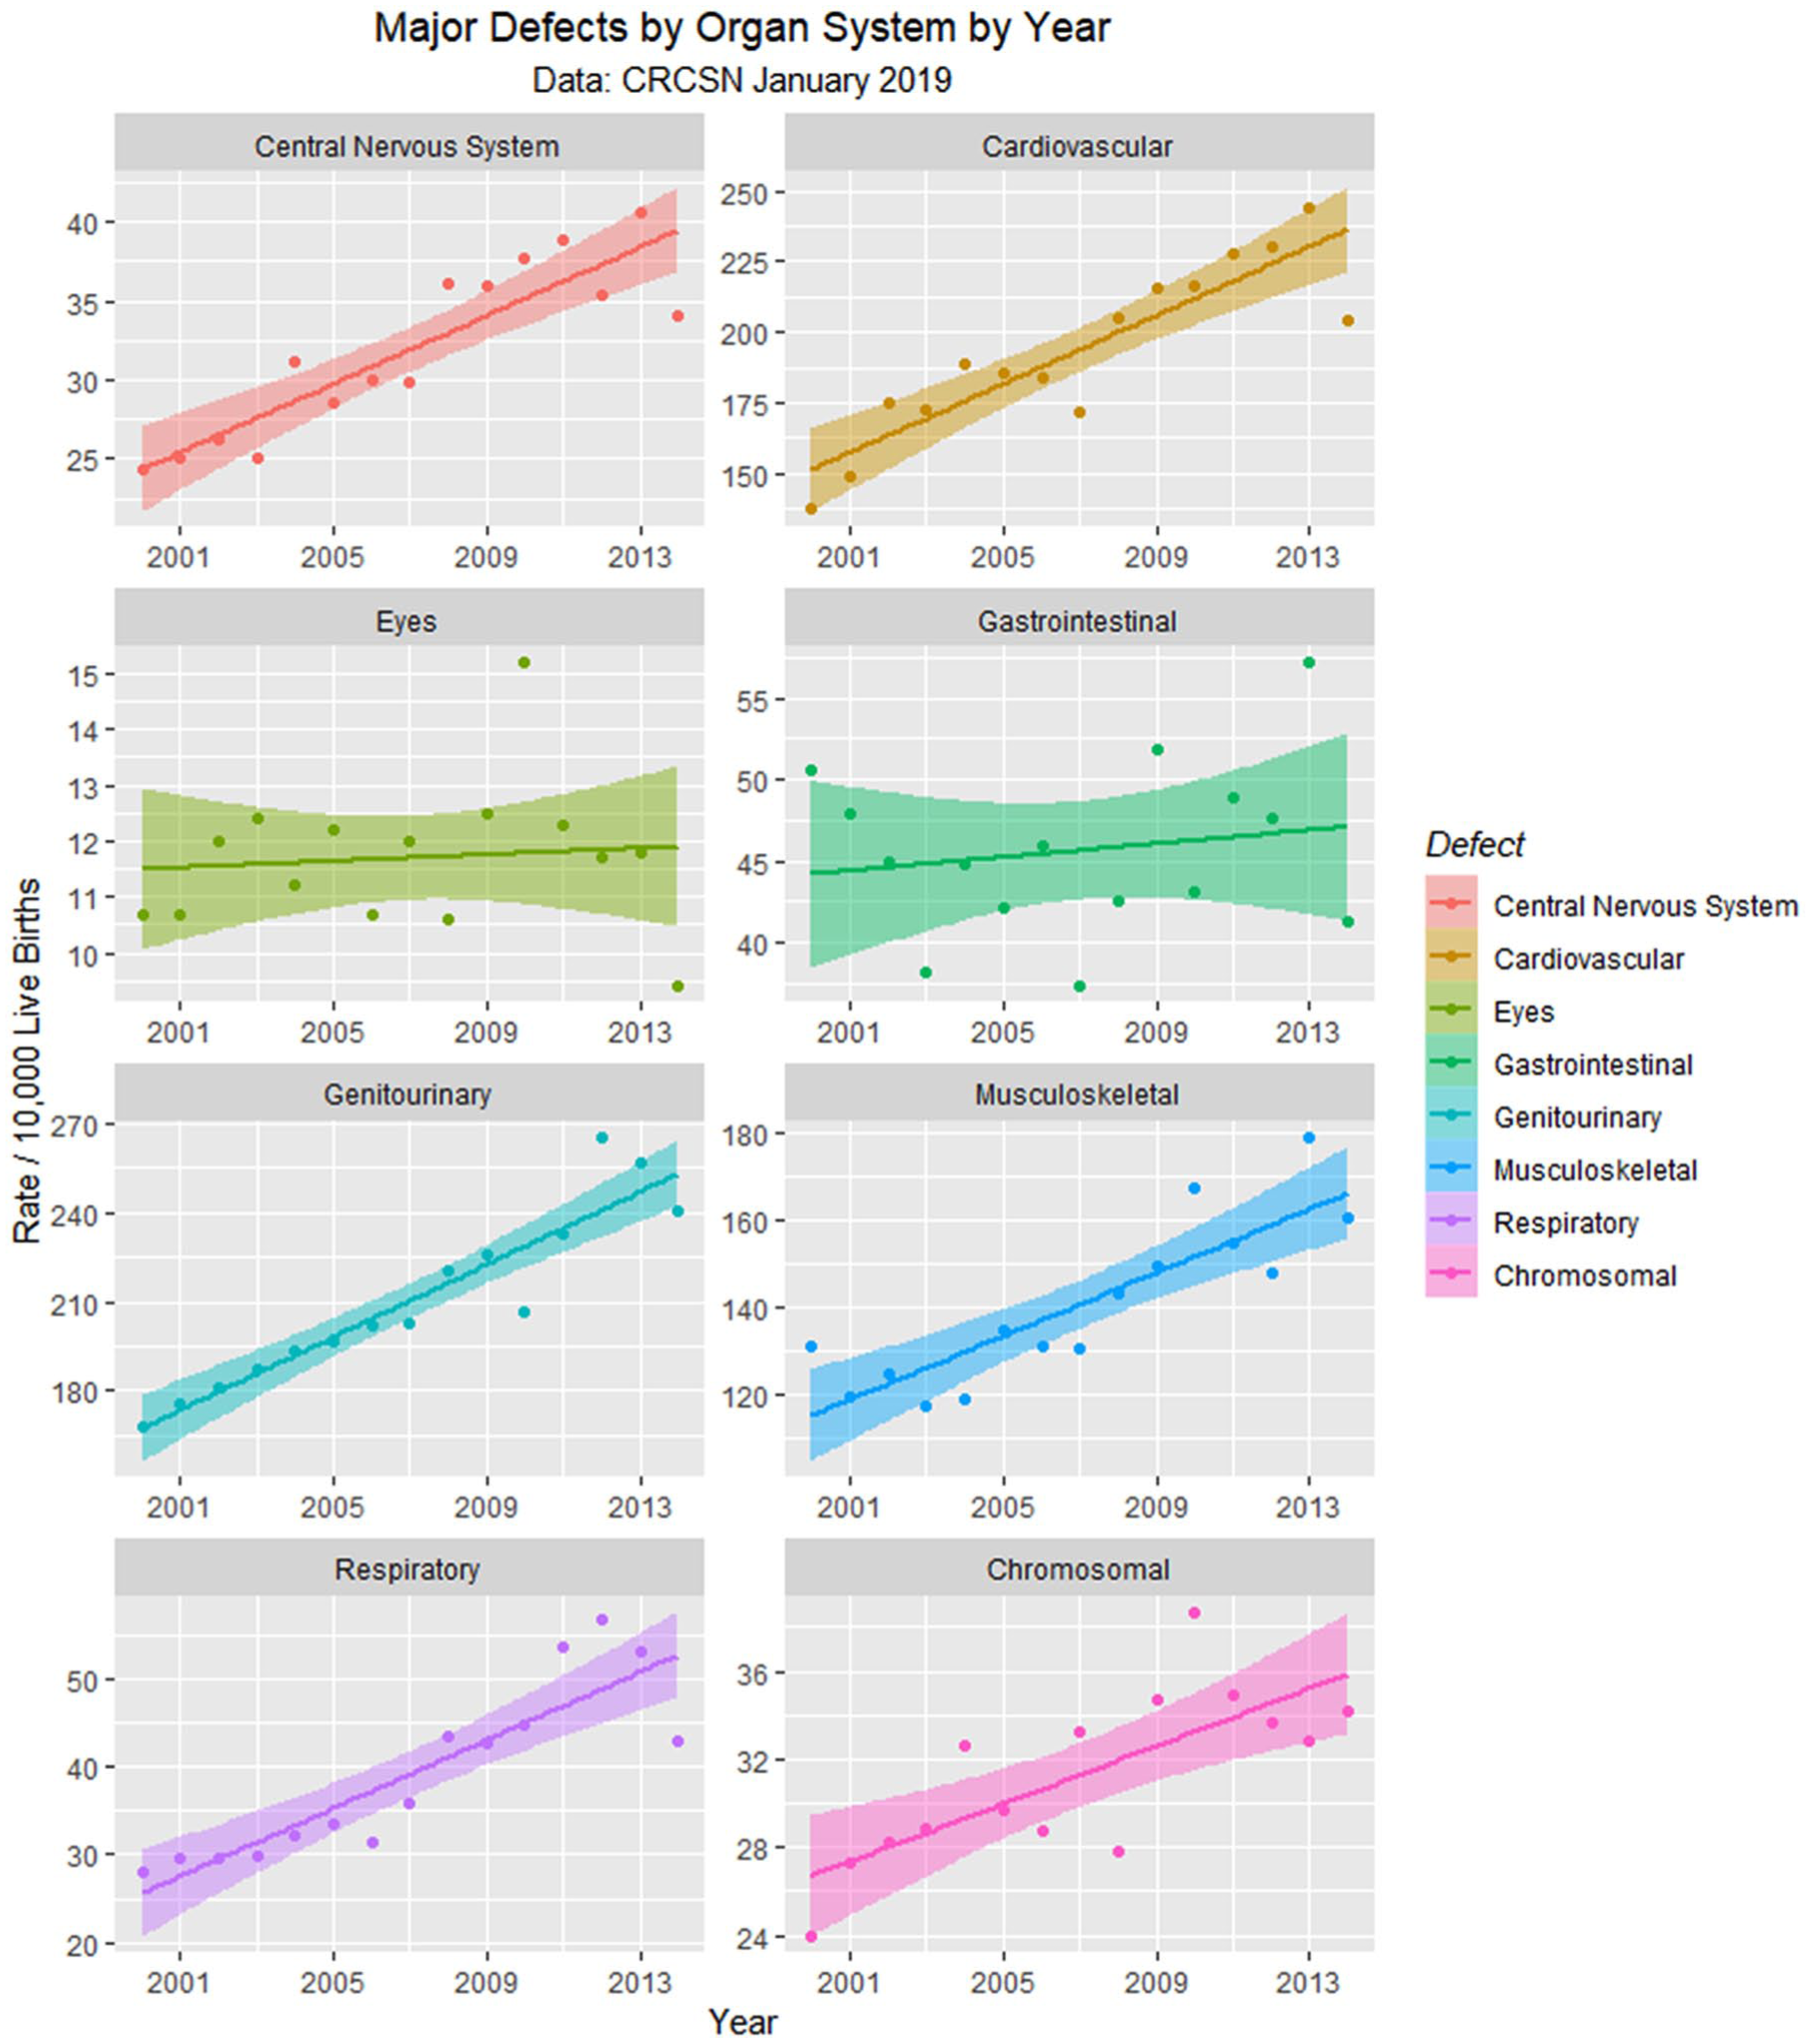
Since the data are rather difficult to mentally digest en masse, Figures 3 to 8 present data grouped by organ system. Figure 9 illustrates the summary data by organ system.
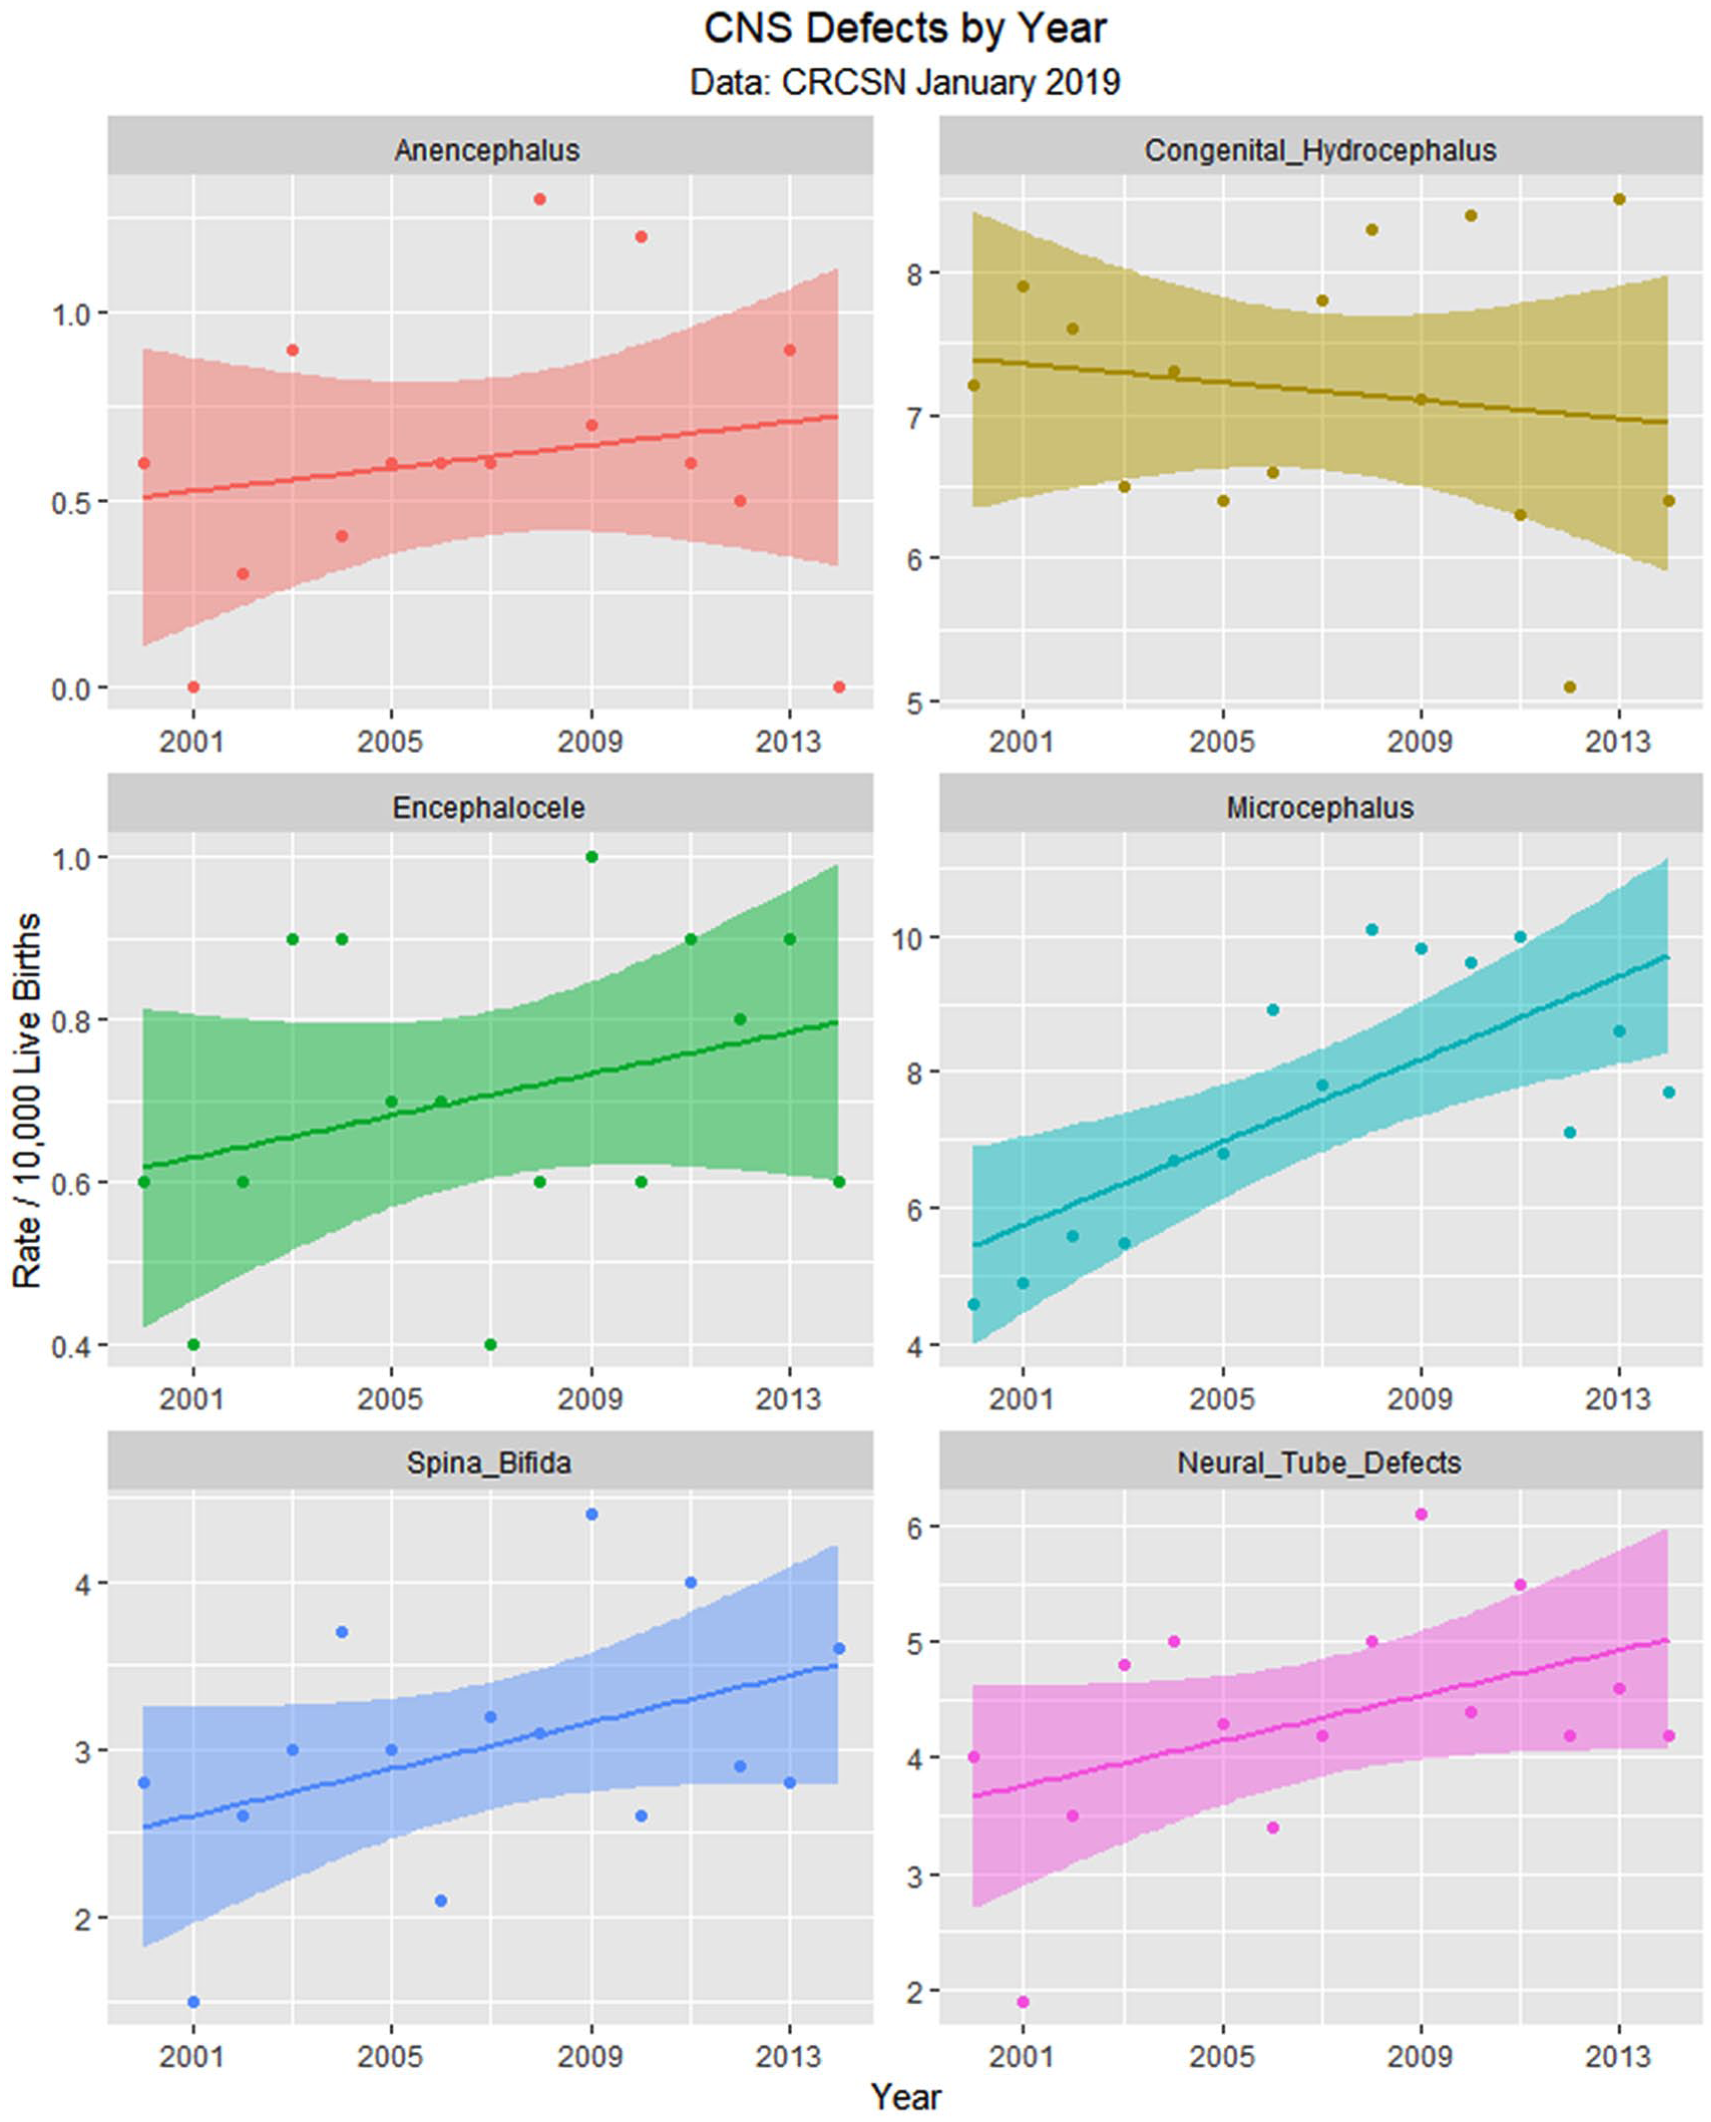
Central nervous system (CNS) defects by time.
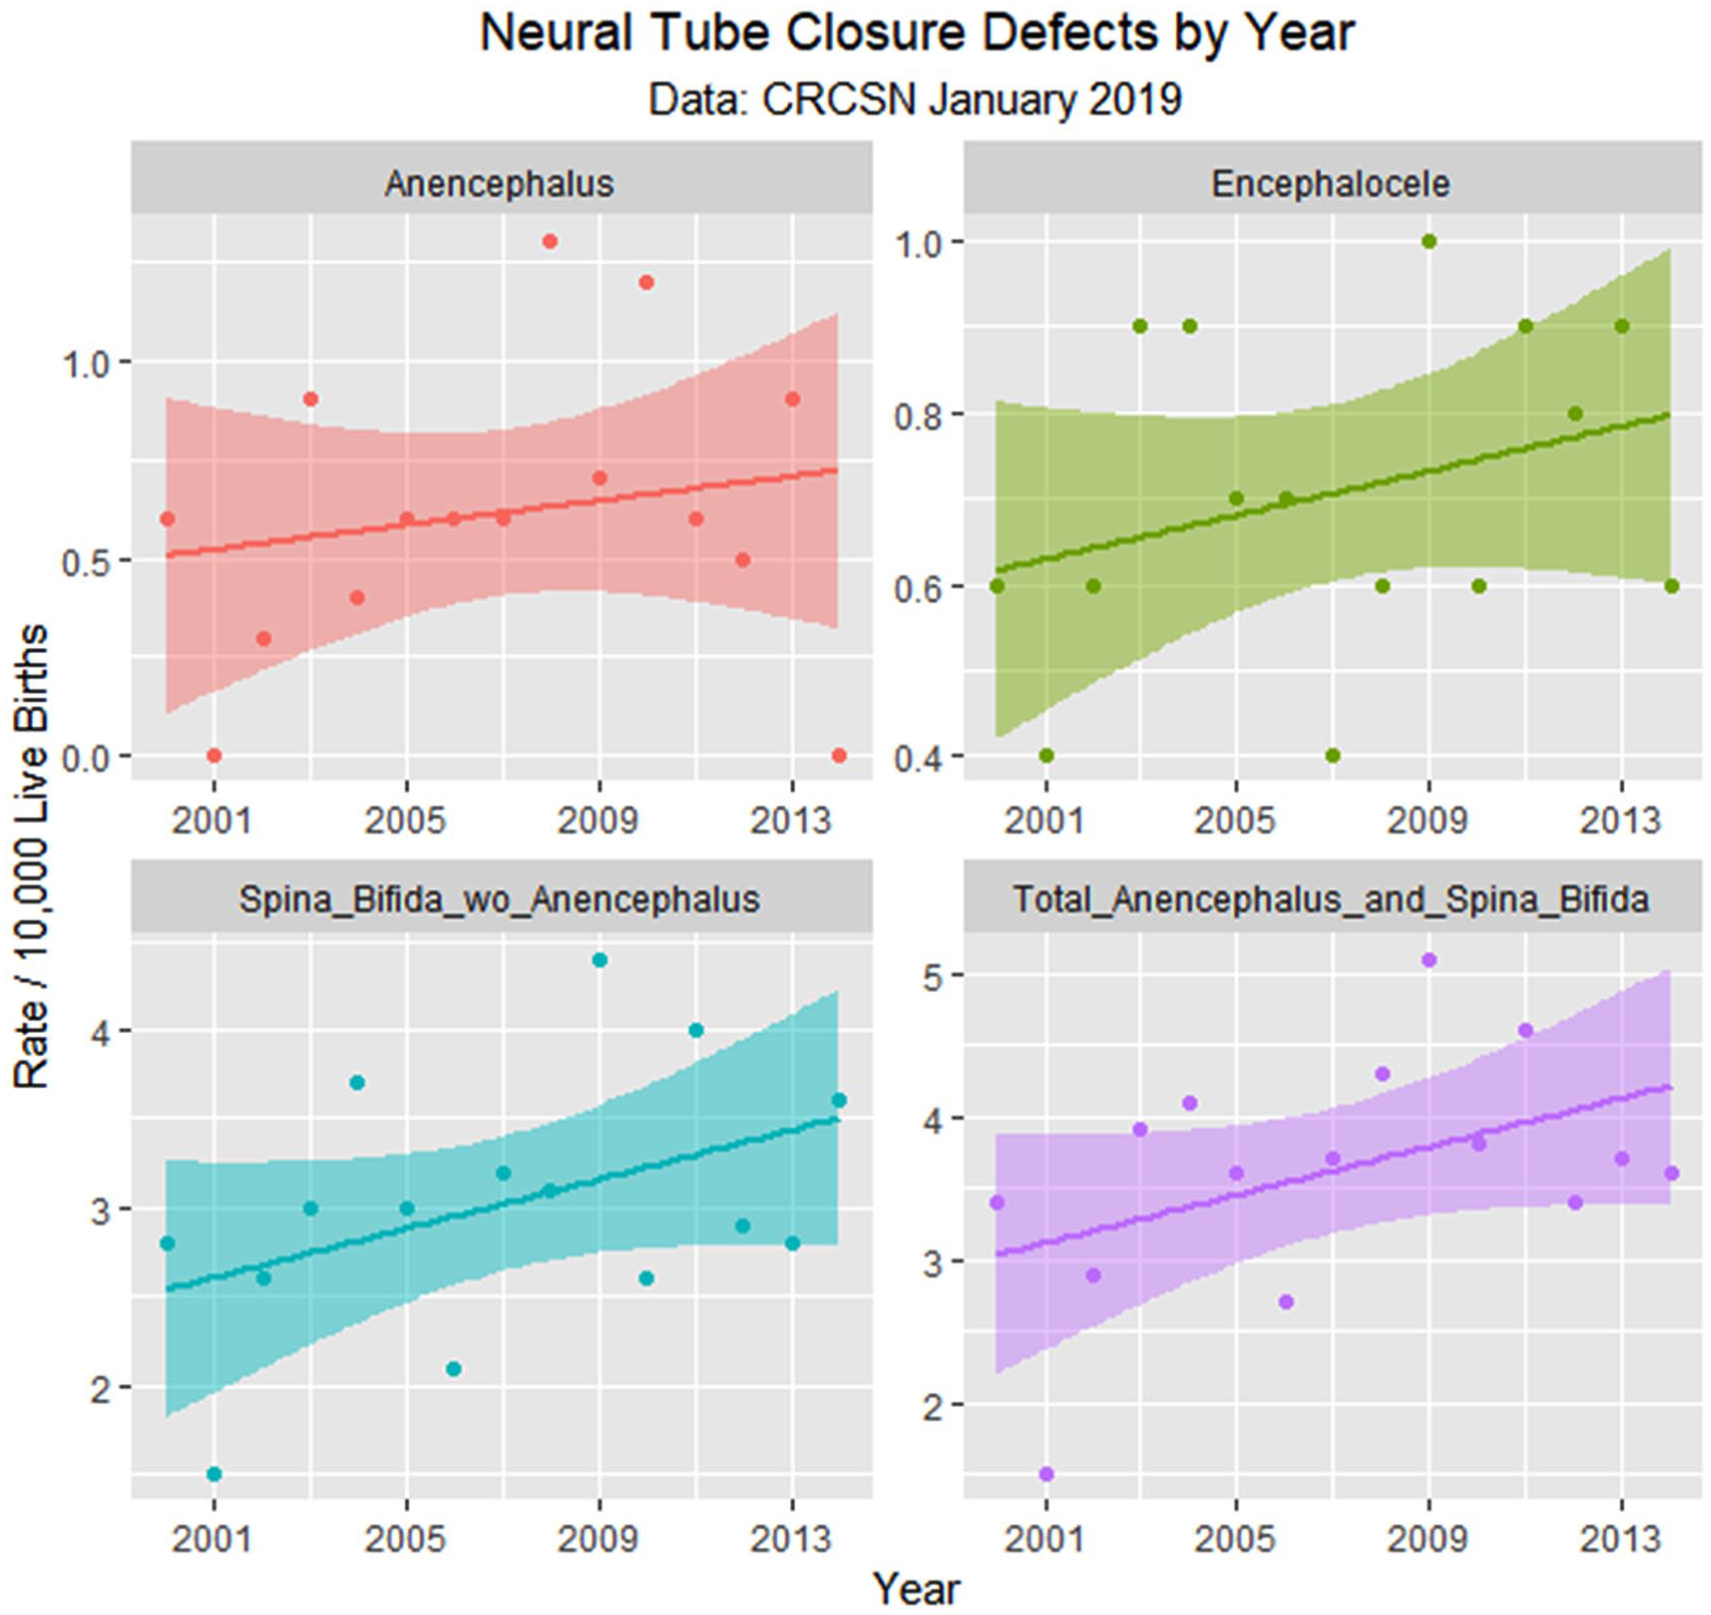
Neural tube defects by time.
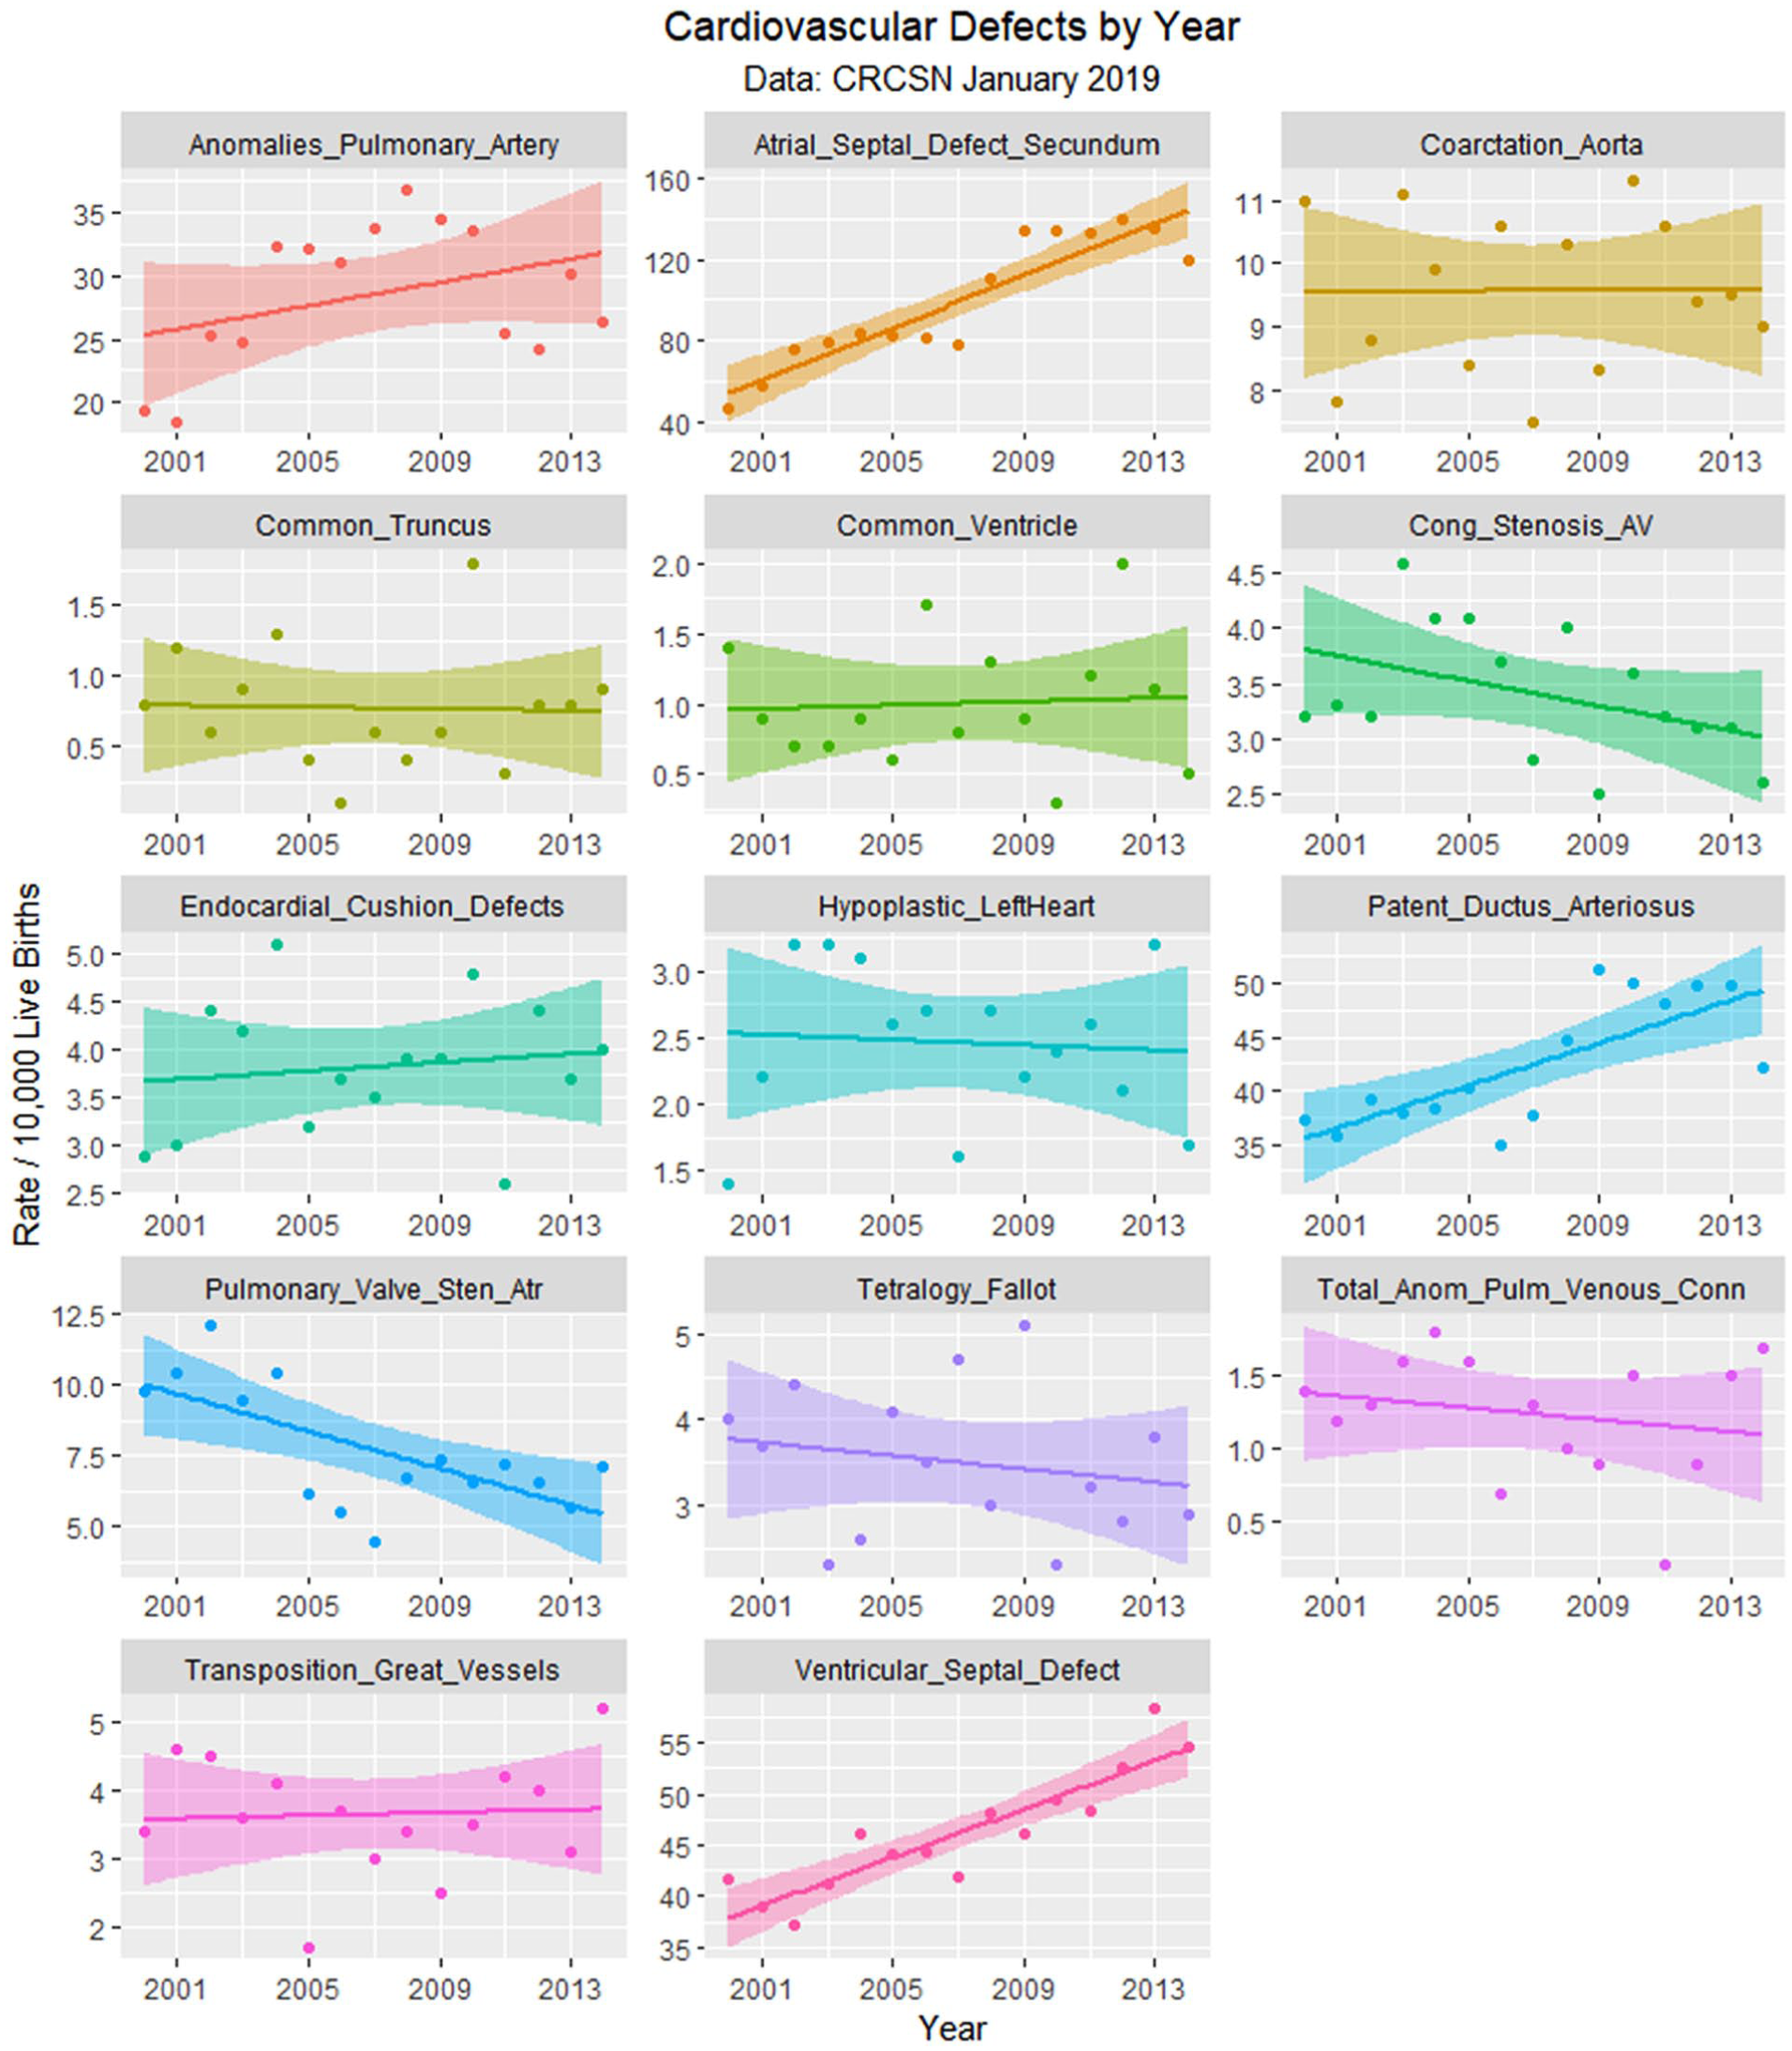
Cardiovascular defects by time.
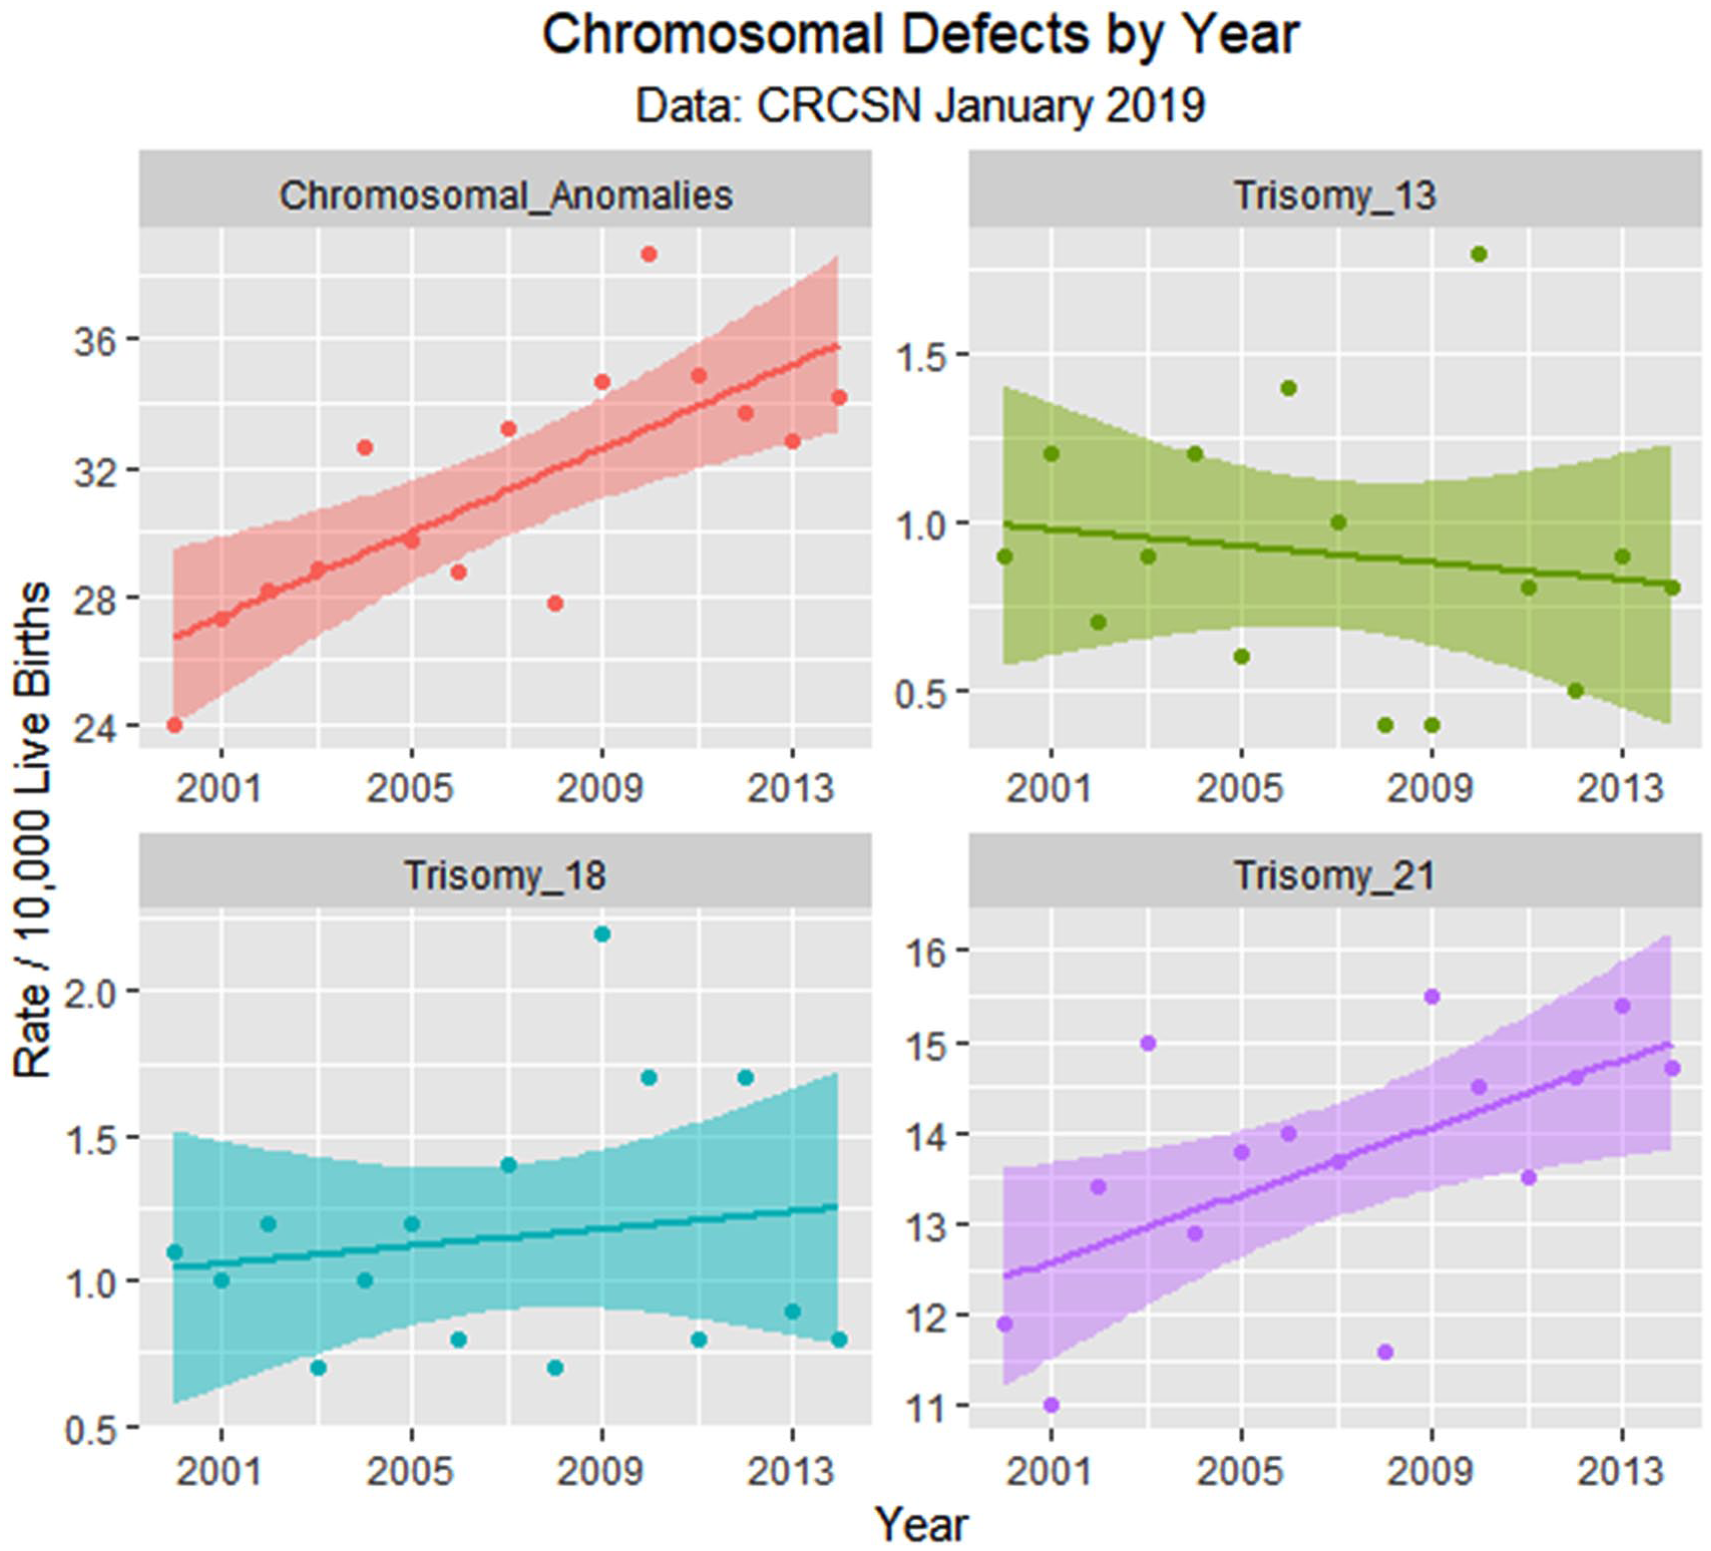
Chromosomal defects by time.
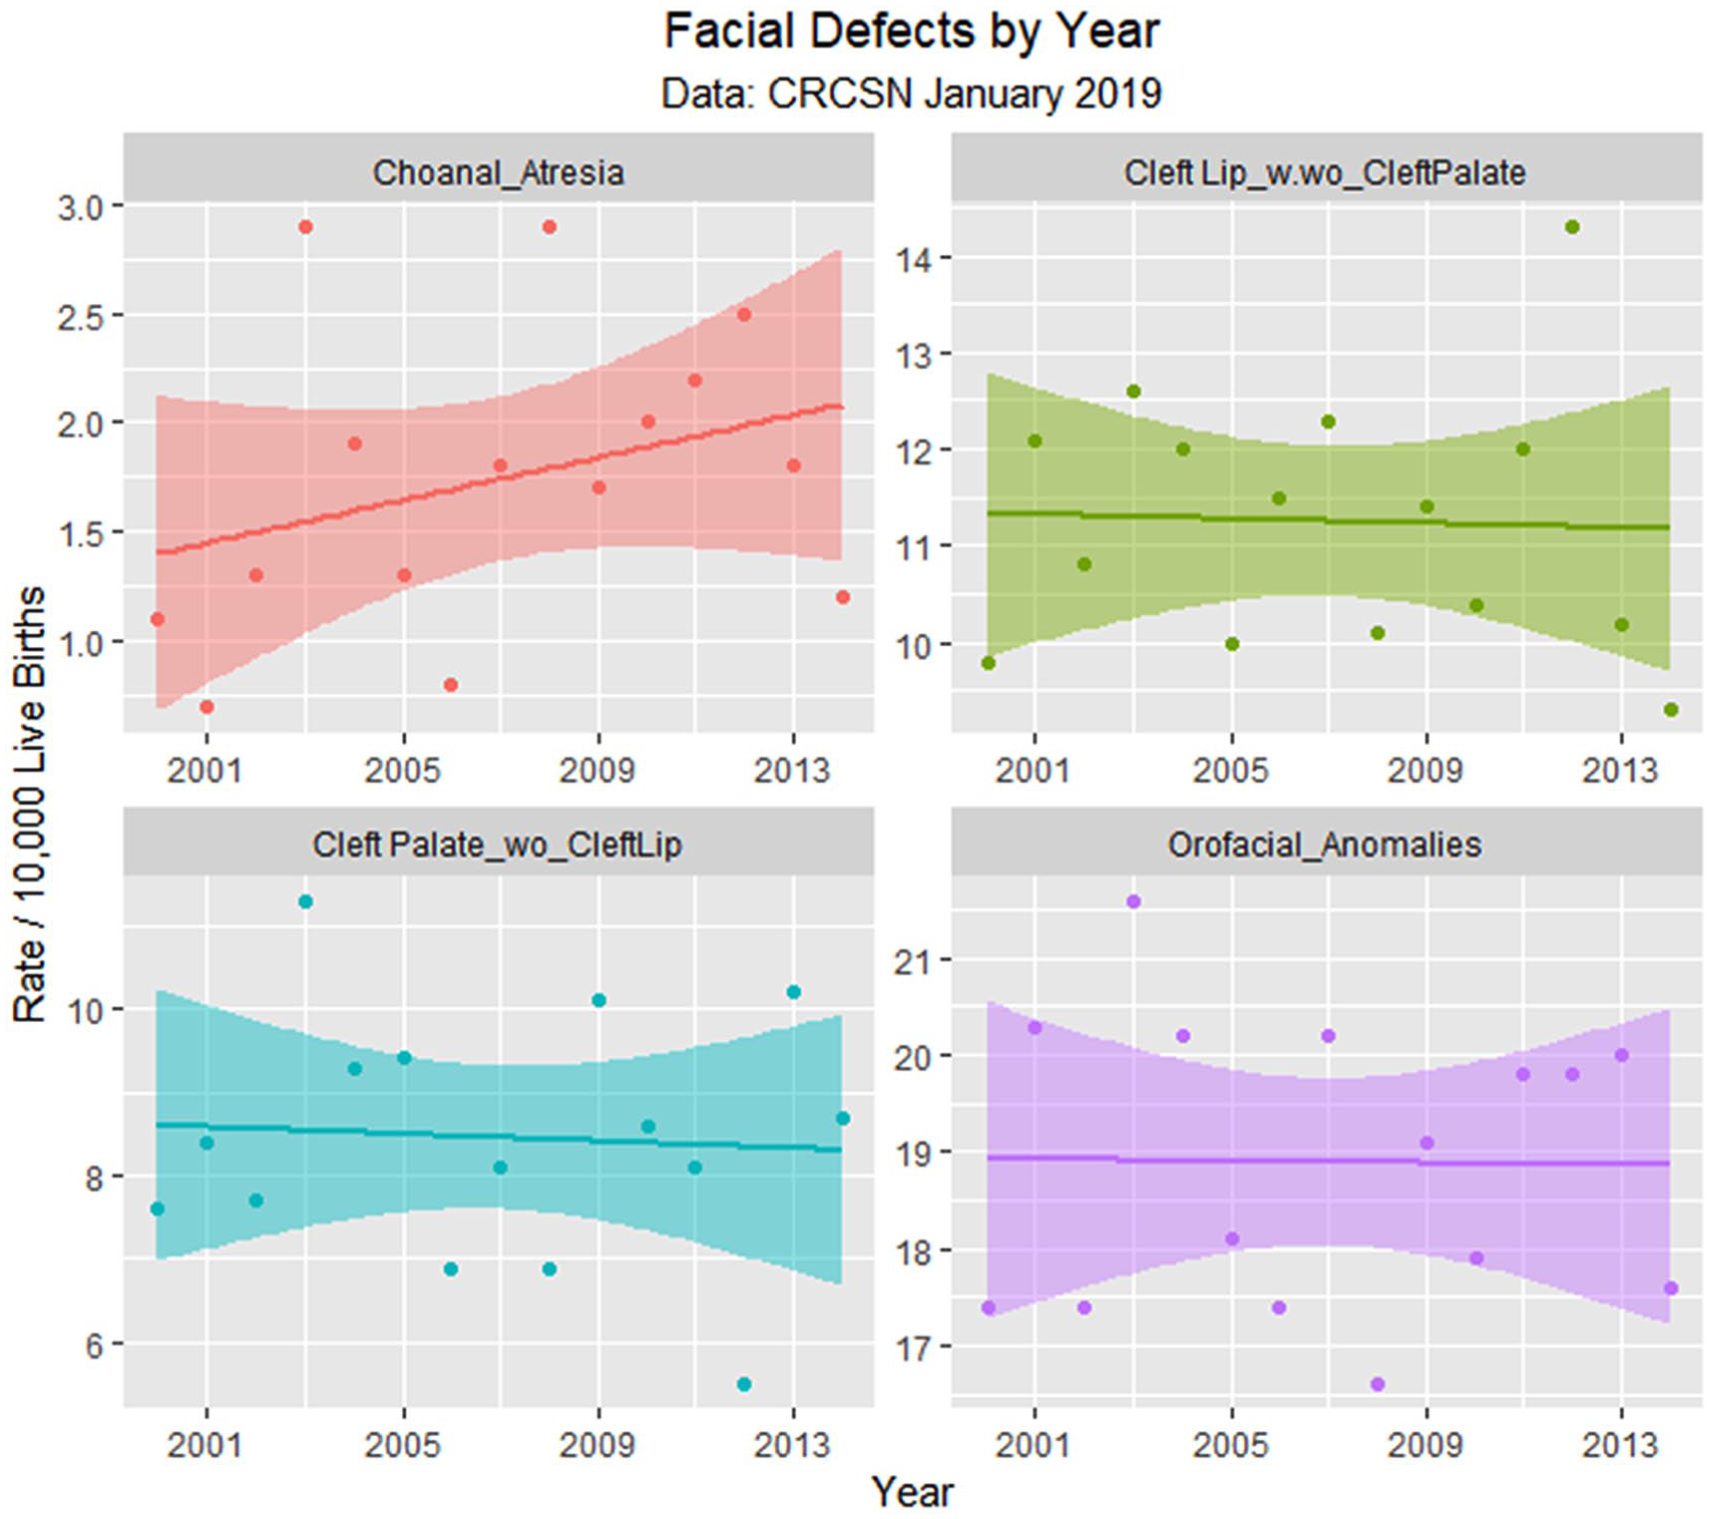
Face defects by time.
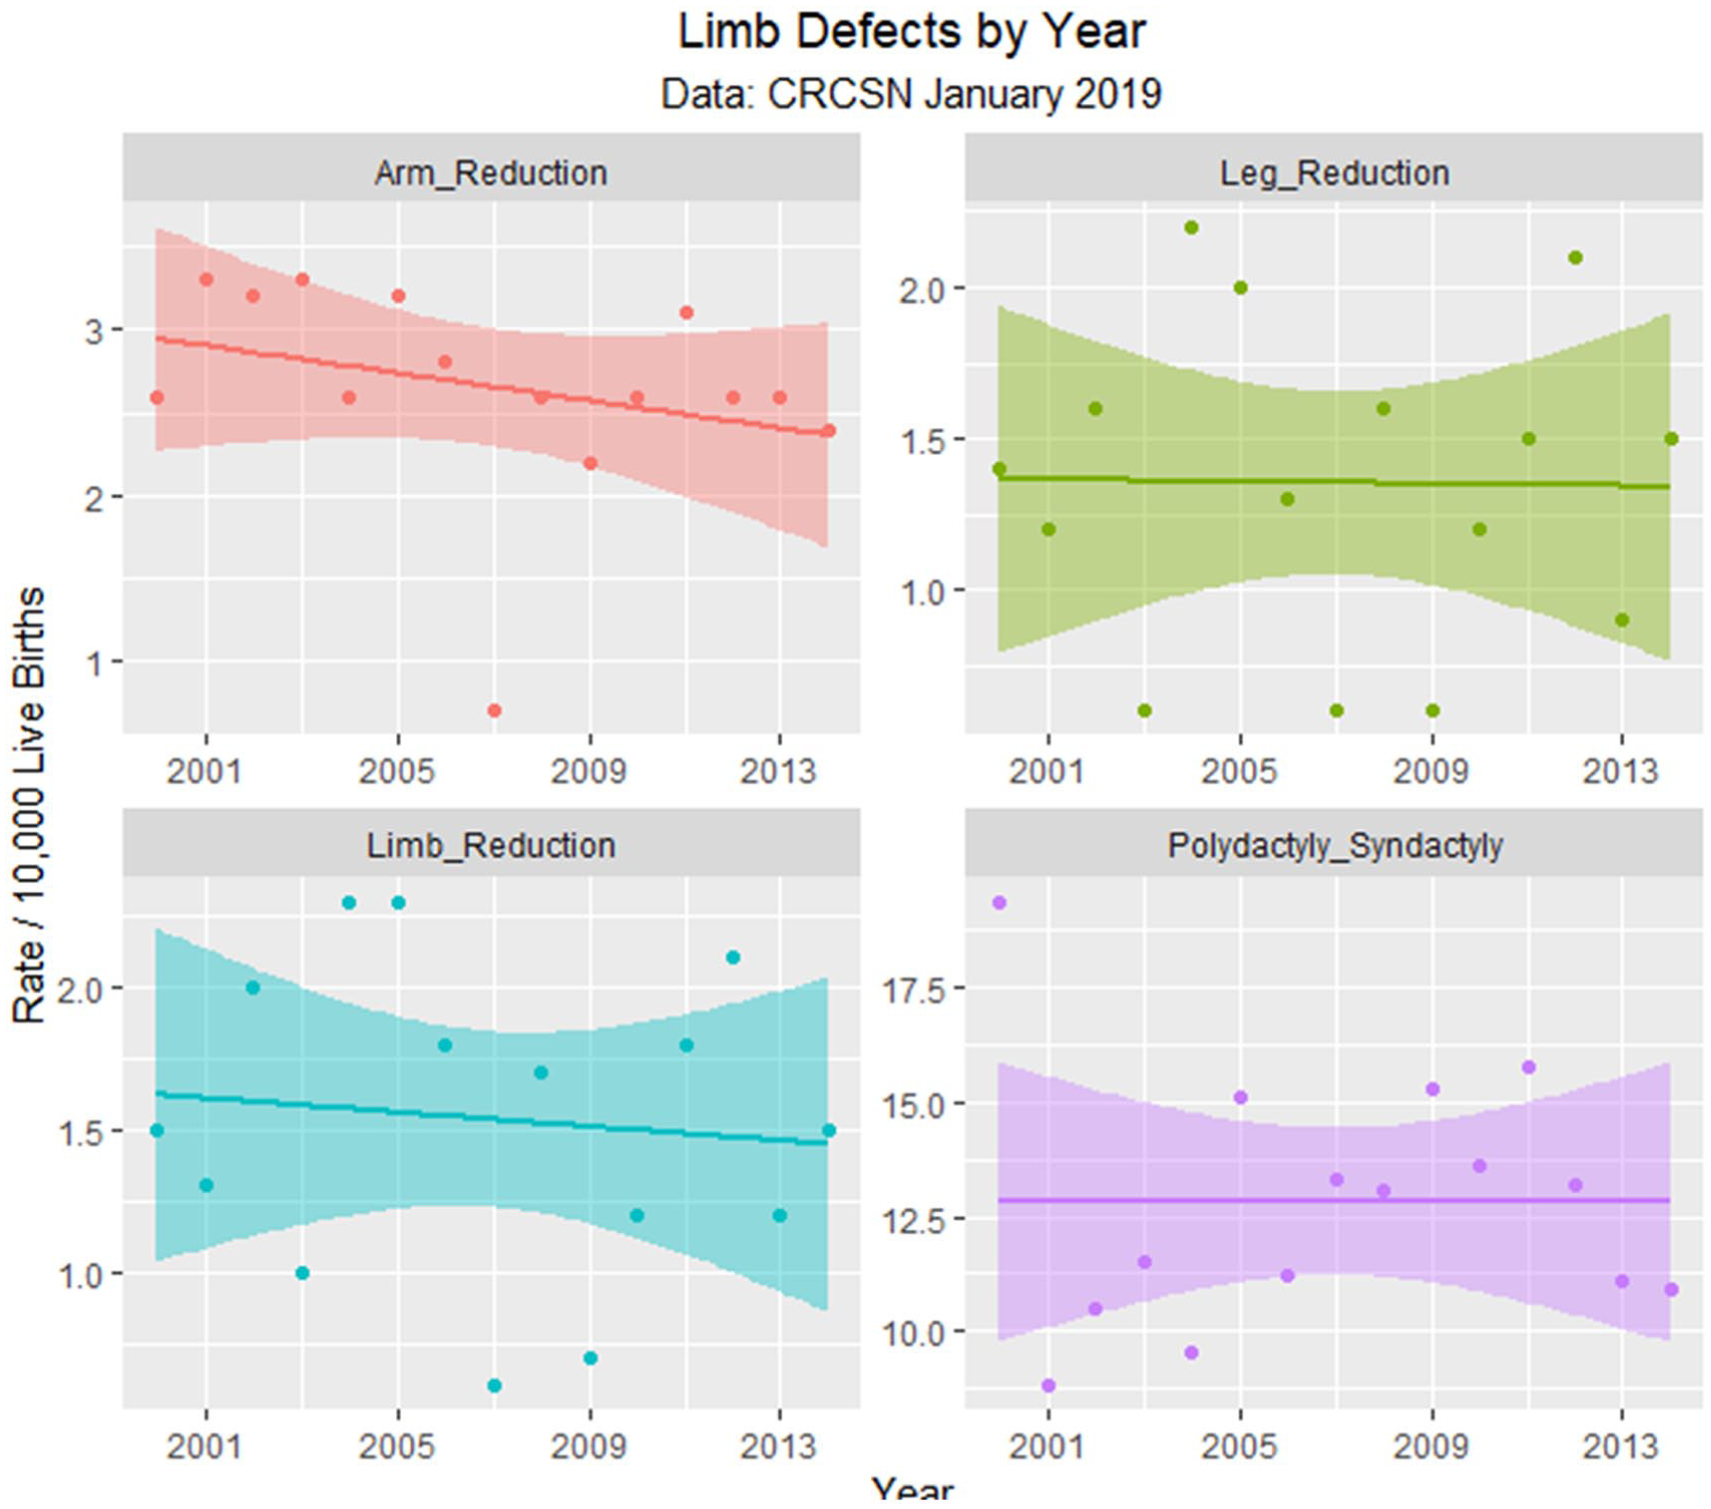
Limb defects by time.
Major defects by time.
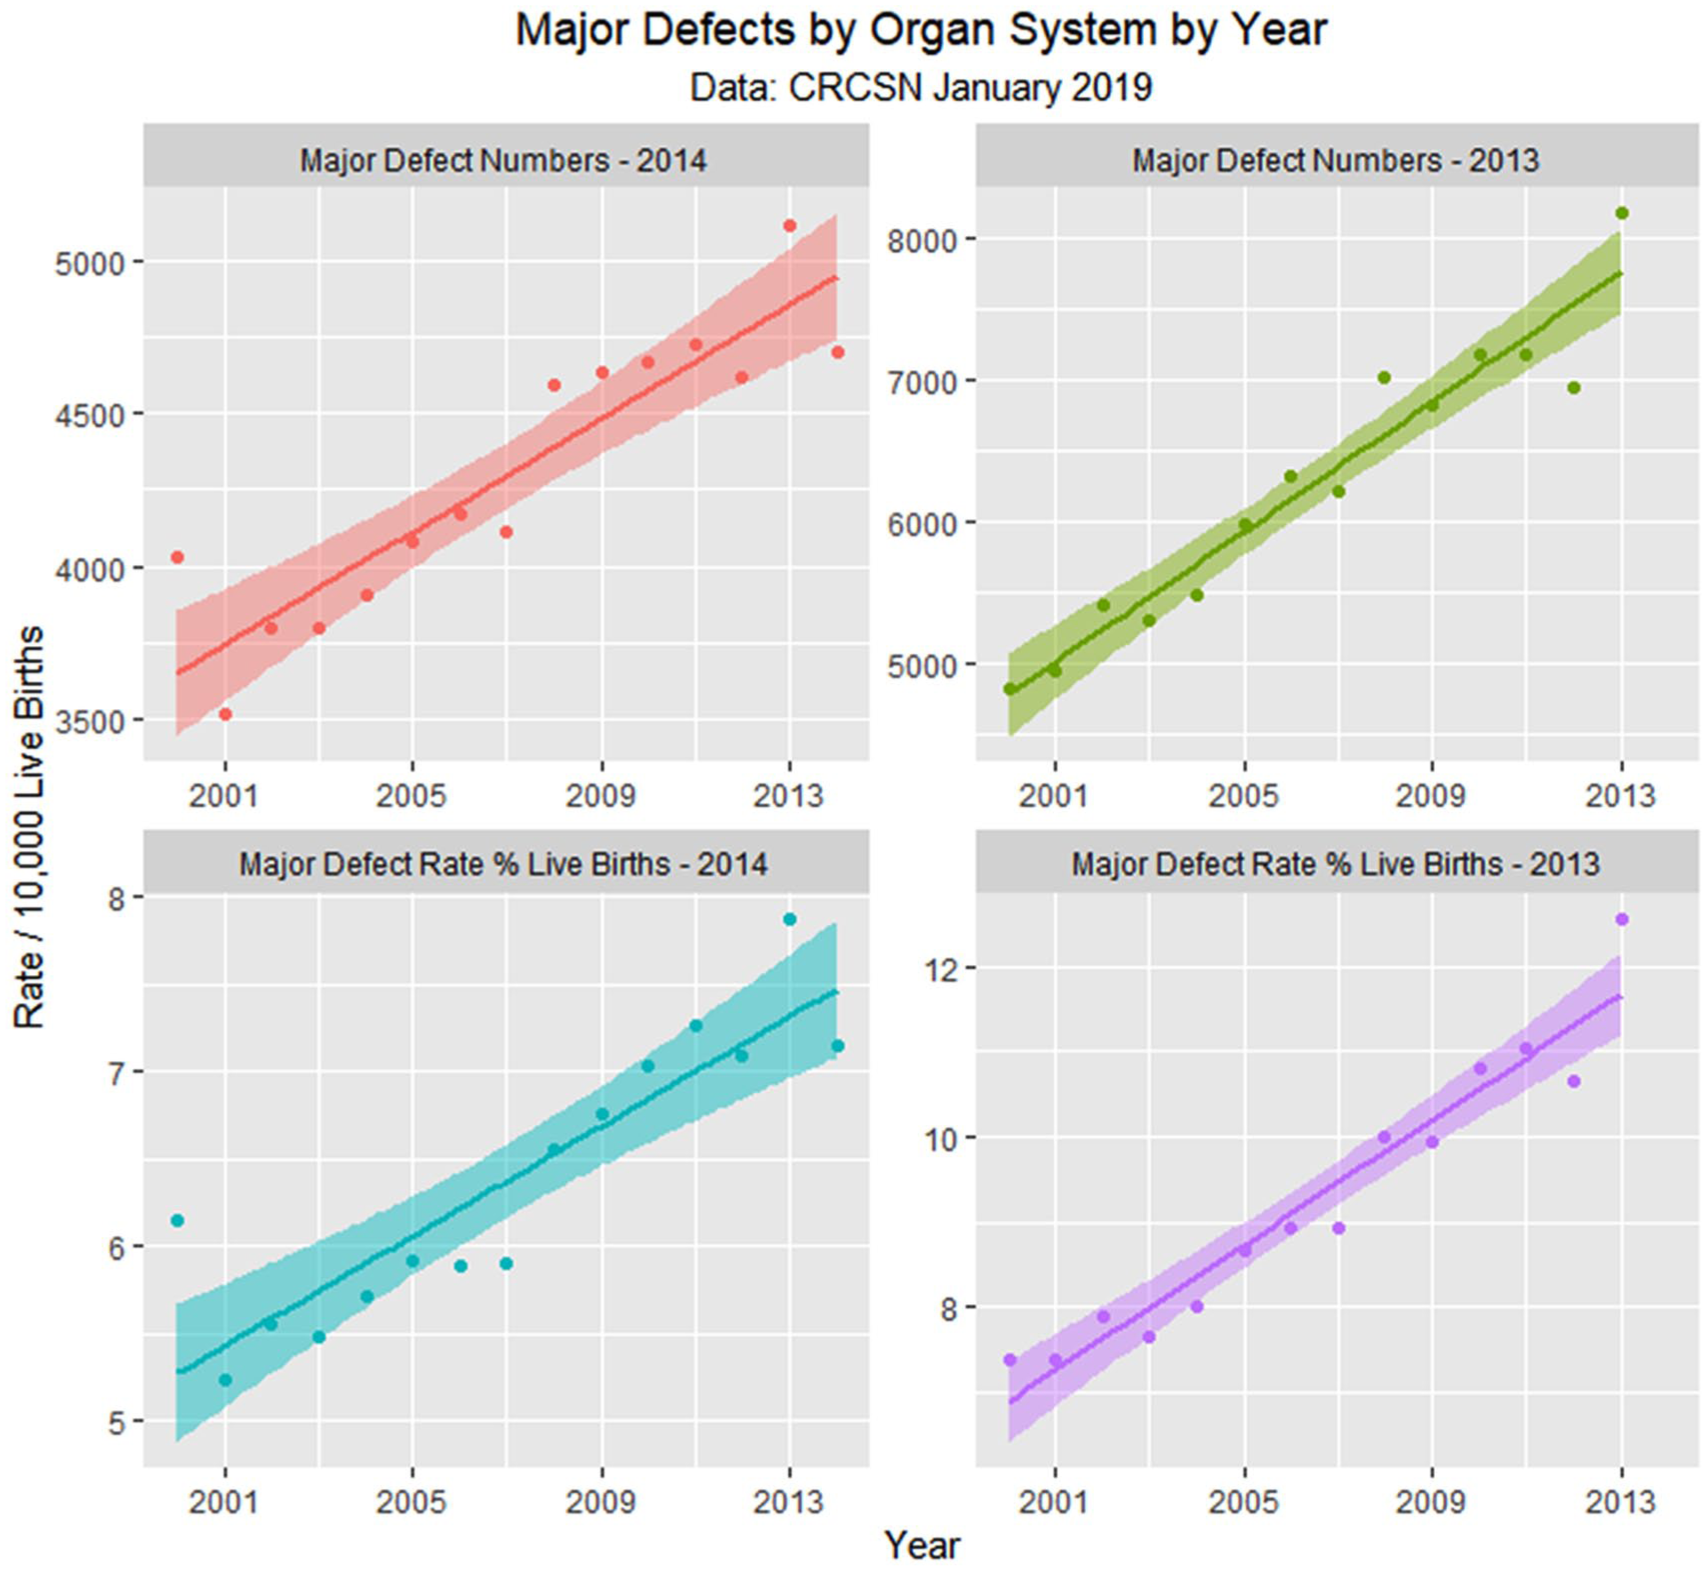
Figure 10 shows the numbers of defects as a total number and as a percentage of live born babies. The total figure in the April 2018 CRCSN dataset is noted to be substantially higher than that in the January 2019 CRCSN dataset. Figure 11 shows the relative rise from baseline of the various categories with the origin of each dataset forming the baseline comparator for that group.
Total defects by time.
Relative rises in selected defects compared with baseline by time.
Supplementary Table 1 (available online) shows the summaries of regression models for these major defects and defect classes. Table 3 lists the number of cases in each group by year, sums the total, compares it with the calculated total based on 15 times (2000:2014) the lowest rate in either 2000 or 2001, calculates the absolute and relative case excess, and compares it with the rise in births from 2000 to 2014 of 3.3069%. These relative case excesses are then graphed in order in Figure 12.
Case Excess.
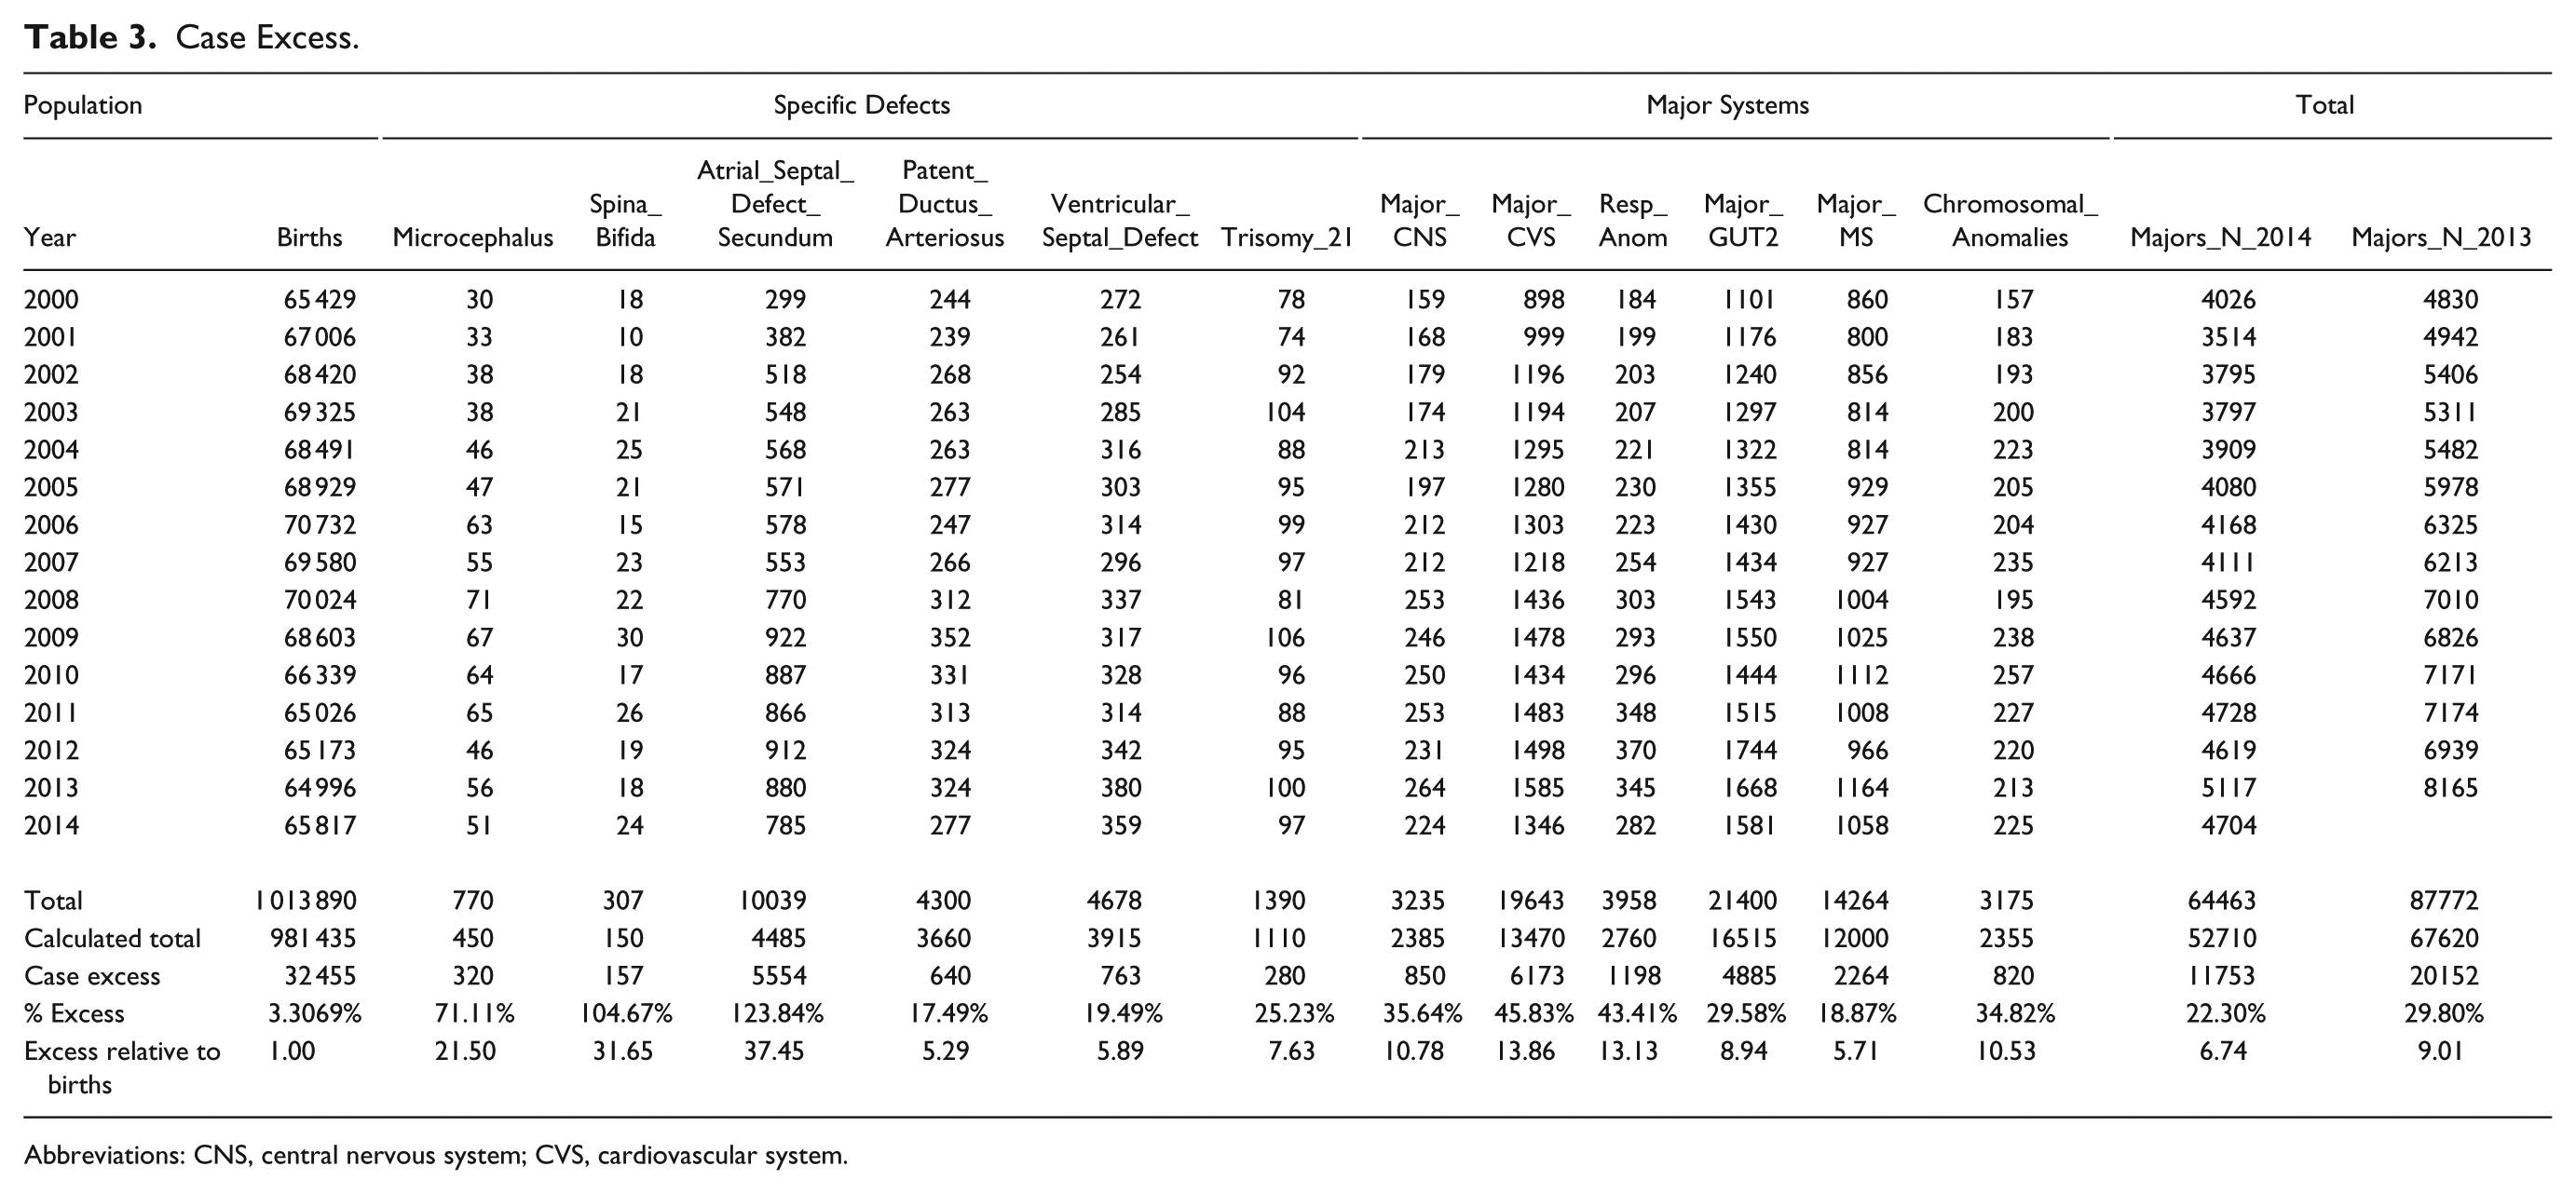
Abbreviations: CNS, central nervous system; CVS, cardiovascular system.
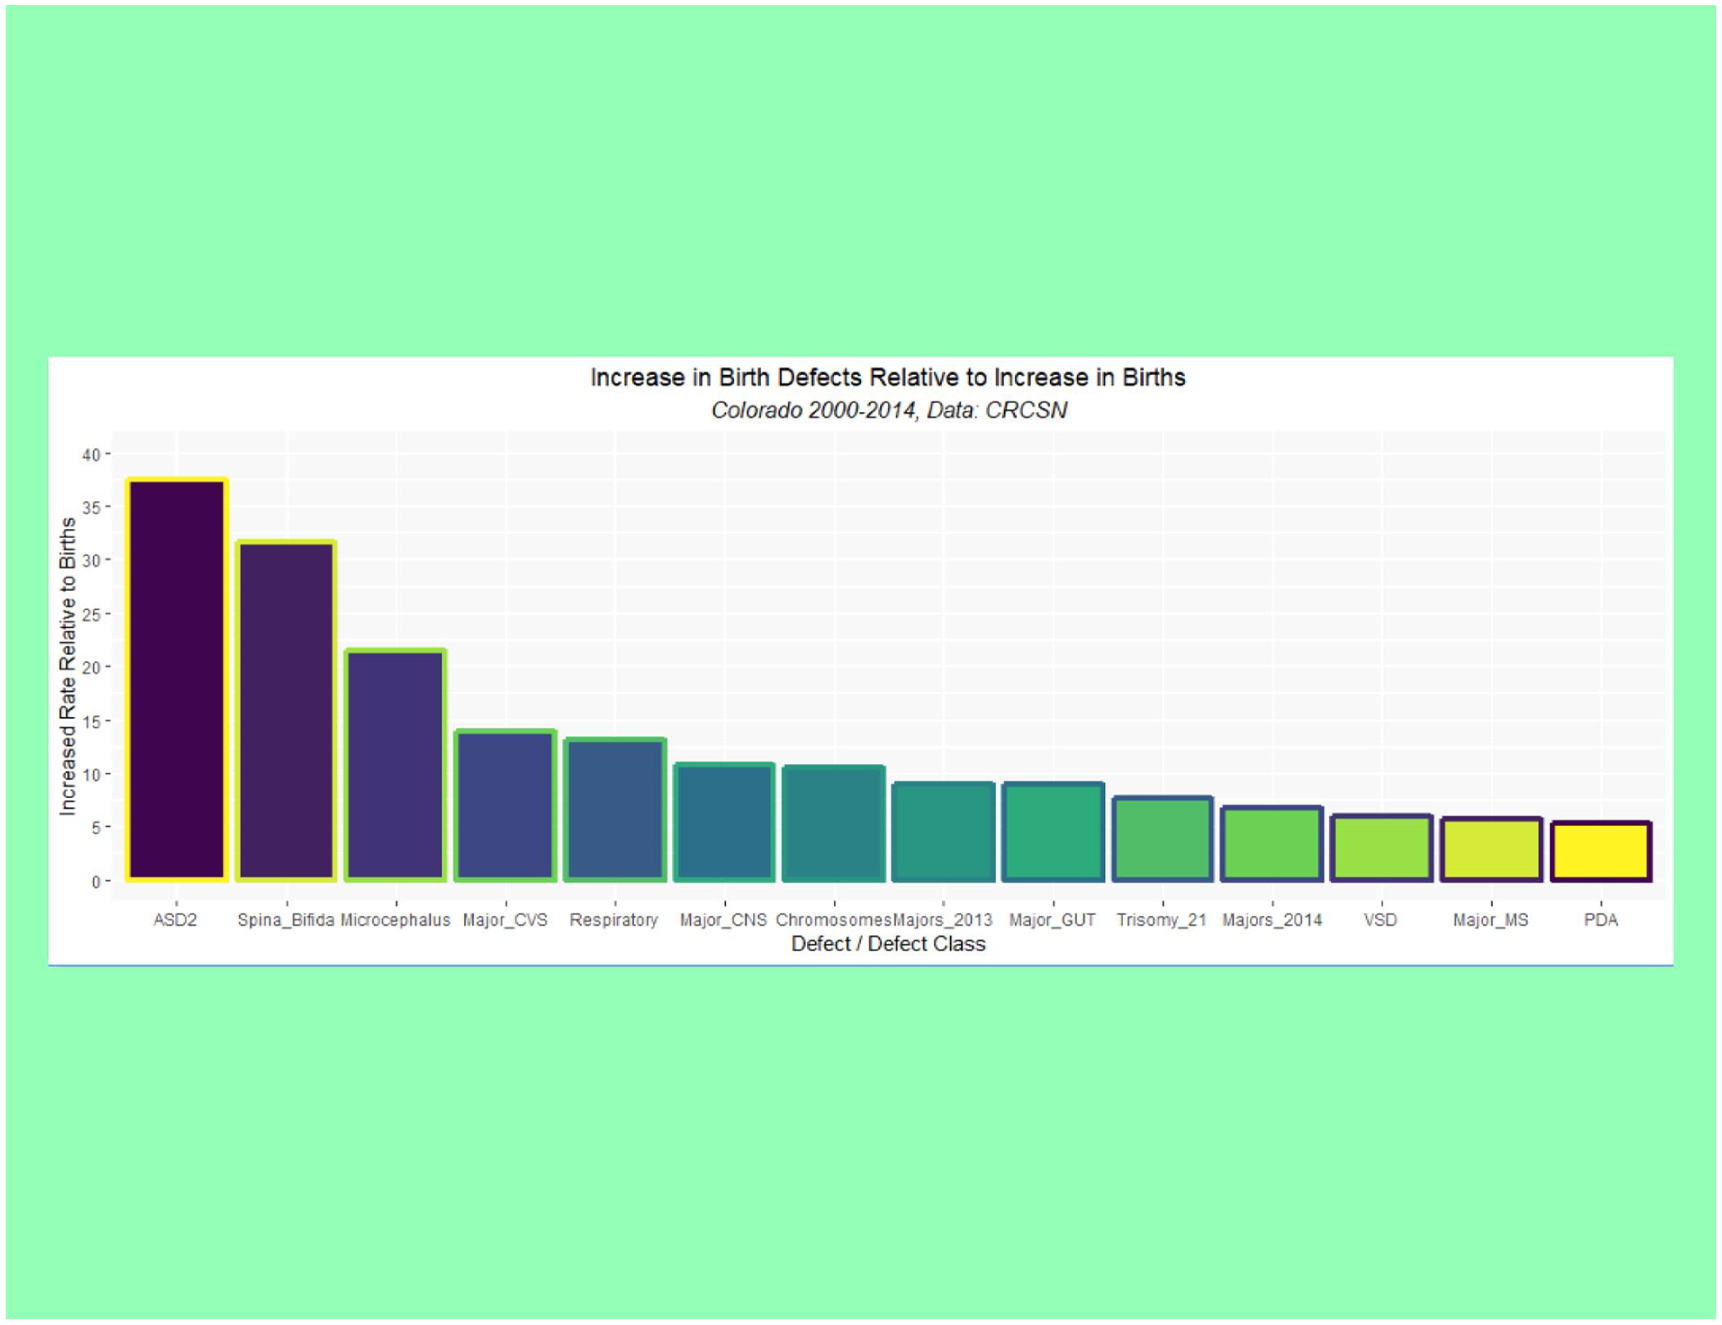
Rise in selected defects relative to rise in births by time.
En passant one notes that the rate of rise of the 2 common cardiac defects ASD (secundum type) and patent ductus arteriosus (PDA) appears to rise sigmoidally across this time period of the cannabis legalization process (Figure 13). One notes that the quartic model accounts for the time-dependent variance significantly better than the linear model for both ASD (ANOVA F = 6.6319, degrees of freedom [df] = 3, P = .0096) and PDA (ANOVA F = 5.413, df = 3, P = .018).
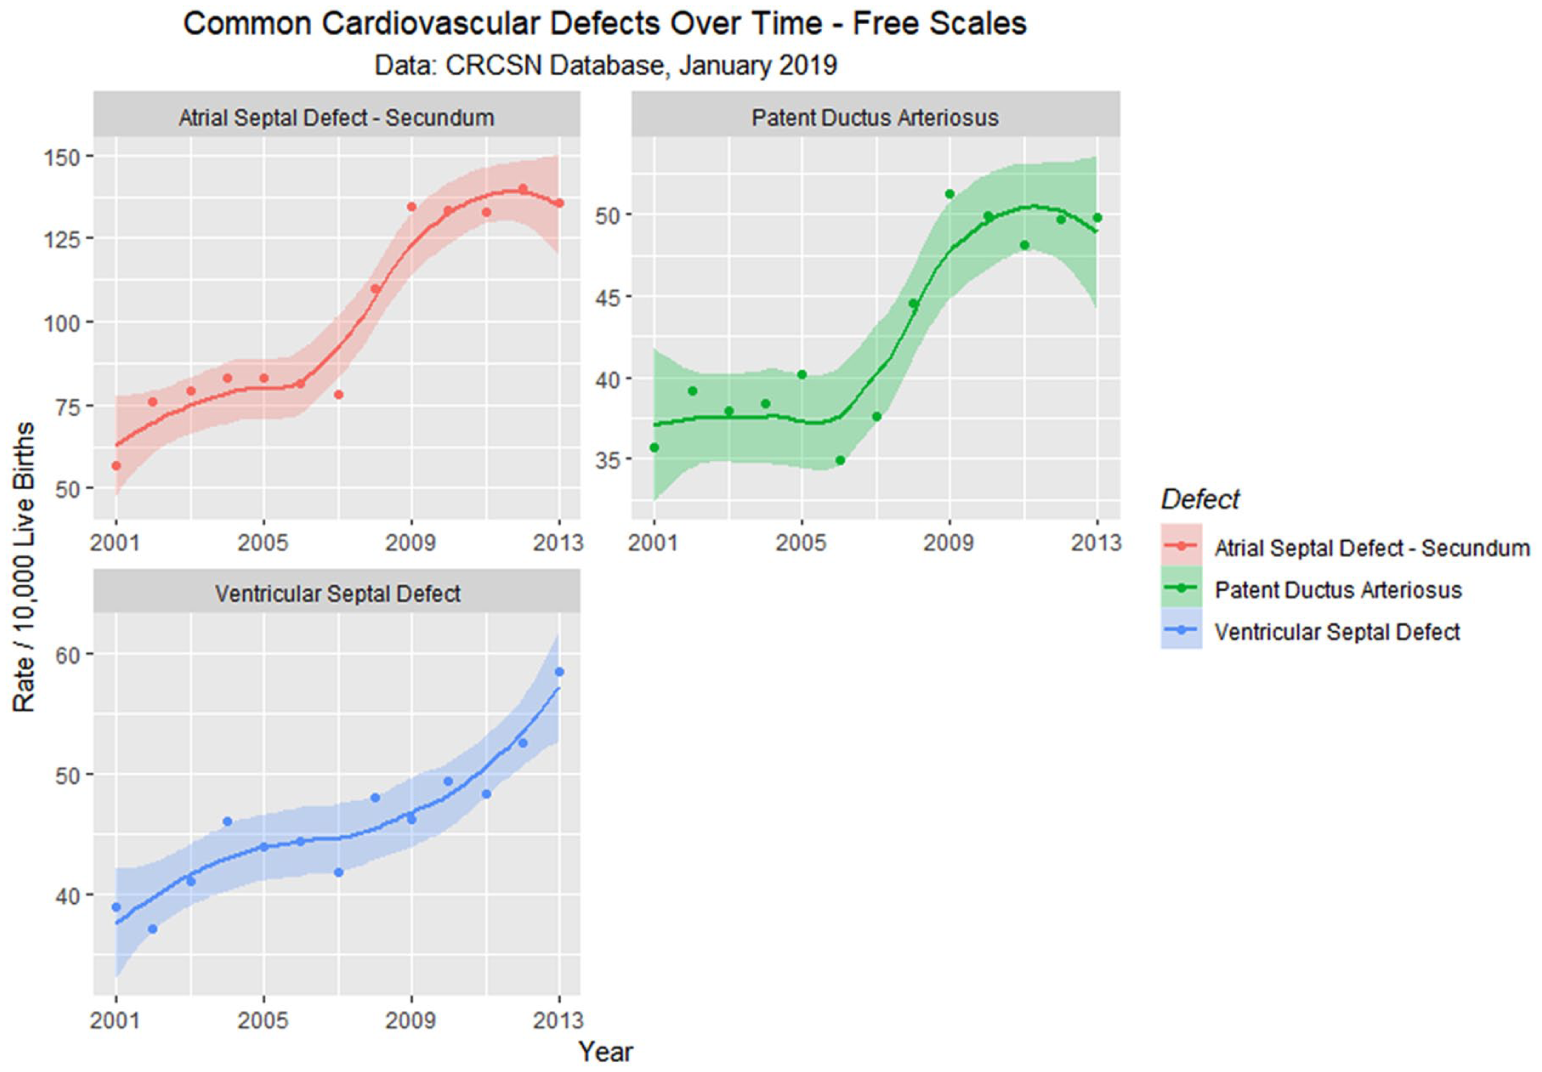
Atrial septal defect, ventricular septal defect, and patent ductus arteriosus—Loess curves by time.
Since both the American Academy of Pediatrics and the American College of Obstetricians and Gynecologists concur that drug use in the peripartum period is harmful to the fetus,16,17 it is reasonable to consider the potential role of drug use by the parents in a possible epidemiological association with this overall increasing defect profile.
Drug use in Colorado is presented from the SAMHSA NSDUH data as least squares regression lines in Figure 14, and the slopes of these lines are summarized in Table 4. Only the slopes of the cannabis curves are seen to be rising; the slopes of the tobacco, cigarette, cocaine, and pain reliever curves are falling significantly.
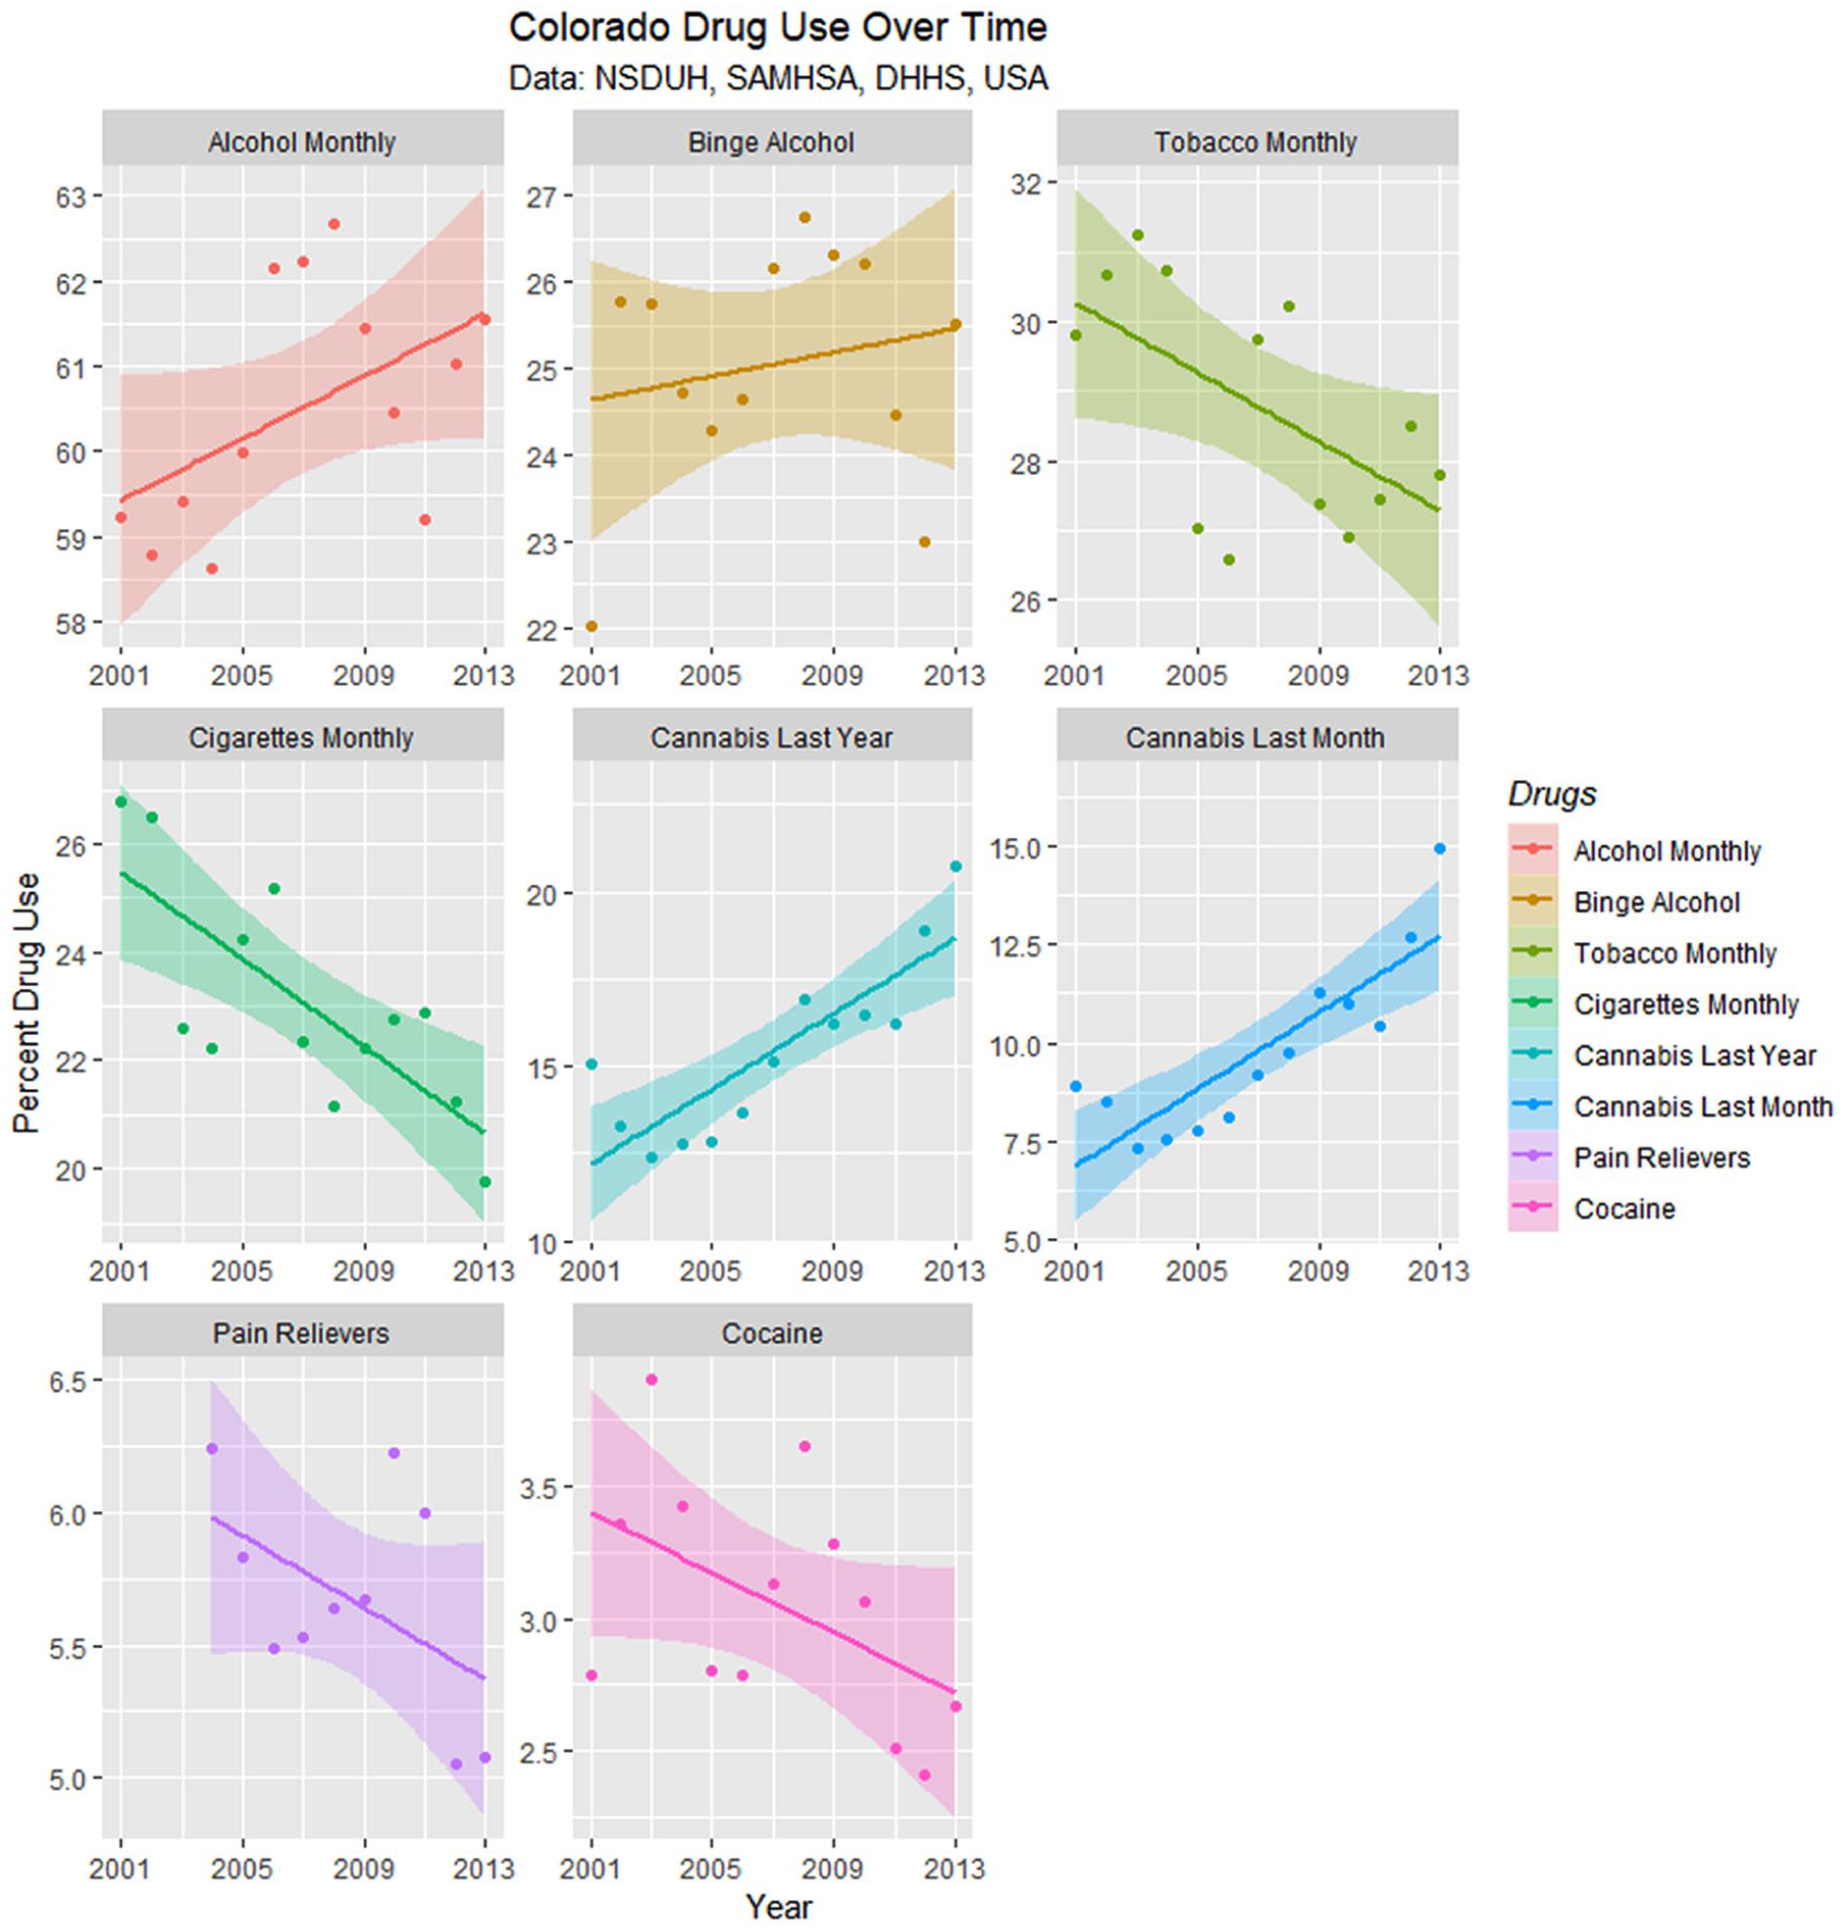
Drug use in Colorado from National Survey of Drug Use and Health (NSDUH) dataset by time with regression lines fitted.
Regression Slope Trend Estimates for Drug Use—NSDUH.
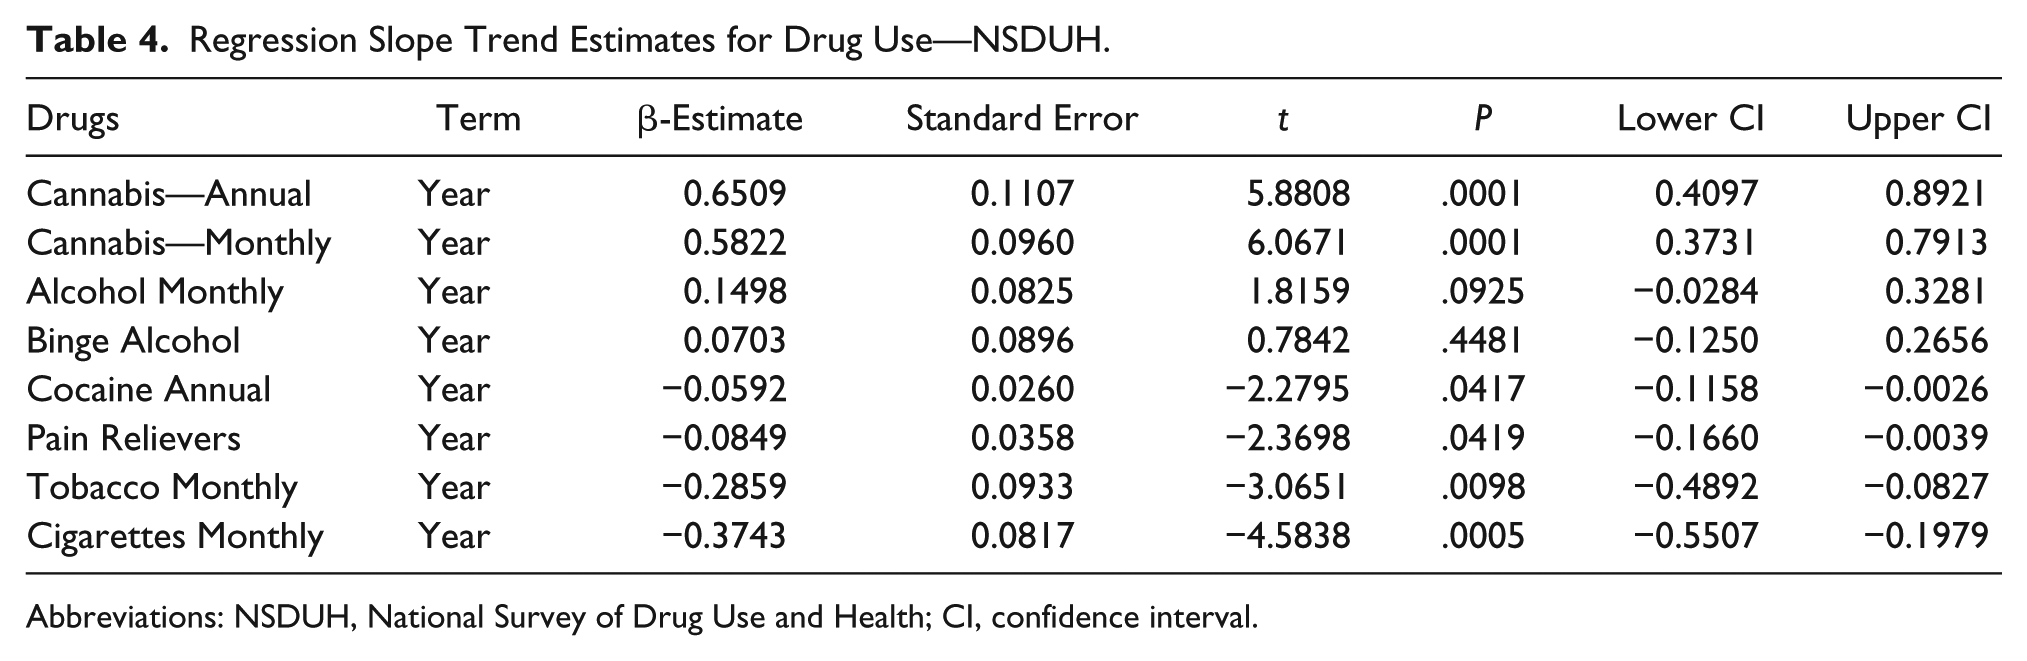
Abbreviations: NSDUH, National Survey of Drug Use and Health; CI, confidence interval.
Figure 15 presents these drug use data with loess curves. Formal testing for change of regression slope for monthly cannabis use showed a significant change in 2007 from .0293 to .11917 (Davies test, k = 3, P = .0002).
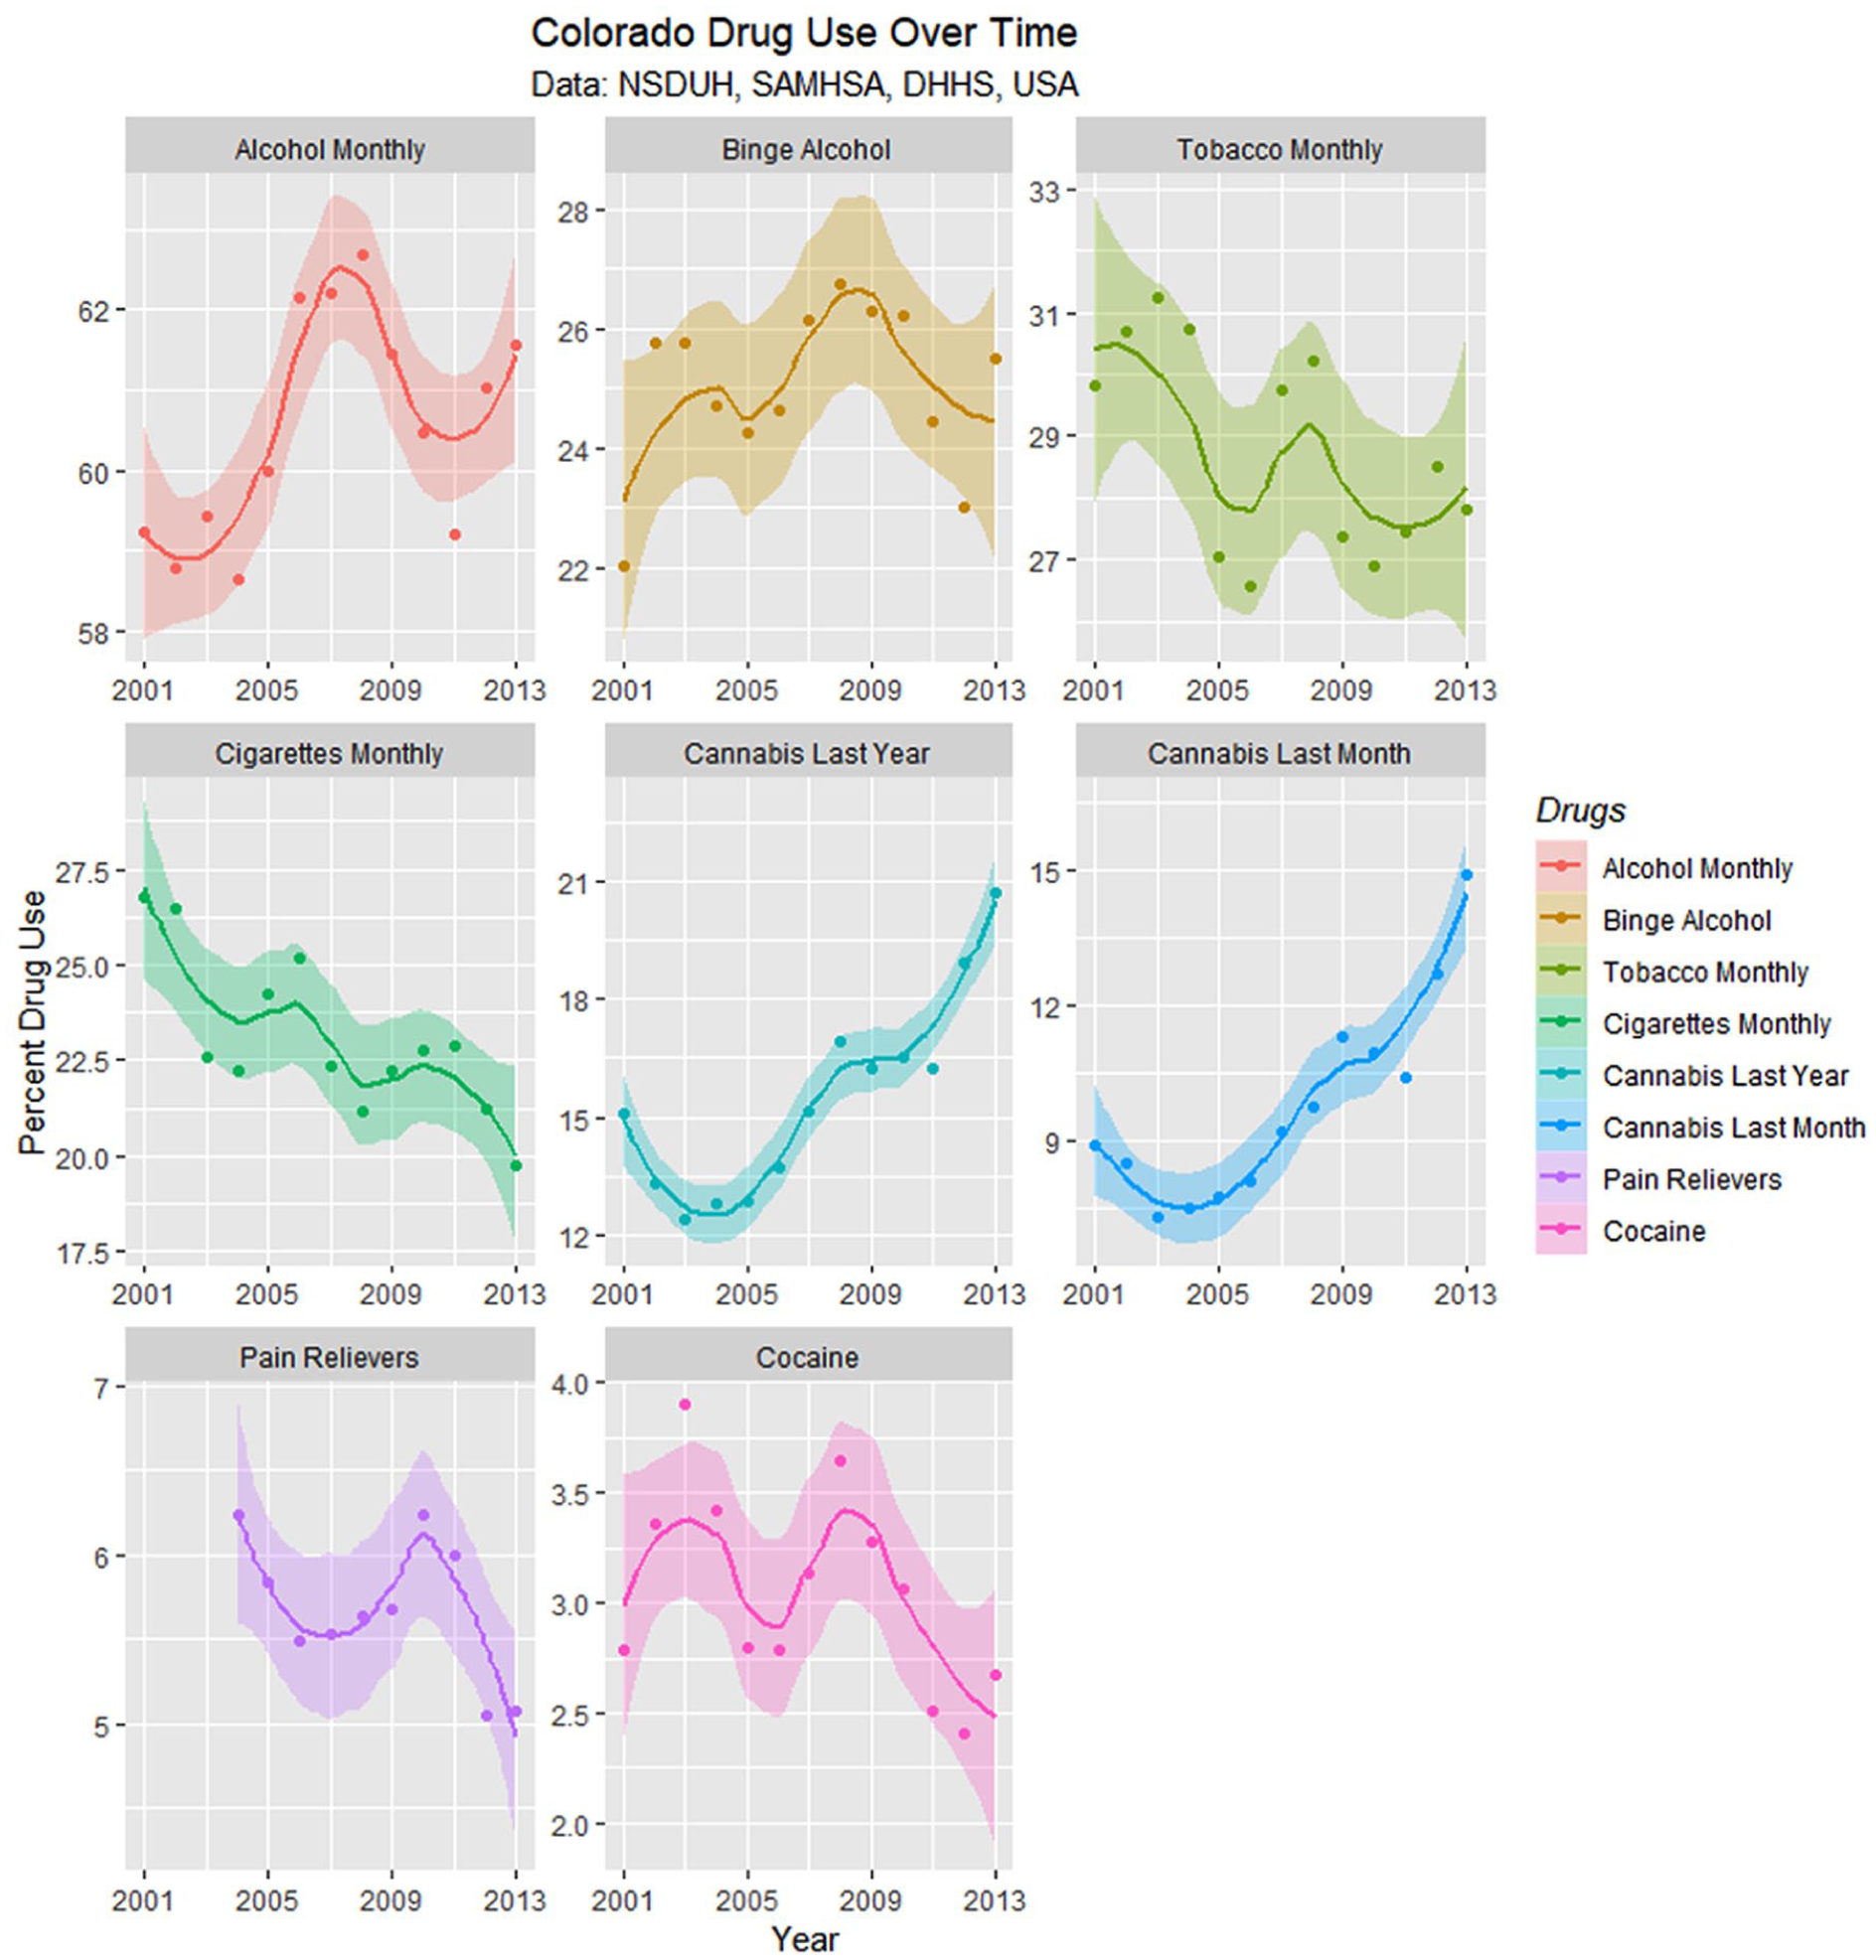
Drug use in Colorado from National Survey of Drug Use and Health (NSDUH) dataset by time with loess curves fitted.
Monthly cannabinoid exposure was calculated by multiplying the concentration of Federal cannabis seizures by within-state monthly cannabis use. These data are presented as regression lines and loess curves in Figures 16 and 17.
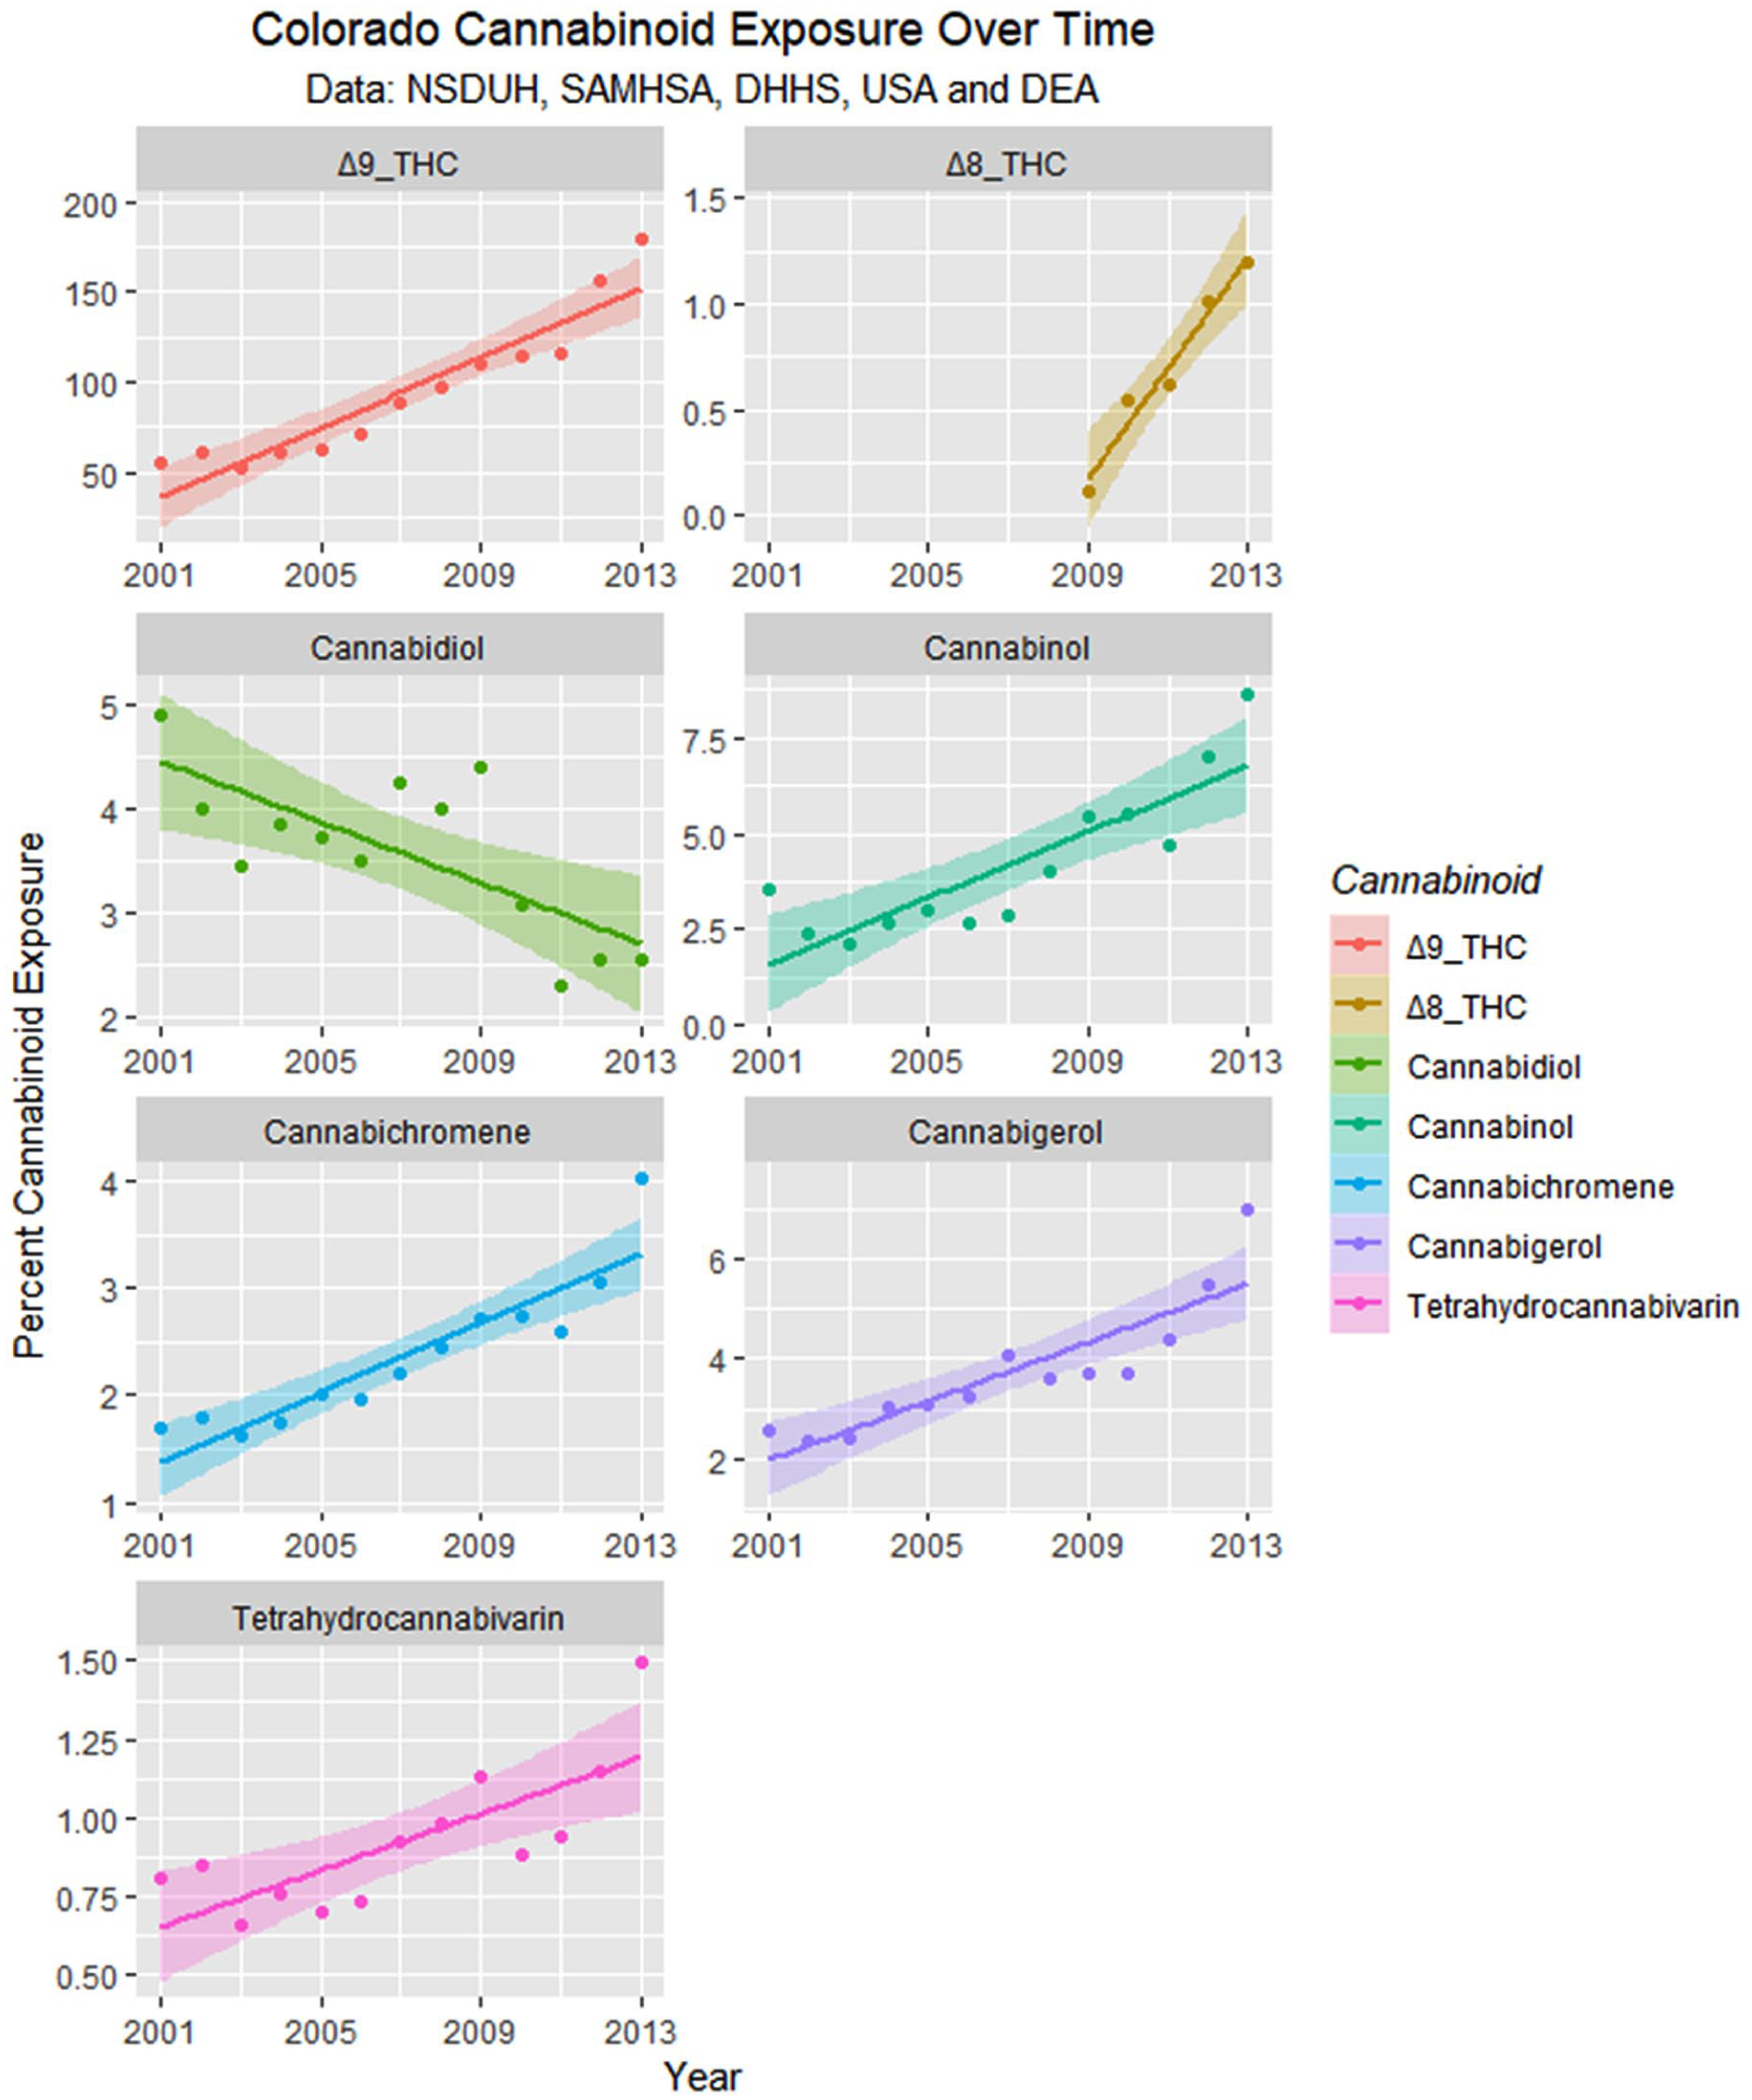
Cannabinoid exposure in Colorado from National Survey of Drug Use and Health (NSDUH) dataset by time with regression lines fitted.
Cannabinoid exposure in Colorado from National Survey of Drug Use and Health (NSDUH) dataset by time with loess curves fitted.
Because many of the 49 defects had different quantitative rates, they were scaled to mean of 0 and standard deviation of 1 using the “scales” package. The time-dependent plots shown in Figure 18 were obtained.
Scaled drug use in Colorado from National Survey of Drug Use and Health dataset by time with loess curves fitted.
A similar exercise was conducted, illustrated in Figure 19, which charts the scaled defect rate as a linear temporal function of the various drug exposures. Increasing levels of binge alcohol, cocaine, cannabis, and pain relievers are all noted to be linked to higher rates of congenital defects. These relationships are demonstrated in Table 5. One notes that the quartic model for cannabis has a higher F value and lower model P value than that for opioid pain relievers (7.83 vs 4.422 and 3.5 × 10⁻⁷ vs 3.4 × 10⁻⁵).
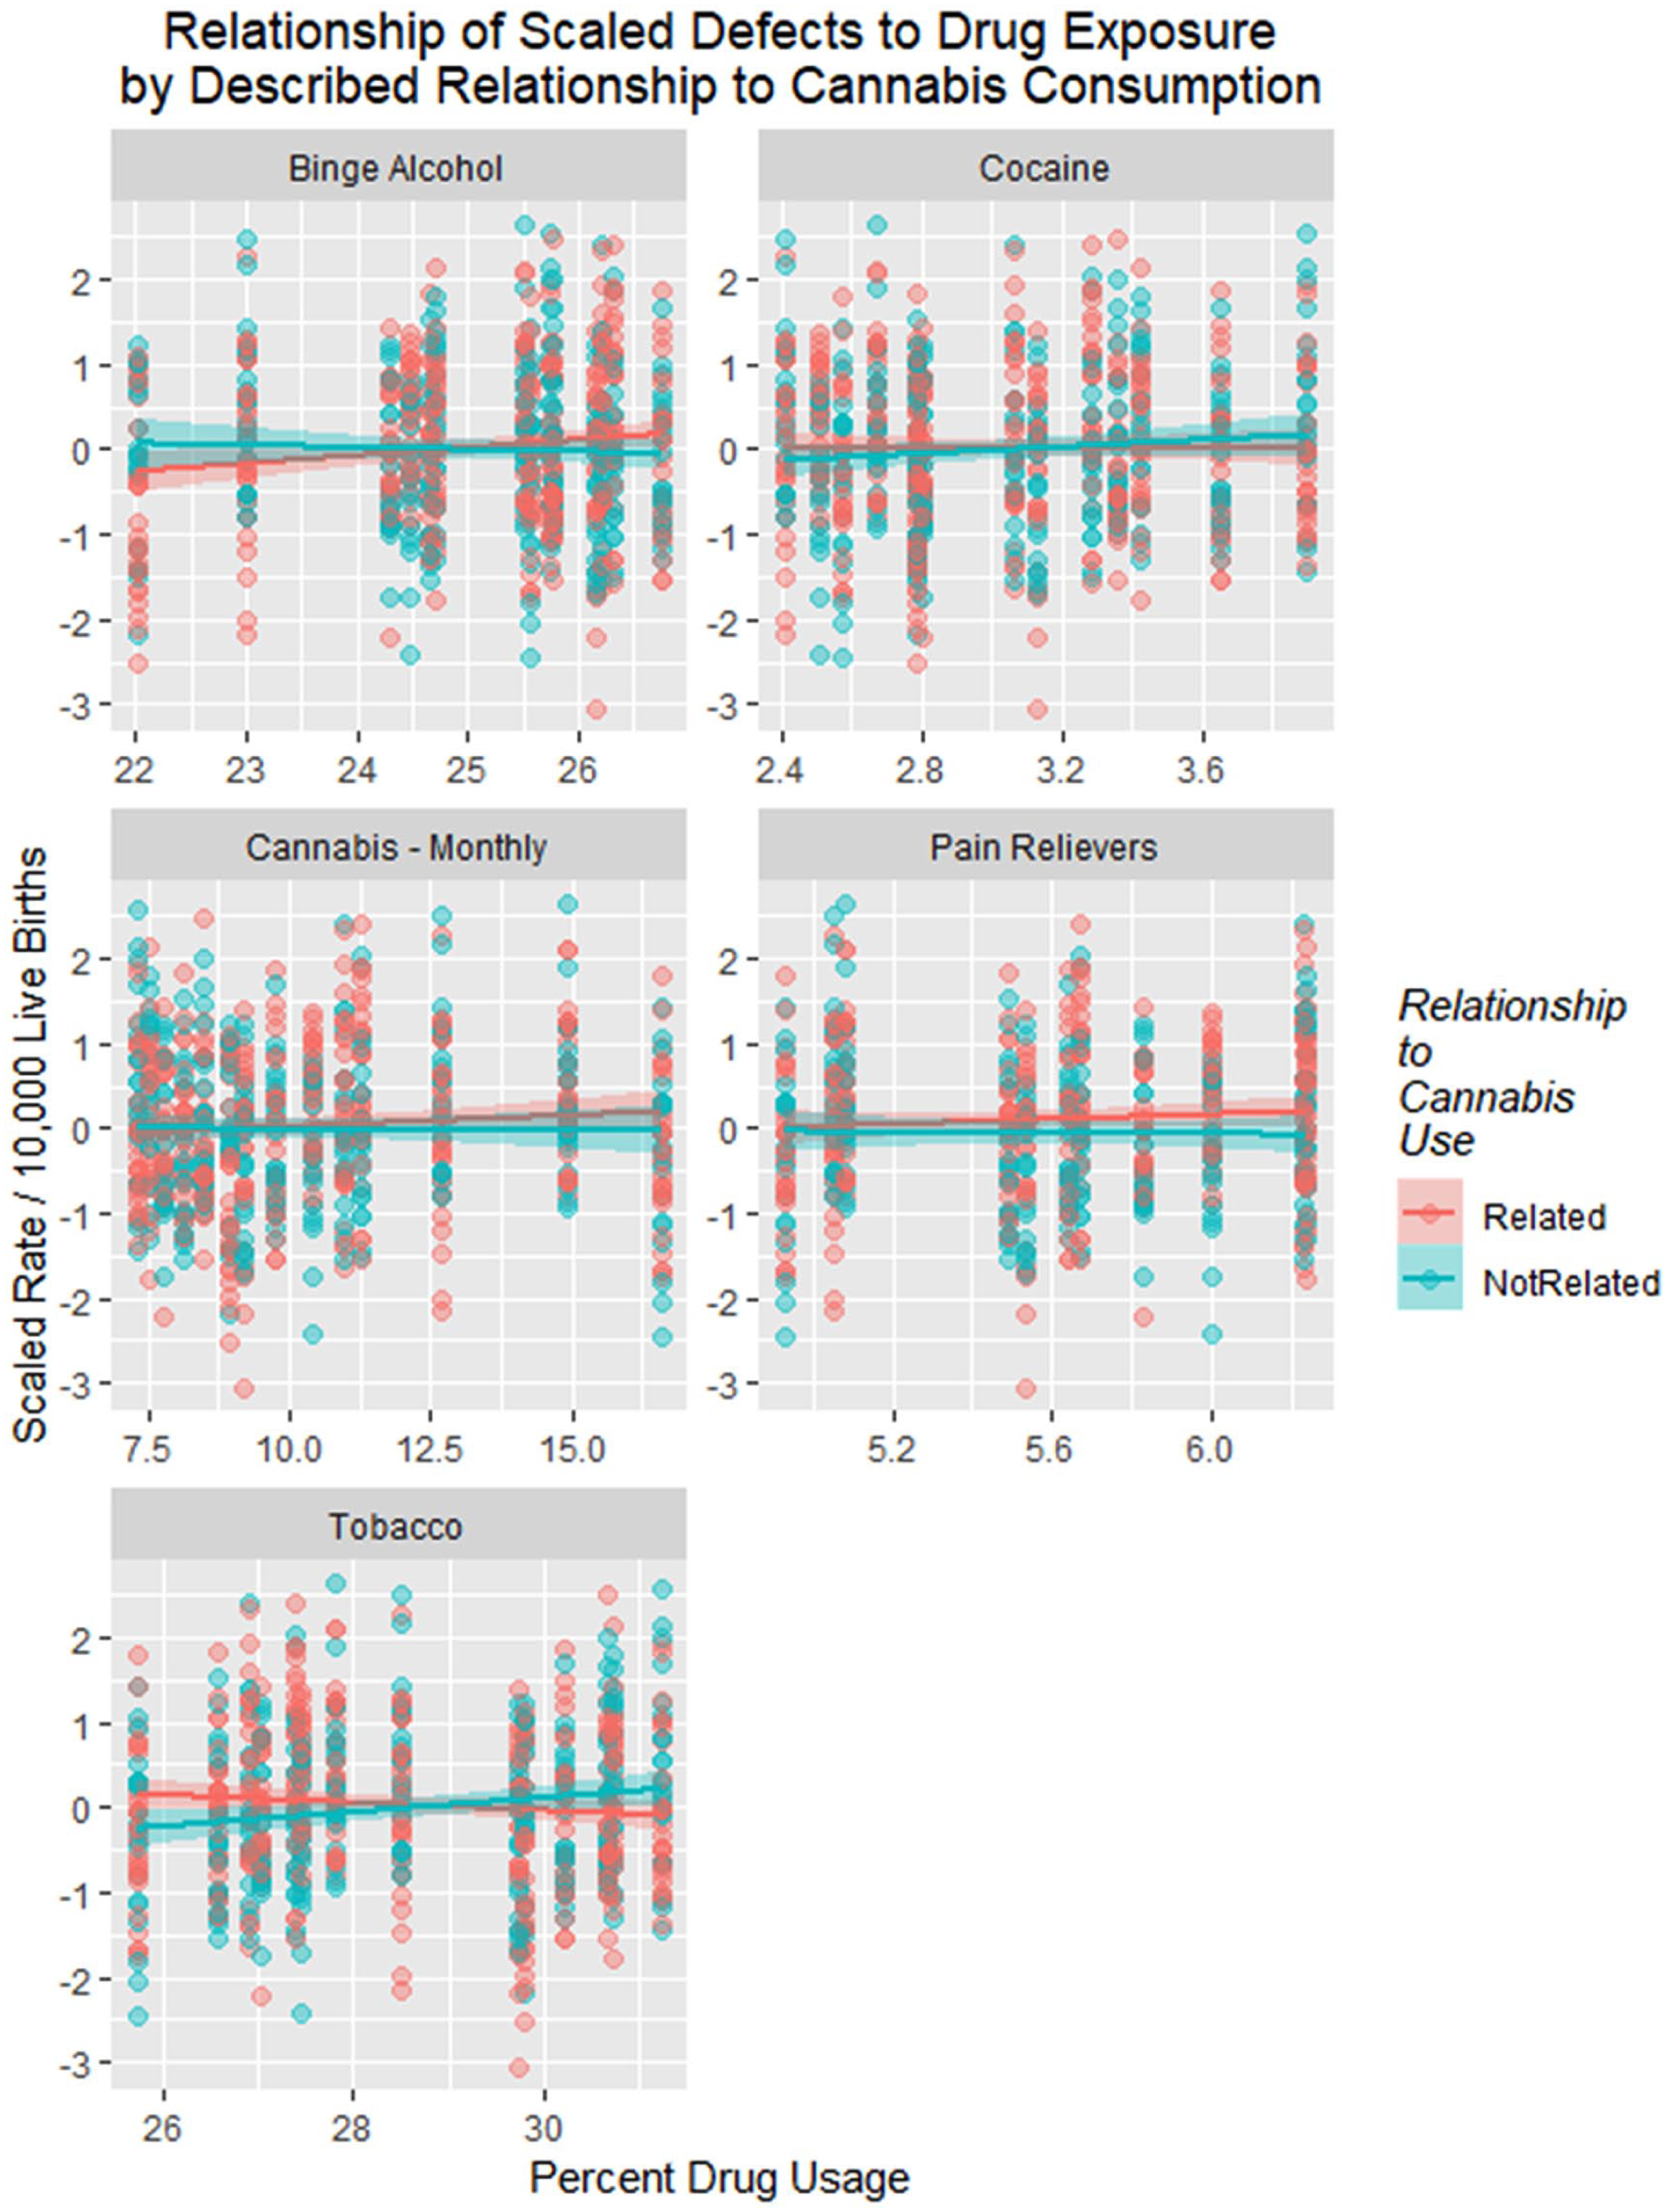
Scaled drug use in Colorado from National Survey of Drug Use and Health dataset by time with regression lines fitted.
Regression Slopes for All Scaled Defects by Drug Classes.
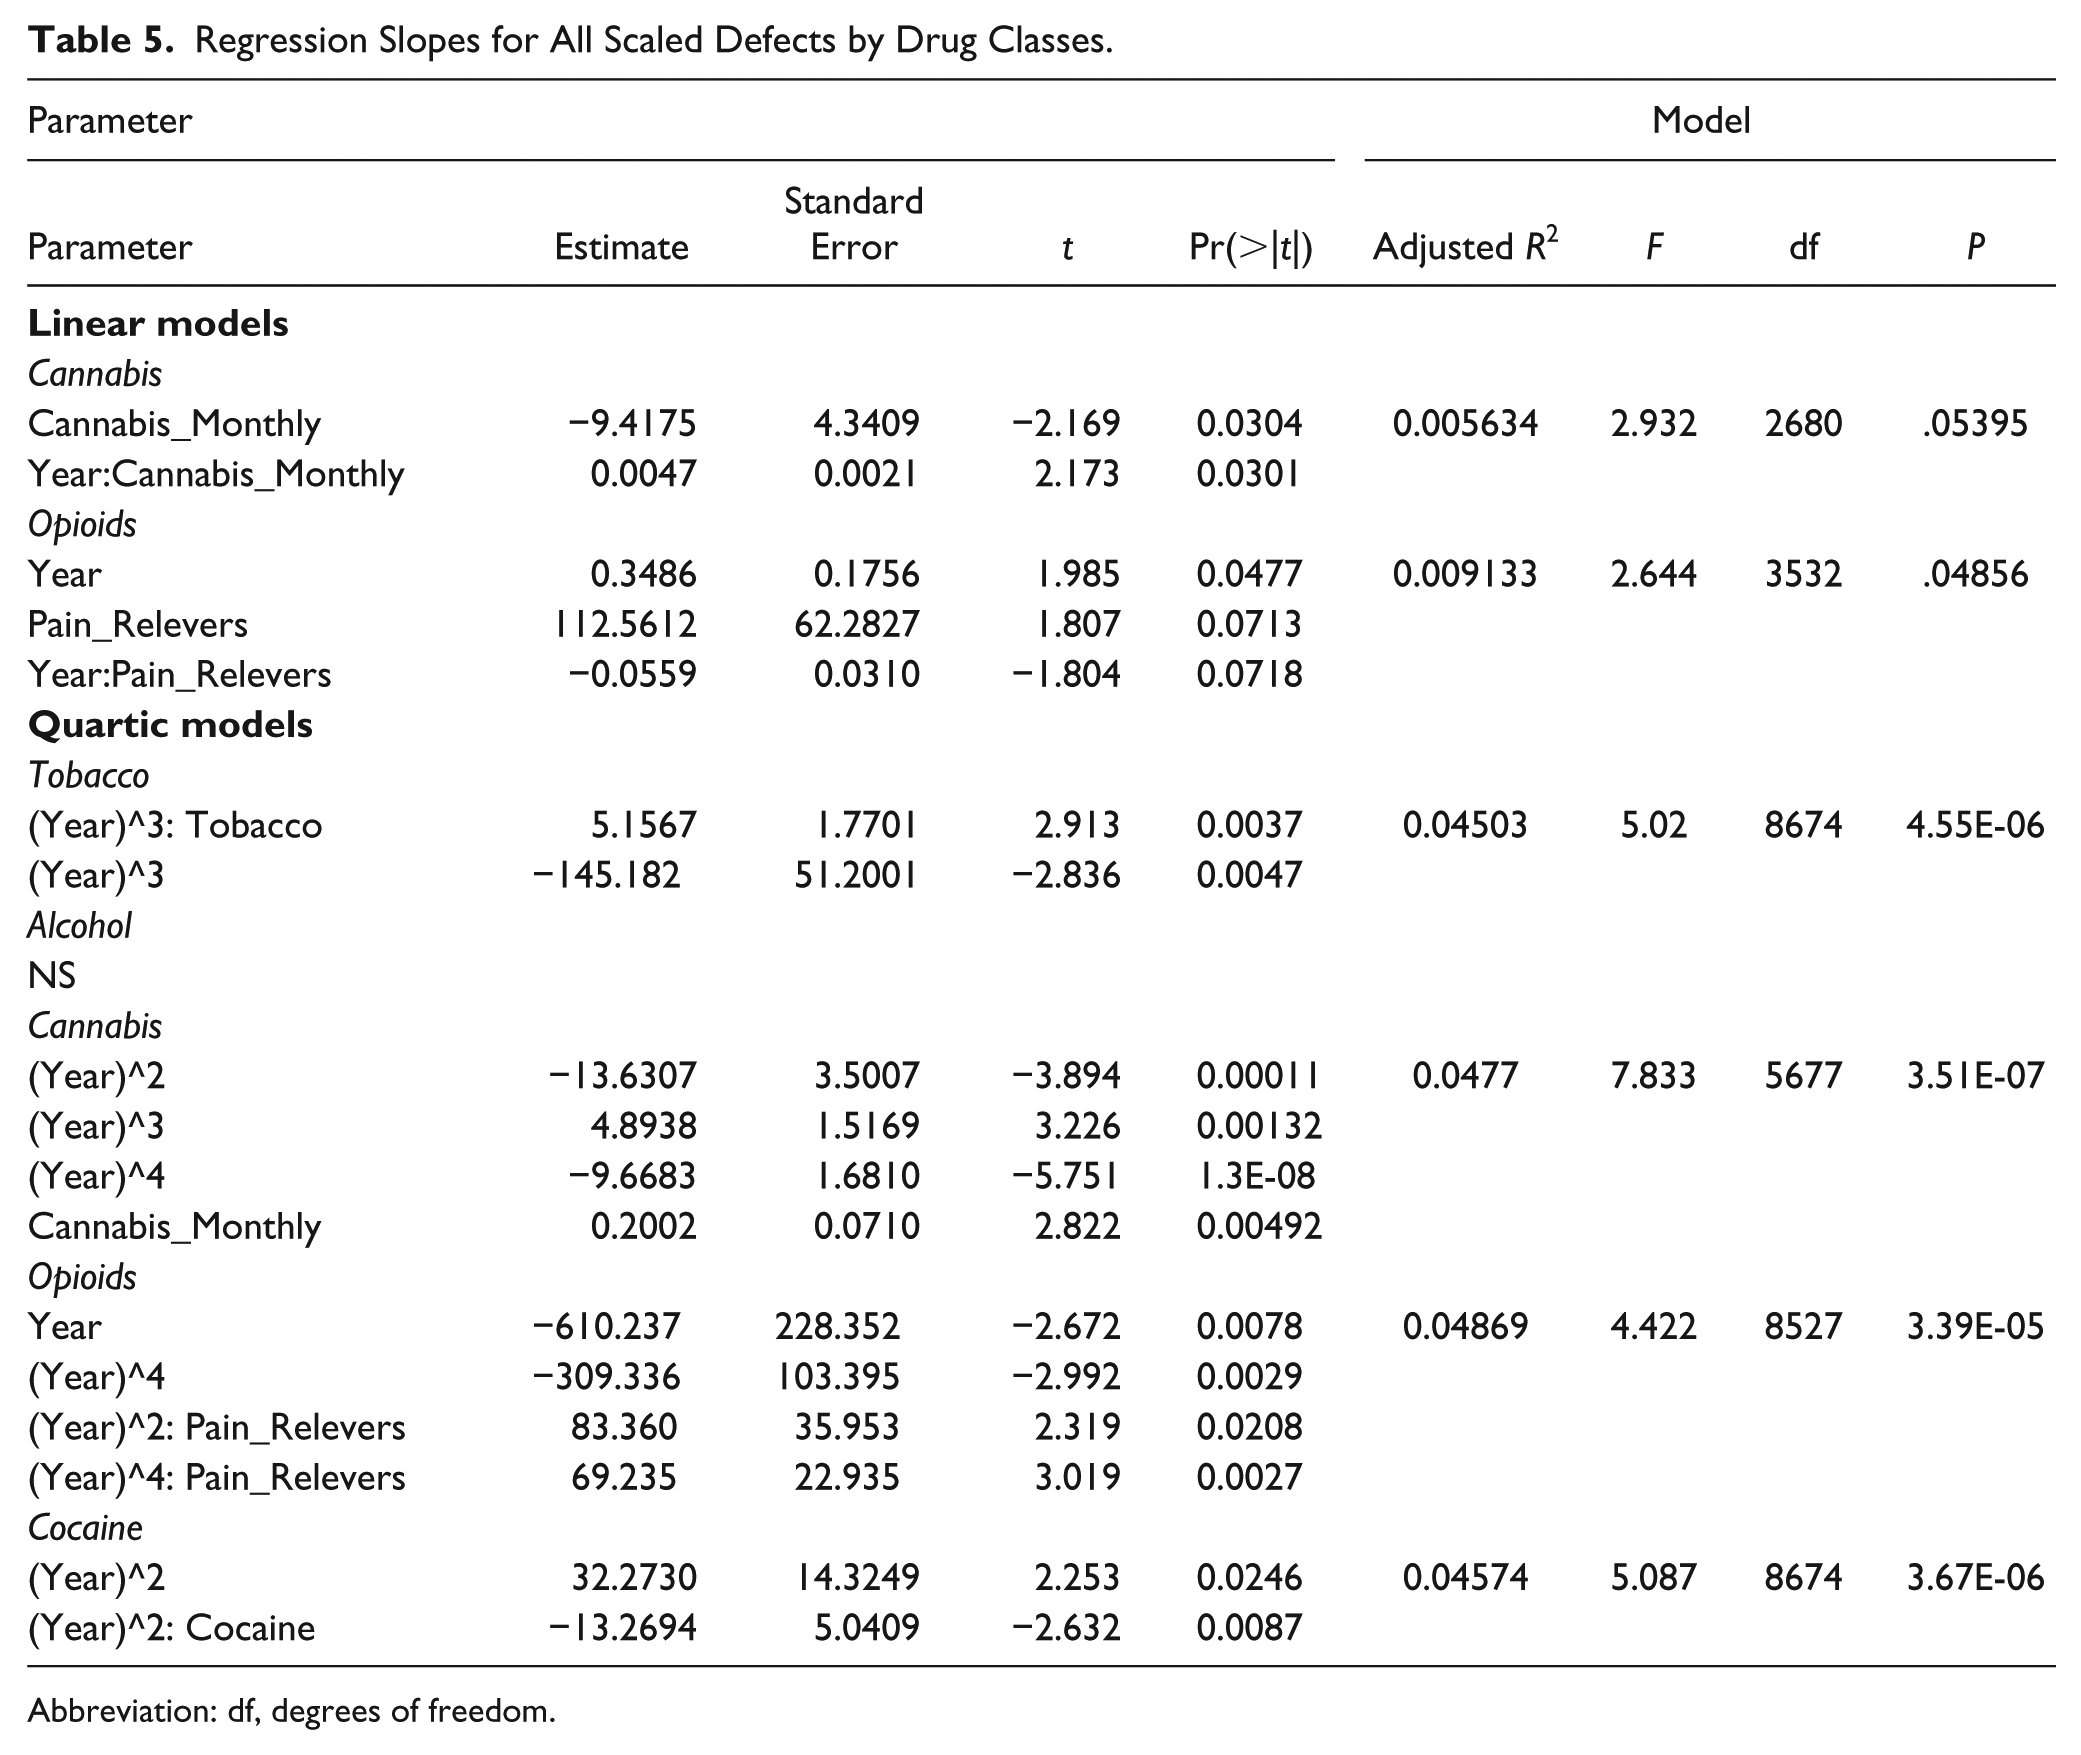
Abbreviation: df, degrees of freedom.
Table 6 compares the defect rates against multiple drug exposure in additive models and increasingly complex interactive mixed-effects models with defect as the random variable. Terms including cannabis exposure persisted in final models.
Regression Slopes for All Scaled Defects Against Various Drugs—Mixed-Effects Models.
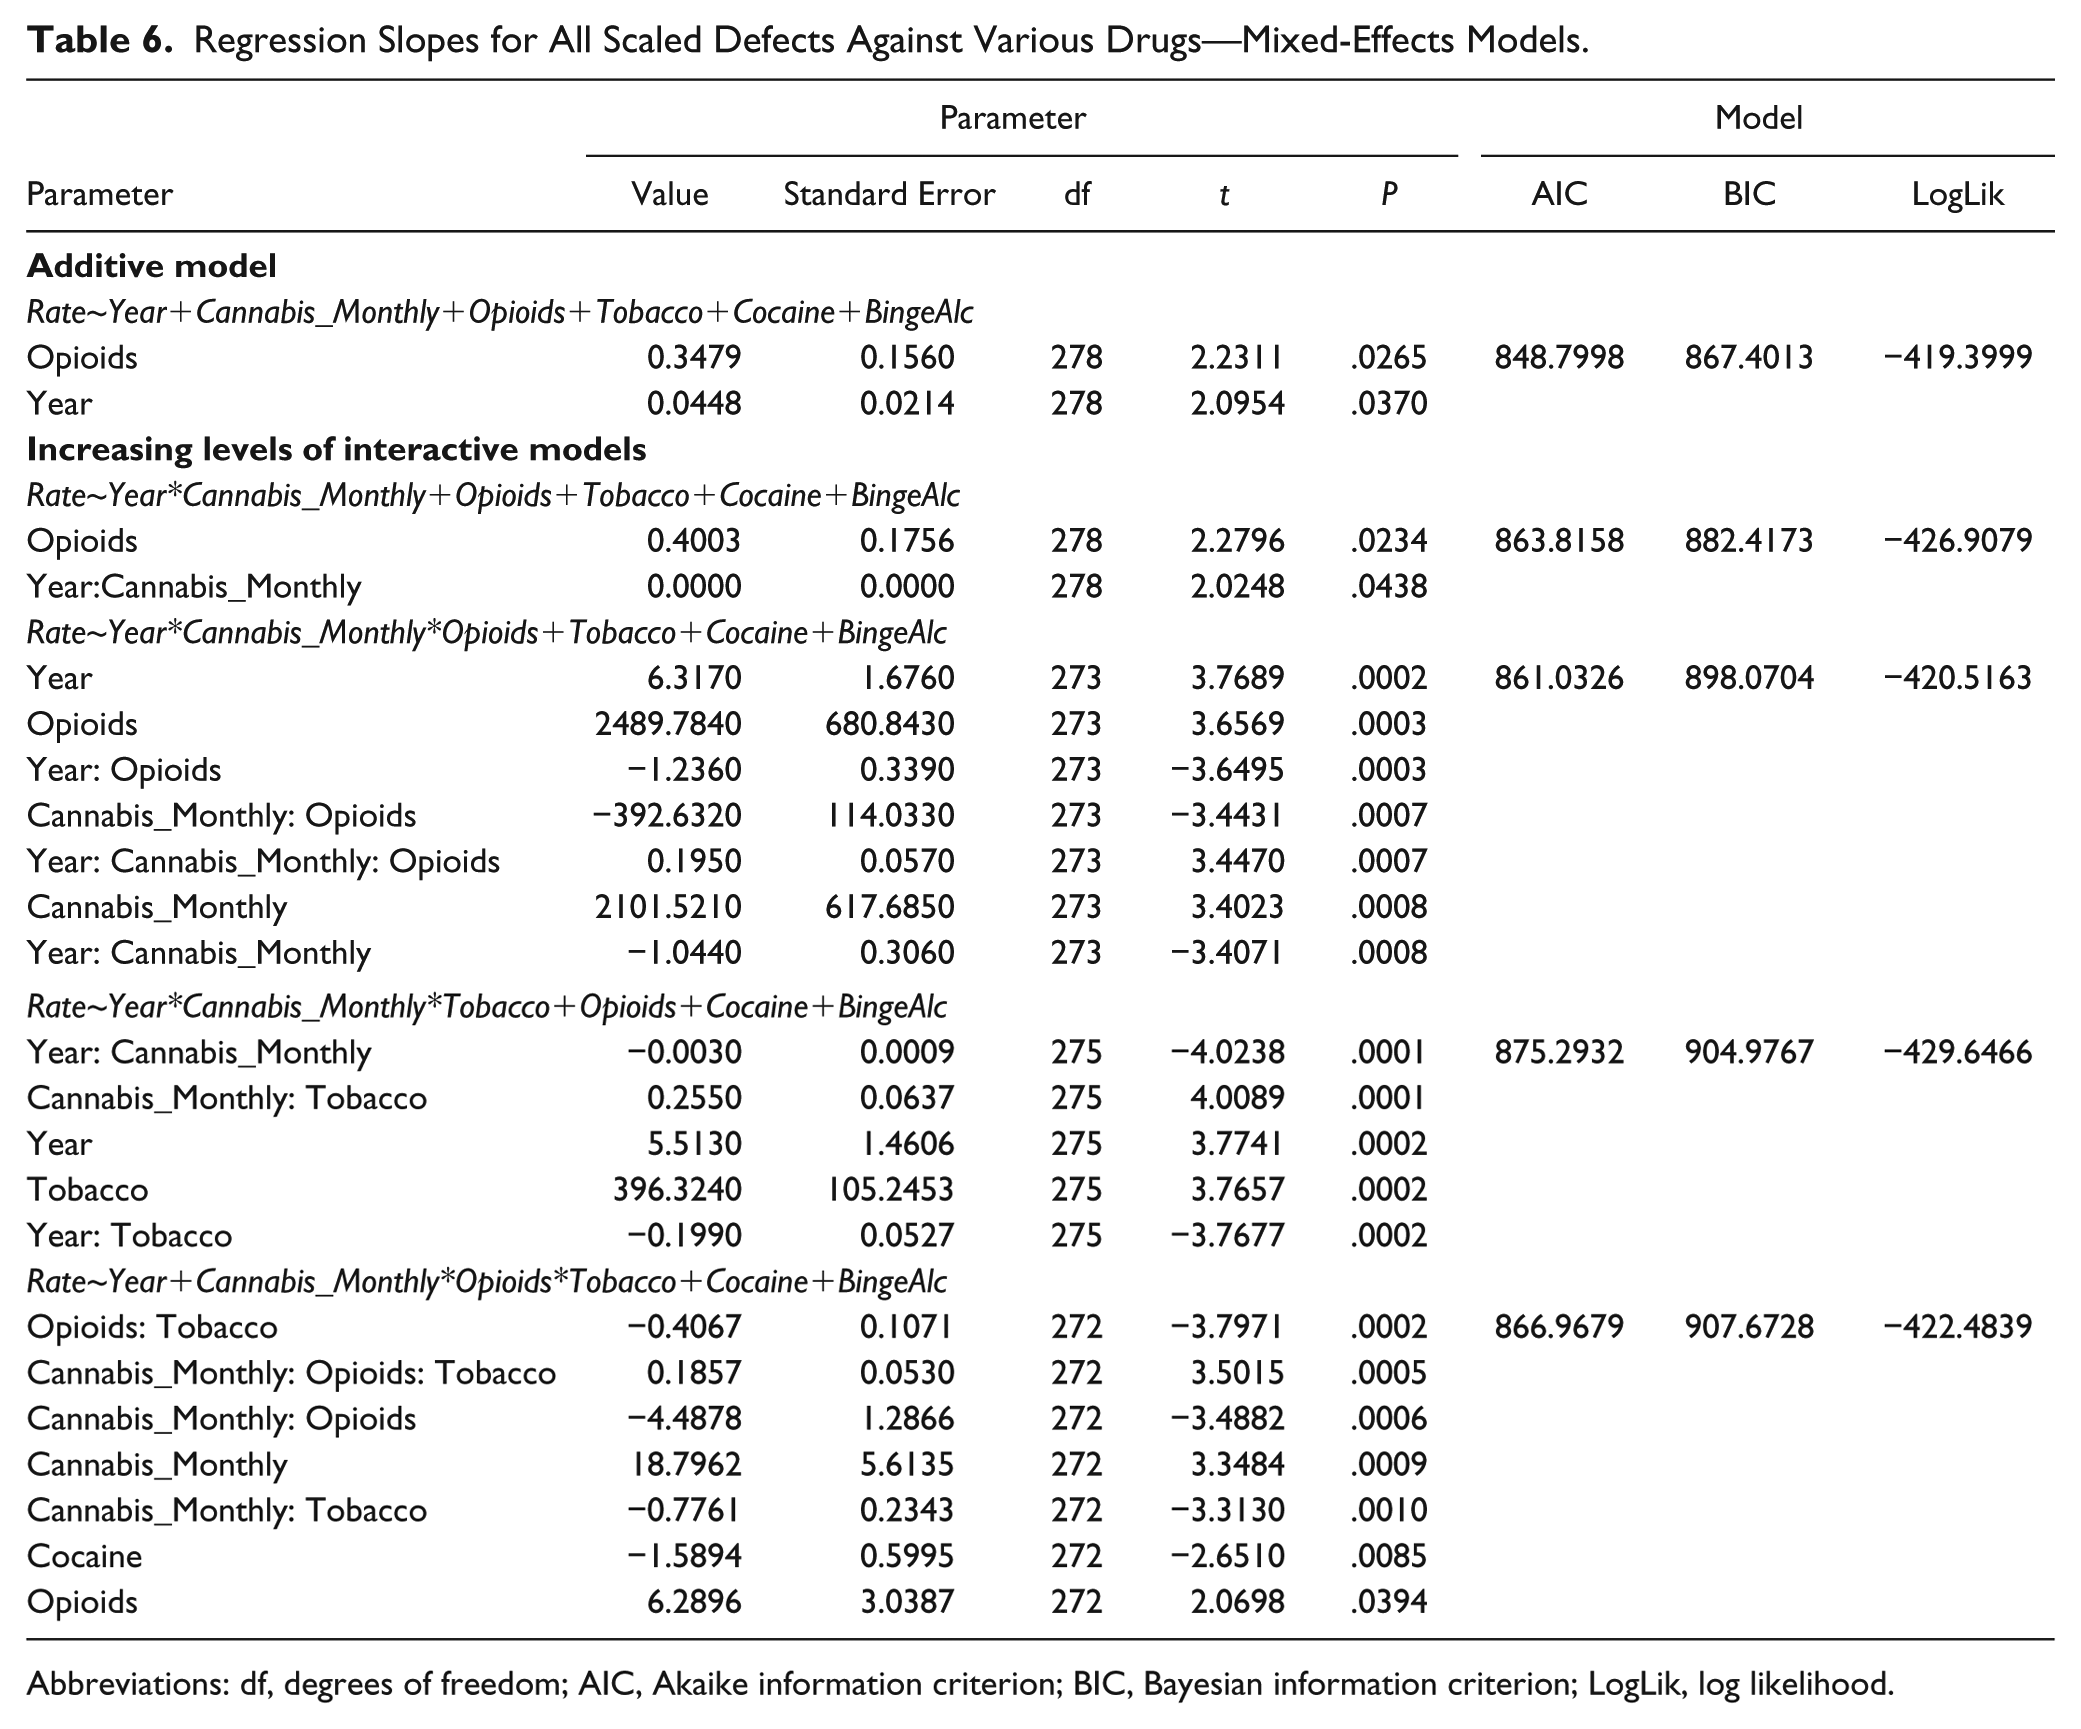
Abbreviations: df, degrees of freedom; AIC, Akaike information criterion; BIC, Bayesian information criterion; LogLik, log likelihood.
As described in Methods, defects were assigned to be either cannabis-related or not based on reports in the published literature. However, as the Hawaiian report of pyloric stenosis being cannabis-linked 15 has not been confirmed elsewhere, this condition was removed from the cannabis-associated group. Moreover, 2 reports from CDC/NBDPN indicate that PCE is linked with anencephaly.12,13 Several drugs linked with anencephaly are similarly linked with spina bifida, which is accepted to be a prototypical neural tube closure defect so that it seems likely that cannabis may also be linked with spina bifida with or without anencephaly. Graphs showing the effect of these 2 adjustments are included as Supplementary Figures 3 to 6 (available online).
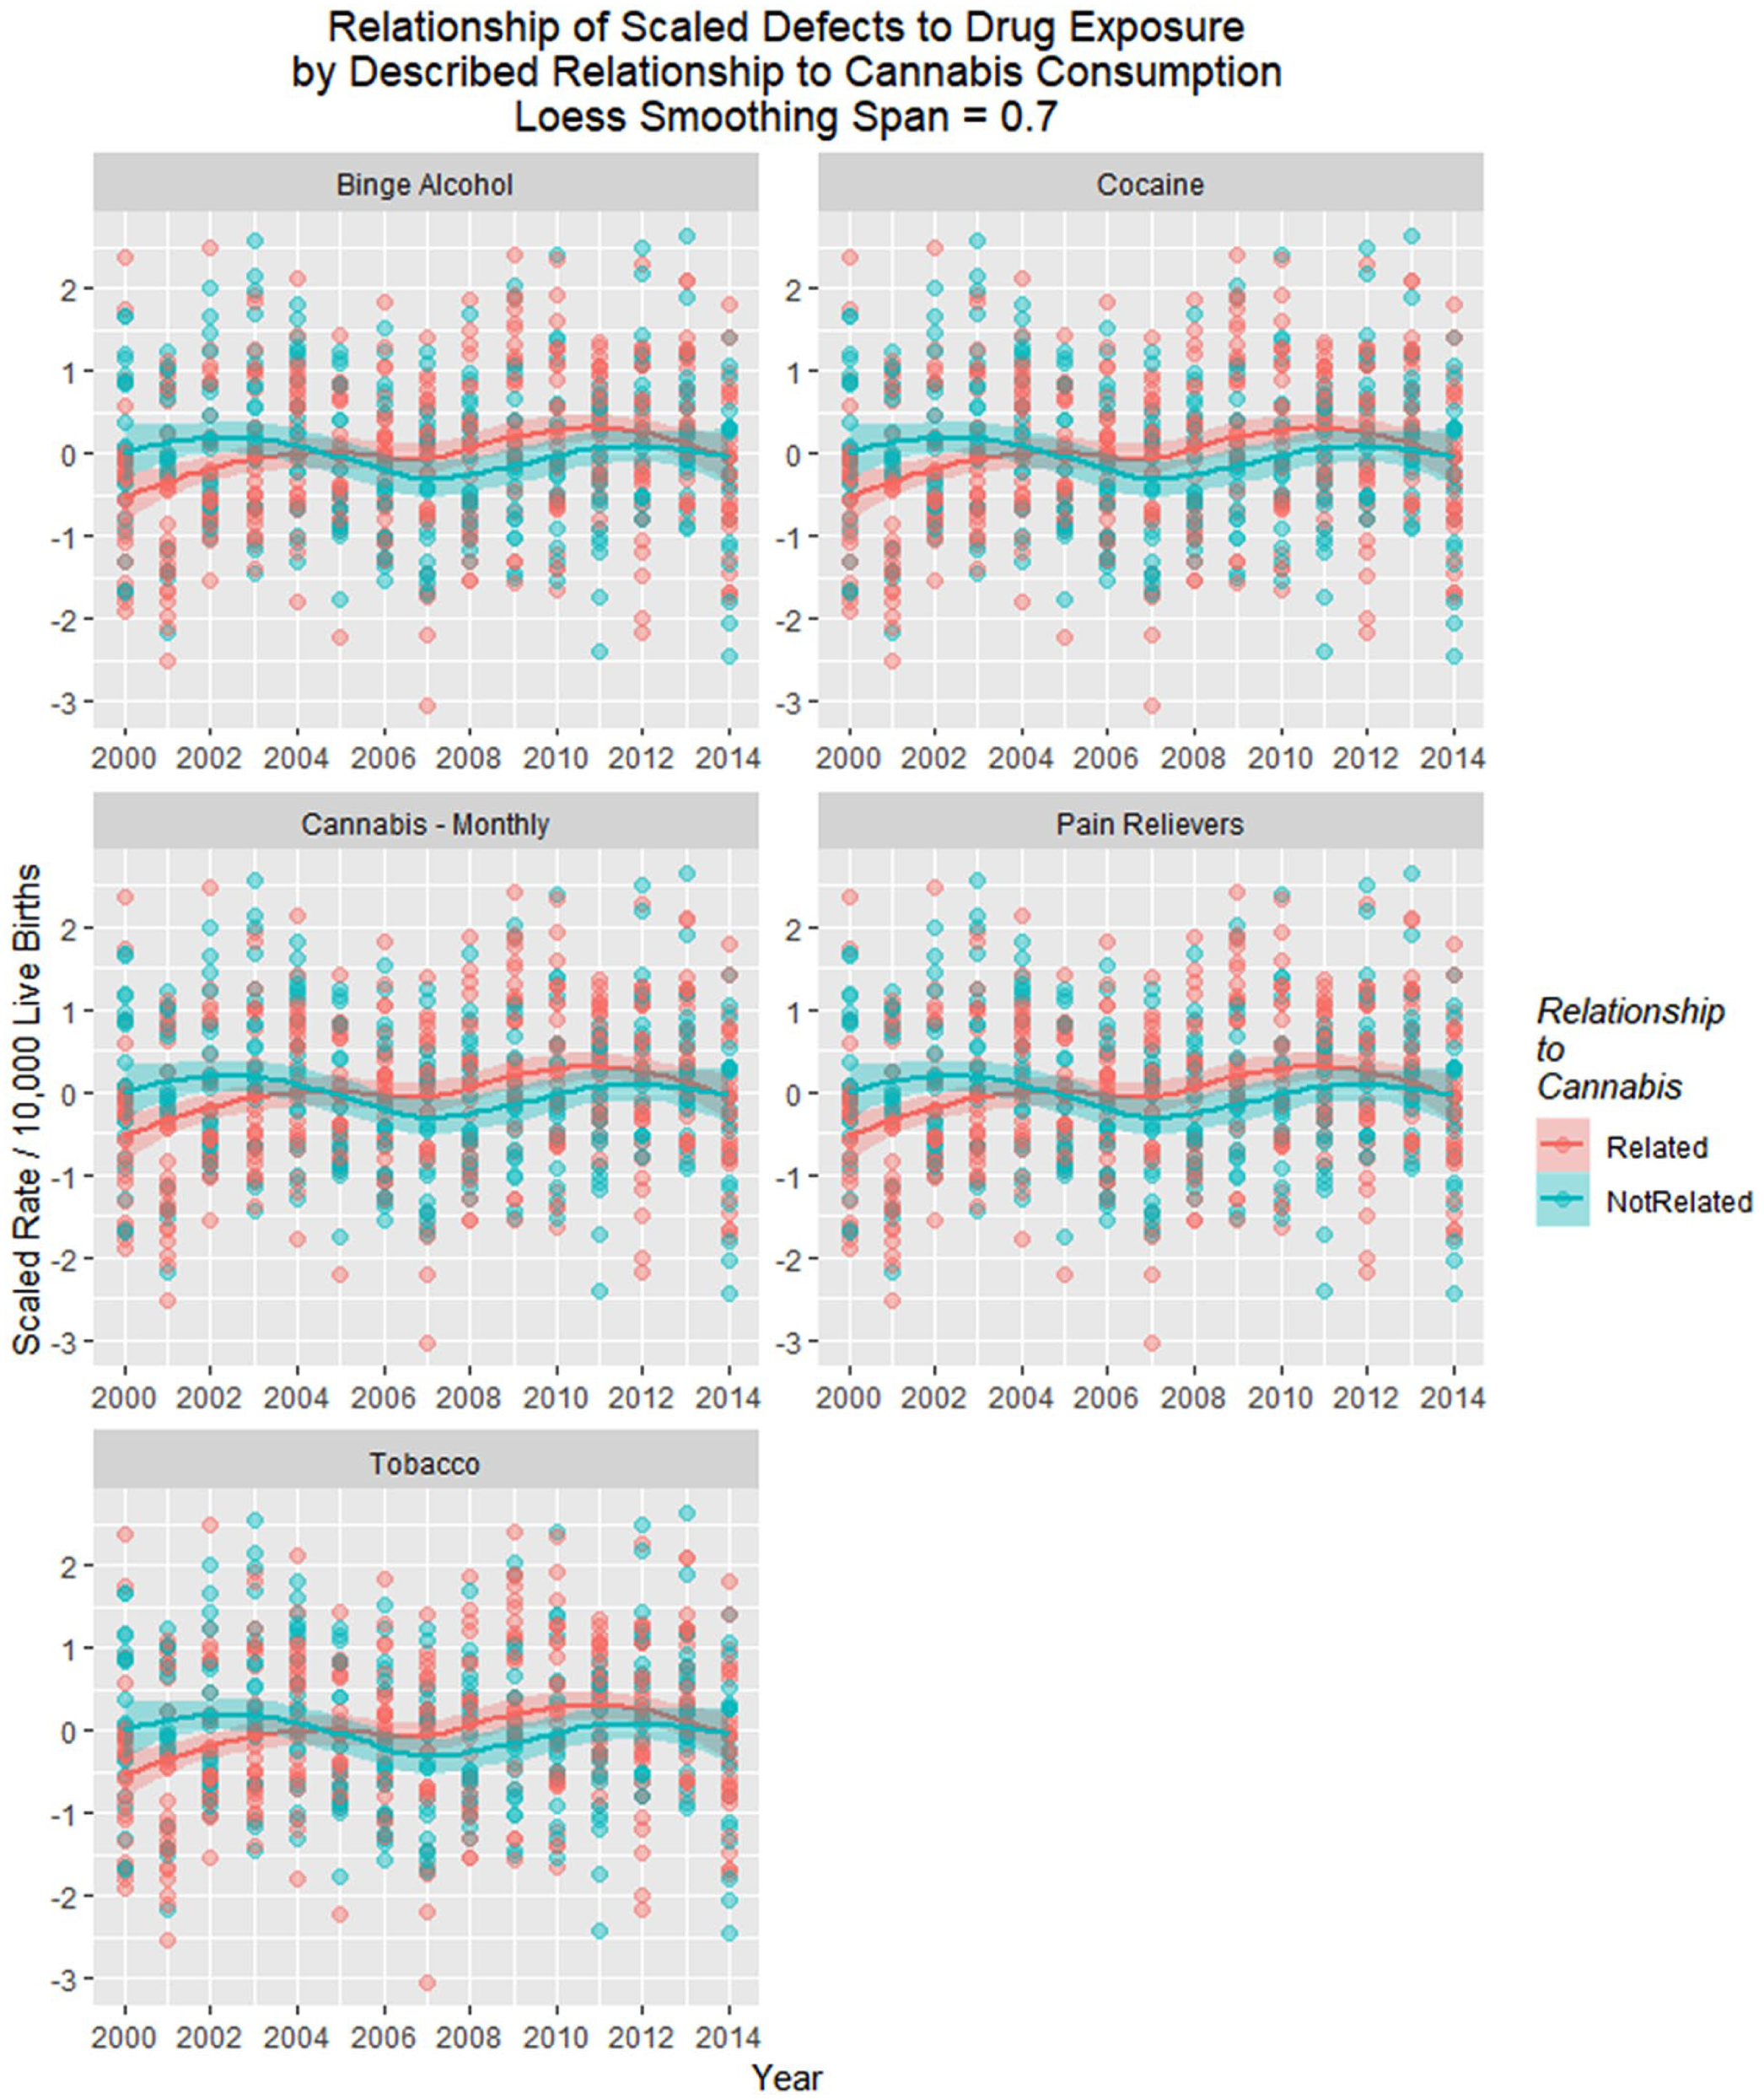
Figure 20 shows the time relationship of the 49 scaled defects by the above-described relationship to cannabis. These data are shown on single plots with both loess curves and linear regression lines in Figure 21.
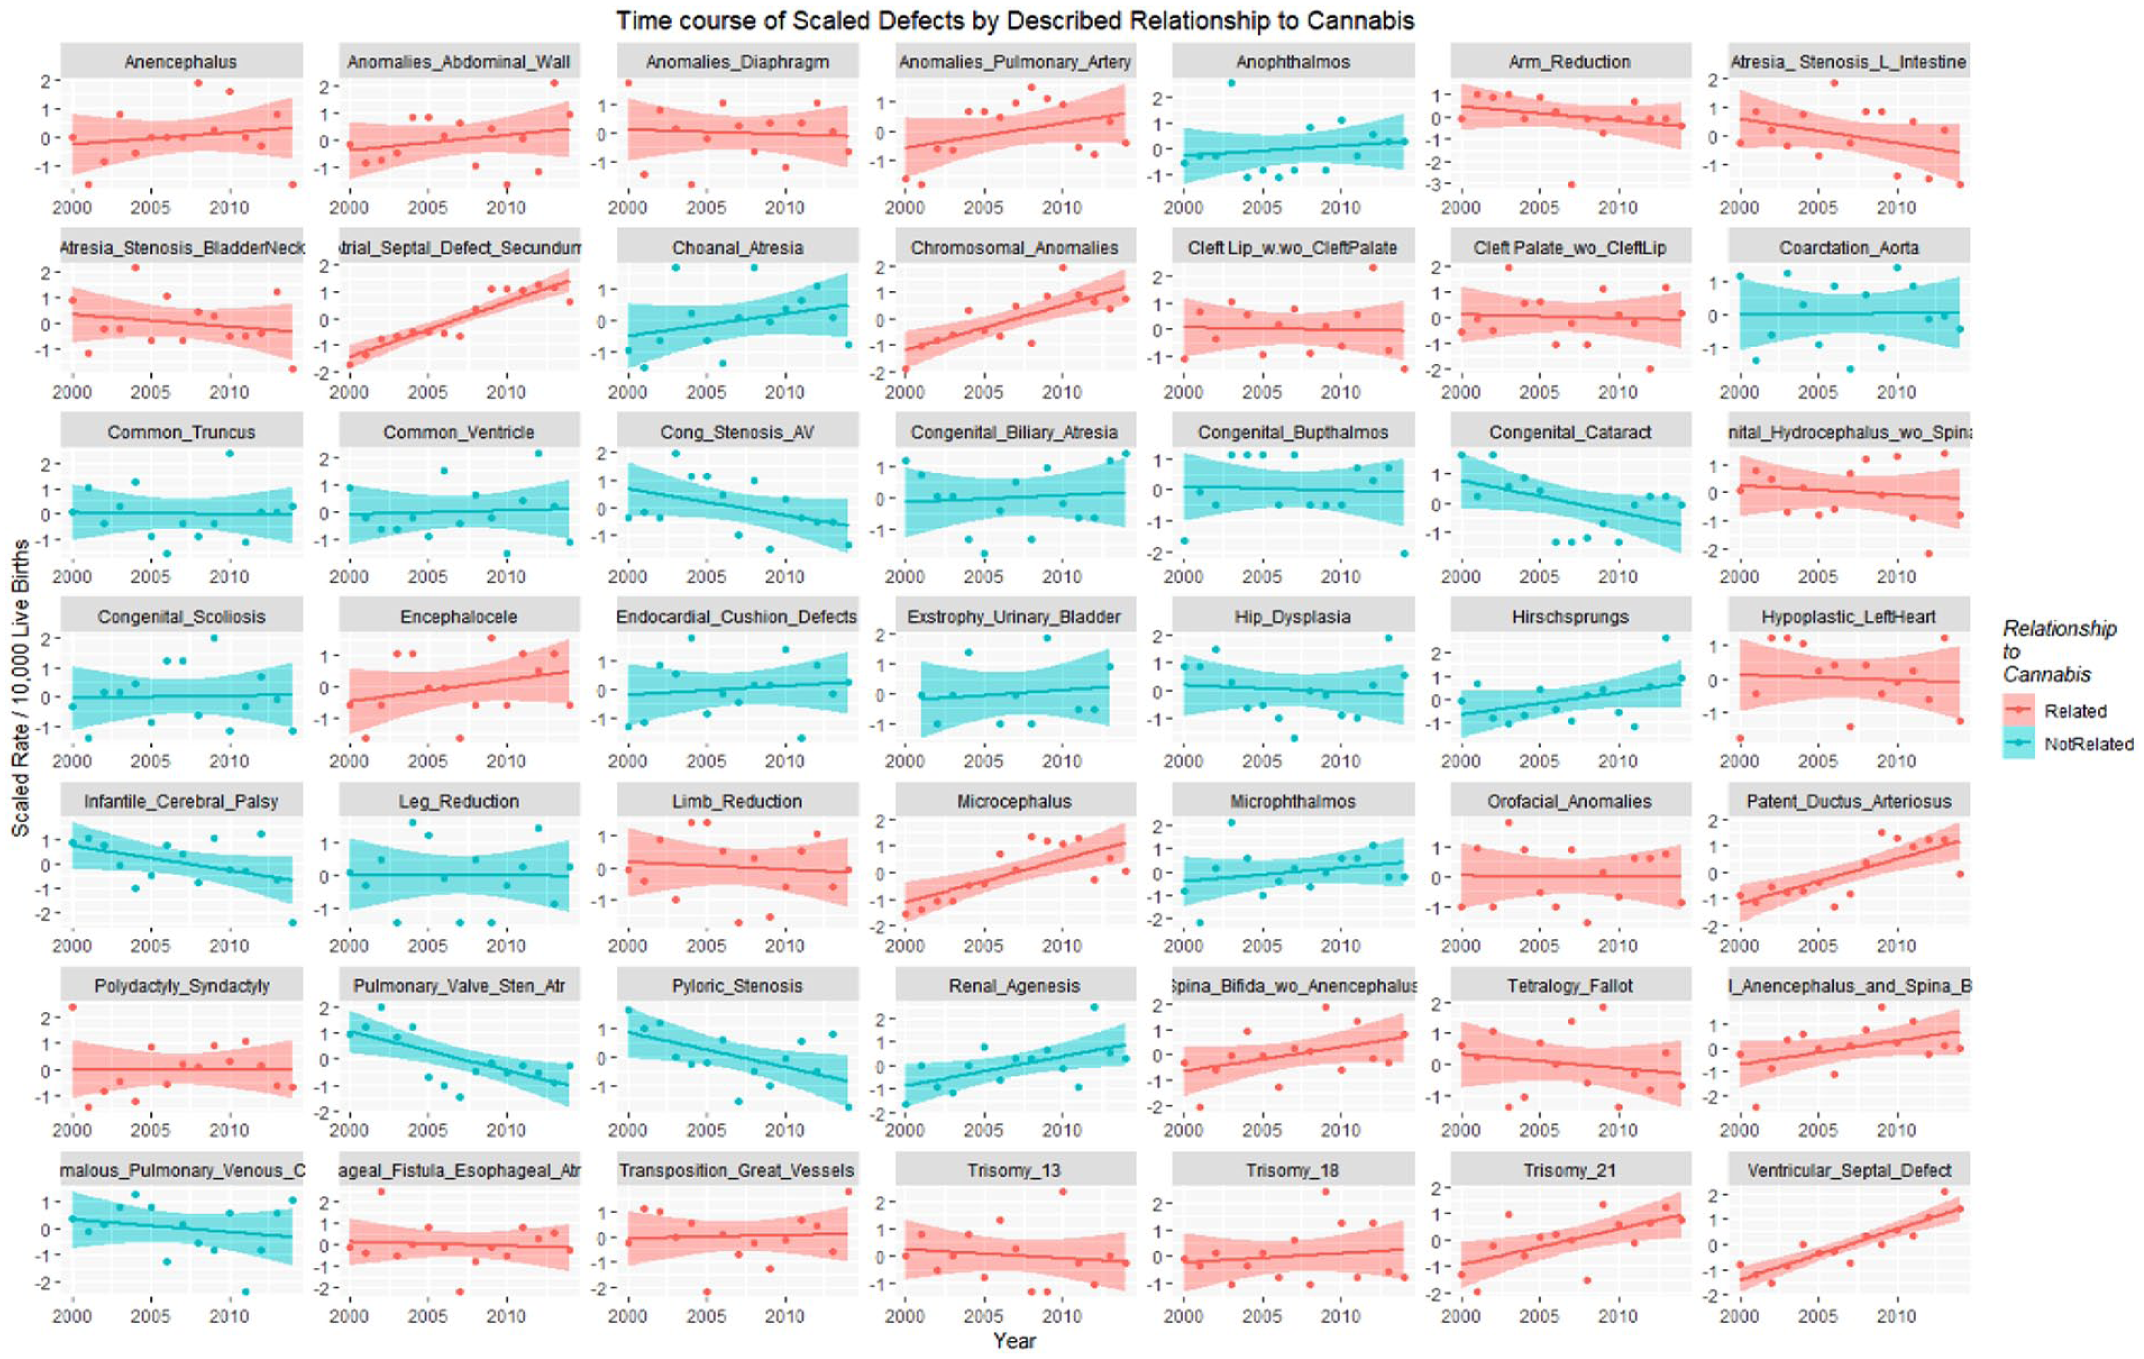
Scaled defects rate as a function of drug use exposure with regression lines fitted in facetted plot by relationship to cannabis use, after omission of pyloric stenosis and inclusion of spina bifida.
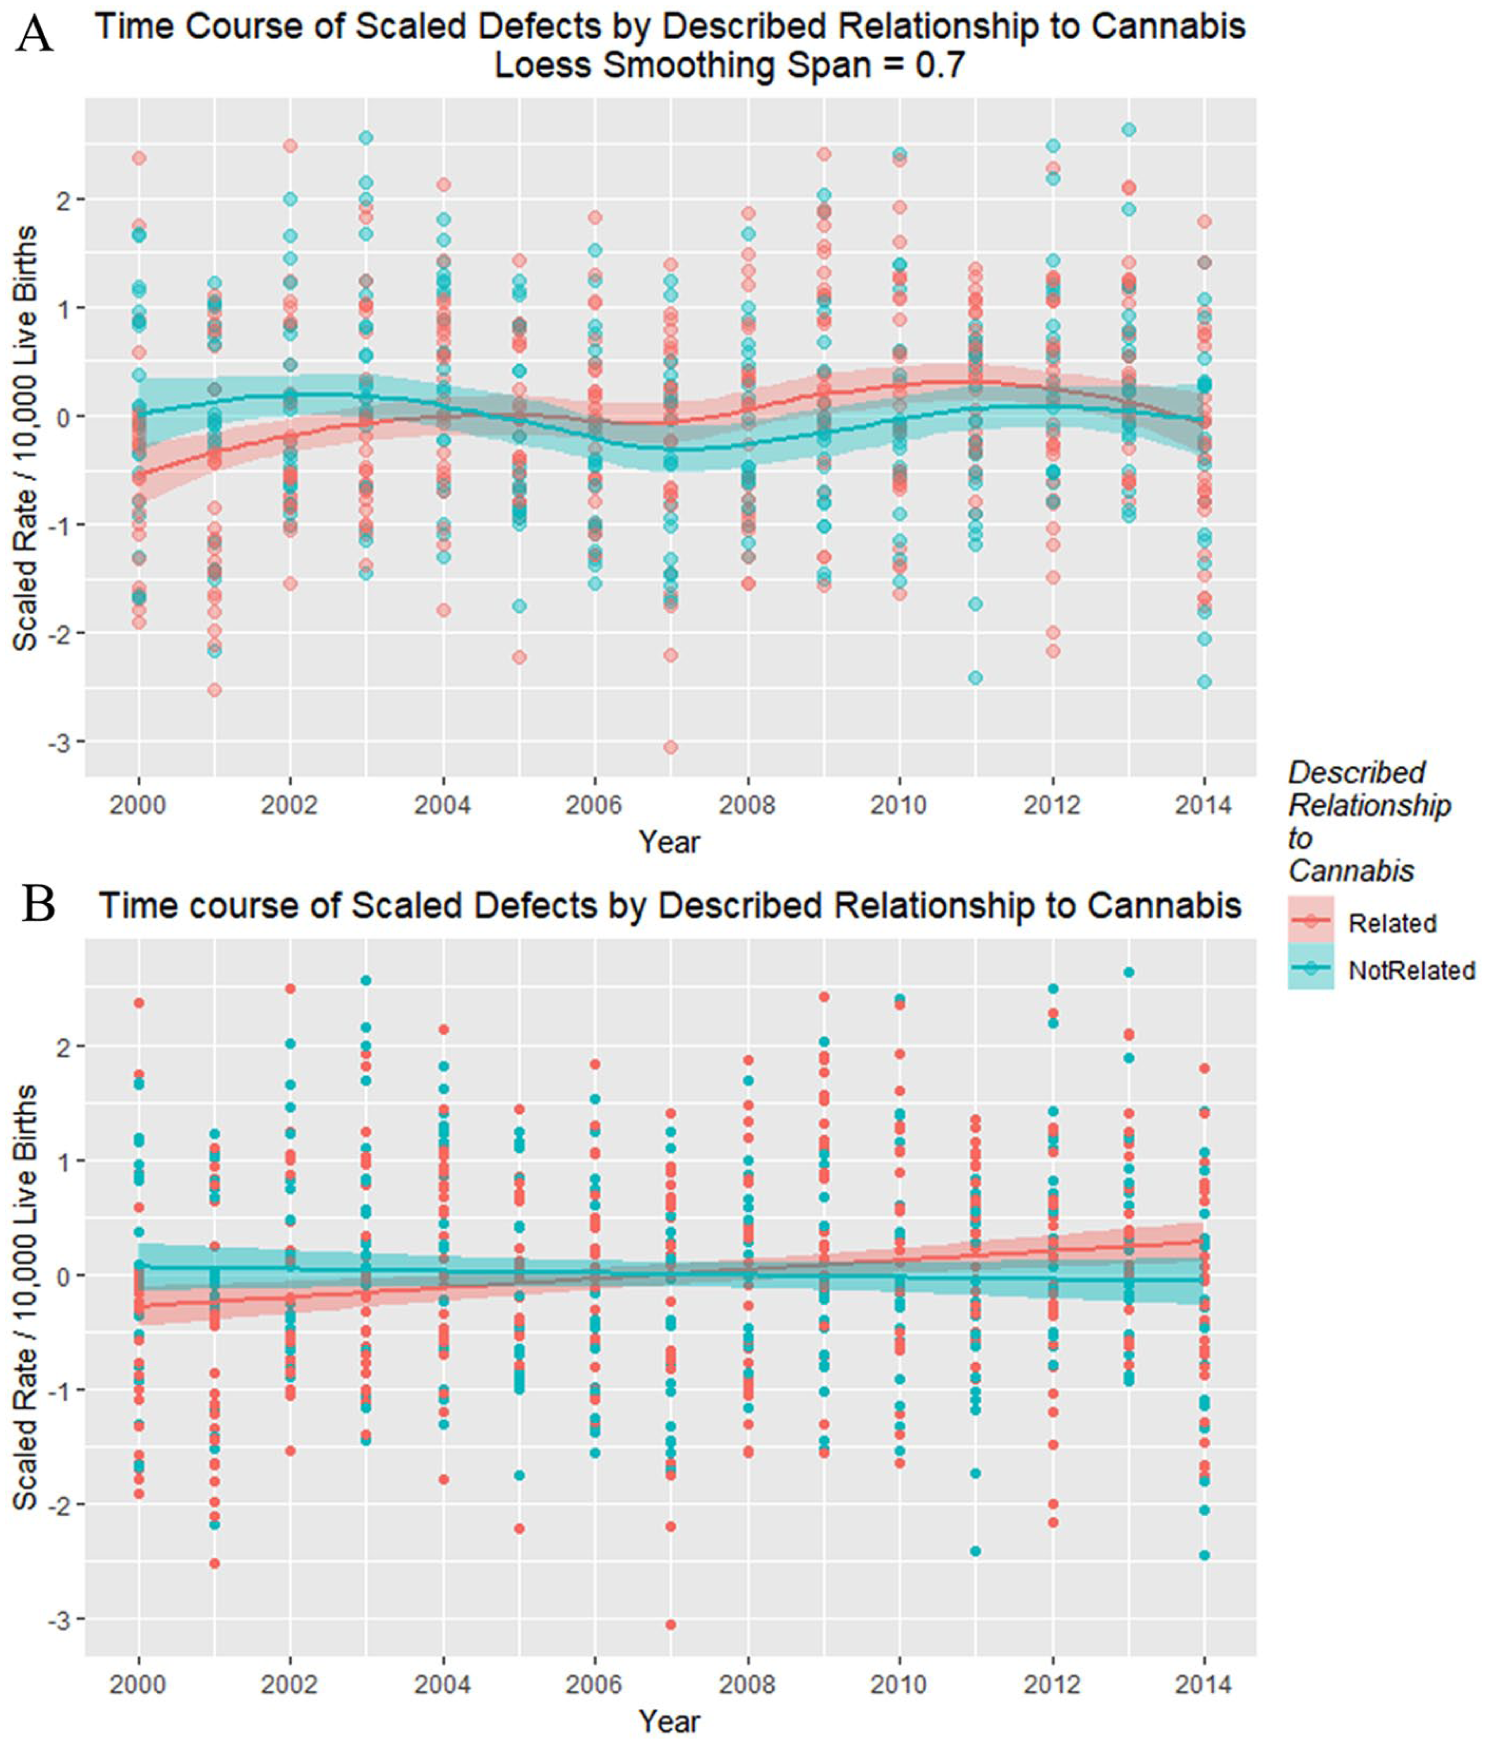
Scaled defects rate as a function of drug use exposure with (A) loess curves and (B) regression lines fitted.
A model quartic-in-time was superior to a linear-only model (ANOVA F = 4.6099, df = 5, P = .0004).
Table 7 shows that the results of both linear and quartic models are significant with cannabis terms remaining in final models both as a factor and in interaction with time and time-squared.
Comparisons of Cannabinoid Models Linear and Quartic in Time for All Scaled Defects.
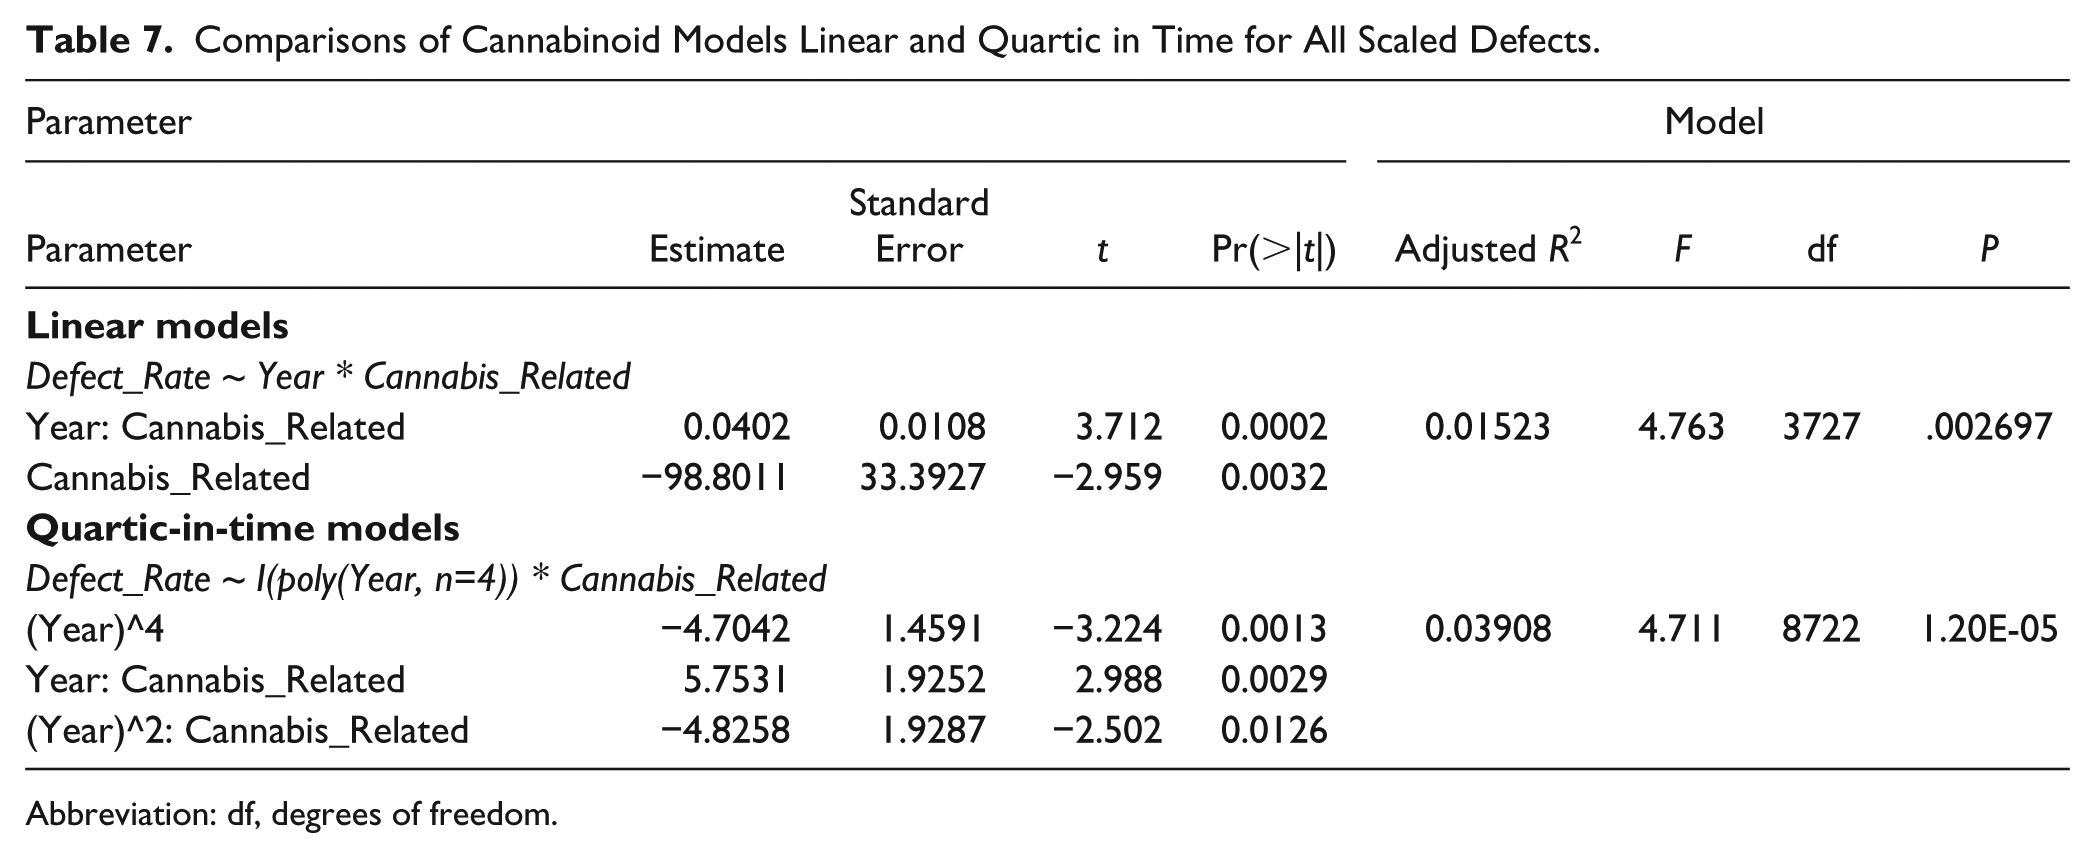
Abbreviation: df, degrees of freedom.
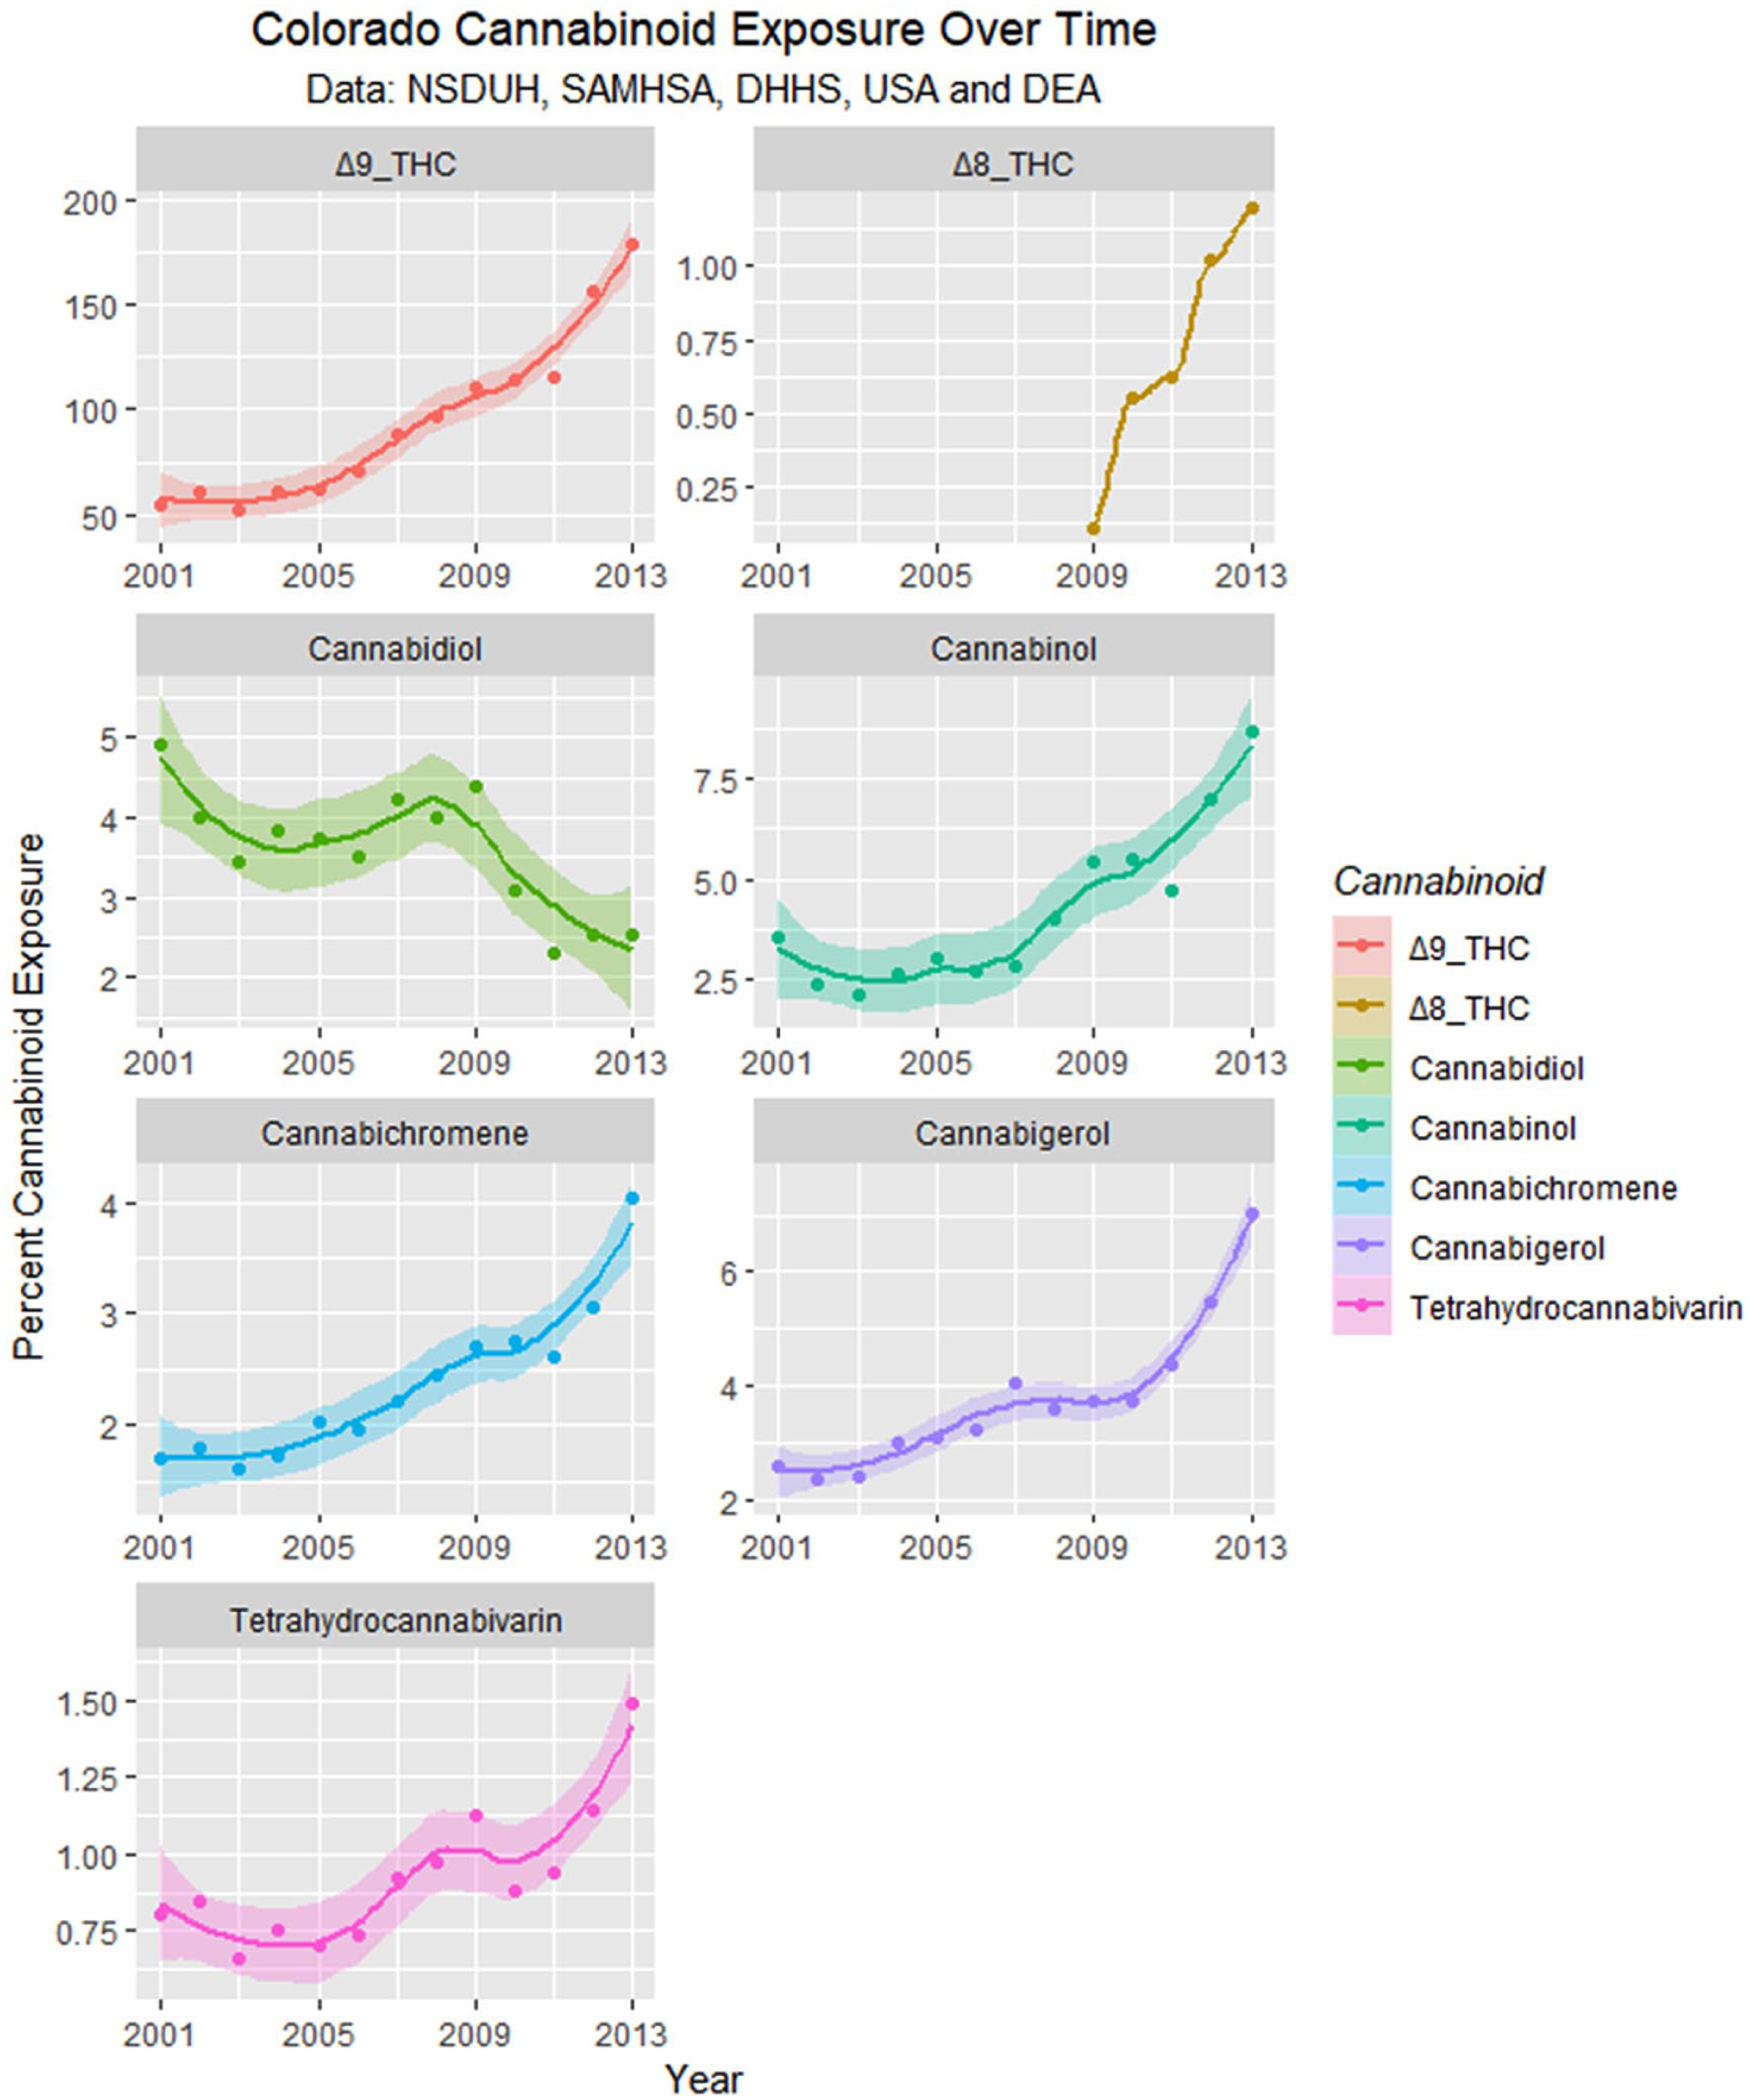
Figure 22 shows the time relationship of exposure to various cannabinoids with regression lines, and loess curves are shown in Supplementary Figure 7 (available online).
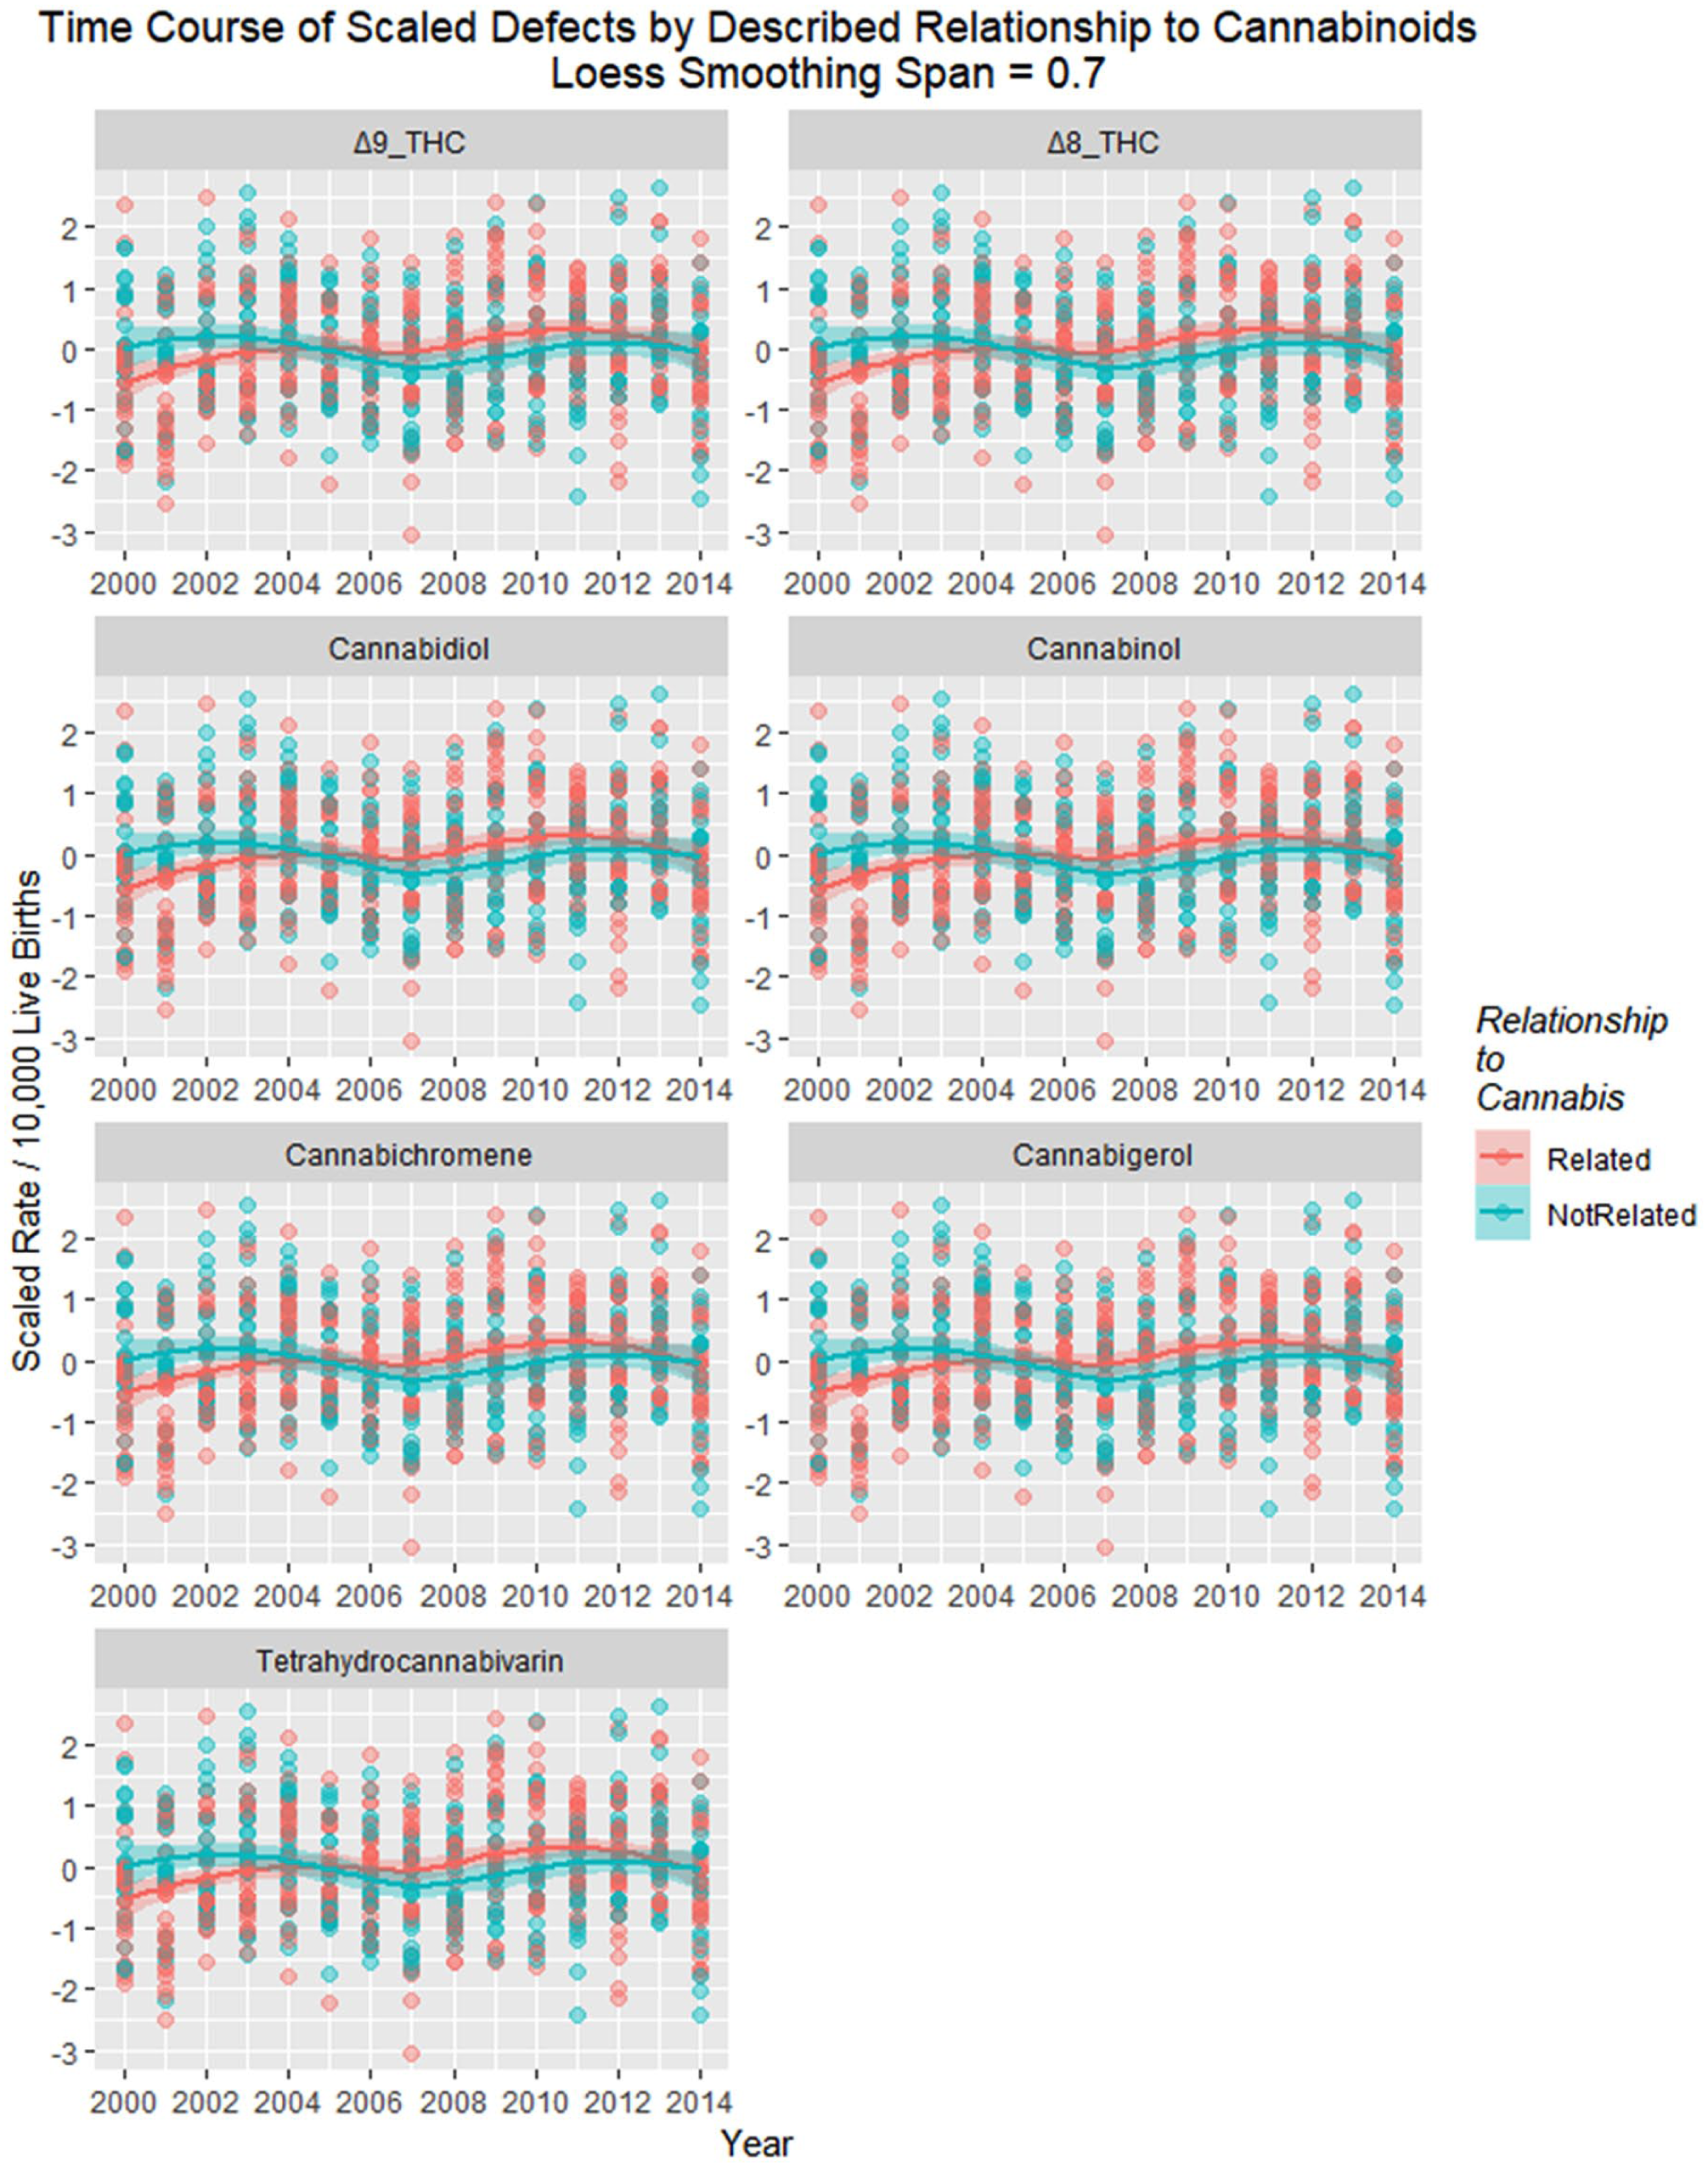
Scaled defects rate as a function of cannabinoid exposure with loess curves fitted. Facetted plot by cannabinoid.
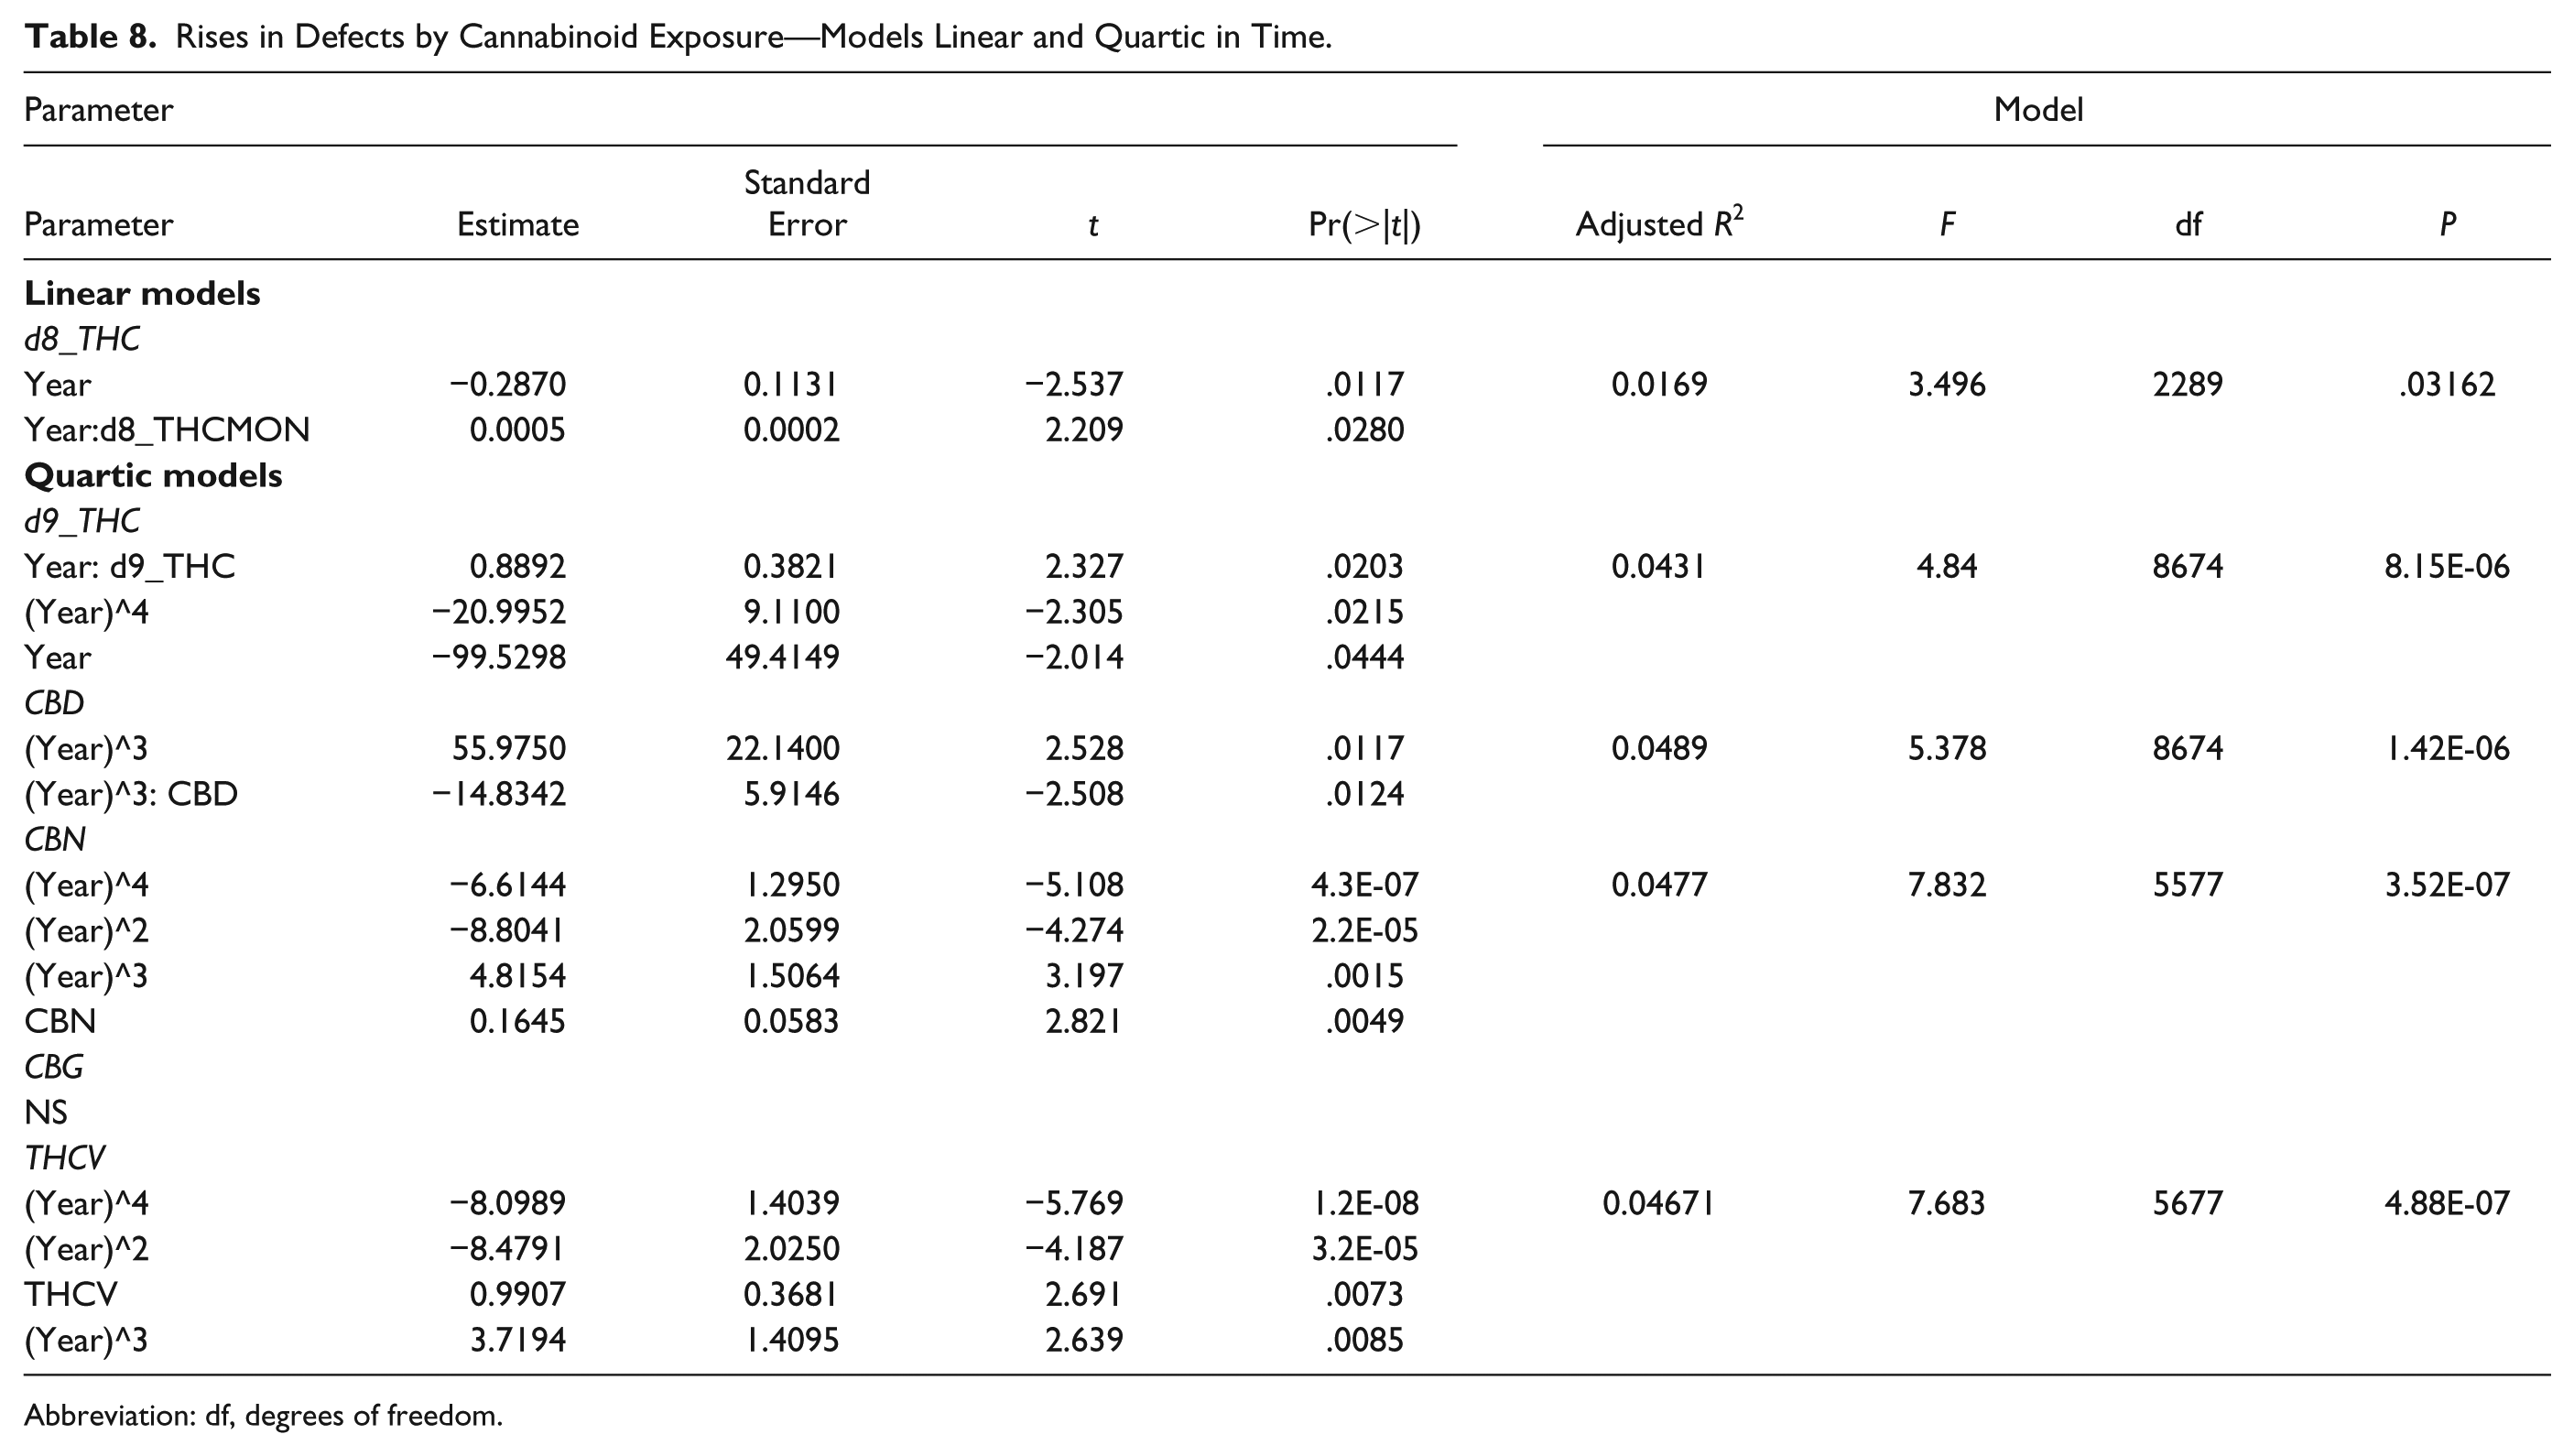
Figure 23 shows the defects charted against cannabinoid exposure. These relationships are formalized in Table 8.
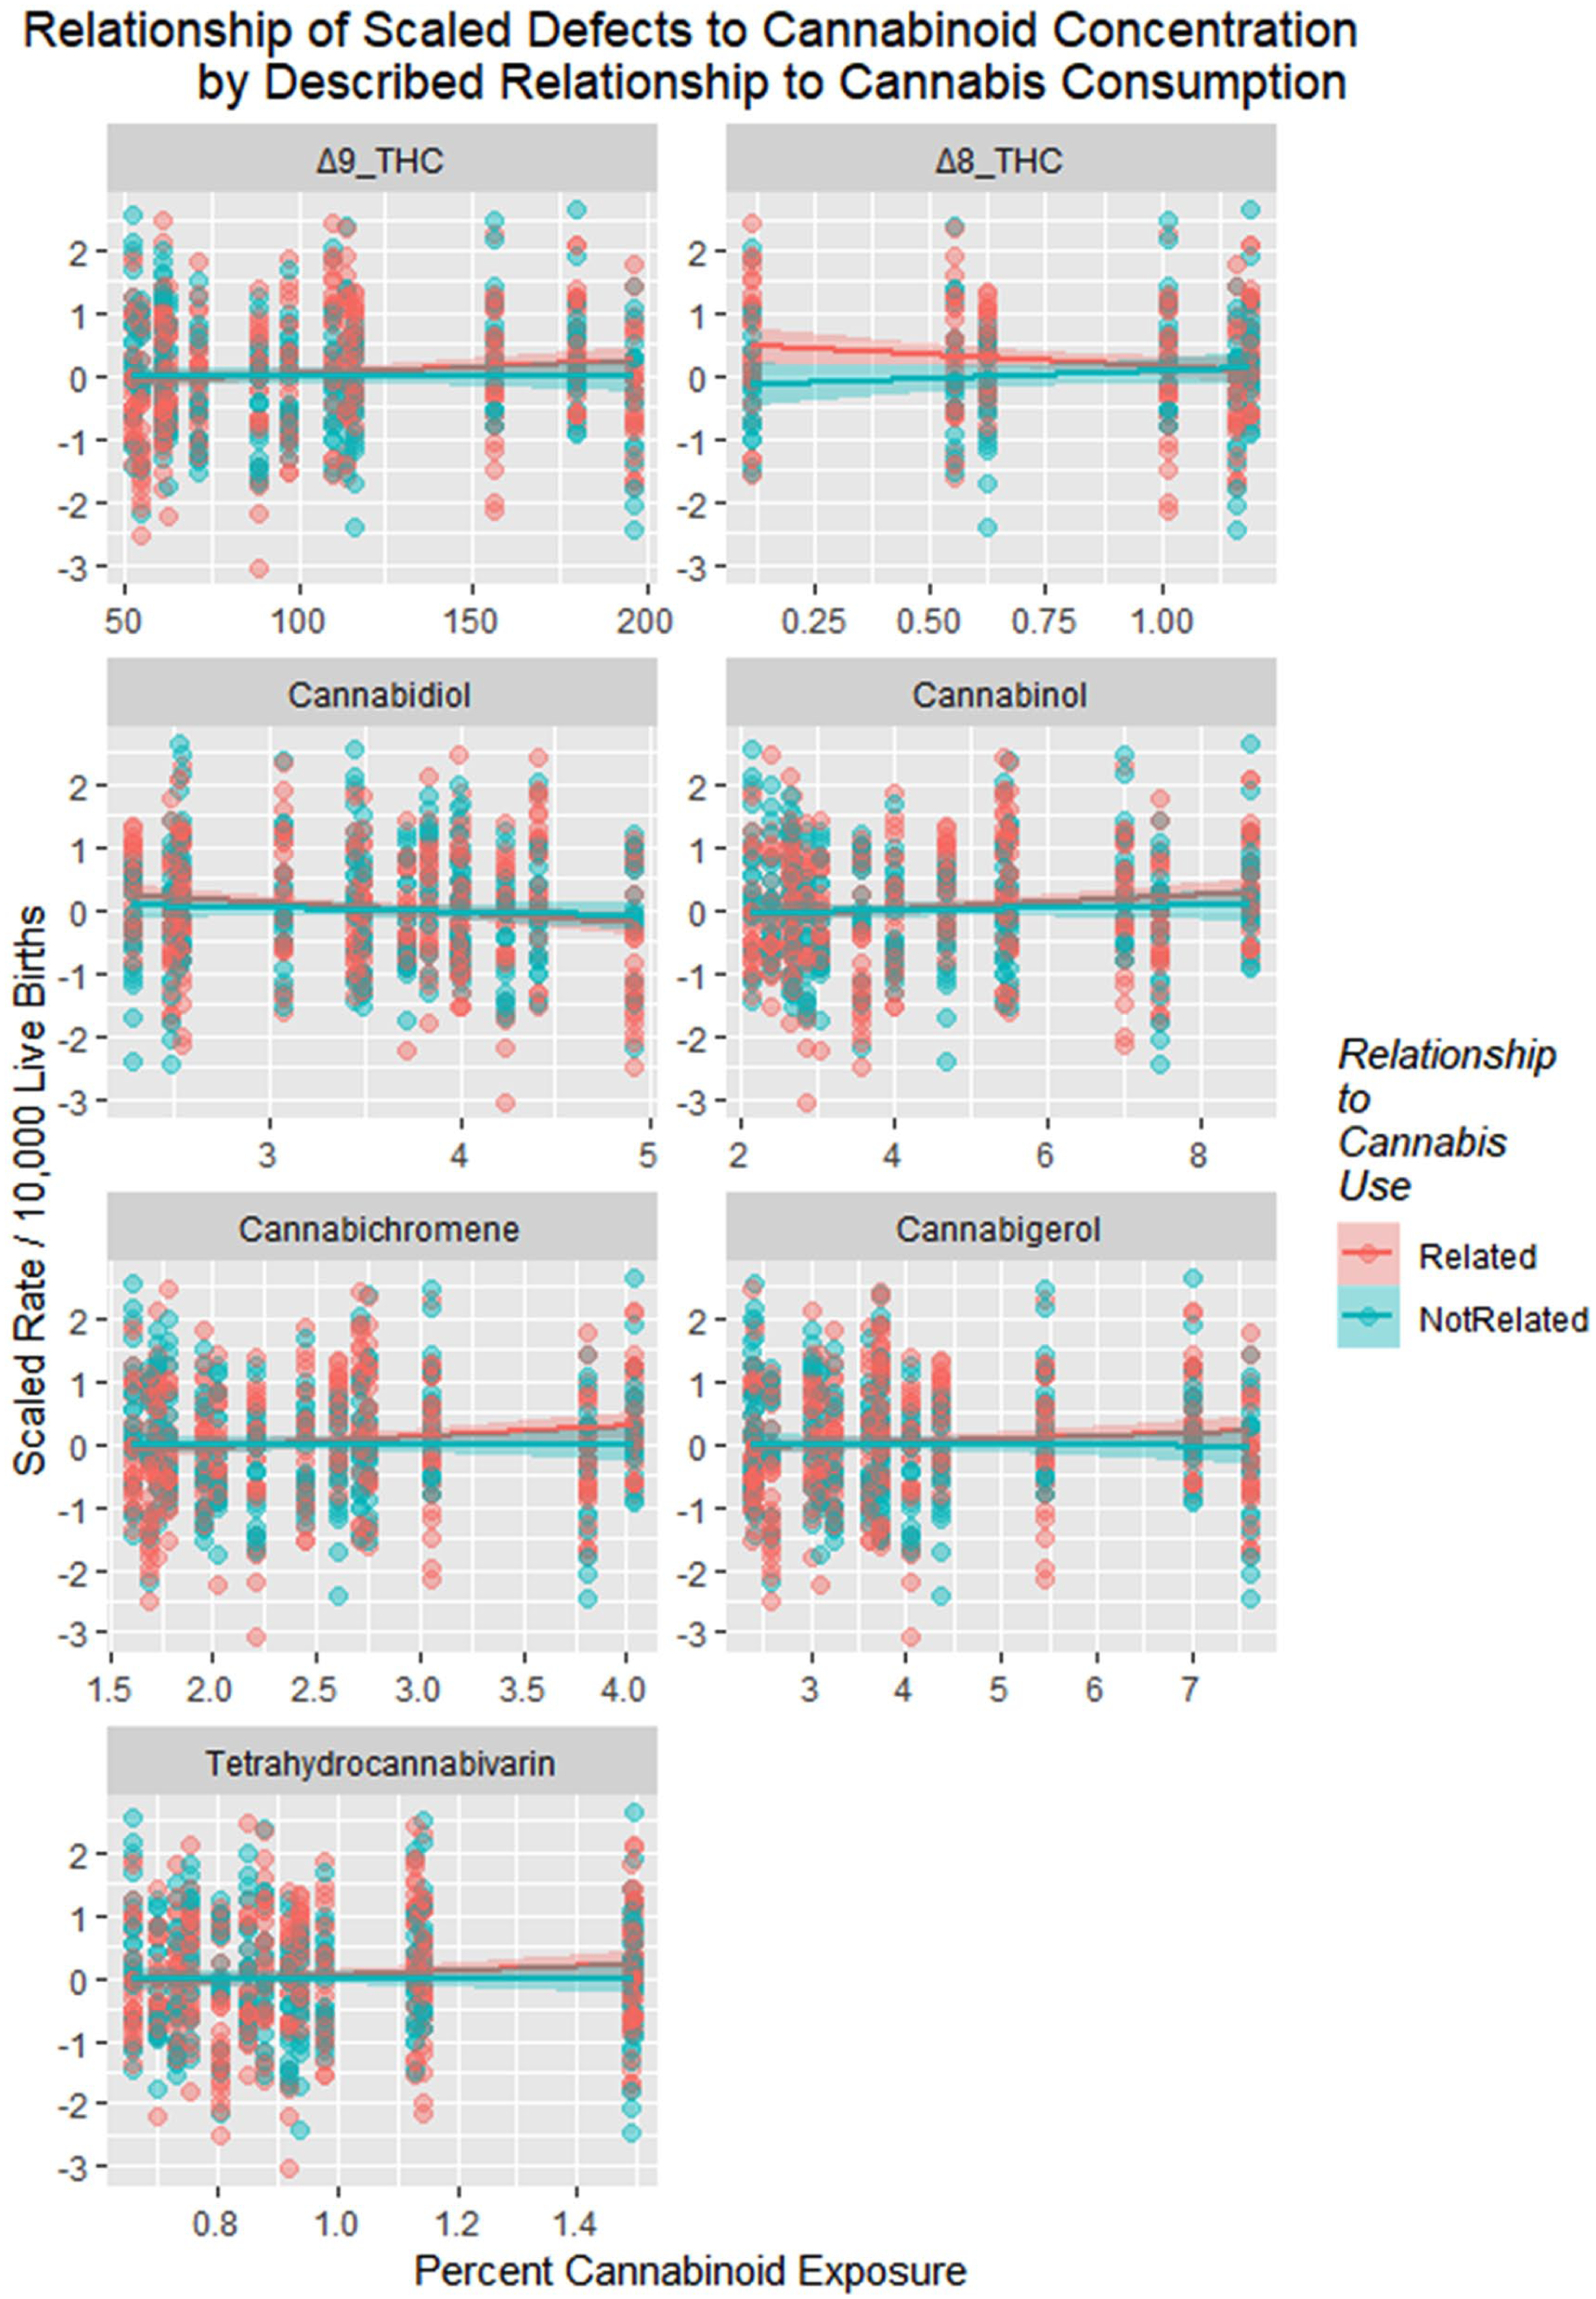
Scaled defects rate as a function of cannabinoid exposure with regression lines fitted. Facetted plot by cannabinoid.
Rises in Defects by Cannabinoid Exposure—Models Linear and Quartic in Time.
Abbreviation: df, degrees of freedom.
Figure 24 illustrates the complex relationship between monthly cannabis use, falling cannabidiol concentration, and the population exposure to cannabidiol.
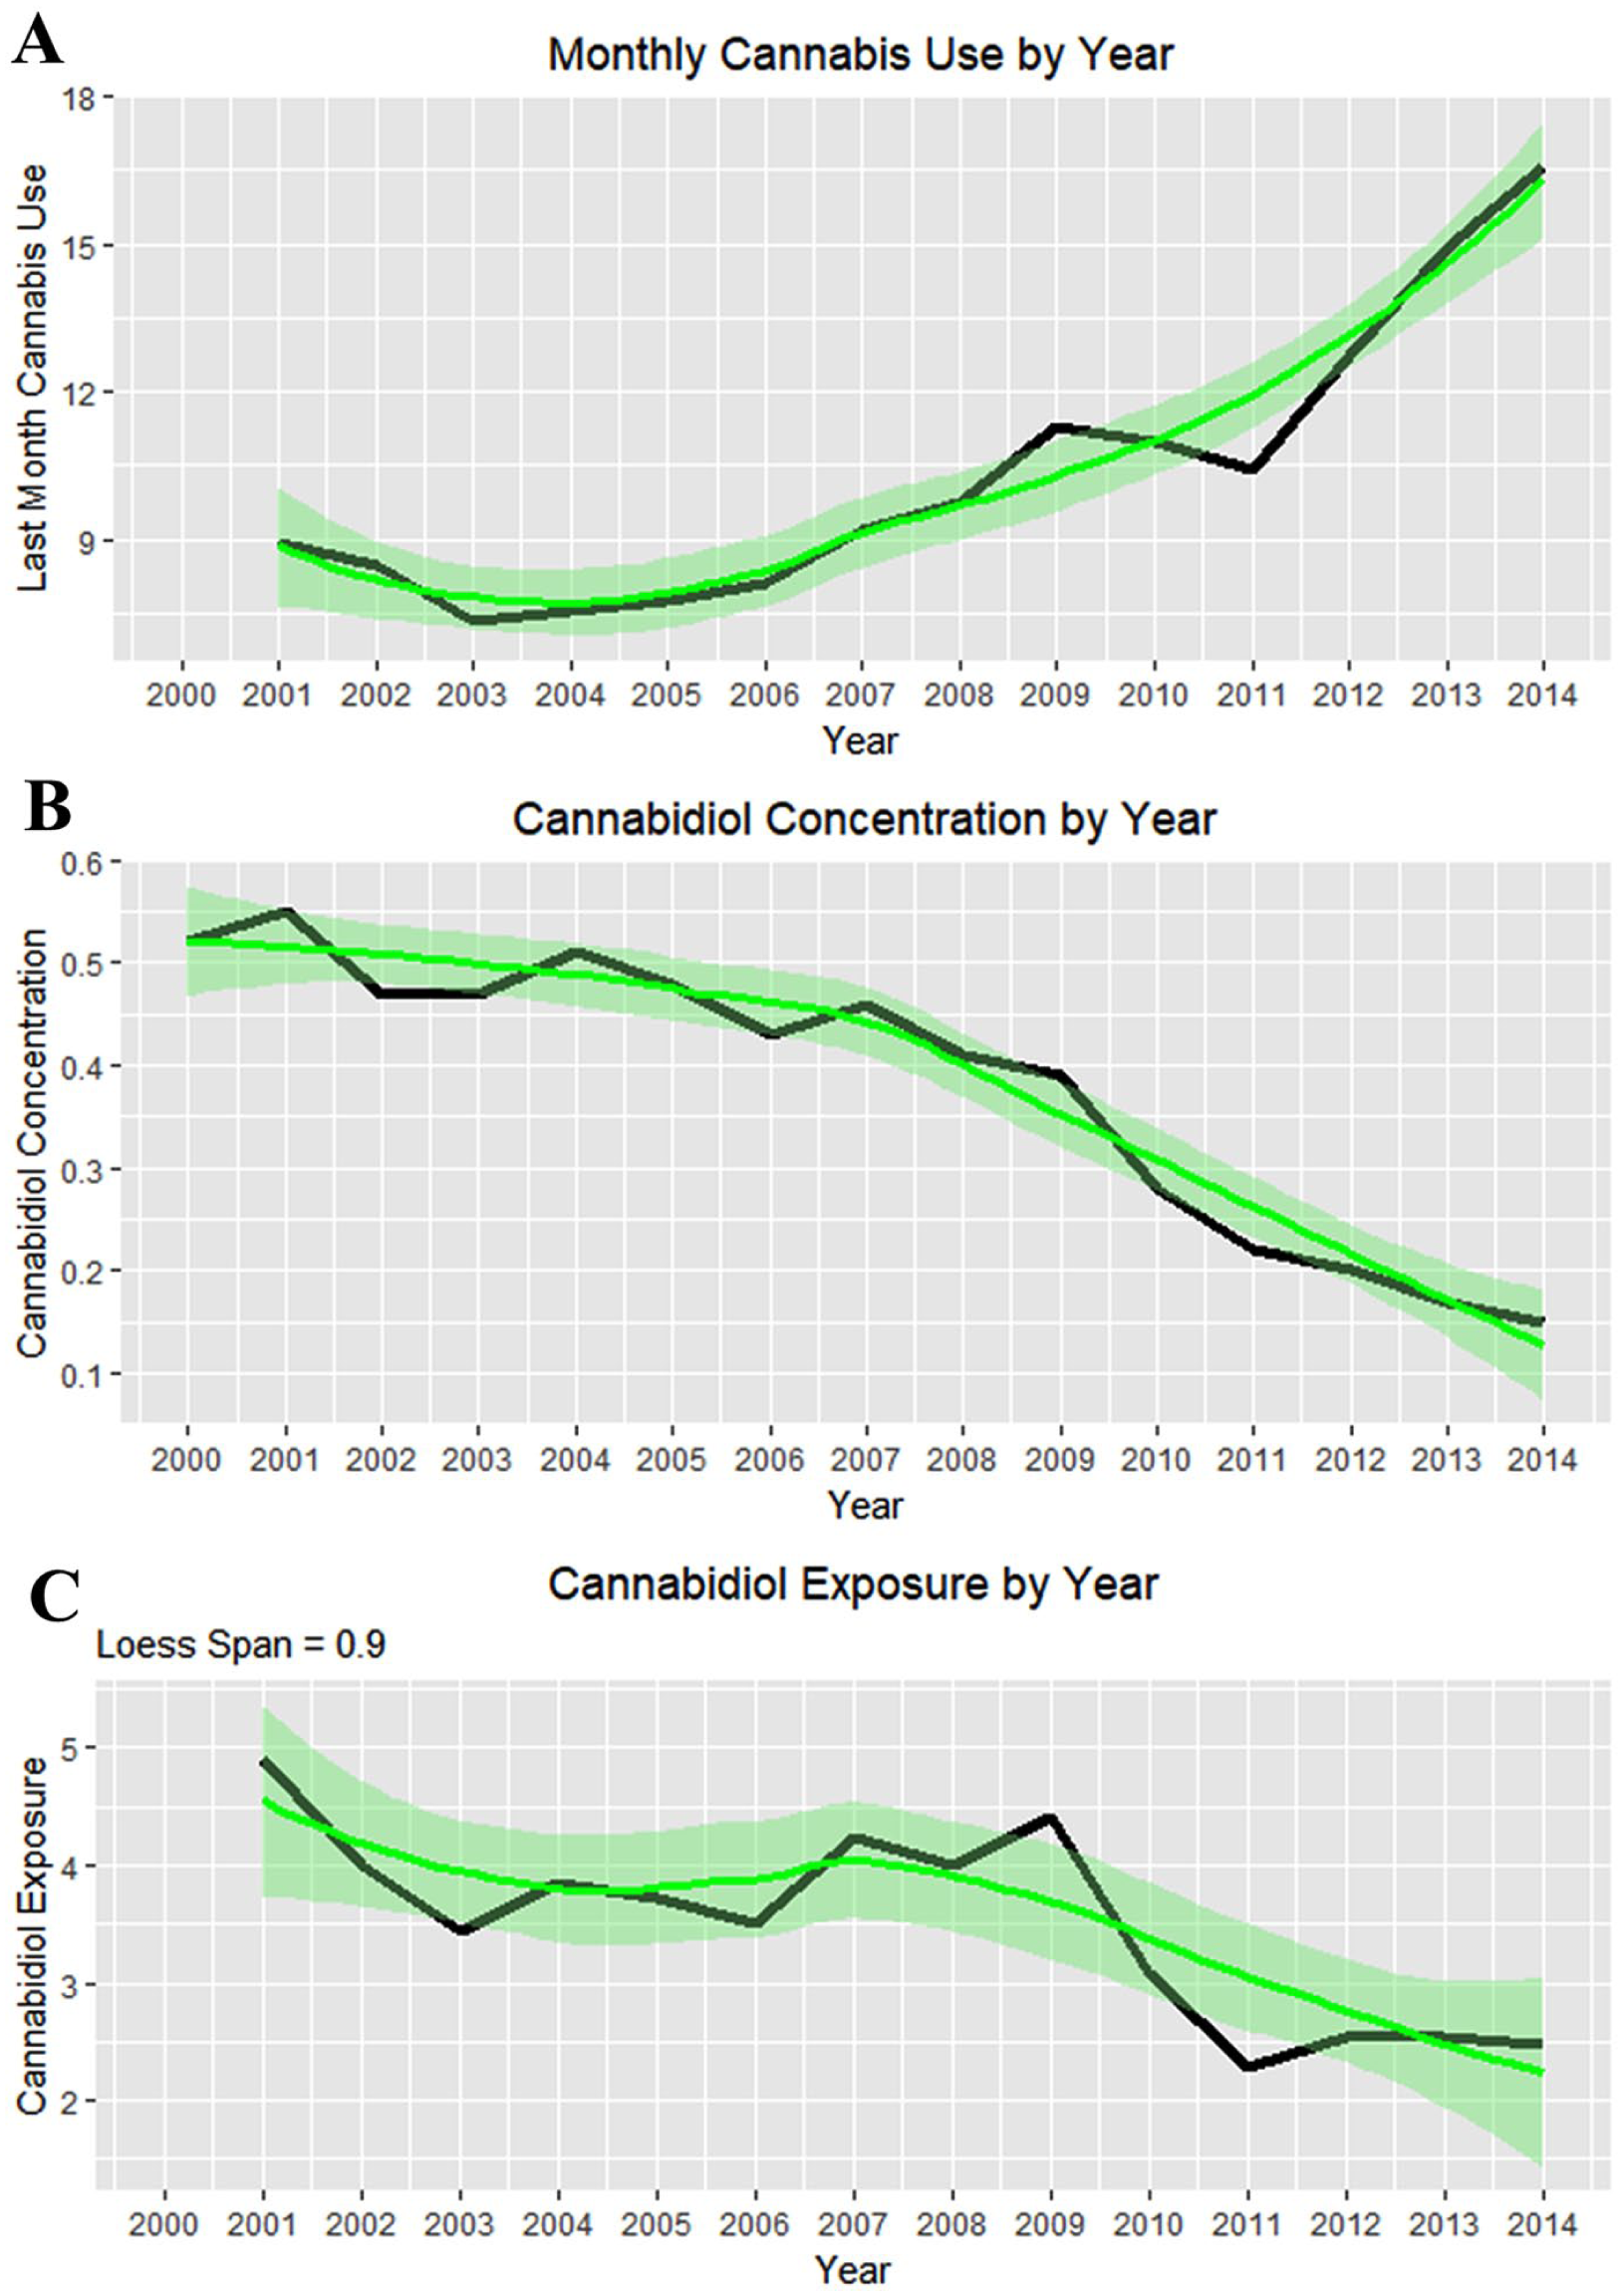
(A) Monthly cannabis use by year. (B) Cannabidiol concentration by year. (C) Cannabidiol exposure by year as the product of (A) and (B).
Figure 25 is a point and box plot graph of the movement of cannabis-related versus nonrelated defects for each year to address the complex relationship of cannabidiol exposure.
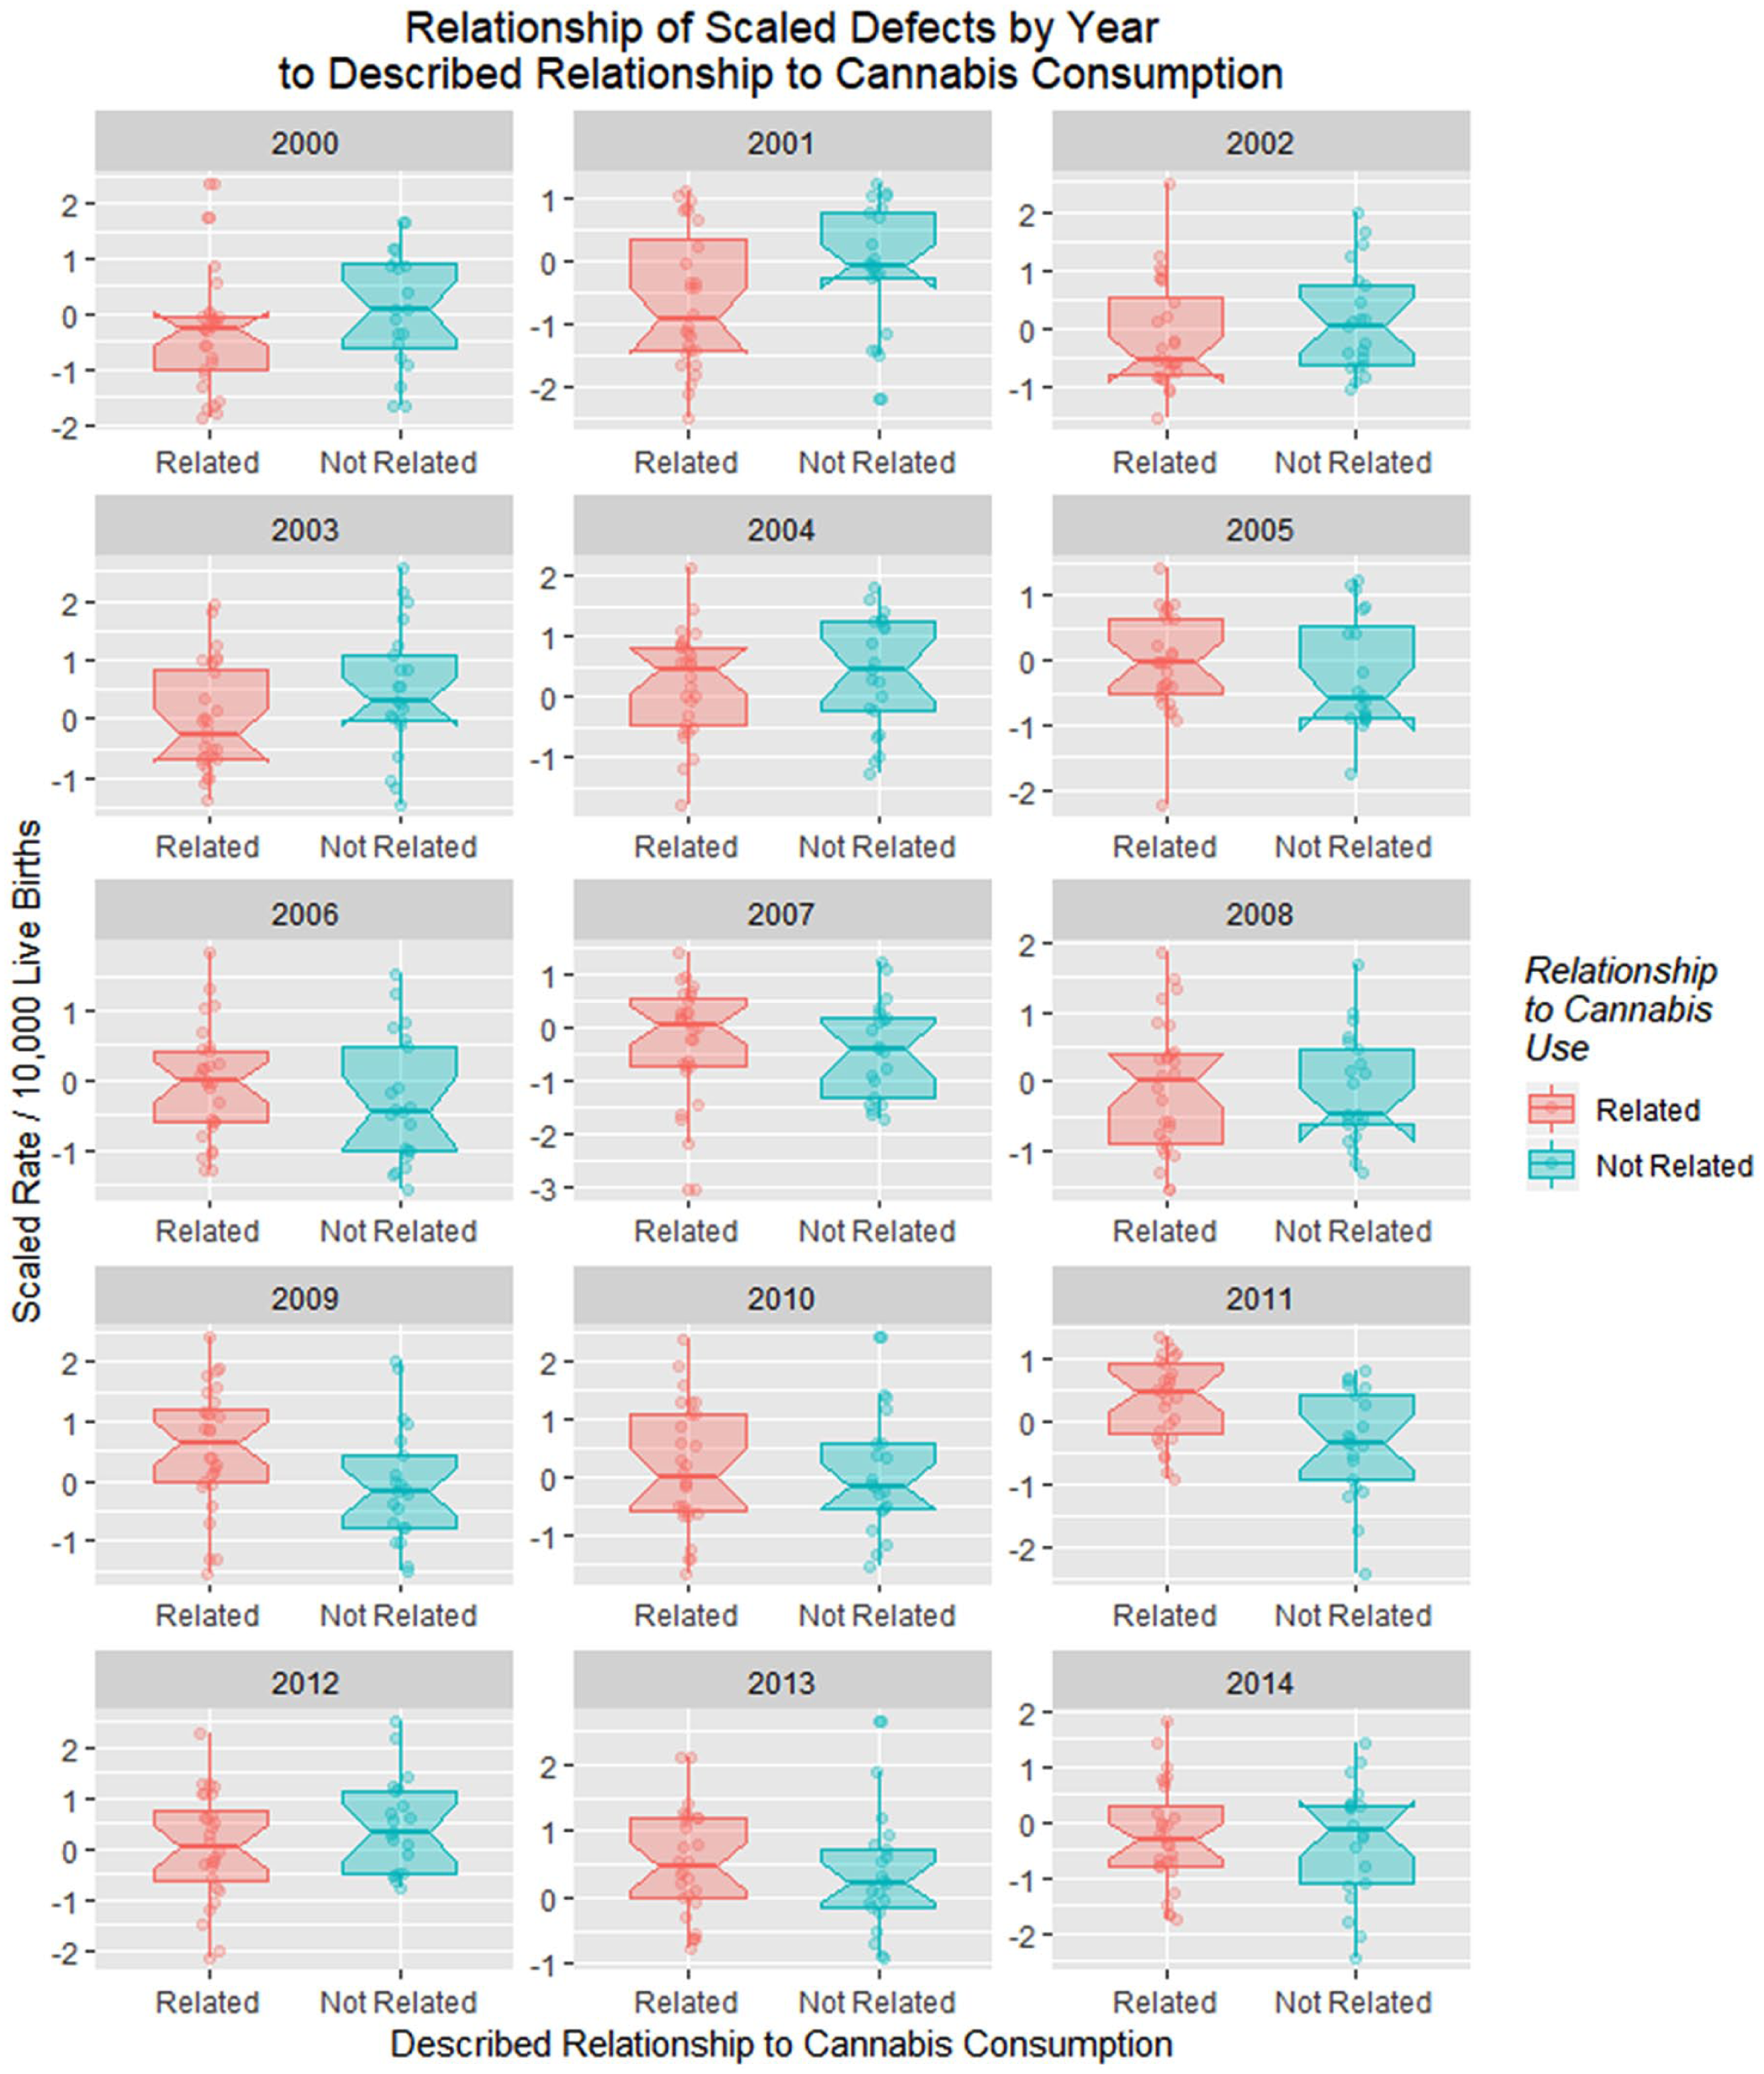
Relationship of scaled defects by year to described relationship to cannabis consumption from the published literature (see Discussion).
Figure 26A shows these 2 rates side by side from 2000 to 2014. The difference between the 2 groups is plotted in Figure 26B, and their adjusted ratio (adjusted by adding unity [1] to numerator and denominator) appears in Figure 26C. Figure 26D shows the ratio of the absolute values of the cannabis-related and non–cannabis-related values, which correlates broadly with cannabidiol exposure (Figure 24C, R = 0.4857, P = .0783). These measures clearly peaked in 2009-2010 when cannabidiol exposure also peaked.
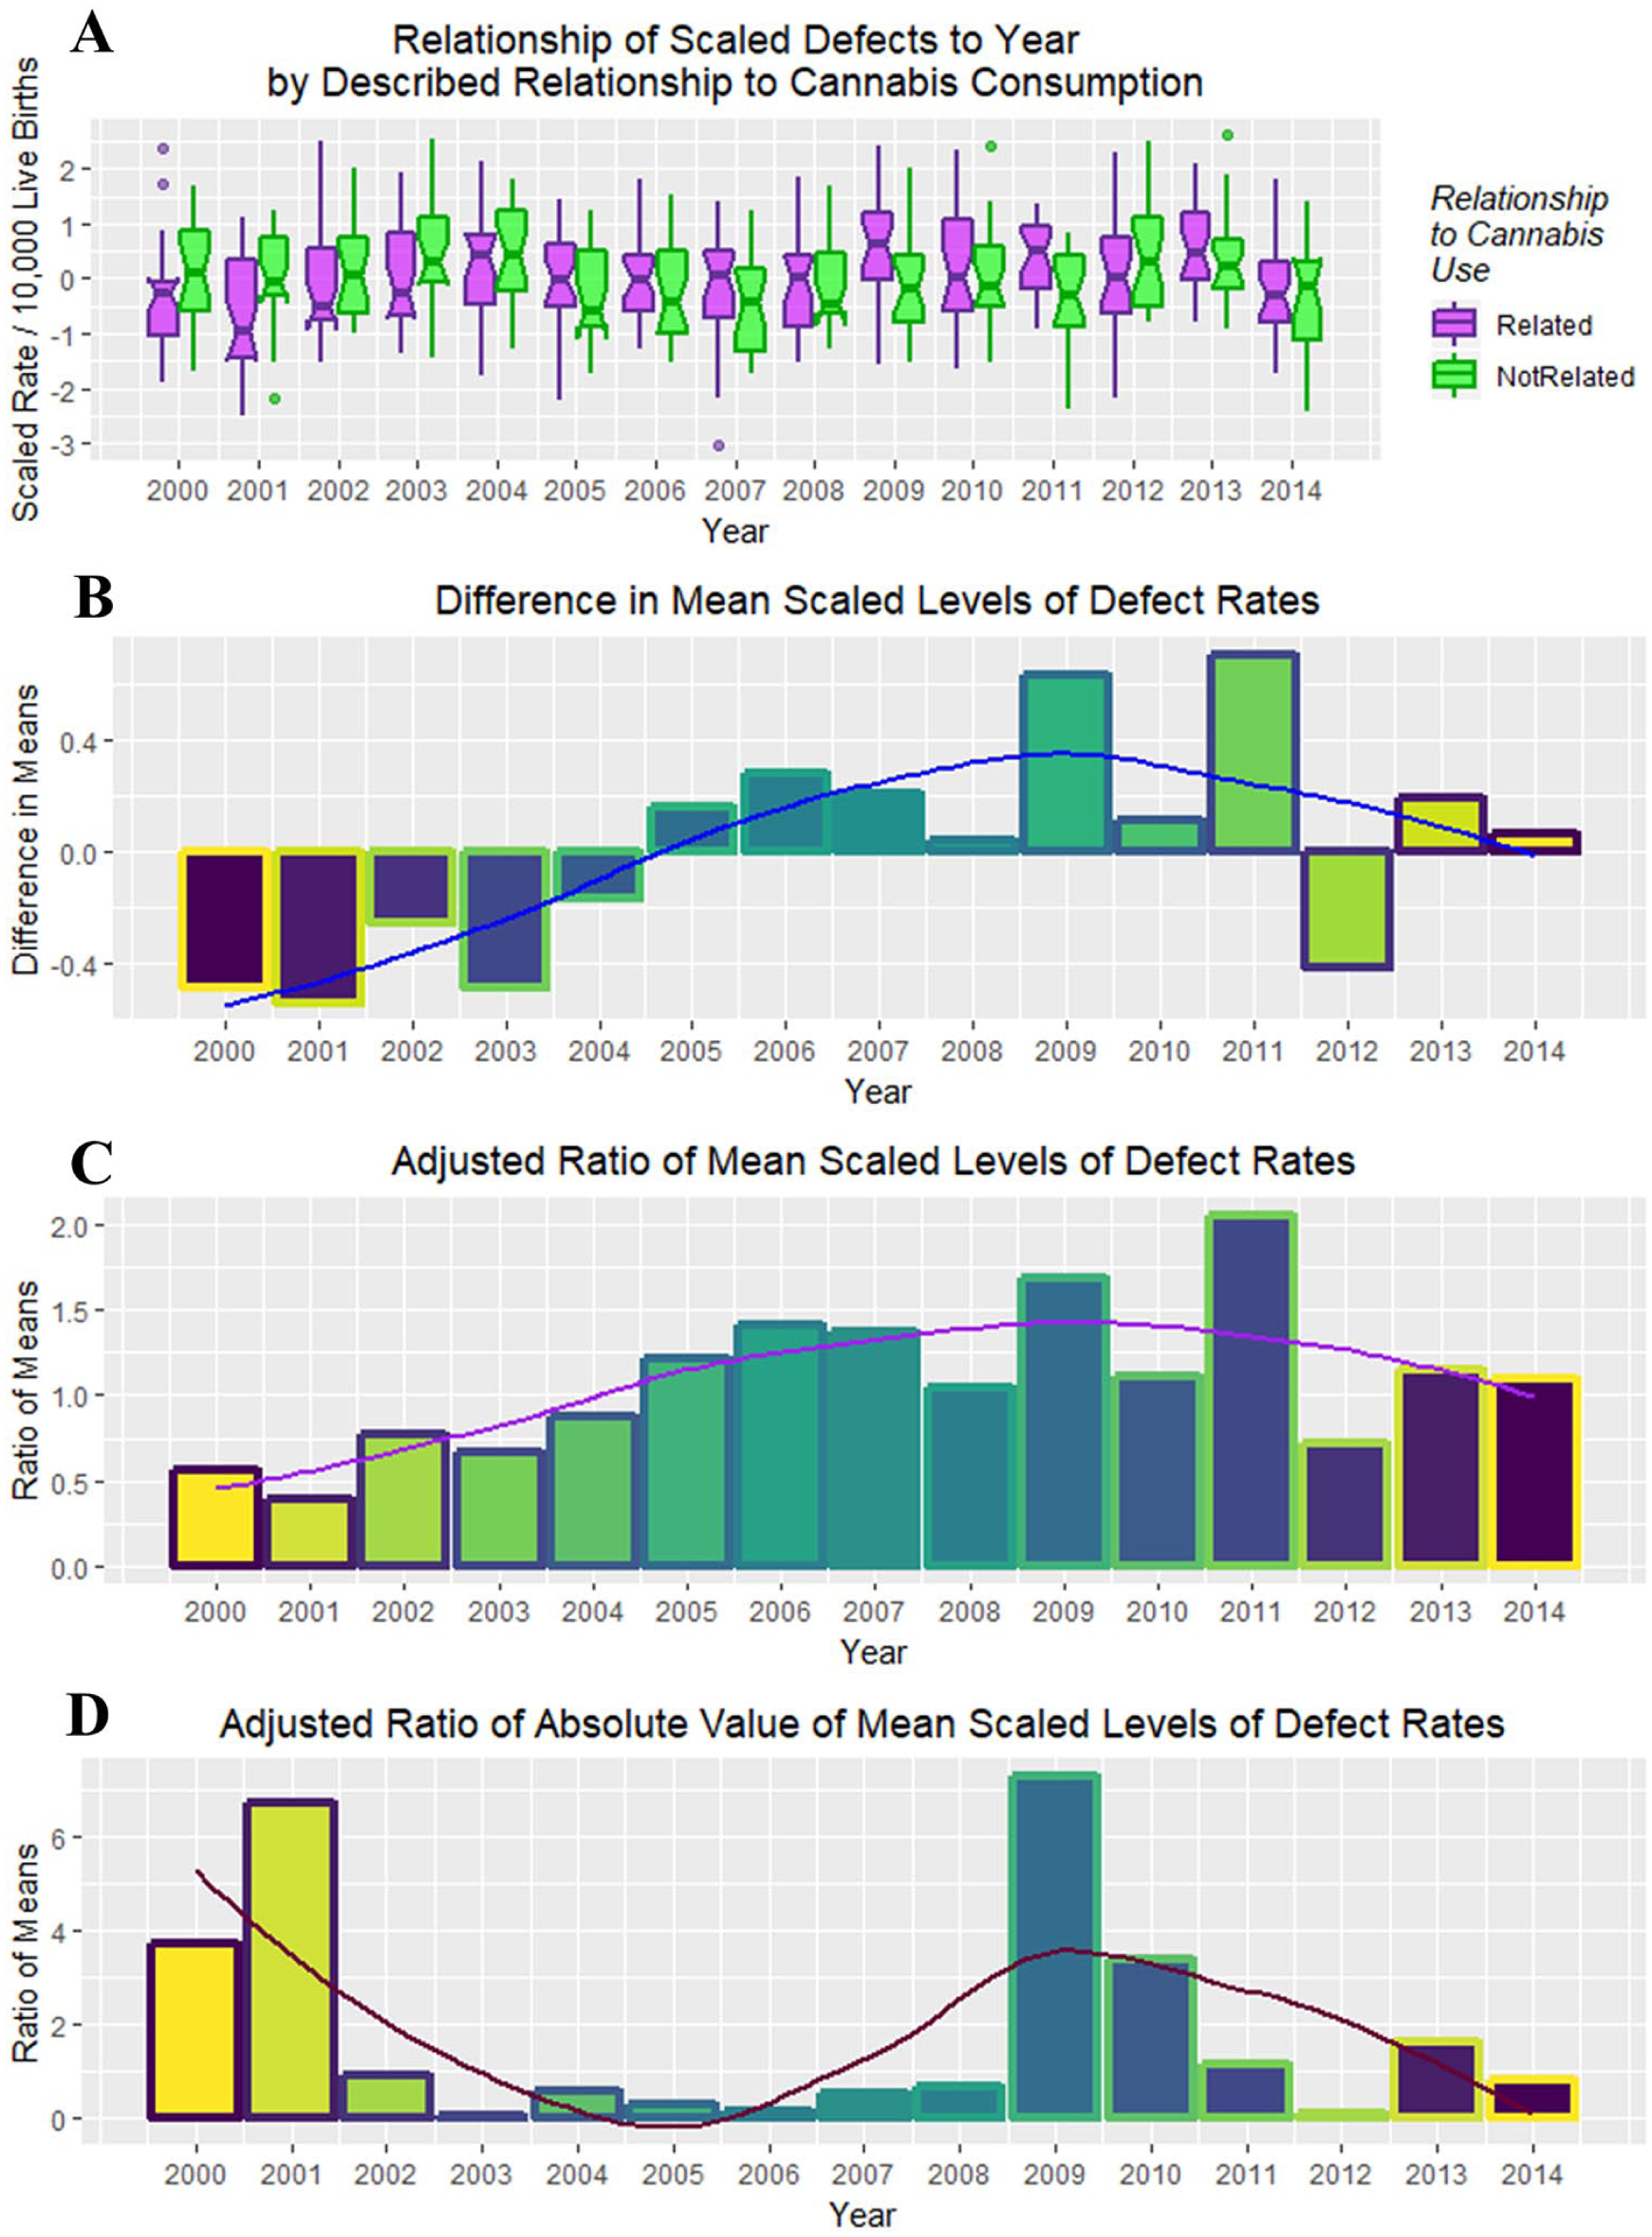
(A) Box plot of relationship of scaled defects to time by described relationship to cannabis use. (B) Difference between cannabis-related and non–cannabis-related rates of scaled scores. (C) Ratio of cannabis-related and non–cannabis-related scaled scores after adjustment by adding unity (1) to both scores. (D) The ratio of the absolute value of the cannabis-related defects to that of the absolute value of cannabis-unrelated defects.
Figure 9 and Table 2 showed that defects in 5 major organ systems are rising: central nervous system, cardiovascular, genitourinary, musculoskeletal, and respiratory systems. These 5 may then be combined by principal component analysis. A scree plot (Supplementary Figure 8, available online) shows that 1 principal component—PC1—was sufficient to combine these data and accounted for 90% of the variance. Together with total rates from the CRCSN dataset, this produces 3 summary statistics, the totals for 2013, 2014, and PC1.
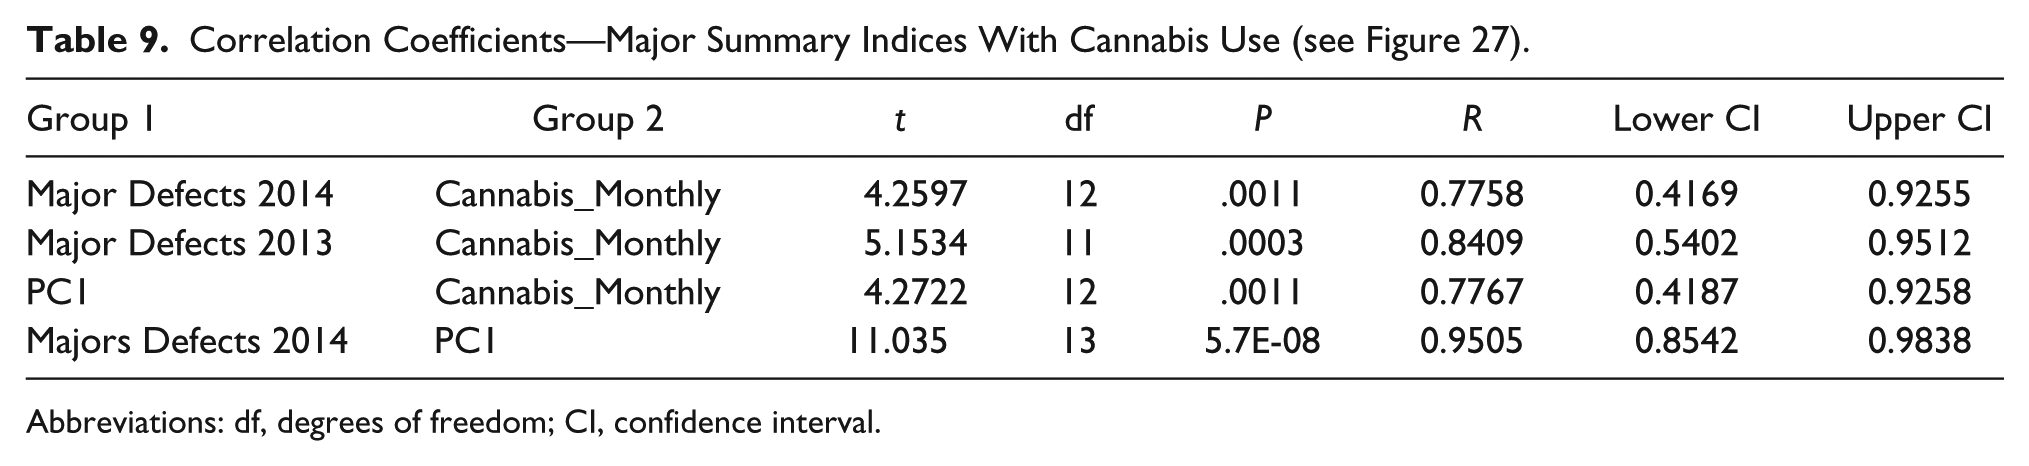
Figure 27 charts these parameters against each other along with the monthly cannabis exposure. A close visual relationship is immediately apparent. These correlations are presented formally in Table 9.
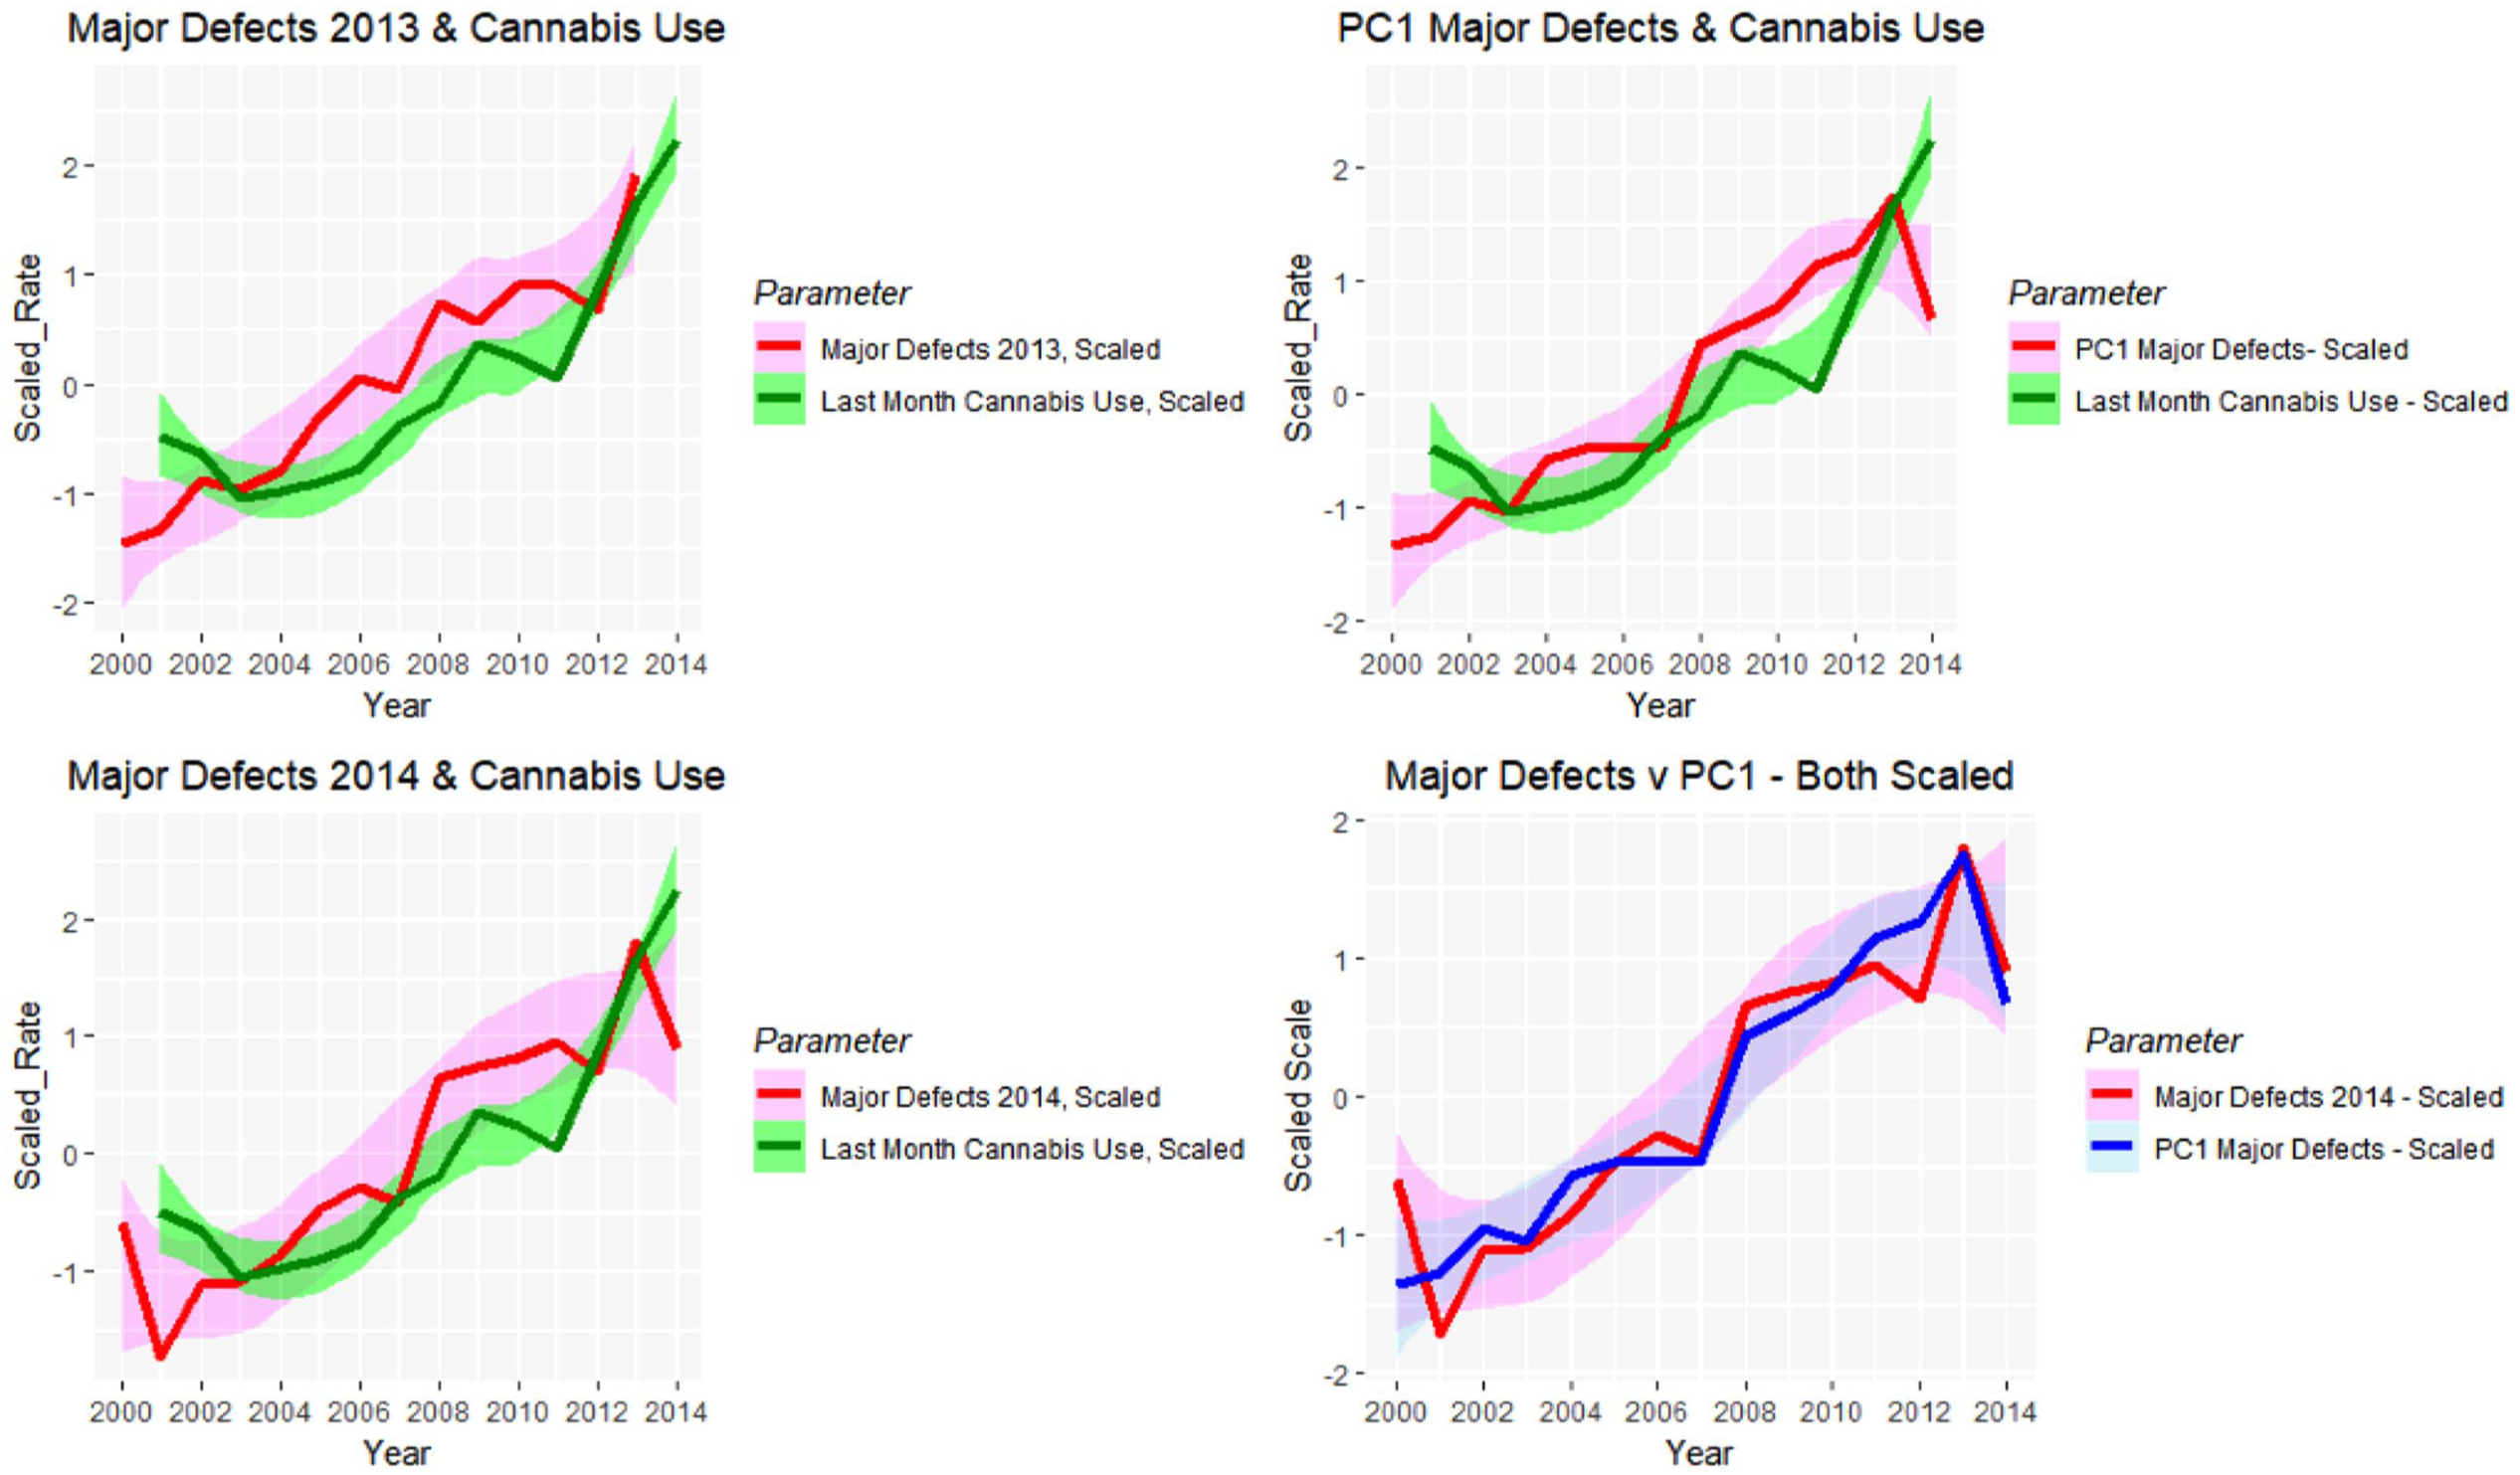
Line plots showing relationship between scaled (A) major defect rates 2013 and last month cannabis use; (B) major defect rates 2014 and last month cannabis use; (C) principal component 1 and last month cannabis use; (D) major defects 2014 and principal component 1 for 2014.
Correlation Coefficients—Major Summary Indices With Cannabis Use (see Figure 27).
Abbreviations: df, degrees of freedom; CI, confidence interval.
Table 10 summarizes the regression of all scaled defects against various drug combinations.
Linear Regression of Major Summary Indices by NSDUH Drug Exposure.
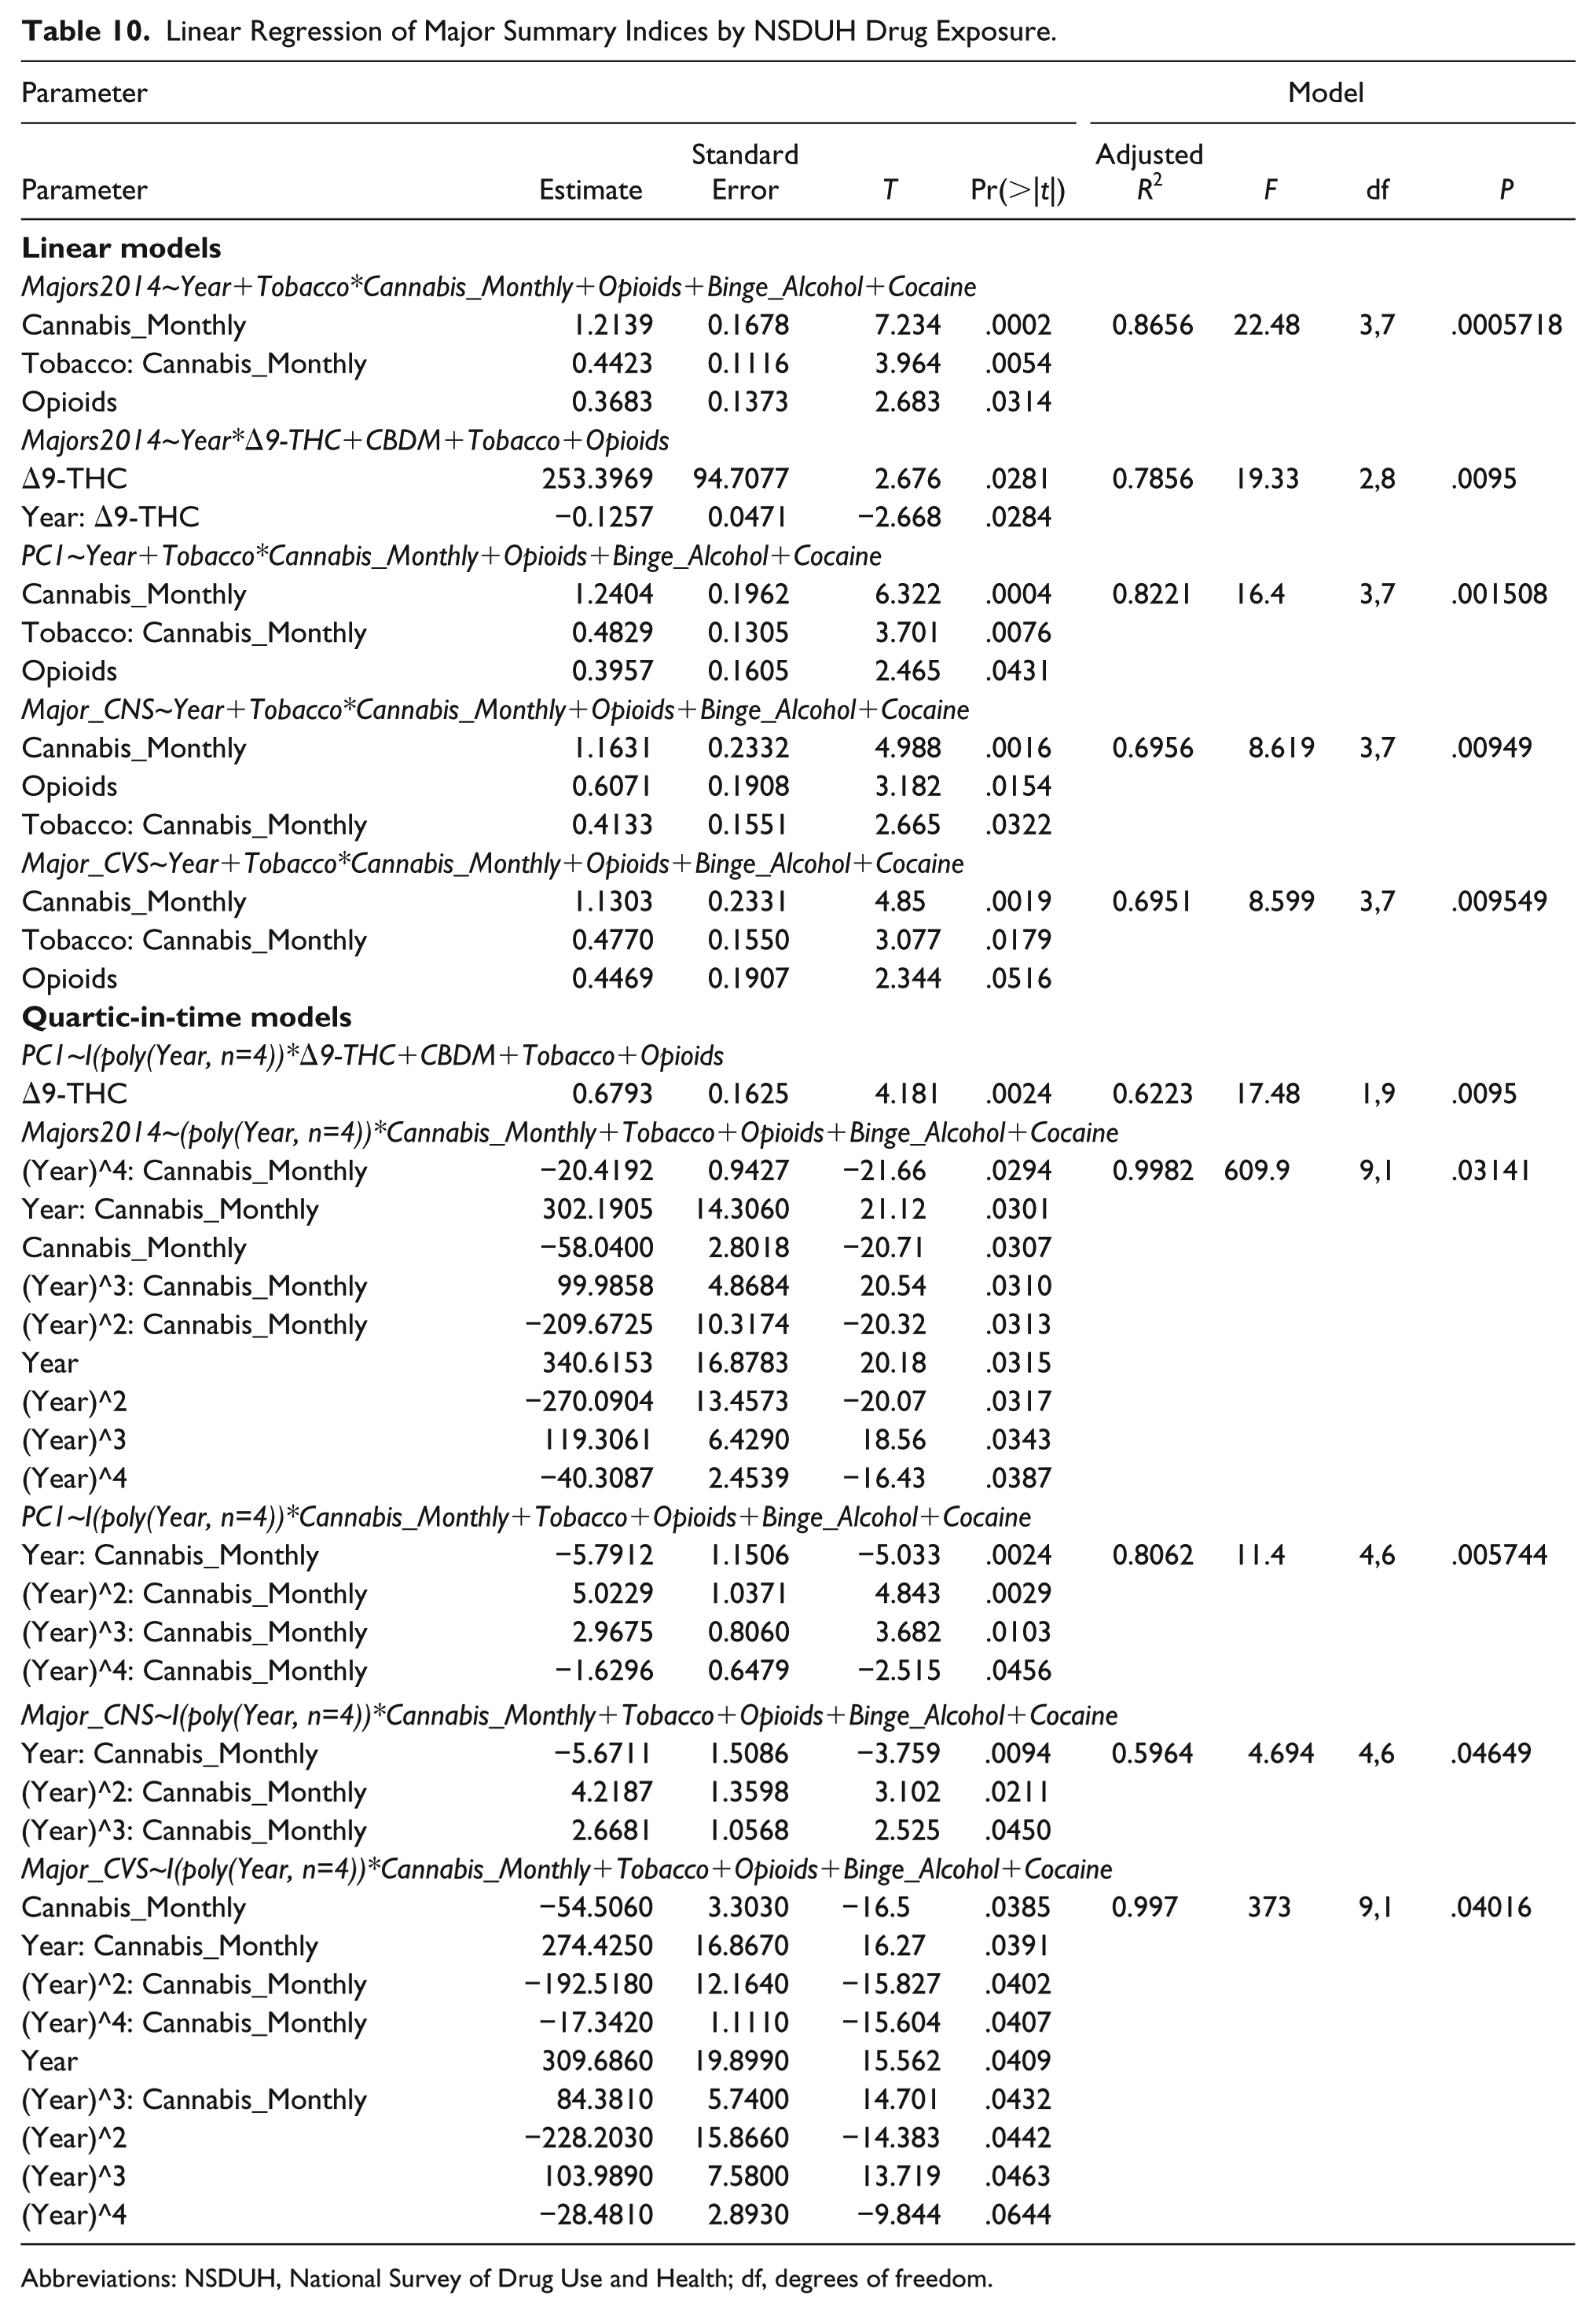
Abbreviations: NSDUH, National Survey of Drug Use and Health; df, degrees of freedom.
Table 11 is a regression summary for all scaled defects against various cannabinoids.
Linear Regression of Major Summary Indices Against Selected Cannabinoids.
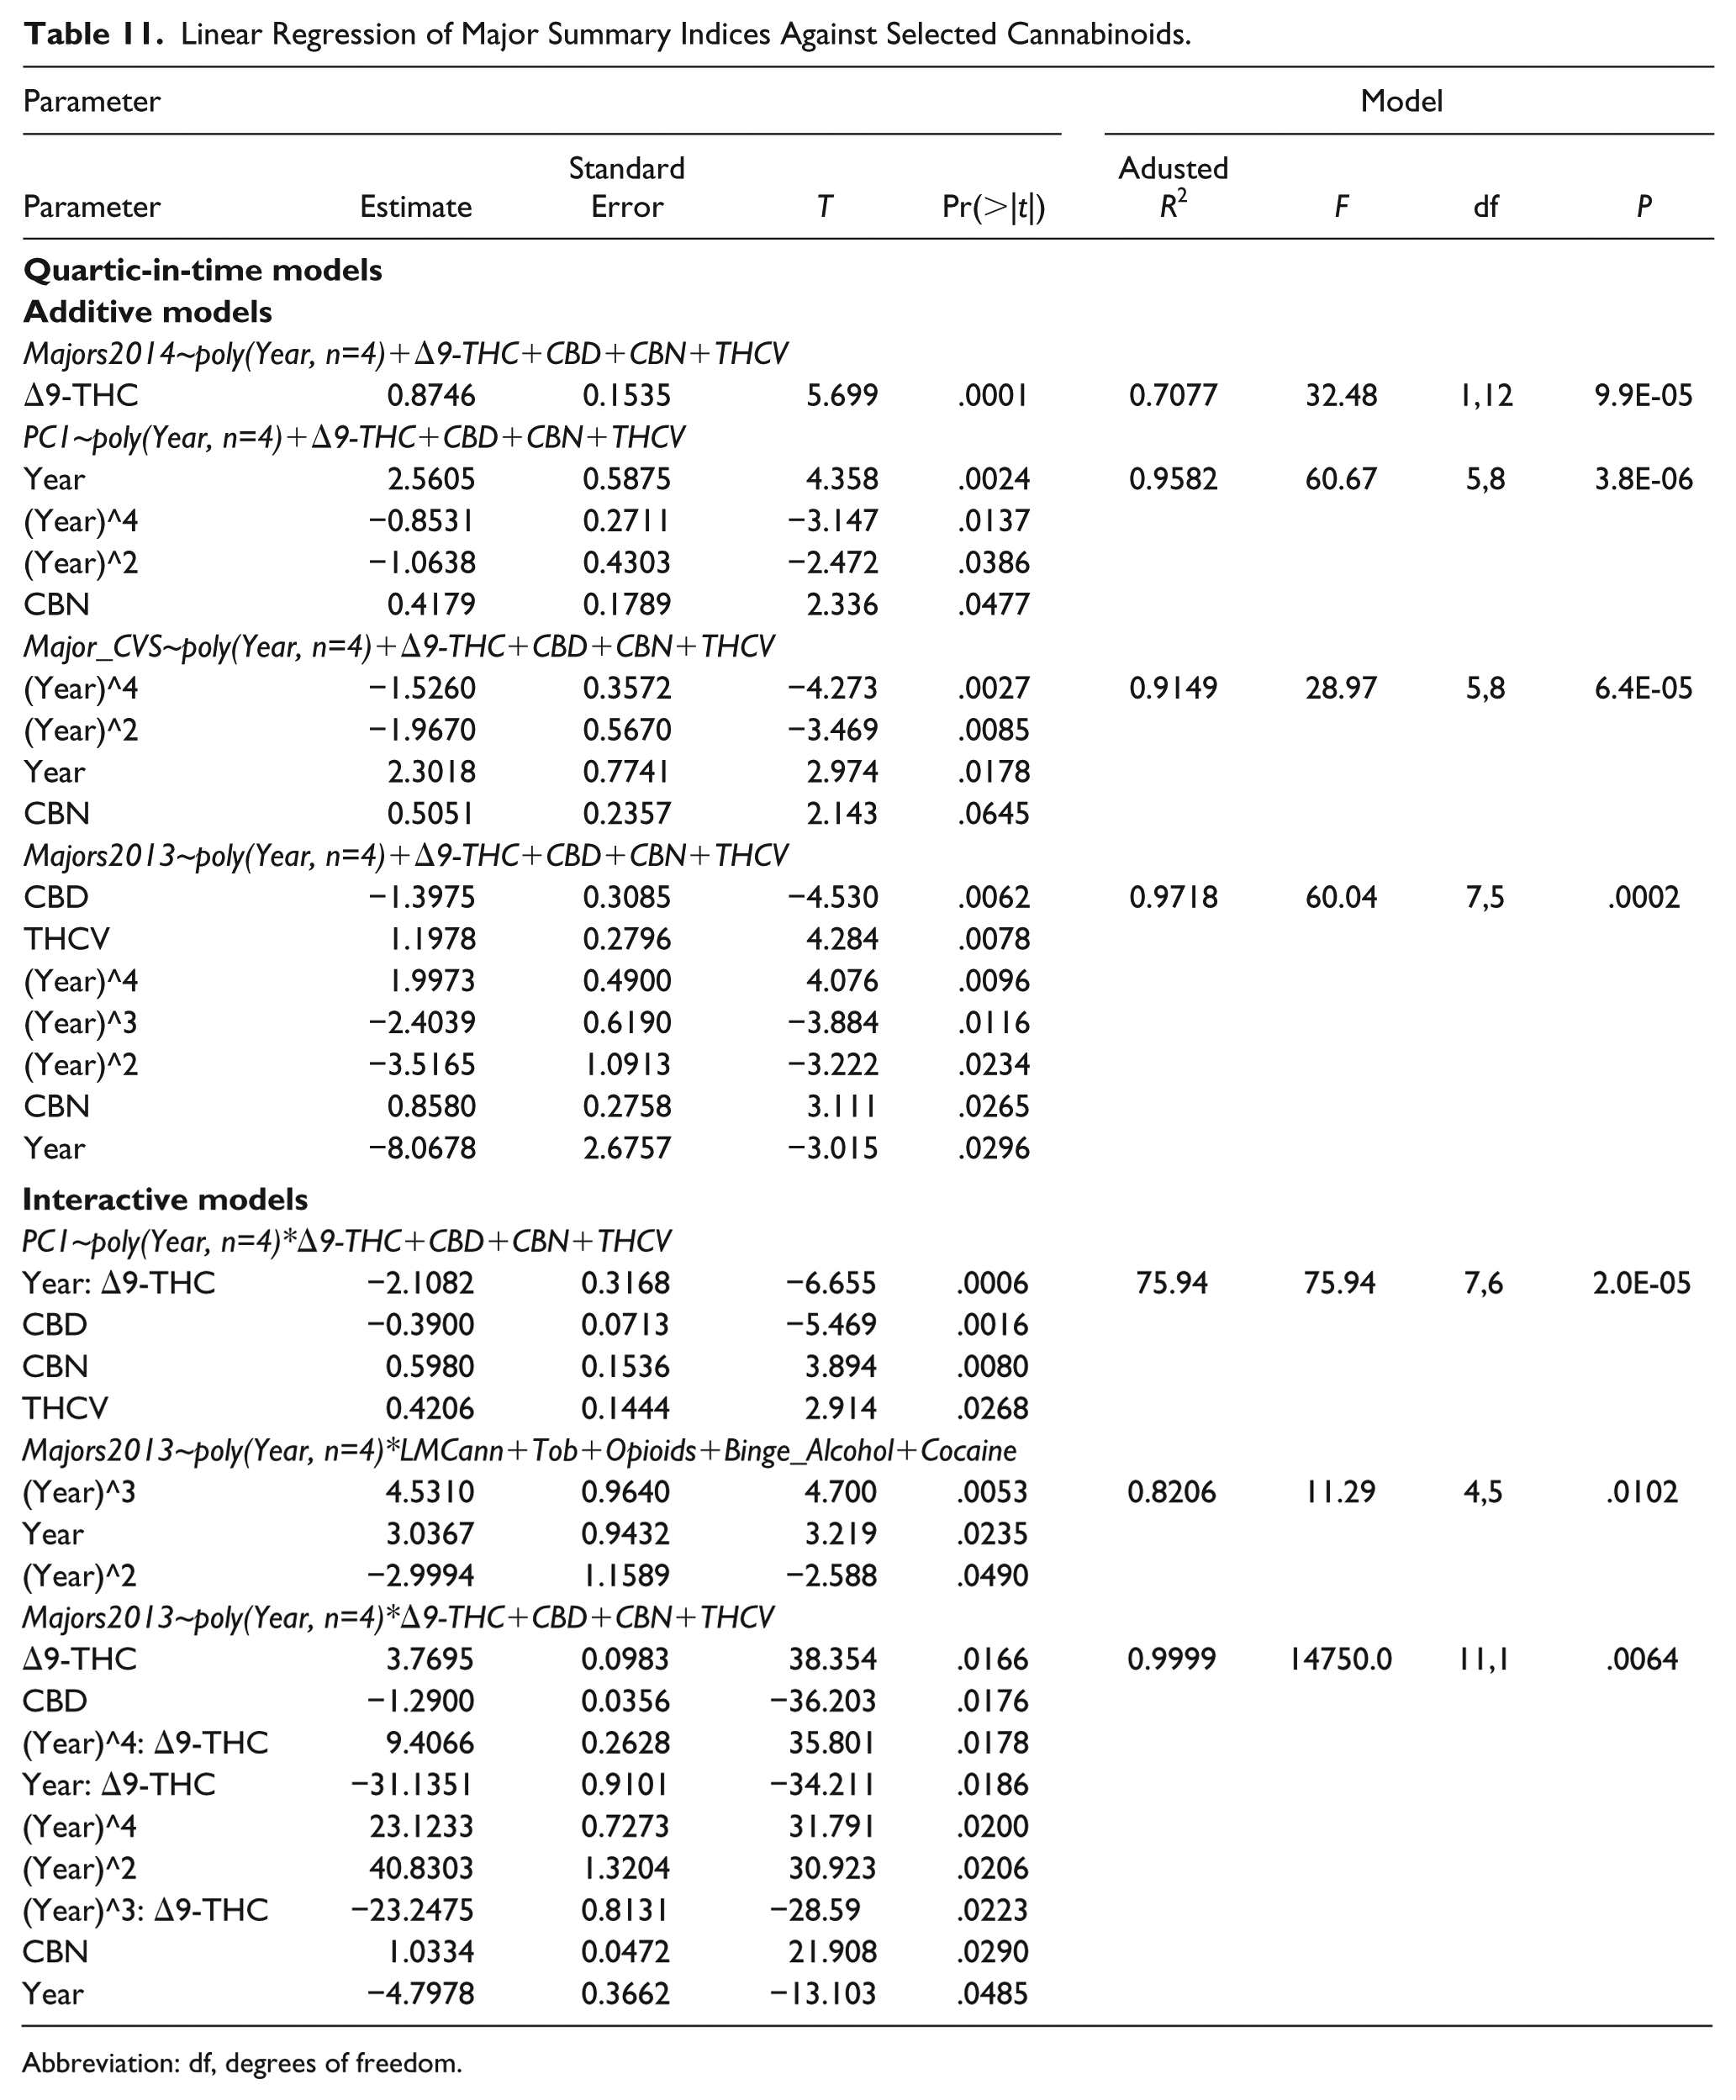
Abbreviation: df, degrees of freedom.
Table 12 presents final regression models of various key summary parameters against the indicated combinations of drugs and cannabinoids in linear and/or time-quartic models.
Linear Regression of Major Defect Indices Against Drugs and Cannabinoids Together.
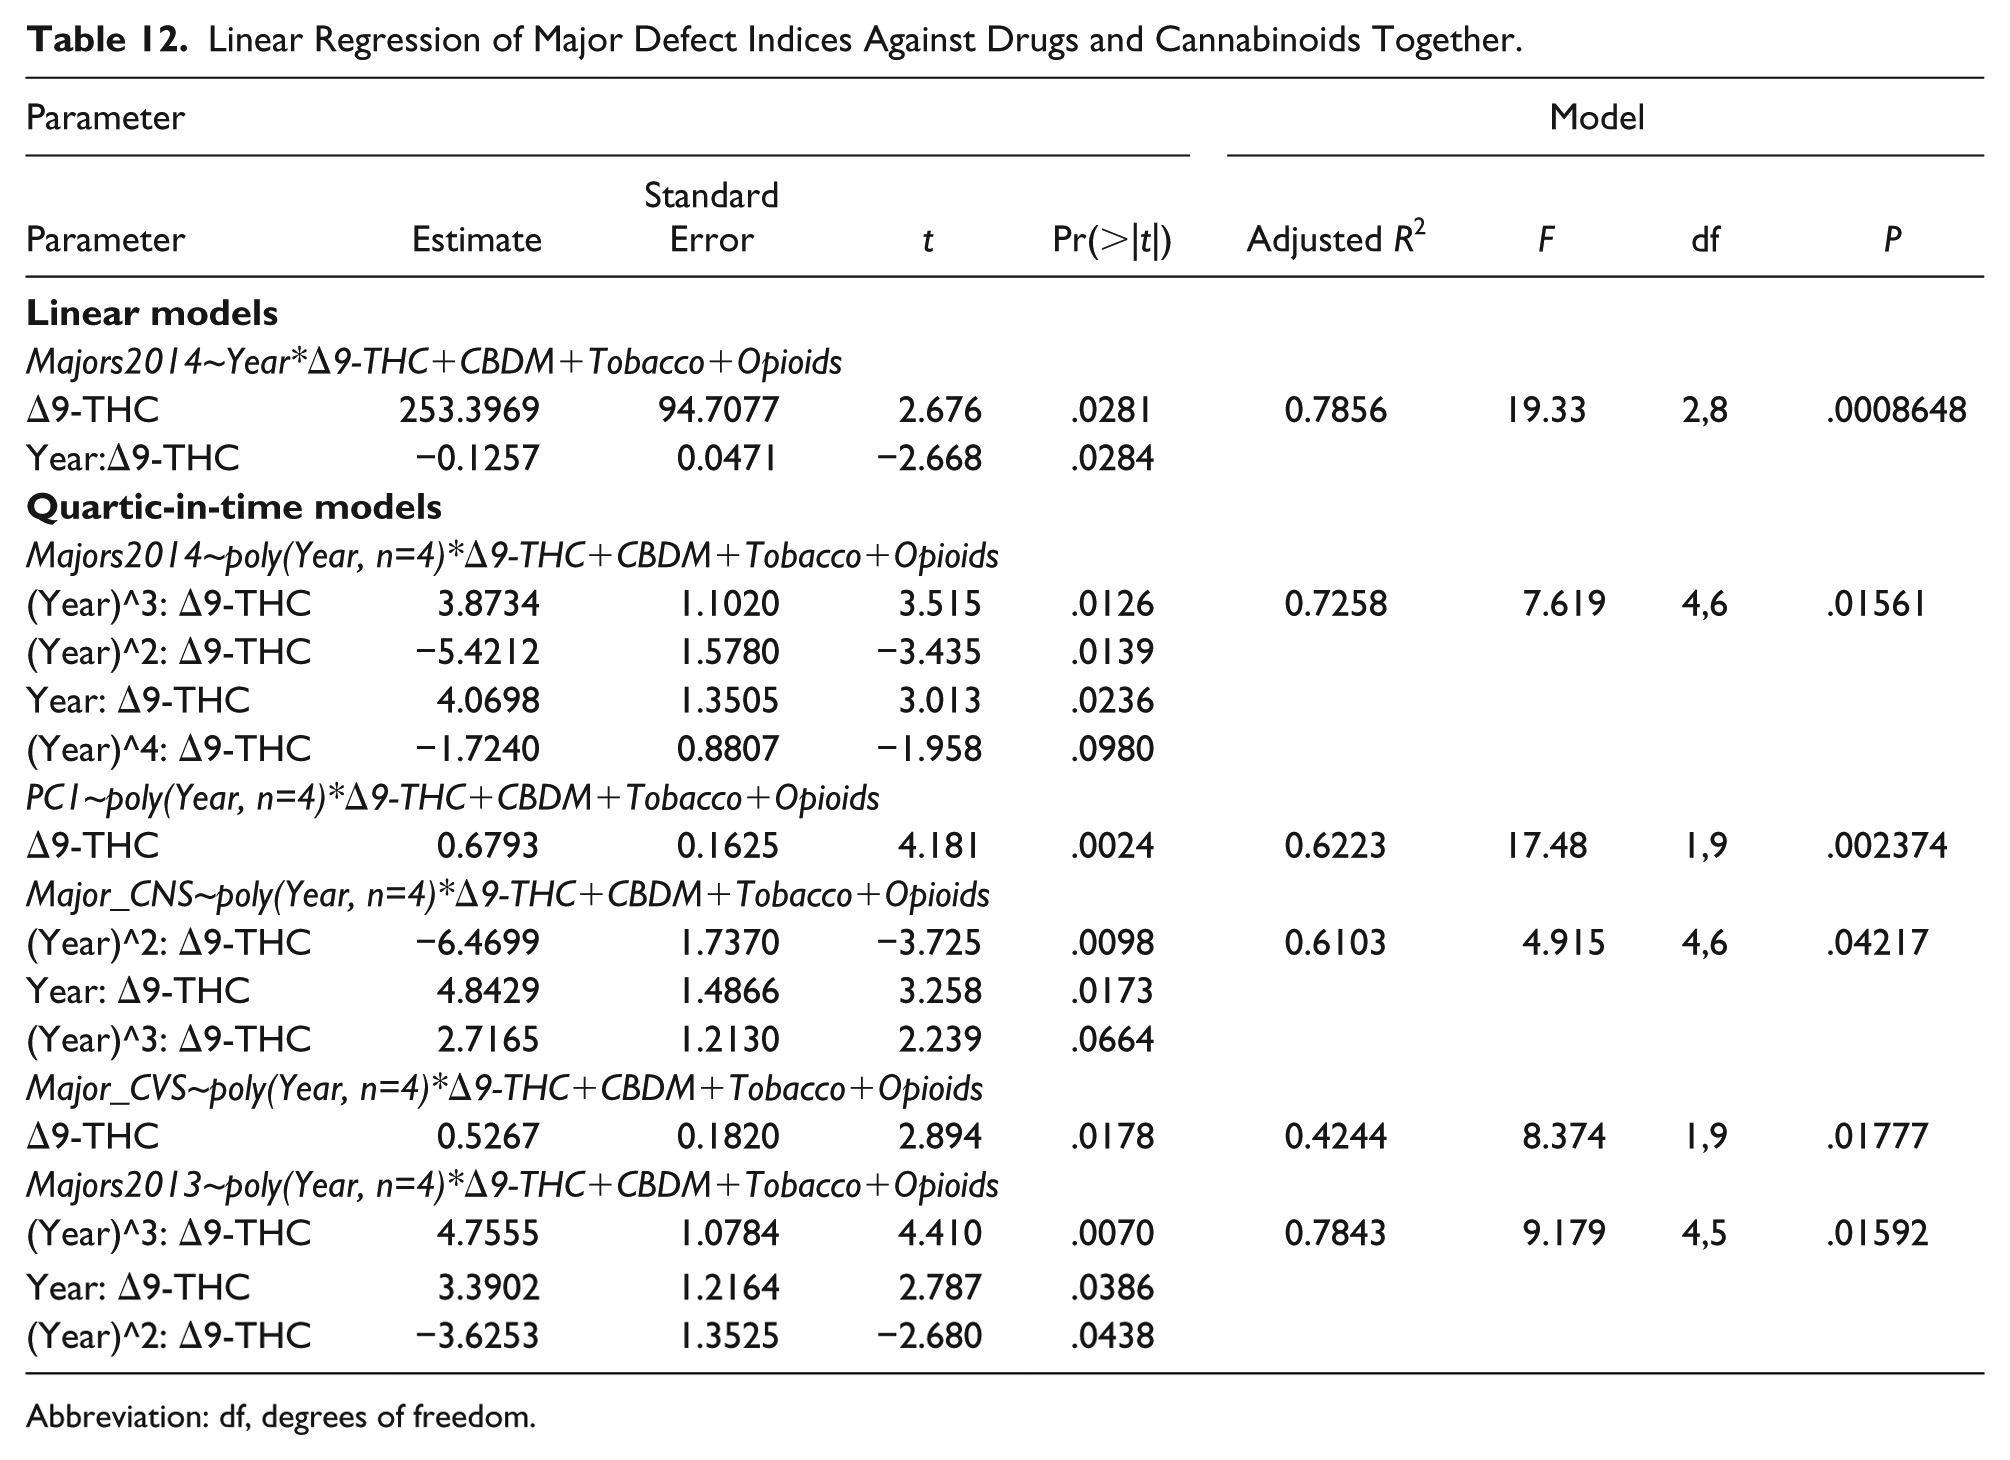
Abbreviation: df, degrees of freedom.
Discussion
This study portrays a detailed picture of congenital defects in the state of Colorado based on the latest intrastate defect registry data from CRCSN and provides compelling evidence that the generally rising pattern both of individual defects and of systems levels summary and total measures closely parallels the rise in cannabis use in Colorado in the context of static or falling levels of other drug use.
While there is substantial heterogeneity in the trend of birth defects in Colorado, the overall trend of the CRCSN dataset is upward, a trend that closely parallels cannabis use during the progression of that state toward cannabis legalization. This is reflected in some of the most common birth defects such as ASD, PDA, VSD, and Down’s syndrome and also in summary measures such as central nervous, cardiovascular, respiratory, chromosomal, and genitourinary defects, the overall total defects in both 2013 and 2014 and on principal component analysis. Indeed, ASD and PDA showed an uptick temporally associated with rising cannabis use. Cannabis use showed a statistically significant rise about 2007 related to the movement toward cannabis legalization. Moreover, the relationship to cannabis use was robust to multivariate adjustment with all other drug use. Data implicated several cannabinoids including Δ9-tetrahydrocannabinol, Δ8-tetrahydrocannabinol, tetrahydrocannabivarin, cannabinol, and cannabidiol. Although the relationship with cannabidiol is temporally complex, data show that the relative elevation of cannabis-related defects compared with non–cannabis-related defects peaked in 2009 to 2010 when cannabidiol exposure was peaking.
It should be underscored again that the reported changes are all at the associational level only: such a study cannot by itself establish or interrogate causal pathways.
Moreover, as has been described elsewhere, numerous published mechanistic reports link PCE with molecular pathways to teratogenesis and form a critical backdrop and highly pertinent context to the present report.18-23 This confluence of strong mechanistic links together with the present compelling teratological profile in the situation where the use of other drugs is uniformly static or falling strengthens the argument that causal pathways may be operating in clinical populations.
Space precludes detailed consideration of possible teratogenic mechanisms, but these have been addressed elsewhere.18-23 Neurotoxic mechanisms include withdrawal of glutamate receptors from synapses, 24 misconstruction of synapses from disruption of neurexin-neuroligin synaptic scaffolding, 25 excessive dendritic and spine pruning, 26 mitochondrial impairment, 27 stem cell inhibition, 28 CB1R-mediated neuraxis inflammation, 29 and cytoskeletal impairment and motility disruption. 30 Cardiovascular toxic mechanisms include inflammatory vasculitis and CB1R signaling to CB1R-rich endovascular and endocardial tissues.31,32 Importantly, cannabis has been described as blocking both notch33,34 and robo-slit receptor-ligand 35 signaling, which are important as both neuronal and vascular guidance cues, 36 and critically involved in heart and brain morphogenesis. 36 Cannabis induces severe epigenetic disruption22,37-39 and has long been known to stimulate micronucleus formation and genetic anomalies secondary to chromosomal missegregation.22,40
The present work did not have access to Coloradan early termination of pregnancy for anomaly data. Since many of the defects mentioned are known to be carefully sought by prenatal screening programs and have high applicable termination rates, the present results represent underestimates and set a lower bound for effect, which is likely to be greatly exacerbated by incorporation of the complete dataset.
Some discussion of the attribution of cannabis association to the listed defects is appropriate. Many of the defects listed as cannabis-associated have been attributed as such based on the large population survey of Forrester and Merz from Hawaii in 2007. 15 While this article is an outlier in the clinical cannabis-related teratogenesis literature, albeit highly concordant with previous animal studies,1,2 its very uniqueness places it in a signal position to face the most stringent test of predictive theories, namely, the test of prediction of future trends. By this test, the Forrester-Merz article towers above the remainder of the literature. It alone predicts the increased incidence of ASD, Downs’ syndrome, microcephaly, and chromosomal defects found in the present study. Moreover, this is the only study that explains the current pattern of cannabis-related defects such as ASD, Down’s syndrome, VSD, encephalocele, limb reductions, anotia, and gastroschisis across the high cannabis-using states of the United States 41 and recently reported elevated rates of limb defects in France in hemp-fed cattle and babies.42,43 As noted above, pyloric stenosis was omitted from the cannabis-related group as it has not been independently verified by other studies, and spina bifida is believed to share much in common with other neural tube closure defects such as anencephalus so this has been included.
Four of 4 longitudinal studies of cortical executive functioning following PCE indicate serious deficits in cerebral associational function.44-48 Data on these deficits are not included within the CRCSN dataset, which therefore forms an additional disease burden to that described above. However, one notes that there has been a movement in Colorado for several years to declare a state of medical emergency related to a rapidly accelerating renaissance of autistic spectrum disorders in that community. 49 Importantly, rapid growth of autism in Colorado may shortly overshadow the classical anomalies described in the present report, which again suggests that this work describes a lower bound of cannabis teratogenesis.
Taken together, these various data imply that the full spectrum of cannabis-associated defects is potentially much broader than has previously been delineated. It may still be expanding.
A major finding of this statistical study was that models quartic in time outperformed strictly linear models. This suggests a feed-forward–type positive-feedback process.
In October 2018, the CRCSN revised their total database from 2000 to 2014 without explanation in a manner that mainly affected the total congenital anomalies. The previous historical totals from 2000 to 2013 appear as indicated.
This study has several strengths. Colorado is unusual among the United States in that it makes extracts from its birth defects register publicly available. Colorado is also unusual as it is one of the only states with legal cannabis to do so. This study also utilizes the very large nationally representative NSDUH dataset to assess intrastate drug exposure. Limitations include the lack of individual-level drug use data, which might be available to a case-control study. Due to the uncertainties involved with self-report studies, 6 we would suggest that future studies employ objective evidence of drug exposure such as hair analysis. 50
Conclusion
An excess of 11 753 to 20 152 birth defects occurred in Colorado from 2000 to 2014, which represents a 6.7- to 9.4-fold excess of growth in defects compared with growth in births. Defects in 6 of 8 major organ systems increased significantly in frequency. While other drug use was falling over this period, cannabis use alone rose. Cannabis and many cannabinoids were shown to be associationally linked with this rise with correlation coefficients up to 0.78, were confirmed on bivariate analysis, and were robust to multivariate adjustment. In the context of multiple mechanistic pathways, causality is strongly implied. Longitudinal case-control series denominated by an objective measures of drug use are indicated.
Author Contributions
ASR did the background research, analyzed data and wrote the first draft. GKH provided supervision, provided administrative, professional and academic support of several types, provided meaningful intellectual input and co-wrote the final draft of this paper.
Supplemental Material
Supplementary_Table_and_figures – Supplemental material for Cannabis Teratology Explains Current Patterns of Coloradan Congenital Defects: The Contribution of Increased Cannabinoid Exposure to Rising Teratological Trends
Supplemental material, Supplementary_Table_and_figures for Cannabis Teratology Explains Current Patterns of Coloradan Congenital Defects: The Contribution of Increased Cannabinoid Exposure to Rising Teratological Trends by Albert Stuart Reece and Gary Kenneth Hulse in Clinical Pediatrics
Footnotes
Declaration of Conflicting Interests
The author(s) declared no potential conflicts of interest with respect to the research, authorship, and/or publication of this article.
Funding
The author(s) received no financial support for the research, authorship, and/or publication of this article.
Supplemental Material
Supplemental material for this article is available online.
References
Supplementary Material
Please find the following supplemental material available below.
For Open Access articles published under a Creative Commons License, all supplemental material carries the same license as the article it is associated with.
For non-Open Access articles published, all supplemental material carries a non-exclusive license, and permission requests for re-use of supplemental material or any part of supplemental material shall be sent directly to the copyright owner as specified in the copyright notice associated with the article.