
Abstract
In this article, we propose and compare some old and new parametric and nonparametric bootstrap methods for MSE estimation in small area estimation, restricting to the case of the widely used Fay-Herriot model. The parametric method consists of generating parametrically a large number of area bootstrap samples from the model fitted to the original data, re-estimating the model parameters for each bootstrap sample and then estimating the separate components of the MSE. The use of double-bootstrap is also considered. The nonparametric method generates the samples by bootstrapping standardized residuals, estimated from the original sample data. The bootstrap procedures are compared to other methods proposed in the literature in a simulation study, which also examines the robustness of the various methods to non-normality of the model error terms. A design-based MSE estimator for the Fay-Herriot model-dependent predictor is also described and its performance is investigated in a separate simulation study.
Introduction
Over the last four decades, there is growing demand all over the world for reliable estimates of small area parameters such as means, counts, proportions or quantiles. The estimates are used for fund allocations, new social and health programs, and more generally, for short and long term planning. Small area estimates (SAE) are also used for testing, correcting and supplementing administrative records. Although commonly known as small area estimation’, the domains of study may consist of socio-demographic subgroups as defined, for example, by gender, age and race, or the intersection of such domains with geographical locations.
The problem of SAE is that the sample sizes in at least some of the domains of study are very small, and often there are no samples available for many or even most of these domains. In such cases, the direct estimates obtained from a survey are unreliable with unacceptable large variances, and no direct survey estimates can be computed for areas with no samples. SAE methodology addresses therefore the following two major problems:
1. How to obtain reliable estimates for each of the areas, 2. How to assess the error of the estimators (MSE, confidence intervals, etc.).
In the present article, we restrict to the popular Fay-Herriot[7] model and consider the estimation of the MSE of the Empirical Best Linear Unbiased Predictor (EBLUP). Due to time limitation, we only consider areas with samples. The computation of reliable MSE estimators in SAE problems is complicated because the models in use and the small sample sizes within the areas require accounting for the contribution to the error resulting from estimating the model parameters. Several procedures have been proposed in the literature, some of which we consider and compare in a simulation study in the present article. Our main goal is to propose new parametric and nonparametric bootstrap procedures for MSE estimation with correct order of bias, which to the best of our knowledge have not been proposed in the literature in the context of SAE. The parametric method consists of generating parametrically a large number of area bootstrap samples from the model fitted to the original data, re-estimating the model parameters for each bootstrap sample and then estimating separately or jointly the components of the MSE. The double bootstrap procedure is also considered. The nonparametric method generates the samples by bootstrapping standardized residuals computed from the original sample data.
In Section 2, we define the model, the resulting predictors and their theoretical MSEs. In Section 3 we describe two, commonly used estimators of the variance of the random effects, which is a major component of the model. Section 4 contains our proposed parametric and nonparametric bootstrap MSE estimators. Other procedures for MSE estimation proposed in the literature, including estimation of the randomization MSE over all possible sample selections are described in Section 5. In Section 6, we report the results of a simulation study, which compares the MSE estimators considered in the article. We conclude with some brief comments in Section 7.
The Fay-Herriot Area Level Model, Estimators and MSE’s
This model is in broad use when the sample information is only available at the area level. It was used originally by Fay and Herriot[7] (hereafter FH) for predicting the per-capita income in geographical areas of less than 500 residents.
Denote by

where

The predictor (2.2) is a composite estimator’ with weight

REMARK 1. Equation (2.3) holds also without the normality assumptions. The normality assumptions guarantee that the predictor (2.2) attains the minimum MSE.
When

The BLUP is thus,

The MSE is,

where

REMARK 2. The BLUP property and the MSE expression (2.6) are valid without the normality assumptions of the error terms.
In practice, both

where
The question arising is how to estimate
In what follows we describe two procedures that we use in our simulation study:
where Solve iteratively,
where


REMARK 3. The estimators defined by (3.1) and (3.2) satisfy (i)
REMARK 4. Pfeffermann and Nathan[16] proposed a similar estimator to
REMARK 5. Several other procedures have been proposed in the literature for estimating the variance
MSE Decomposition
The EBLUP is defined by (2.8). The prediction error can be decomposed as,

where
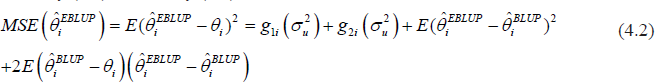
Under normality of the model error terms (sampling errors and random effects), and for estimators
The method consists of the following steps:

where
The term
Using similar arguments to Pfeffermann and Tiller[17], it follows that under mild regularity conditions, the MSE estimator (4.3) has bias of order
REMARK 6. Pfeffermann and Tiller[17] consider MSE estimation of EBLUP state predictors in the context of state-space models, which contain the FH model as a simple special case.
REMARK 7. Butar and Lahiri[1] likewise developed the MSE estimator (4.3) although in a different way, and showed that it has bias of order
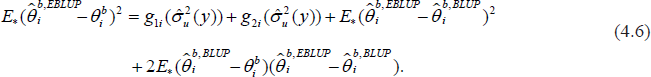
The MSE estimator defined by (4.3) assumes that the model error terms are normally distributed and hence that the cross product expectation in (4.2) is zero. When this is not the case, the cross-product expectation may not vanish. Assuming that the true distributions of the random errors are known, one needs to generate the bootstrap samples in Step

where
An alternative parametric bootstrap estimator, also resulting from Pfeffermann and Tiller[17], is obtained by replacing (4.3) by

where
The estimator (4.5) is equivalent asymptotically to the estimator (4.3), but it has the potential advantage of robustness against non-normal distributions of the model error terms. To see this, denote by
Thus, the expression
For nonparametric bootstrap, we propose using the original estimates of

Note:

Note:

where
REMARK 8. The estimator (4.9) is essentially the same as (4.3), but based on nonparametric bootstrap. Notice, however, that by bootstrapping the estimated standardized residuals, it is no longer possible to generate true’ bootstrap area means
REMARK 9. In a discussion to an article by Jiang and Lahiri[12], the late Professor Peter Hall reckons that “small area methods are motivated when data are scarce, and it is exactly in such cases that informed parametric techniques can enjoy statistical advantages over their more adaptive nonparametric cousins. Parametric bootstrap methods therefore have an important role to play’’. Our simulation results in Section 6 do not backup this statement, at least for small m
Estimators Based on Taylor Approximations
Prasad and Rao[20] show that under normality of the model error terms, the MSE of the EBLUP computed with an estimator

where

where
REMARK 10. Lahiri and Rao[13] show that the estimator (5.2) is robust to non-normality of the distribution of the model random effects.
Datta et al.[5] consider the case where

where

An alternative approach for estimating the MSE of the EBLUP is the use of Jackknife procedures. Jiang et al.[11] (hereafter JLW), develop a unified theory for estimation of the MSE of empirical best predictors (EBP) under a general class of mixed models, which includes the FH model as a simple special case. Recall that for the FH model with normal error terms,
Similarly to (4.1),
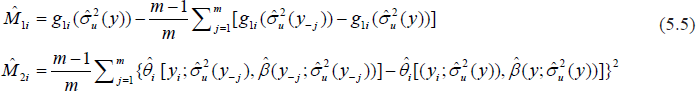
In (5.5),
REMARK 11. Lohr and Rao[15] propose a modification of the estimator (5.5), which is simpler computationally and estimates the conditional MSE,
Chen and Lahiri[2], develop the following Jackknife estimator:
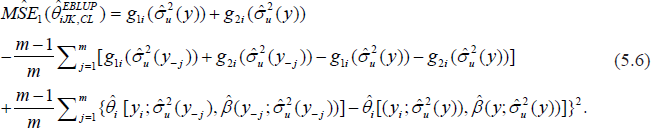
For the case where the estimator
Chen and Lahiri[3], approximate additionally the last expression of (5.6) by
REMARK 12. Under normality of the error terms
Hall and Maiti[9], propose estimating the MSE by use of double-bootstrap. For the FH model (2.1), the procedure consists of the following steps, where we denote by


Denote

REMARK 13. The 1st step bootstrap estimator (5.8) has bias of order
REMARK 14. The computation of the double bootstrap estimator is very computing intensive when applied with large
All the MSE estimators considered so far are model dependent, in our case for the FH model, accounting for all sources of variation. This implies that the target area means are viewed as random, which is different from classical survey sampling theory under which the finite population values, and hence the area means, or other parameters of interest are considered as fixed values. However, users of sample survey estimates are used to measures of error such as MSE, which only account for the variability originating from the randomness of the sample selection (known as the randomization distribution), that is, the MSE over all possible sample selections from the target finite population, with the population values of the survey variables held fixed. We refer to this MSE as the design-based MSE, denoted hereafter, DMSE.
Pfeffermann and Ben-Hur[19] propose a method for estimating the DMSE of model-dependent small area predictors. The proposed method models the DMSE as a function of known area statistics by repeatedly drawing samples from appropriately generated synthetic populations, and then applies the model to the original sample. The procedure follows a method of bias correction developed by Pfeffermann and Correa[18] for unit-level model dependent MSE estimation, with appropriate modifications.
The DMSE is defined as,

where

For known parameters, an unbiased estimator of

Hence, for large

where
The DMSE estimator

Pfeffermann and Ben-Hur[19] designed several simulation studies comparing their proposed method to other DMSE estimators proposed in the literature.
Simulation Setup and Results for MSE Estimation Under the Model
In order to assess and compare the performance of the model dependent MSE estimators considered in Sections 4 and 5, we conducted a Monte Carlo simulation study, designed as follows:
We generated a large number
We consider 3 combinations of distributions for the random effects,
We started by generating
Next, for each of the three combinations of model error distributions and for each of the MSE estimators, we generated
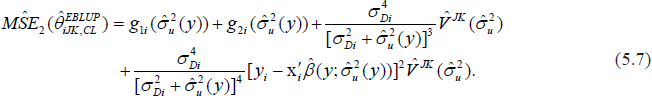
Tables 1–6 summarize the outcomes of the simulation study. The results refer to the following estimators: Prasad-Rao MSE estimator (Eq. 5.2), the DRS estimator (Eq. 5.3), the Jackknife estimator (Eq. 5.7), the Nonparametric Bootstrap estimator (Eq. 4.9) and the three bootstrap estimators–the parametric bootstrap estimator Eq. (4.3) (adding twice Eq. (4.4) when sampling from the exponential distributions), the Double bootstrap estimator Eq. (5.10) and the first stage bootstrap estimator Eq. (5.8). The simulation results of the alternative parametric bootstrap estimator Eq. (4.5) are not presented as they are very similar to the results of the parametric bootstrap estimator Eq. (4.3).
For the parametric bootstrap estimator and the first stage bootstrap estimator we used
We used the correction
Tables 1–3 show the true MSEs and the percent bias of the various MSE estimators, separately for each of the sampling variances
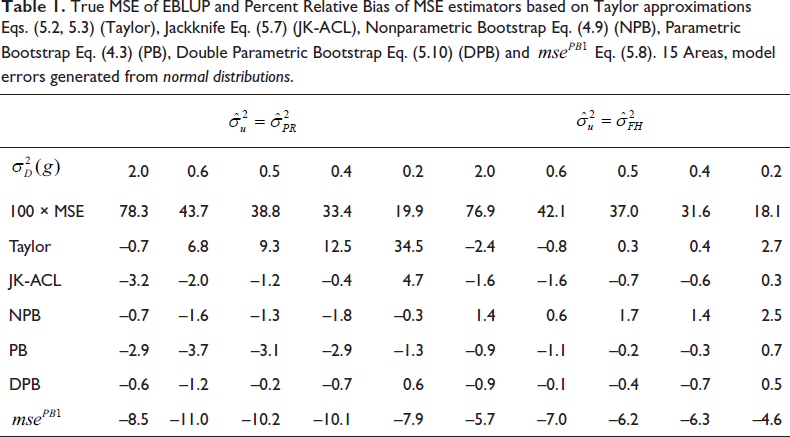
Table 1 shows the results for the case where the distributions of the two error terms are normal. As can be seen, in this case the biases are low, except for the Taylor estimator with
True MSE of EBLUP and Percent Relative Bias of MSE estimators based on Taylor approximations Eqs. (5.2, 5.3) (Taylor), Jackknife Eq. (5.7) (JK-ACL), Nonparametric Bootstrap Eq. (4.9) (NPB), Parametric Bootstrap Eq. (4.3) (PB), Double Parametric Bootstrap Eq. (5.10) (DPB) and
Eq. (5.8). 15 Areas, model errors generated from normal distributions.
Table 2 shows the results obtained when the sampling errors are sampled from normal distributions, but the random effects are sampled from the location exponential distribution. The results of the parametric bootstrap estimators under the correct model, that is, when generating the bootstrap samples by drawing from the correct distribution of the random effects are labelled by E. The results when the random effects are wrongly assumed to be generated from the normal distribution are labelled by N.
True MSE of EBLUP and Percent Relative Bias of MSE estimators based on Taylor approximations Eqs. (5.2, 5.3) (Taylor), Jackknife Eq. (5.7) (JK-ACL), Nonparametric Bootstrap Eq. (4.9) (NPB), Parametric Bootstrap Eq. (4.3) (PB), Double Parametric Bootstrap Eq. (5.10) (DPB) and
Eq. (5.8). 15 Areas, Random Effects generated from location exponential distribution, Sampling Errors generated from normal distribution. Parametric Bootstrap samples generated from the true random effect distribution (E) and by assuming a normal distribution (N).
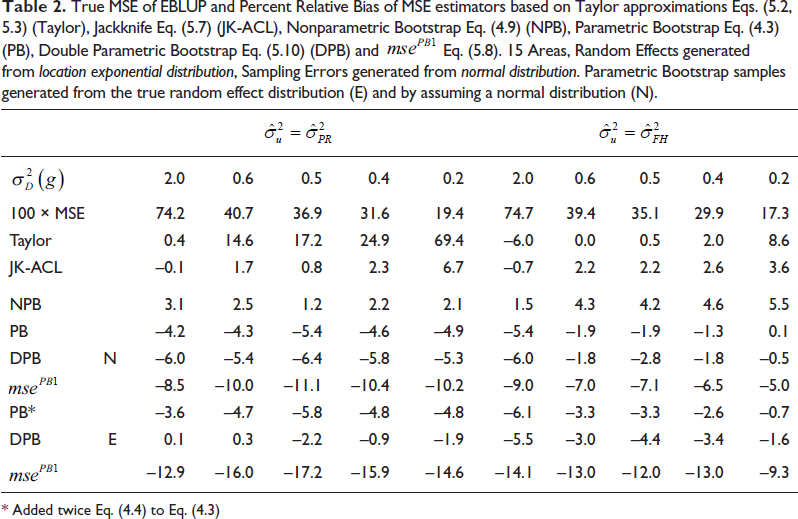
* Added twice Eq. (4.4) to Eq. (4.3)
The results in Table 2 reveal that all the estimators, except for the Taylor based estimator with
Table 3 shows the results obtained for the case where both the random effects and the sampling errors are generated from the location exponential distributions. The relative biases in this table are much larger than in Tables 1 and 2, except in the case of PB E and DPB E with
True MSE of EBLUP and Percent Relative Bias of MSE estimators based on Taylor approximations Eqs. (5.2, 5.3) (Taylor), Jackknife Eq. (5.7) (JK-ACL), Nonparametric Bootstrap Eq. (4.9) (NPB), Parametric Bootstrap Eq. (4.3) (PB), Double Parametric Bootstrap Eq. (5.10) (DPB) and
Eq. (5.8). 15 Areas, Random Effects and Sampling Errors generated from location exponential distributions. Parametric Bootstrap samples generated from the true error distributions (E) and by assuming a normal distribution (N).
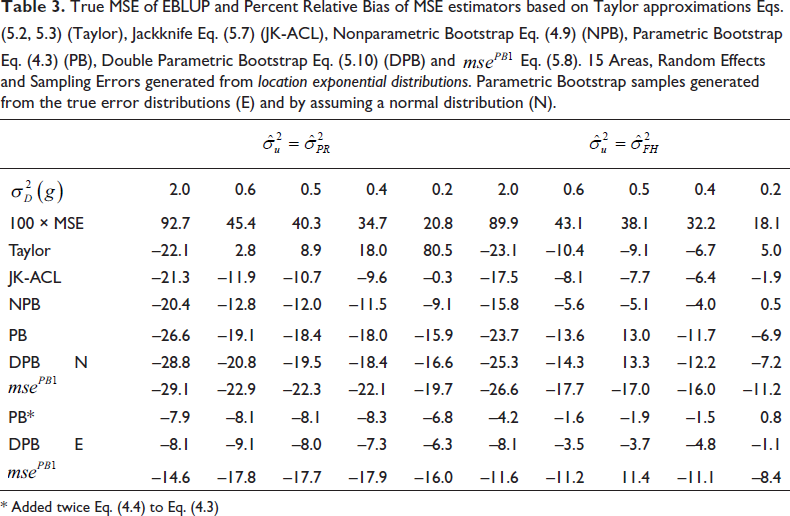
* Added twice Eq. (4.4) to Eq. (4.3)
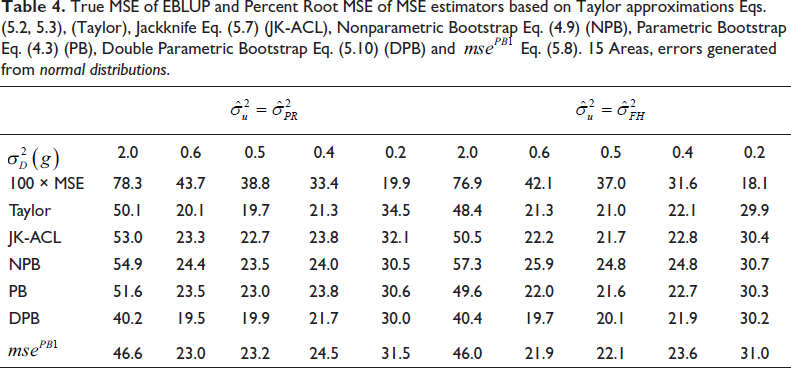
Tables 4–6 show the percent Root MSE (RMSE) of the MSE estimators, under the three combinations of the distributions of the random effects and the sampling errors.
For the case where both distributions are normal (Table 4), the estimator DPB has the lowest RMSE, but for
True MSE of EBLUP and Percent Root MSE of MSE estimators based on Taylor approximations Eqs. (5.2, 5.3), (Taylor), Jackknife Eq. (5.7) (JK-ACL), Nonparametric Bootstrap Eq. (4.9) (NPB), Parametric Bootstrap Eq. (4.3) (PB), Double Parametric Bootstrap Eq. (5.10) (DPB) and
Eq. (5.8). 15 Areas, errors generated from normal distributions.
Similar relative performance patterns are found in the case where the sampling errors have a normal distribution but the random effects are generated from the location exponential distribution (Table 5), and in the case where the two errors are generated from the location exponential distribution (Table 6). Note first that the percent RMSEs in Table 5 are of similar magnitude to the percent RMSEs in Table 4, but they are larger in Table 6. Thus, generating the sampling errors from the exponential distribution increases the RMSE of the MSE estimators. The estimator DPB has again the lowest RMSEs and
True MSE of EBLUP and Percent Root MSE of MSE estimators based on Taylor approximations Eqs. (5.2, 5.3) (Taylor), Jackknife Eq. (5.7) (JK-ACL), Nonparametric Bootstrap Eq. (4.9) (NPB), Parametric Bootstrap Eq. (4.3) (PB), Double Parametric Bootstrap Eq. (5.10) (DPB) and
Eq. (5.8). 15 Areas, Random Effects generated from location exponential distribution, Sampling Errors generated from normal distribution. Parametric Bootstrap samples taken from the true random effect distribution (E) and by assuming a normal distribution (N).
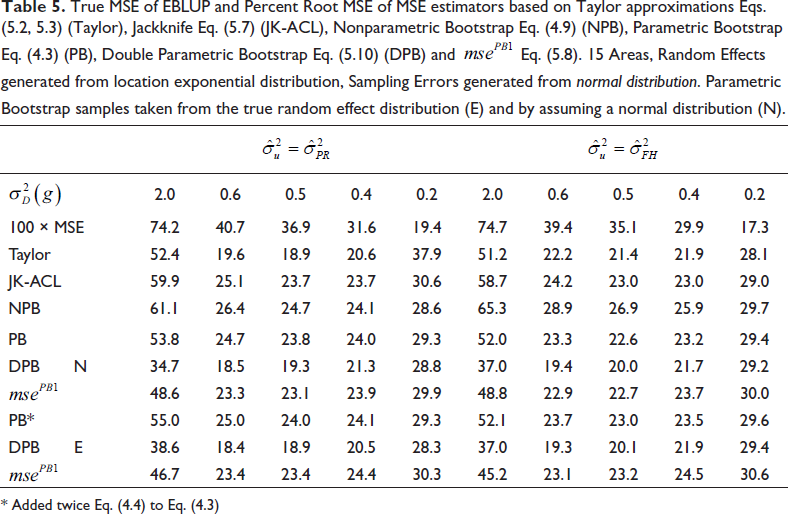
* Added twice Eq. (4.4) to Eq. (4.3)
True MSE of EBLUP and Percent Root MSE of MSE estimators based on Taylor approximations Eqs. (5.2, 5.3) (Taylor), Jackknife Eq. (5.7) (JK-ACL), Nonparametric Bootstrap Eq. (4.9) (NPB), Parametric Bootstrap Eq. (4.5) (PB), Double Parametric Bootstrap Eq. (5.10) (DPB) and
Eq. (5.8). 15 Areas, Random Effects and Sampling Errors generated from location exponential distributions. Parametric Bootstrap samples taken from the true error distributions (E) and by assuming a normal distribution (N).
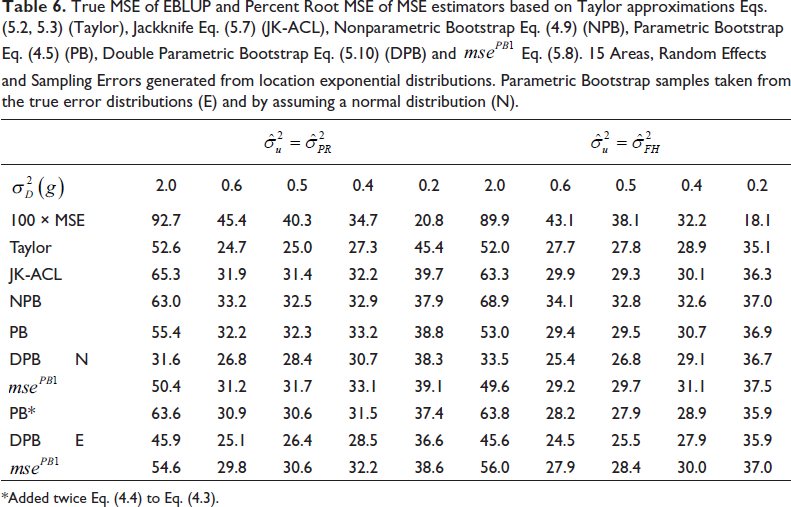
*Added twice Eq. (4.4) to Eq. (4.3).
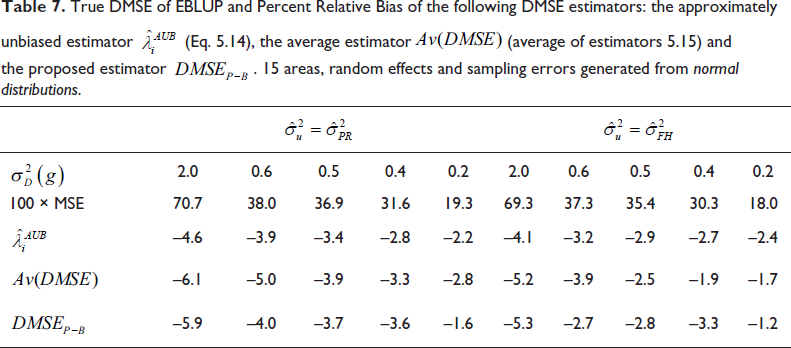
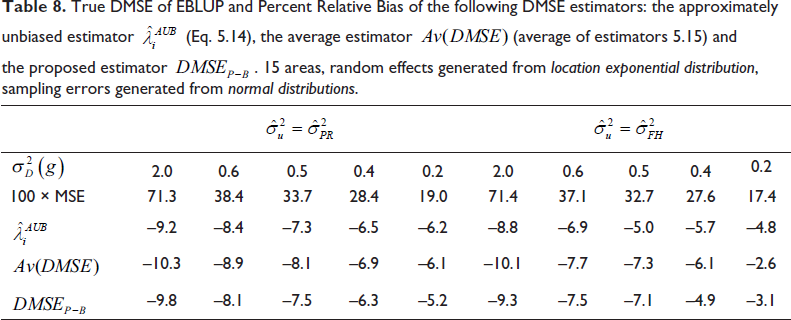
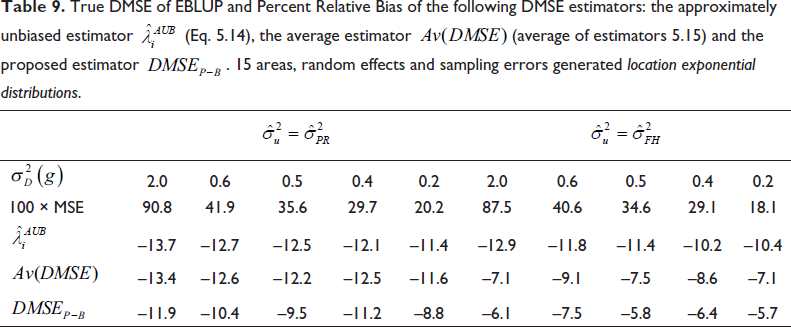
In Section 5.4, we considered the estimation of the design-based MSE of the FH model-dependent EBLUP. We conducted a second simulation study in order to assess the performance of the following three estimators: the approximately unbiased estimator
We chose the function
The model, number of areas and the distributions of the random effects and the sampling errors are the same as in Section 6.1, estimating
Tables 7–9 present the results obtained for the three distributions of the random effects and the sampling errors. we used the neighbourhoods
REMARK 15. The results in Tables 7ߝ9 are averages over M=10 finite populations. In our simulation study, we only consider 15 areas, and the true area means are
The first noteworthy outcome emerging from Tables 7–9 is that the True DMSEs are systematically somewhat lower than the corresponding true MSEs in Tables 1–3 under the model, except for the case where
True DMSE of EBLUP and Percent Relative Bias of the following DMSE estimators: the approximately unbiased estimator
(Eq. 5.14), the average estimator
(average of estimators 5.15) and the proposed estimator
. 15 areas, random effects and sampling errors generated from normal distributions.
True DMSE of EBLUP and Percent Relative Bias of the following DMSE estimators: the approximately unbiased estimator
(Eq. 5.14), the average estimator
(average of estimators 5.15) and the proposed estimator
. 15 areas, random effects and sampling errors generated from normal distributions.
True DMSE of EBLUP and Percent Relative Bias of the following DMSE estimators: the approximately unbiased estimator
(Eq. 5.14), the average estimator
(average of estimators 5.15) and the proposed estimator
. 15 areas, random effects generated from location exponential distribution, sampling errors generated from normal distributions.
True DMSE of EBLUP and Percent Relative Bias of the following DMSE estimators: the approximately unbiased estimator
(Eq. 5.14), the average estimator
(average of estimators 5.15) and the proposed estimator
. 15 areas, random effects and sampling errors generated location exponential distributions.
We conclude from this simulation study that it is possible to estimate the design-based MSE of model dependent estimators with good quality, even with a small number of areas. See Pfeffermann and Ben-Hur[19] for the performance of their proposed estimator in the case of the unit-level generalised linear mixed model.
In this article, we compare a large number of methods for estimating the MSE of the EBLUP under the Fay-Herriot model. The first important result of this study is that the EBLUP that uses the estimator
In what follows we discuss first the MSE estimators under the model. When generating the error terms from the correct distributions, the double bootstrap estimator DPB has generally the lowest bias and percent RMSE. The Jackknife estimator JK-ACL and the nonparametric estimator NPB have generally small biases when the sampling errors have a normal distribution, but the biases increase in the case where they are generated from the location exponential distribution, as is the case with all the other estimators. The parametric bootstrap estimator PB has larger biases than the previous two estimators when
We emphasize again that our results are restricted to 15 small areas. Most of the published studies on the estimation of the MSE of the EBLUP in SAE, focus on the bias of the MSE estimators. Clearly, the bias is the dominant contributor to the MSE when the number of areas is large, but not when it is small, as in the present study. We recognize that analytical comparisons of the MSE of MSE estimators to the right order are complicated, but this fundamental quality of MSE estimators should be explored empirically. As our results indicate, a MSE estimator with negligible bias may actually have a larger variance and hence a larger MSE than another estimator with a large bias.
The present article explores the effect of deviations from normality of the distributions of the model error terms on the performance of the MSE estimators. All the methods, except for PB and DPB when based on the correct distribution of the sampling errors, and to a lesser extent also the JK-ACL, NPB and the Taylor method with
In the present article we also study the performance of three plausible estimators of the design-based MSE. All the estimators perform well when the sampling errors are generated from normal distributions, but the proposed estimator
Footnotes
Declaration of Conflicting Interests
The authors declared no potential conflicts of interest with respect to the research, authorship and/or publication of this article.
Funding
The authors received no financial support for the research, authorship and/or publication of this article.