
Abstract
The dual-factor model of mental health proposes that high wellbeing and low distress are necessary to define mental health. This study used latent profile analysis to identify mental health profiles in a sample of 3,587 Australian grade 6 students and explored the association between mental health profiles and school outcomes measured in grades 7 and 9. Six mental health profiles were identified: complete mental health (i.e. high wellbeing and low distress; 30%), moderately mentally healthy (i.e. average wellbeing and low distress; 18%), symptomatic but content (i.e. high wellbeing and above-average distress; 19%), vulnerable (i.e. low wellbeing and below-average distress; 6%), moderately troubled (i.e. below-average wellbeing and high distress; 19%), and troubled (i.e. low wellbeing and high distress; 8%). After statistical adjustment for potential confounders (gender, language background, socio-economic status, and geographical remoteness), students with complete mental health showed significantly higher academic achievement and school engagement one and three years later compared with students with all other mental health profiles. Students with vulnerable and troubled profiles experienced the poorest school outcomes sustained over time (grade 7 and grade 9). Implications for school-based interventions to support the mental health and wellbeing of students are discussed.
Keywords
Introduction
Mental health and wellbeing during childhood and adolescence play a critical role in establishing a strong foundation for subsequent developmental, wellbeing, and learning outcomes (Australian Institute of Health Welfare, 2020). In recent years, educational systems around the world have recognised the significance of prioritising the mental health and wellbeing of school students as a central objective of education (U.S. Department of Education Office of Special Education and Rehabilitative Services, 2021; Victorian Government, 2024; White et al., 2017; WHO et al., 2022). Previous literature has demonstrated that distress (i.e. externalising and internalising problems) negatively affects academic functioning (Olivier et al., 2020; Shi & Ettekal, 2021). In contrast, research within the field of social-emotional wellbeing has indicated that different dimensions of wellbeing (i.e. subjective, psychological, social, and cognitive) are positively linked to school engagement and academic performance (Datu, 2018; Kaya & Erdem, 2021). However, considering these two constructs in isolation provides a limited view of children’s mental health. The World Health Organization (2003, p. 7) defined mental health as ‘a state of complete physical, mental, and social wellbeing, and not merely the absence of disease or infirmity’. Consistent with this definition, Greenspoon and Saklofske (2001) proposed the dual-factor model of mental health, which suggests that complete mental health is characterised by high levels of wellbeing and low levels of distress. Therefore, a comprehensive understanding of an individual’s mental health necessitates the assessment of both positive and negative dimensions of wellbeing.
Recently, research within schooling systems has corroborated the conceptualisation of the dual-factor model of mental health. Previous research has shown that students with poor mental health, characterised by high levels of distress, experience different school outcomes depending on their level of wellbeing. For example, Clark and Malecki (2022) and Gregory et al. (2024) found that students with high wellbeing and high distress had poorer academic achievement than students with low wellbeing and high distress. This suggests that measuring distress alone is not sufficient to understand mental health and its relationship to school outcomes; instead, it is necessary to measure both wellbeing and distress. To date, several cross-sectional studies have investigated the link between the dual-factor model of mental health and its implications for school outcomes (e.g. Clark & Malecki, 2022; Gregory et al., 2024; King et al., 2021; Rose et al., 2017; Suldo & Shaffer, 2008). However, the extent to which the dual-factor model of mental health predicts long-term school outcomes, such as academic achievement, school engagement, and school attendance, remains unknown. Identifying long-term associations between mental health profiles and school outcomes will provide stakeholders in the education system with the information necessary to intervene early and support student mental health and wellbeing, which in turn may improve student educational outcomes. Against this background, the current study aims to explore the association between mental health profiles in grade 6 students (∼12 years old) and school outcomes measured one year later (grade 7, ∼13 years old) and three years later (grade 9, ∼ 15 years old).
Identification of the dual-factor model of mental health
The dual-factor model of mental health proposes that mental health is defined by where an individual sits on each of two dimensions, namely, wellbeing and distress (Greenspoon & Saklofske, 2001; Suldo & Shaffer, 2008). If individuals are classified into binary groups on both dimensions (i.e. high/low wellbeing and high/low distress), then four mental health groups can be defined: (1) high wellbeing and low distress (Complete mental health), (2) high wellbeing and high distress (Symptomatic but content), (3) low wellbeing and low distress (Vulnerable), and (4) low wellbeing and high distress (Troubled) (Suldo & Shaffer, 2008).
Various measures of wellbeing and distress have been used in the dual-factor model literature. For wellbeing measures, most studies have used indicators of life satisfaction or subjective wellbeing (Antaramian et al., 2010; Clark & Malecki, 2022; Lyons et al., 2012; Smith et al., 2020; Suldo & Shaffer, 2008), while some have used measures of optimism, happiness, gratitude, empathy, or social support (Moore et al., 2019; Petersen et al., 2020; Rose et al., 2017). To define distress, most studies have used measures of externalising behaviour (e.g. conduct problems, aggression, and hyperactivity) and/or internalising behaviour (e.g. depression, anxiety, and stress). It is important to note that the classification of individuals into different mental health groups may vary depending on the specific measures used to define well-being and distress in different studies.
In addition, there are two primary methods commonly used to assign students to the different mental health groups of the dual-factor model. The first method is the theoretically driven method often involving a cut-point approach, while the second method is the empirically driven approach, which employs analysis like latent profile analysis (LPA) (Thayer et al., 2021). Traditionally, the dual-factor model has been explored using a dichotomous cut-point approach, utilising raw scores, sample means, or standardised scores to allocate students into one of the four aforementioned groups (Antaramian et al., 2010; Lyons et al., 2012; Suldo & Shaffer, 2008). However, allocating students to one of the four groups of the dual-factor model can lead to inappropriate classifications (Kim et al., 2017). Recently, the utilisation of LPA, an empirical approach, has been utilised to identify the mental health profiles of children and adolescents (Clark & Malecki, 2022; Kim et al., 2019; Petersen et al., 2020; Rose et al., 2017). Compared to the cut-point approach, the LPA is less susceptible to measurement errors and provides a statistically rigorous framework for classifying individuals. The LPA offers a novel approach by allowing the identification of different profiles of students based on different indicator responses (Collins & Lanza, 2010) which is important for designing intervention and support strategies to address the individual needs of the students effectively.
Using LPA, some studies have replicated the four mental health profiles defined by the dual-factor model of mental health. For example, Rose et al. (2017) collected multiple measures of wellbeing and psychopathology among high school students in the United States (US) (13–17 years, n = 1,170) and identified four mental health profiles (i.e. positive mental health [51%], symptomatic but content [13%], vulnerable [20%], and troubled [16%]). However, other studies have found only partial support for the dual-factor model of mental health. For instance, Kim et al. (2019) examined the dual-factor model in a sample of primary school students in South Korea (grades 4–6, n = 1,757) using five measures of wellbeing and distress. This study identified flourishing (i.e. high wellbeing and low distress), moderate flourishing (i.e. moderate wellbeing and moderate distress), moderate languishing (i.e. low wellbeing and moderate distress), and languishing profiles (i.e. low wellbeing and high distress). More recently, Clark and Malecki (2022) identified three mental health profiles (complete mental health [55%], symptomatic but content [34%], and troubled [11%]) using different indicators of wellbeing and psychopathology among middle school students (grades 6–8, n = 404) in the US. Although some studies using LPA to assess school students’ mental health found support for the four profiles of the dual-factor model, others did not identify vulnerable (Clark & Malecki, 2022; Kim et al., 2019; Moore et al., 2019), symptomatic but content (Kim et al., 2019), or troubled profiles (Petersen et al., 2020). Thus, the LPA approach allows for more flexibility in the number of profiles that can be identified with some studies supporting the dual-factor model of mental health, whereas other studies only found partial support for this model.
Mental health profiles and school outcomes
Several studies using the dual-factor model of mental health have investigated the concurrent relationship between mental health profile membership and school outcomes. For example, in the US (grades 6–9, n = 349), Suldo and Shaffer (2008) found that students with complete mental health had the highest Grade Point Averages (GPAs), reading and math scores, social functioning, and the lowest school absences compared to all other mental health groups, after adjusting for socioeconomic status and parent marital status. Similarly, Antaramian et al. (2010) explored the association between mental health groups and school engagement (i.e. emotional, cognitive, and behavioural engagement) in a sample of 764 middle school students (grades 7–8) in the US. Their findings demonstrated that students in the complete mental health profile had the highest levels of emotional, cognitive, and behavioural engagement at school, while students in the vulnerable and troubled groups had the lowest levels. Additionally, Rose et al. (2017) found that students in the troubled profile had higher odds of school suspension and repeating a grade, and lower odds of school bonding (e.g. positive teacher–student connections), compared to students in the positive mental health profile. More recently, in a larger sample of 21,993 Canadian students in grades 6–10, King et al. (2021) found that students with the highest wellbeing and lowest distress group (i.e. mentally healthy) were associated with better peer support, family support, teacher support, and academic performance than students in all other groups after accounting for clustering by school and adjusting for gender and age.
While many studies using cross-sectional data have shown that students with a complete mental health profile have better academic achievement and school engagement than their peers with symptomatic but content, vulnerable, or troubled profiles, limited research has examined the association between students’ mental health profiles and educational outcomes at a later point in time. Of the limited evidence, Suldo et al. (2011) explored the relationship between mental health profiles and academic outcomes one year later (grades 6–8, n = 341), with results showing that students in the complete mental health group had higher GPAs, math skills, and school attendance than students in the other groups. Specifically, students in the troubled group had significantly lower mean GPAs, higher school absences, and lower math performance one year later, than students in the complete mental health group. Students assigned to the symptomatic but content group had significantly lower mean GPAs, higher school absences, and greater office discipline referrals over time than students in the complete mental health group. Of interest, this study found that school functioning (i.e. GPA, math test, reading test, school attendance, and office discipline referrals) was not significantly different between students in the vulnerable and complete mental health groups. Similarly, in a sample of 727 students in grades 7–8, Lyons et al. (2013) explored how initial mental health groups predicted changes in students’ GPA and school engagement (i.e. emotional, cognitive, and behavioural engagement) after a five-month follow-up. This study found that students who were initially allocated to the positive mental health group had the highest GPA and student engagement compared to students in the other groups five months later. Compared to students in the complete mental health group, those in the troubled group had significantly lower emotional and cognitive engagement, those in the vulnerable profile showed lower emotional engagement, and those in the symptomatic but content profile showed significantly lower behavioural engagement. Their study found that mental health groups did not predict students’ academic achievement (i.e. GPA) at follow-up; however, GPA for students in the vulnerable group declined at a significantly faster rate than students in the complete mental health group. To summarise, limited longitudinal research has shown an association between student mental health groups and subsequent school outcomes five months later (Lyons et al., 2013) and one year later (Suldo et al., 2011).
Current study
This study uses population-level data, collected within the Australian education system to explore the association between student mental health profiles in grade 6 (∼12 years old) and school outcomes measured one year later (grade 7, ∼13 years old) and three years later (grade 9, ∼15 years old). Specifically, this study aimed to (1) identify different mental health profiles of students using self-reported measures of wellbeing (life satisfaction, optimism, and happiness) and distress (sadness and worries), and (2) explore the association between mental health profiles and school outcomes (reading and numeracy achievement, connectedness to adults at school, cognitive engagement, and school absences) one and three years later, after adjusting for child, family, and community level characteristics.
Method
Data sources
The Wellbeing and Engagement Collection (WEC) is a population-level annual survey conducted by the South Australia Department for Education (DfE), administered to students in grades 4 to 12 (ages 8–18 years). The WEC measures students’ emotional wellbeing, engagement with school, learning readiness, and health and wellbeing outside of school. Every year since 2014, all schools in South Australia have been invited to participate in the collection. Schools that choose to participate decide whether all or some classes will participate in the WEC and parents/caregivers of children in these classes receive an information letter before the survey and can withdraw their child if desired. Students could opt out before or during the survey at any time. The current study used positive and negative wellbeing measures for grade 6 students from the 2016 WEC to define mental health profiles at baseline, and school engagement measures completed by the same cohort of students when they were in grades 7 and 9 from the 2017 and 2019 WEC, respectively. The WEC was conducted in term 4 (October/November) in 2016, term 3 (July/August) in 2017, and term 1 (March/April) in 2019 during school hours, and students took 25–45 minutes to complete the survey (see Gregory et al., 2021, for information on the WEC). For government school students, the WEC is completed using their unique education identifier allowing linkage to other administrative datasets held by the South Australia DfE.
The National Assessment Program Literacy and Numeracy (NAPLAN) is an annual standardised test that measures skills in numeracy and literacy (reading, writing, spelling and grammar, and punctuation) for all students in grades 3, 5, 7, and 9 in Australia. Data from the 2017 and 2019 NAPLAN numeracy and reading tests conducted in term 2 (May) were used in this study as a measure of academic achievement among grade 7 and 9 students. The current study used numeracy and reading test scores to encompass the two major areas of academic achievement most frequently reported within the education departments. Students did not sit the NAPLAN tests if they were absent from school the day of the test, exempt due to a disability or poor language skills, or withdrawn by their parent/caregiver for religious beliefs or philosophical objections to testing (Australian Curriculum Assessment and Reporting Authority, 2020).
The South Australia DfE linked the 2016, 2017, and 2019 WEC data to internal departmental records using students’ unique education identifiers, which were only available for government school students. The internal departmental records provided information on the sociodemographic characteristics of students (from the school enrolment census), their school attendance, and their NAPLAN scores. A deidentified data file was provided to the researchers for analysis, and ethical approval was received from the University of Western Australia (RA/4/20/6095).
Participants
Participants (n = 3,587; analysis sample) were students from government schools who completed the WEC when in grade 6 in 2016, completed the WEC and NAPLAN in grade 7 in 2017 and grade 9 in 2019, and had no missing data on any outcome and/or covariate variables. These participants were a sub-set of the eligible sample (n = 12,388), defined as all grade 6 students enrolled in government schools in South Australia in 2016. Figure 1 depicts a flow chart to define the analysis sample. The WEC data from 2016 (grade 6), 2017 (grade 7), and 2019 (grade 9) were linked for a total of 4,554 students, representing 36.8% of the eligible sample. Of those 4,554 students, 18 (0.4%) had missing baseline data on all positive and negative mental health indicators, and 85 (1.9%) had missing data on at least one covariate. At follow-up, 238 (5.2%, in grade 7) and 346 (7.6%, in grade 9) had missing data on NAPLAN reading and/or numeracy tests, and 86 (1.9%, in grade 7) and 194 (4.3 %, in grade 9) had missing data on at least one school engagement measure. Possible reasons for sample attrition over time included (1) non-participation of school, class, or students in the WEC in 2017 and/or 2019, (2) non-participation of students in grade 7 and/or grade 9 NAPLAN, and (3) students transferring to private schools or moving out of the state. Flow chart of participants. Note. WEC = Wellbeing and Engagement Collection.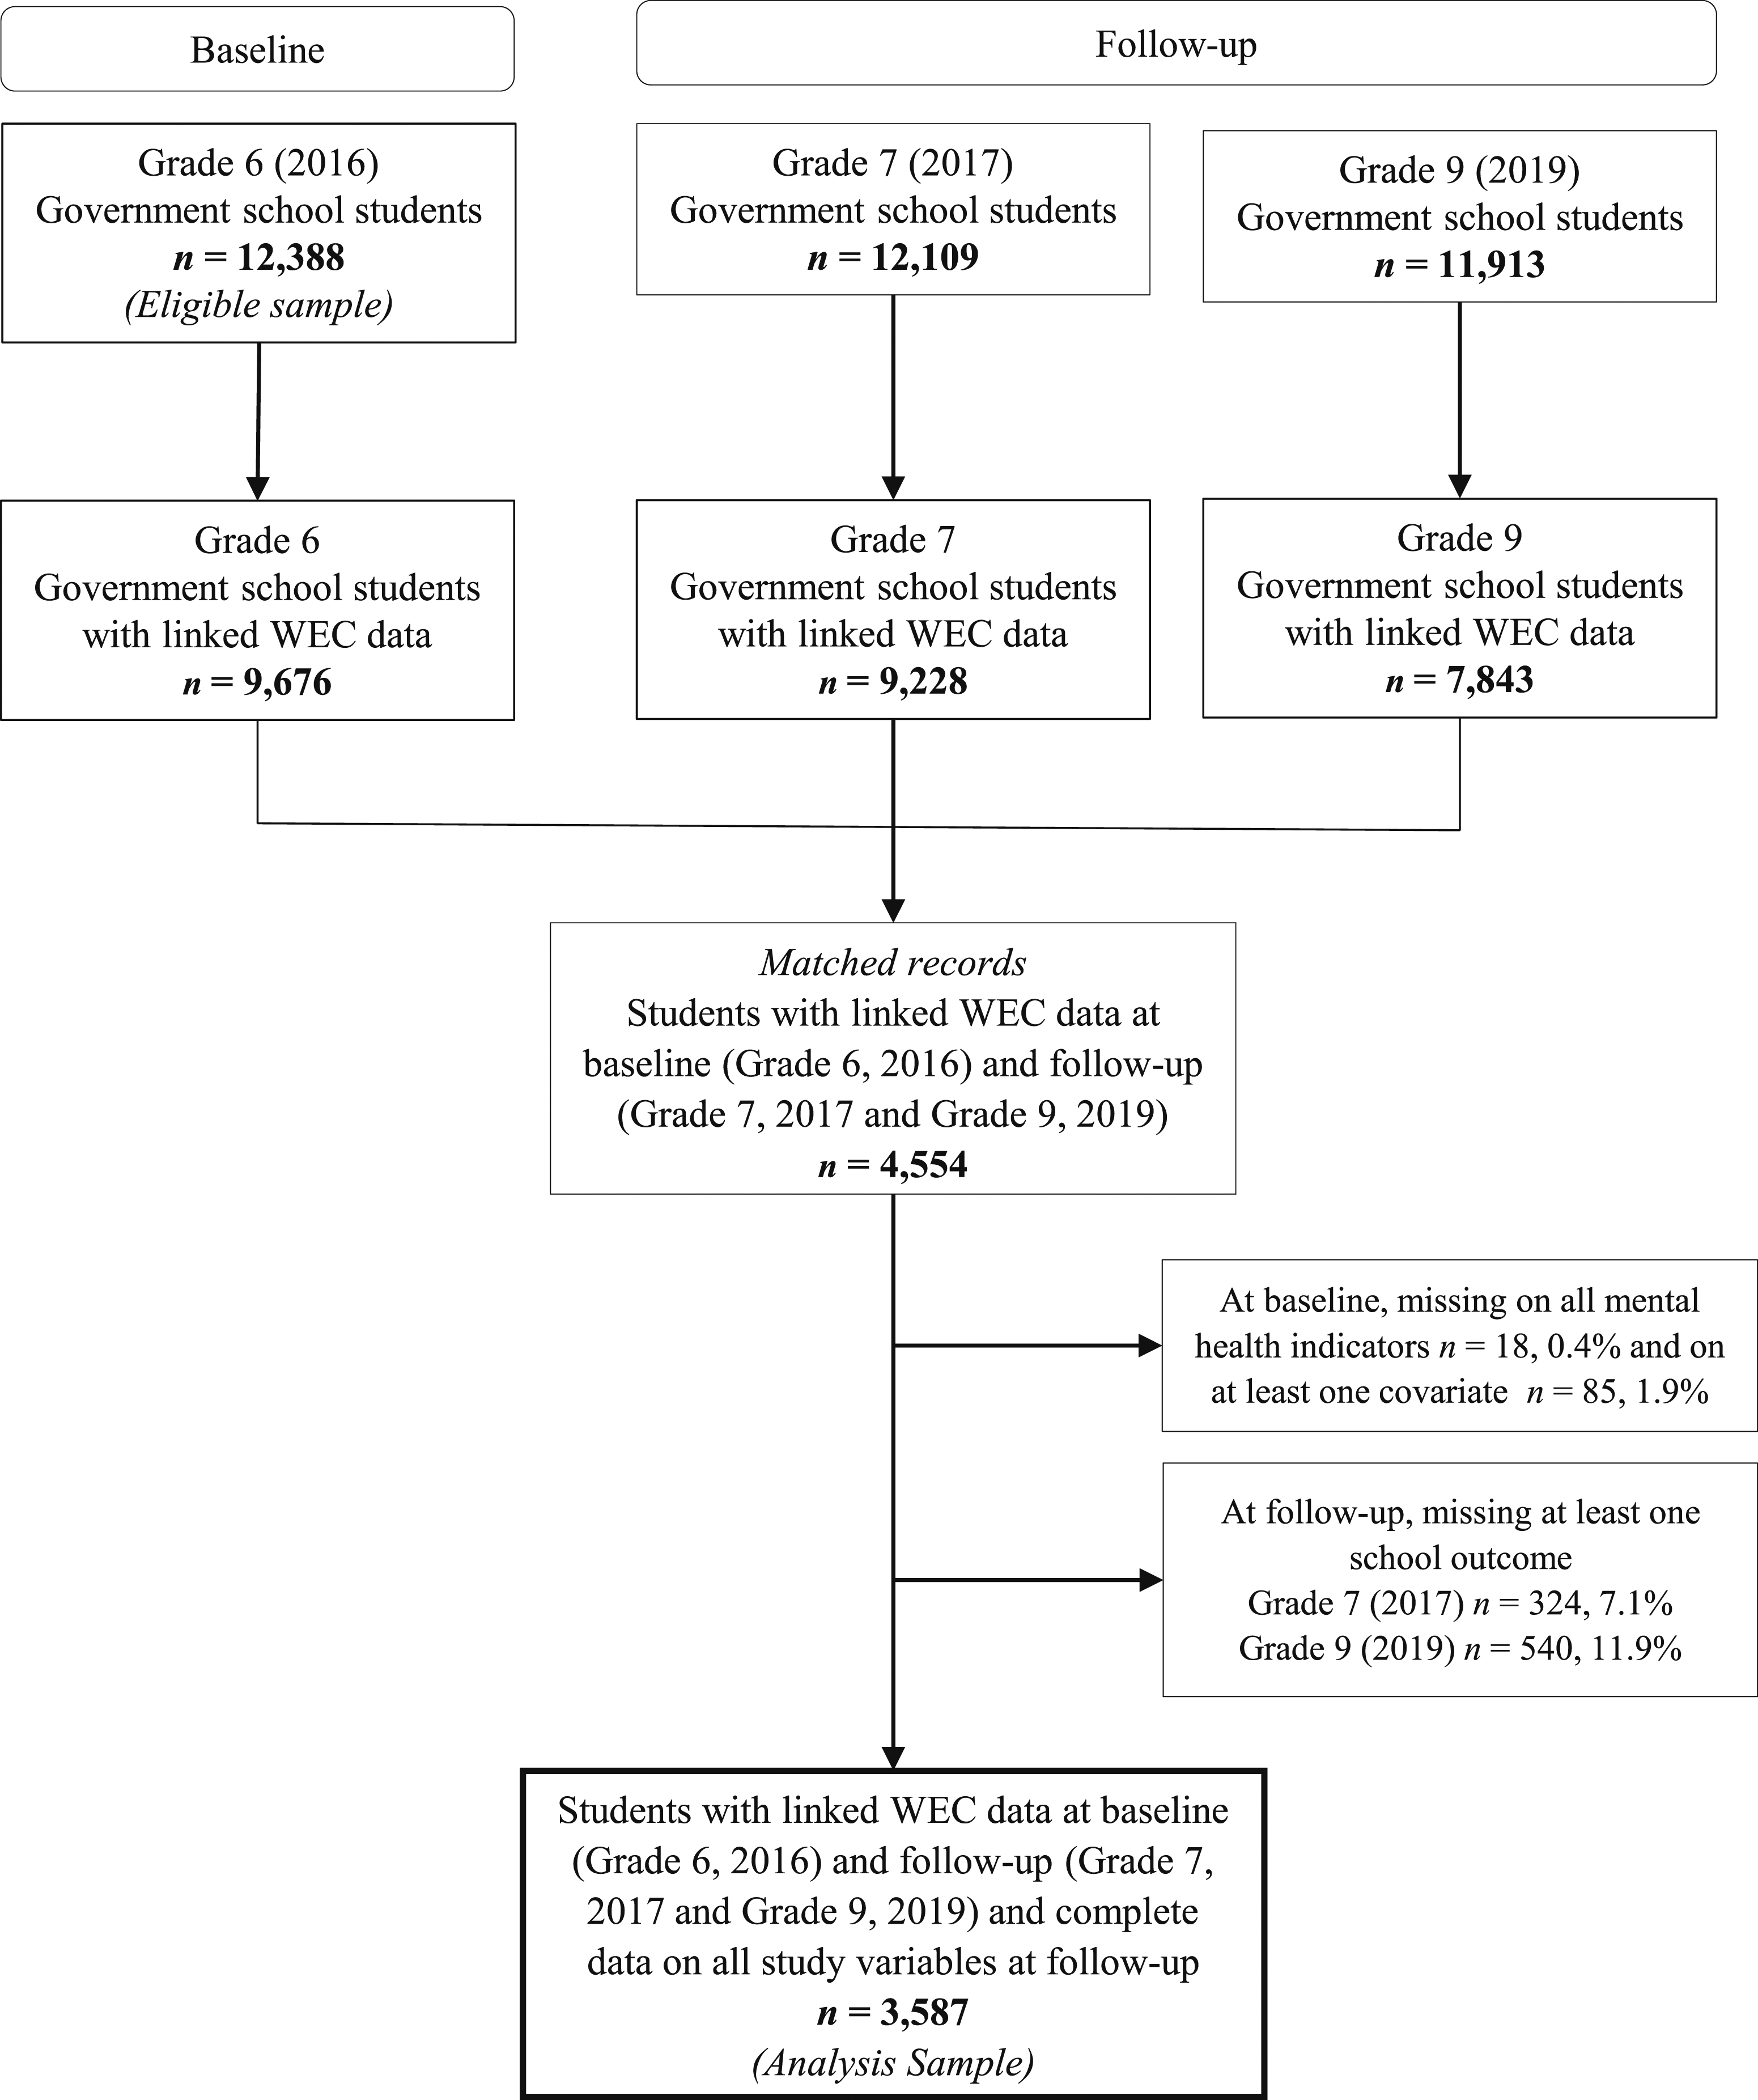
Measures
All scales from the WEC were tested for internal reliability, with Cronbach’s alpha of 0.7 used as the cutoff to define acceptable levels.
Mental health indicators in grade 6 (2016)
Life satisfaction
Measured using a 5-item Satisfaction with Life Scale - Adapted for Children (Gadermann et al., 2010). The scale includes items such as ‘In most ways my life is close to the way I would want it to be’ or ‘The things in my life are excellent’. Students responded using a 5-point Likert scale (1 = Disagree a lot to 5 = Agree a lot). This scale had a Cronbach alpha reliability value of 0.88 in the current sample.
Optimism
Measured using a 4-item optimism scale from the EPOCH Measure of Adolescent Wellbeing (Kern et al., 2015). The scale includes items such as ‘In uncertain times, I expect the best’ or ‘I think good things are going to happen to me’ using a 5-point response scale (1 = Not at all like me to 5 = Very much like me). The scale had a Cronbach alpha reliability value of 0.78 in the current sample.
Happiness
Measured using a 4-item happiness scale from the EPOCH Measure of Adolescent Wellbeing (Kern et al., 2015). The scale includes items such as ‘I feel happy’ or ‘I love life’. Students responded to these items using a five-point response scale (1 = Almost never to 5 = Almost always) with a Cronbach alpha reliability value of 0.83 in the current sample.
Sadness
Measured using a 3-item sadness scale from the Middle Years Development Instrument (Schonert-Reichl et al., 2013). The scale includes items such as ‘I feel unhappy a lot of the time’ or ‘I feel upset about things’. Students responded using a 5-point response scale (1 = Disagree a lot to 5 = Agree a lot) with a Cronbach alpha reliability value of 0.78 in the current sample.
Worries
Measured using a 4-item worries scale developed for the WEC (Gregory et al., 2016). The scale includes items such as ‘I worry a lot about things at home’ or ‘I worry a lot about things at school’ and uses a 5-point response scale (1 = Disagree a lot to 5 = Agree a lot). This scale had a Cronbach alpha reliability value of 0.84 in the current sample.
School outcomes grade 7 (2017) and grade 9 (2019)
Numeracy and reading achievement
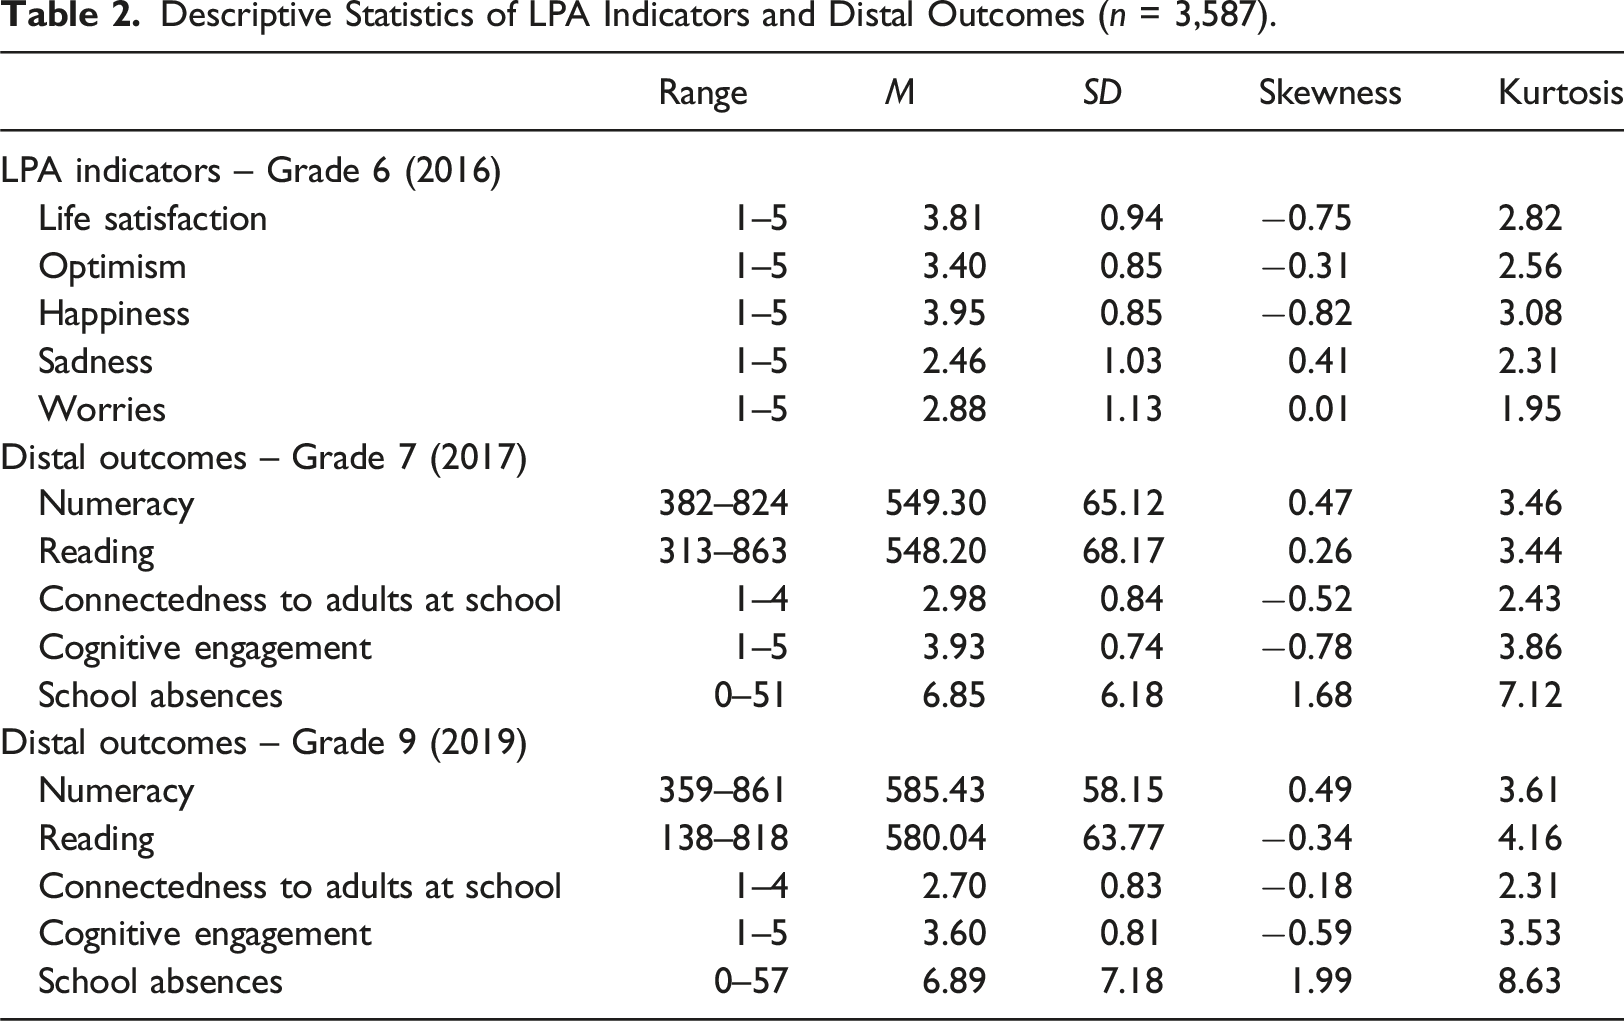
Measured using the 2017 and 2019 NAPLAN numeracy and reading tests. The numeracy test evaluates understanding, fluency, problem-solving, and reasoning across (1) number and algebra, (2) measurement and geometry, and (3) statistics and probability. The reading test focuses on the reading of written English, and knowledge and interpretation of language conventions in context (Australian Curriculum, Assessment and Reporting Authority, n.d). This study utilised the NAPLAN scale scores which range from 0 to 1000, which are calculated by the Australian Curriculum Assessment and Reporting Authority using Rasch modelling. In 2017, students in grade 7 in South Australia had a mean score of 542.1 for reading (SD = 66.6) and a mean score of 544.0 for numeracy (SD = 64.4) (Australian Curriculum Assessment and Reporting Authority, 2017), which were similar to the mean scores observed in the current sample (i.e. reading M = 548.2 [SD = 68.2] and numeracy M = 549.3 [SD = 65.1]). A similar pattern was observed with the grade 9 NAPLAN results, suggesting that the current sample is broadly representative of South Australian students with respect to academic achievement.
Connectedness to adults at school
Measured using a 3-item connectedness to adults at school scale from the Middle Years Development Instrument (Schonert-Reichl et al., 2013). The scale includes items such as ‘At my school, there is a teacher or another adult who really cares about me’ or ‘At my school, there is a teacher or another adult who believes that I will be a success’ and uses a 4-point response scale (1 = Not at all true to 4 = Very much true). This scale had good internal reliability (Cronbach α = 0.87 in grade 7 and α = 0.88 in grade 9) in the current sample.
Cognitive engagement
Measured using a 5-item cognitive engagement scale developed for the WEC (Gregory et al., 2016). The scale includes items such as ‘I work hard on learning’ or ‘When I found something hard, I tried another way’ and uses a 5-point response scale (1 = None of the time to 5 = All of the time). The scale had good internal reliability in the current sample (Cronbach α = 0.87 in grade 7 and α = 0.89 in grade 9).
School absences
Measured as the total number of days the child was absent from school during the second and third school terms of 2017 (from 01 May to 29 September) and the first two school terms of 2019 (from 29 January to 5 July). Attendance information was obtained from the internal departmental records. In the current sample, students were absent from school for an average of 6.85 days (SD = 6.18 range = 0–51 days) in grade 7 (2017) and 6.89 days (SD = 7.18 range = 0–57 days) in grade 9 (2019).
Covariates
The sociodemographic characteristics of students in grade 6 (2016) were extracted from internal departmental records. This included gender, language background, the highest level of parent education, and postcode of residence. Gender categories included male and female. Language background was categorised into English-only and non-English-speaking background. The highest level of parental education was categorised into four groups: year 12 or below, certificate I to IV, advanced diploma, and bachelor’s degree or above. Based on the student’s postcode of residence, each student was assigned a score for community socioeconomic status and geographical remoteness. Community socioeconomic status was measured using the 2016 Socio-Economic Indexes for Areas Index of Relative Socio-Economic Advantage and Disadvantage (SEIFA IRSAD) (Australian Bureau of Statistics, 2016a) and then categorised from Quintile 1 (i.e. most disadvantage) to Quintile 5 (i.e. most advantage). Geographical remoteness was measured using the 2016 Accessibility and Remoteness Index of Australia (ARIA) (Australian Bureau of Statistics, 2016b) and then categorised from major cities to remote/very remote.
Data analysis
Latent profile analysis
LPA was conducted in Mplus v8.8 (Muthén & Muthén, 1998-2017) using maximum likelihood estimation with robust standard errors (MLR) to account for missing data. A series of LPA models were estimated starting with a one-profile model up to an eight-profile model. The analyses were run with 1,000 start values with 250 optimisations and 100 iterations to prevent convergence on local maxima (Ferguson et al., 2020).
The final profile model was selected based on several fit statistics as well as interpretability (Ferguson et al., 2020; Nylund-Gibson & Choi, 2018; Weller et al., 2020). Fit statistics included Akaike Information Criteria (AIC), Bayesian Information Criteria (BIC), sample-size adjusted Bayesian Information Criterion (SABIC), Bootstrapped likelihood ratio test (BLRT), Vuong–Lo–Mendell–Rubin adjusted likelihood ratio test (VLMR-LRT), and Entropy. Lower values of AIC, BIC, and SABIC indicated a better model fit. Significant p-values (p < .05) of BLRT and VLMR-LRT indicated that the model with k profiles was preferred over the model with one less latent profile (k-1). Entropy values close to .80 were considered a good classification of participants into the profiles (Clark & Muthén, 2009). Profile models were interpreted by plotting the mean scores of the profile indicators and evaluating the number and percentage of students in each profile (Nylund-Gibson & Choi, 2018). Models with profiles containing less than 5% of the sample were ignored because small profiles can be unreliable for practical application (Ferguson et al., 2020; Nylund-Gibson & Choi, 2018).
Mental health profiles and later school outcomes
Once the final profile model was selected, the Bolck, Croon, and Hagenaars (BCH) 3-step method (Bolck et al., 2004) was used to explore the association between mental health profiles and distal outcomes (i.e. grades 7 and 9 school outcomes) after controlling for covariates. The BCH method, first, identified the latent profile model using only the indicator variables; then, classification errors were obtained for each student and finally used a weighted analysis of variance, in which weights are inversely associated with classification error (Asparouhov & Muthén, 2014; Bakk & Vermunt, 2016). The manual BCH method was performed in Mplus (Asparouhov & Muthén, 2014) to explore the association between mental health profiles and later school outcomes where sociodemographic characteristics of students (i.e. gender, language background, the highest level of parent education, community socioeconomic status, and geographical remoteness) were included as control variables. The cluster command was used to account for the nested nature of data at the school level. Adjusted distal mean scores with standard error were reported for each profile as well as the significant distal mean differences (p < .05) between each profile on distal outcomes in grades 7 and 9.
Results
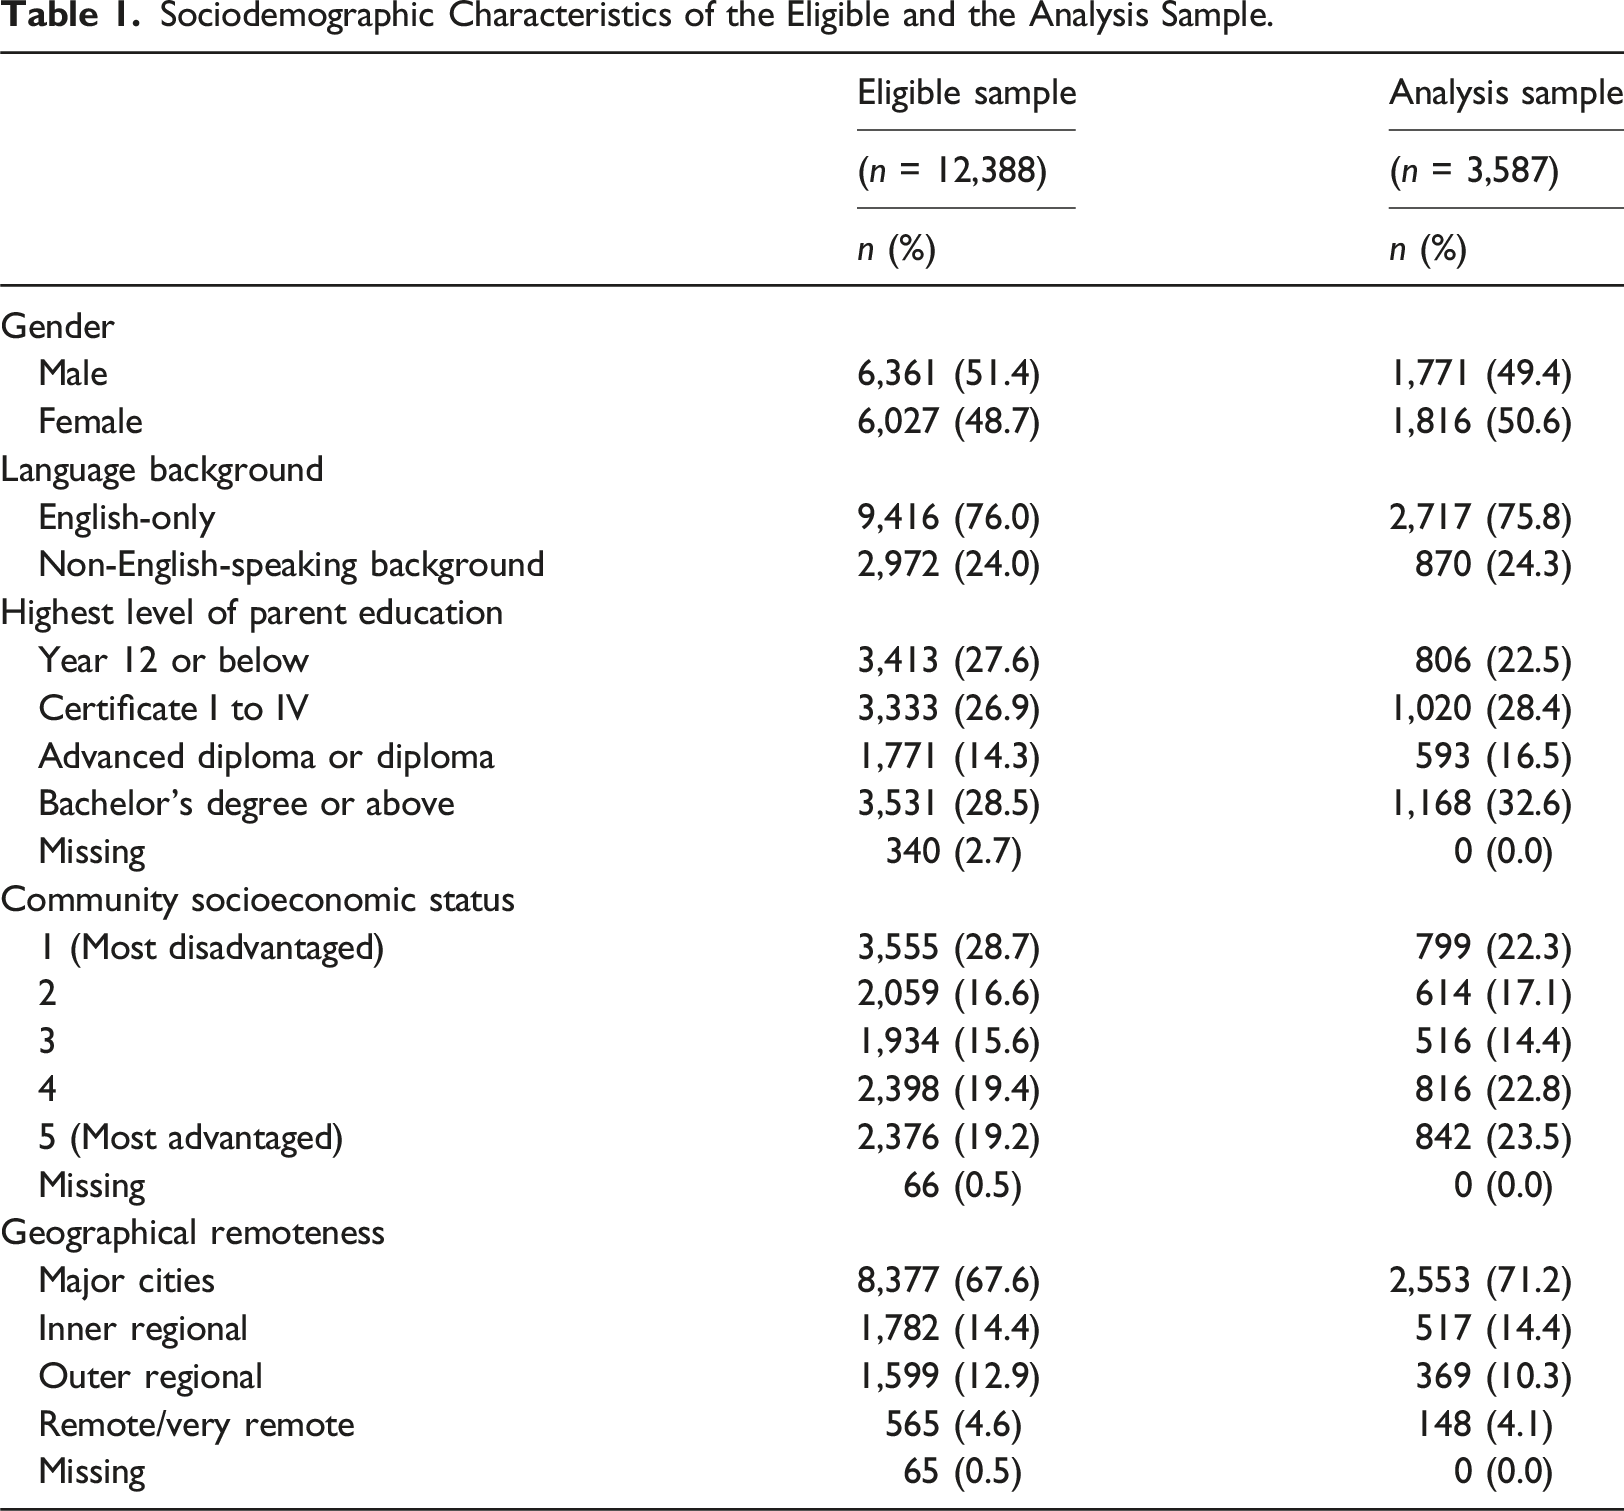
Sociodemographic Characteristics of the Eligible and the Analysis Sample.
Descriptive Statistics of LPA Indicators and Distal Outcomes (n = 3,587).
Latent profile analysis
Fit Statistics for Profile Enumeration.
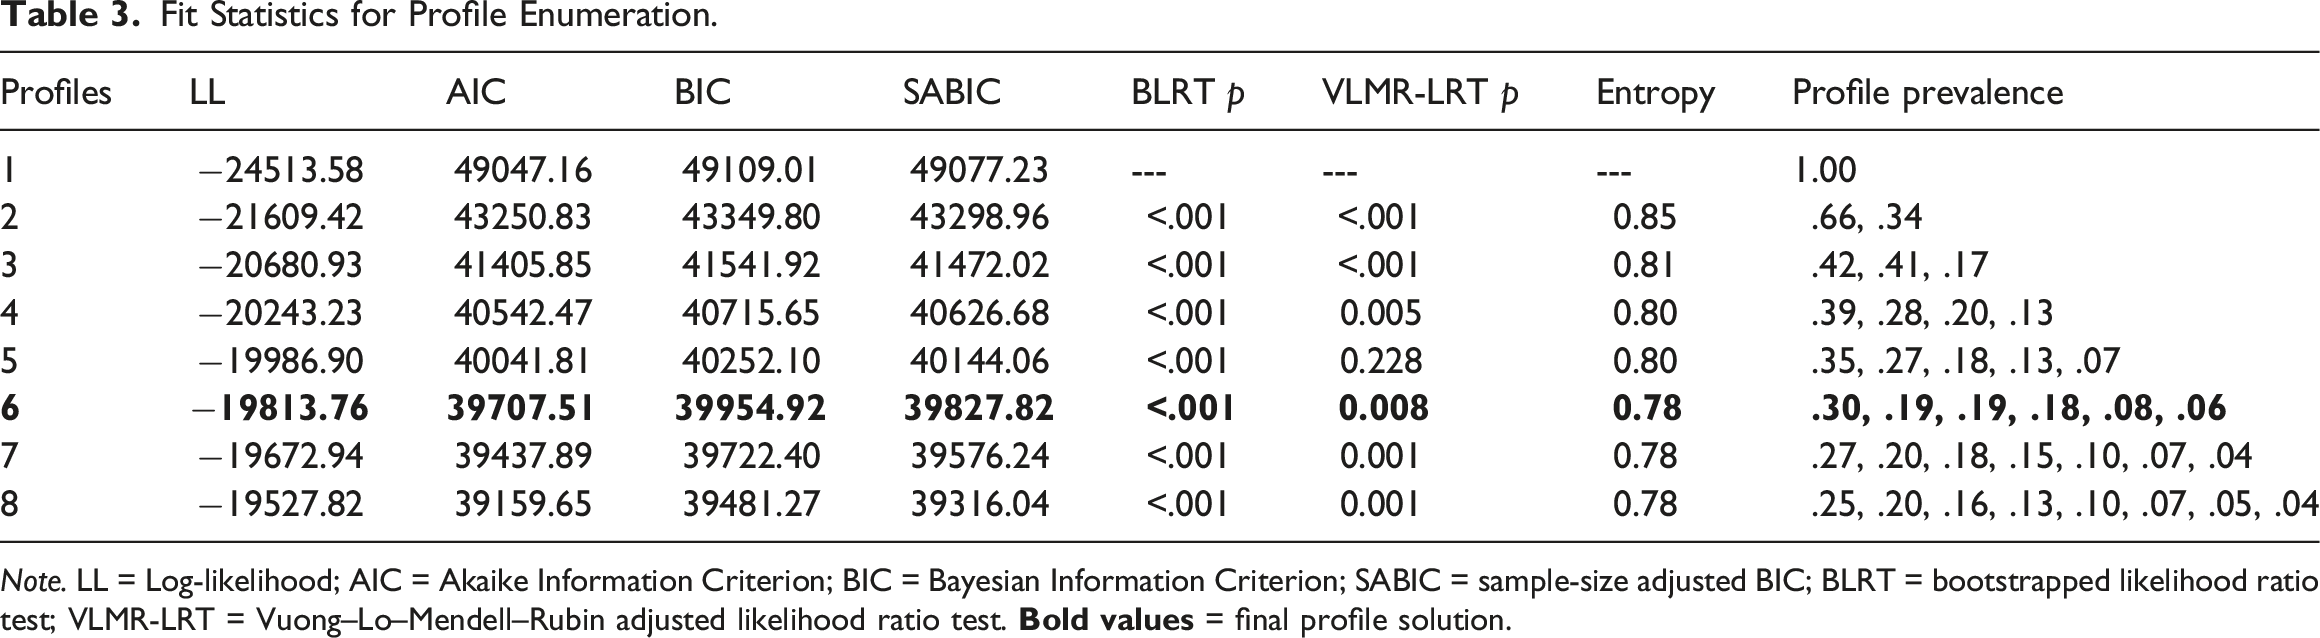
Note. LL = Log-likelihood; AIC = Akaike Information Criterion; BIC = Bayesian Information Criterion; SABIC = sample-size adjusted BIC; BLRT = bootstrapped likelihood ratio test; VLMR-LRT = Vuong–Lo–Mendell–Rubin adjusted likelihood ratio test.
Figure 2 presents the final six profiles which were interpreted as follows: (1) complete mental health (n = 1,077, 30.0%) represented by the highest mean levels of life satisfaction, optimism, and happiness, and the lowest levels of sadness and worries; (2) moderately mentally healthy (n = 643, 17.9%) represented by average levels of life satisfaction, optimism, and happiness, and low levels of sadness and worries; (3) symptomatic but content (n = 692, 19.3%) represented by high levels of life satisfaction, optimism, and happiness, and above-average levels of sadness and high levels of worries; (4) vulnerable (n = 206, 5.7%) represented by low levels of life satisfaction, optimism, and happiness, average levels of sadness, and below-average levels of worries; (5) moderately troubled (n = 697, 19.4%) represented by below-average levels of life satisfaction, optimism, and happiness, and high levels of sadness and worries; and (6) troubled (n = 272, 7.6%) represented by the lowest levels of life satisfaction, optimism, and happiness, and the highest levels of sadness and worries. Table S1 presents the odds of membership into different mental health profiles for students with different sociodemographic characteristics (please refer to the Supplemental material). Mean estimates for each mental health indicator across profiles (n = 3,587). Note. Black squares represent the mean scores for each indicator. Mental health indicators were sourced in grade 6 (2016).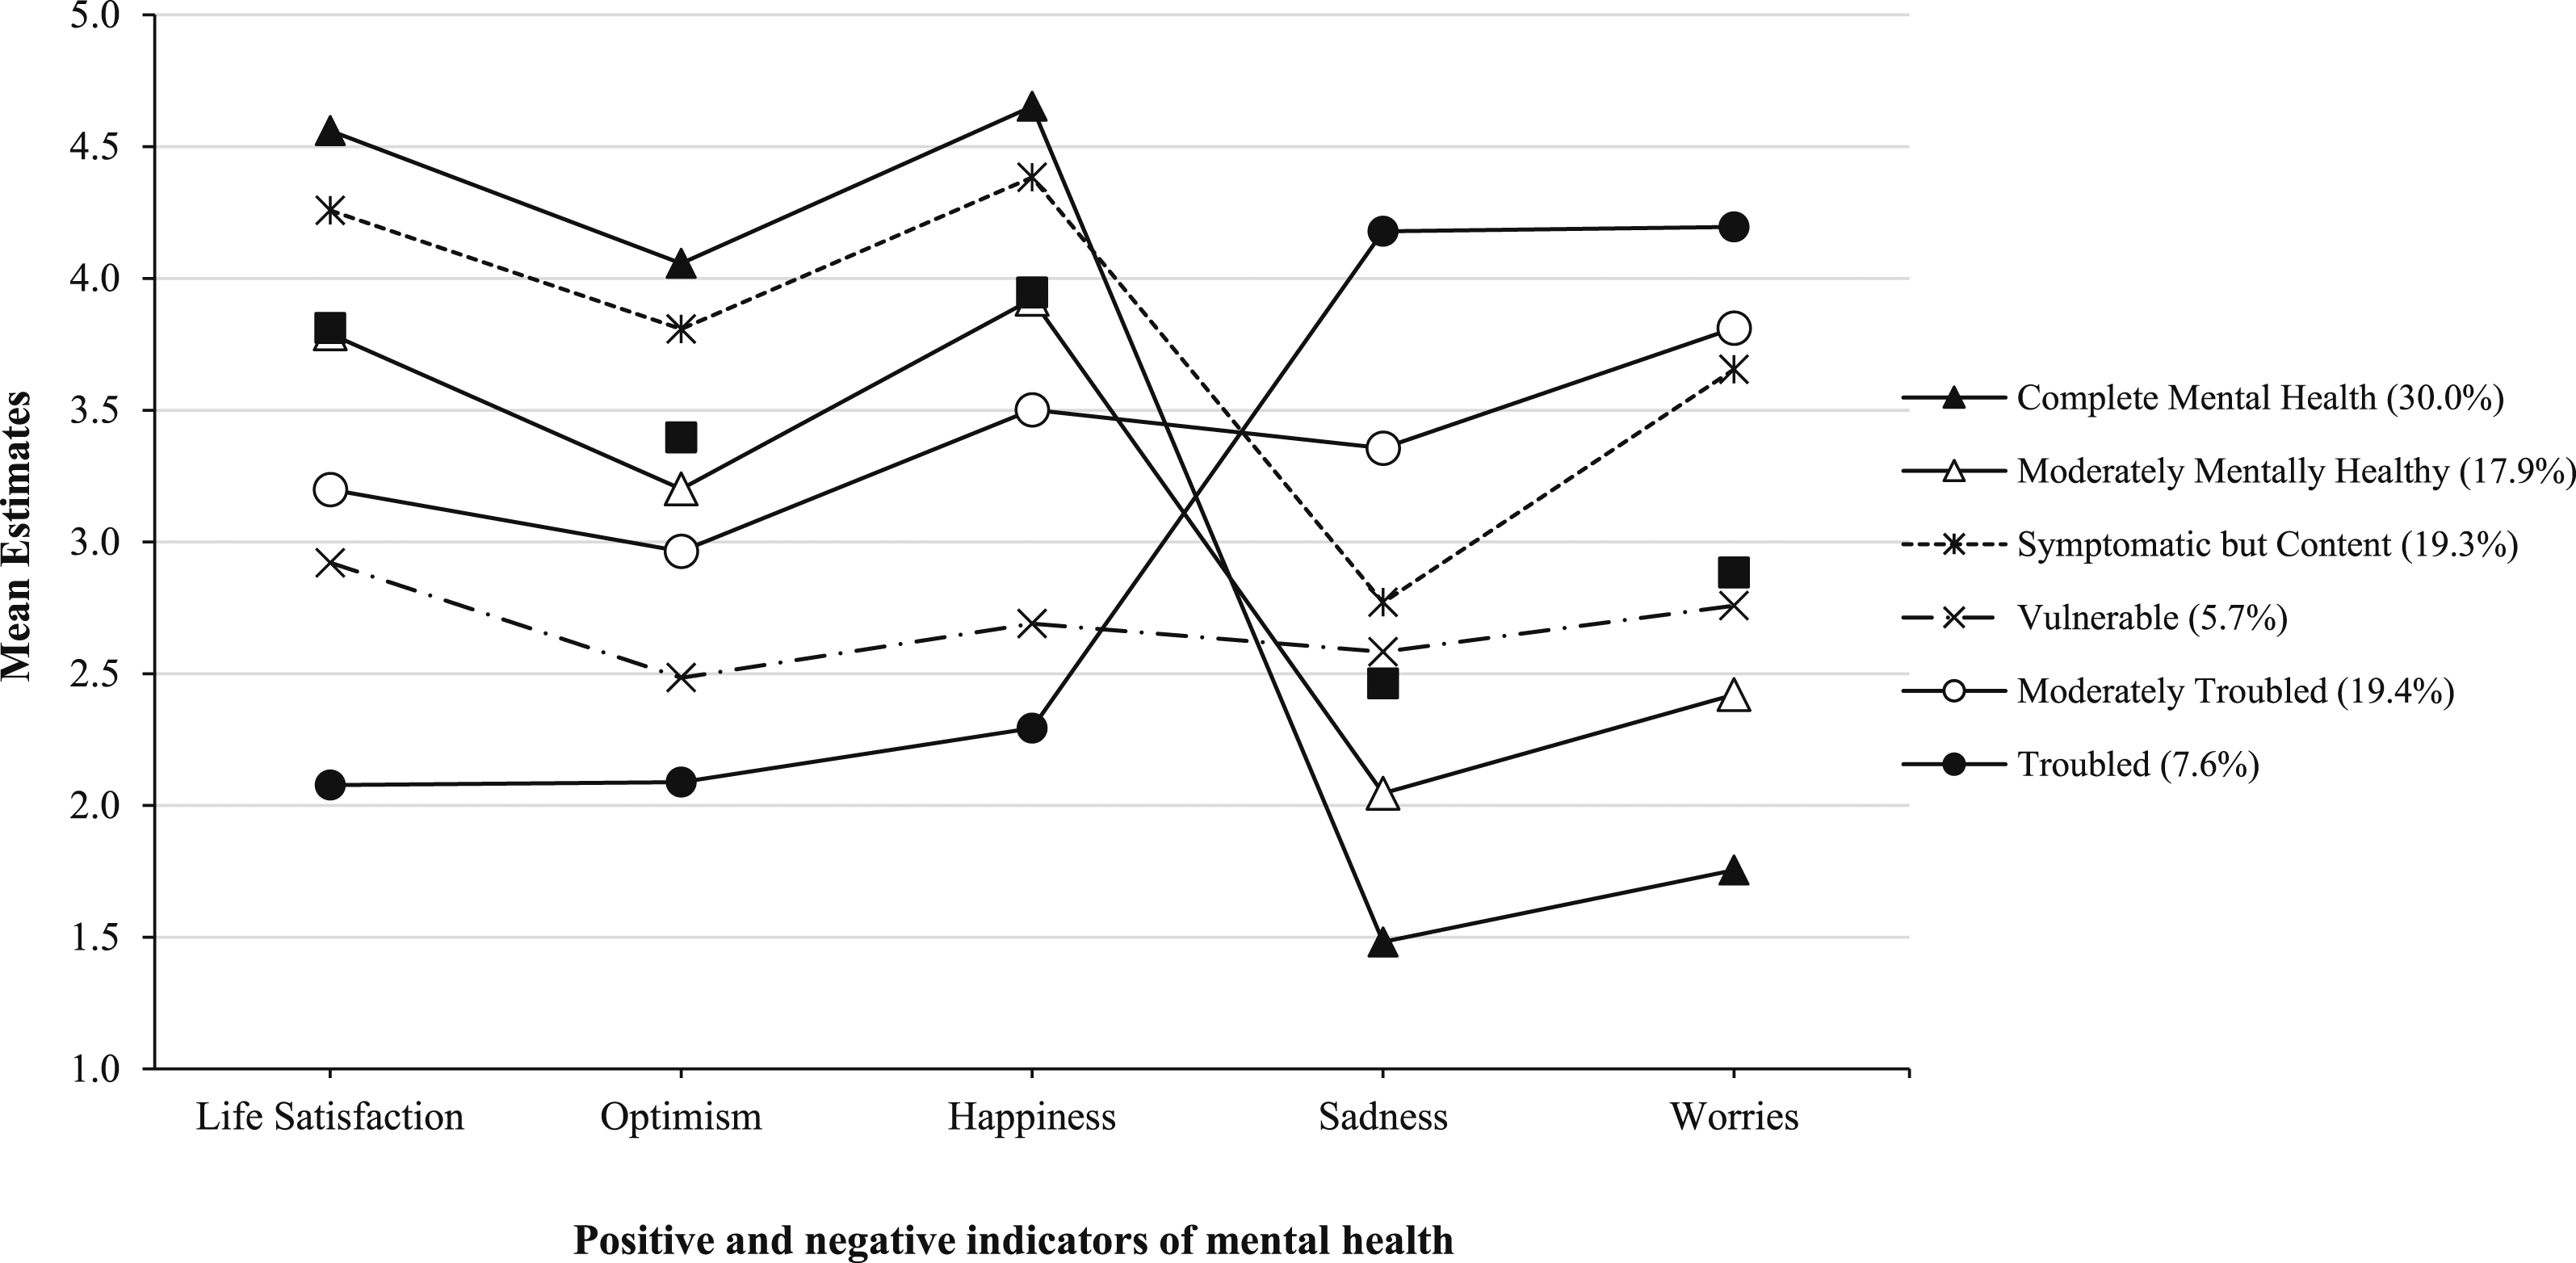
Mental health profiles and later school outcomes
Distal Outcomes in Grades 7 and 9 Across Mental Health Profiles (Grade 6) Using the BCH 3-Step Approach (n = 3,587).
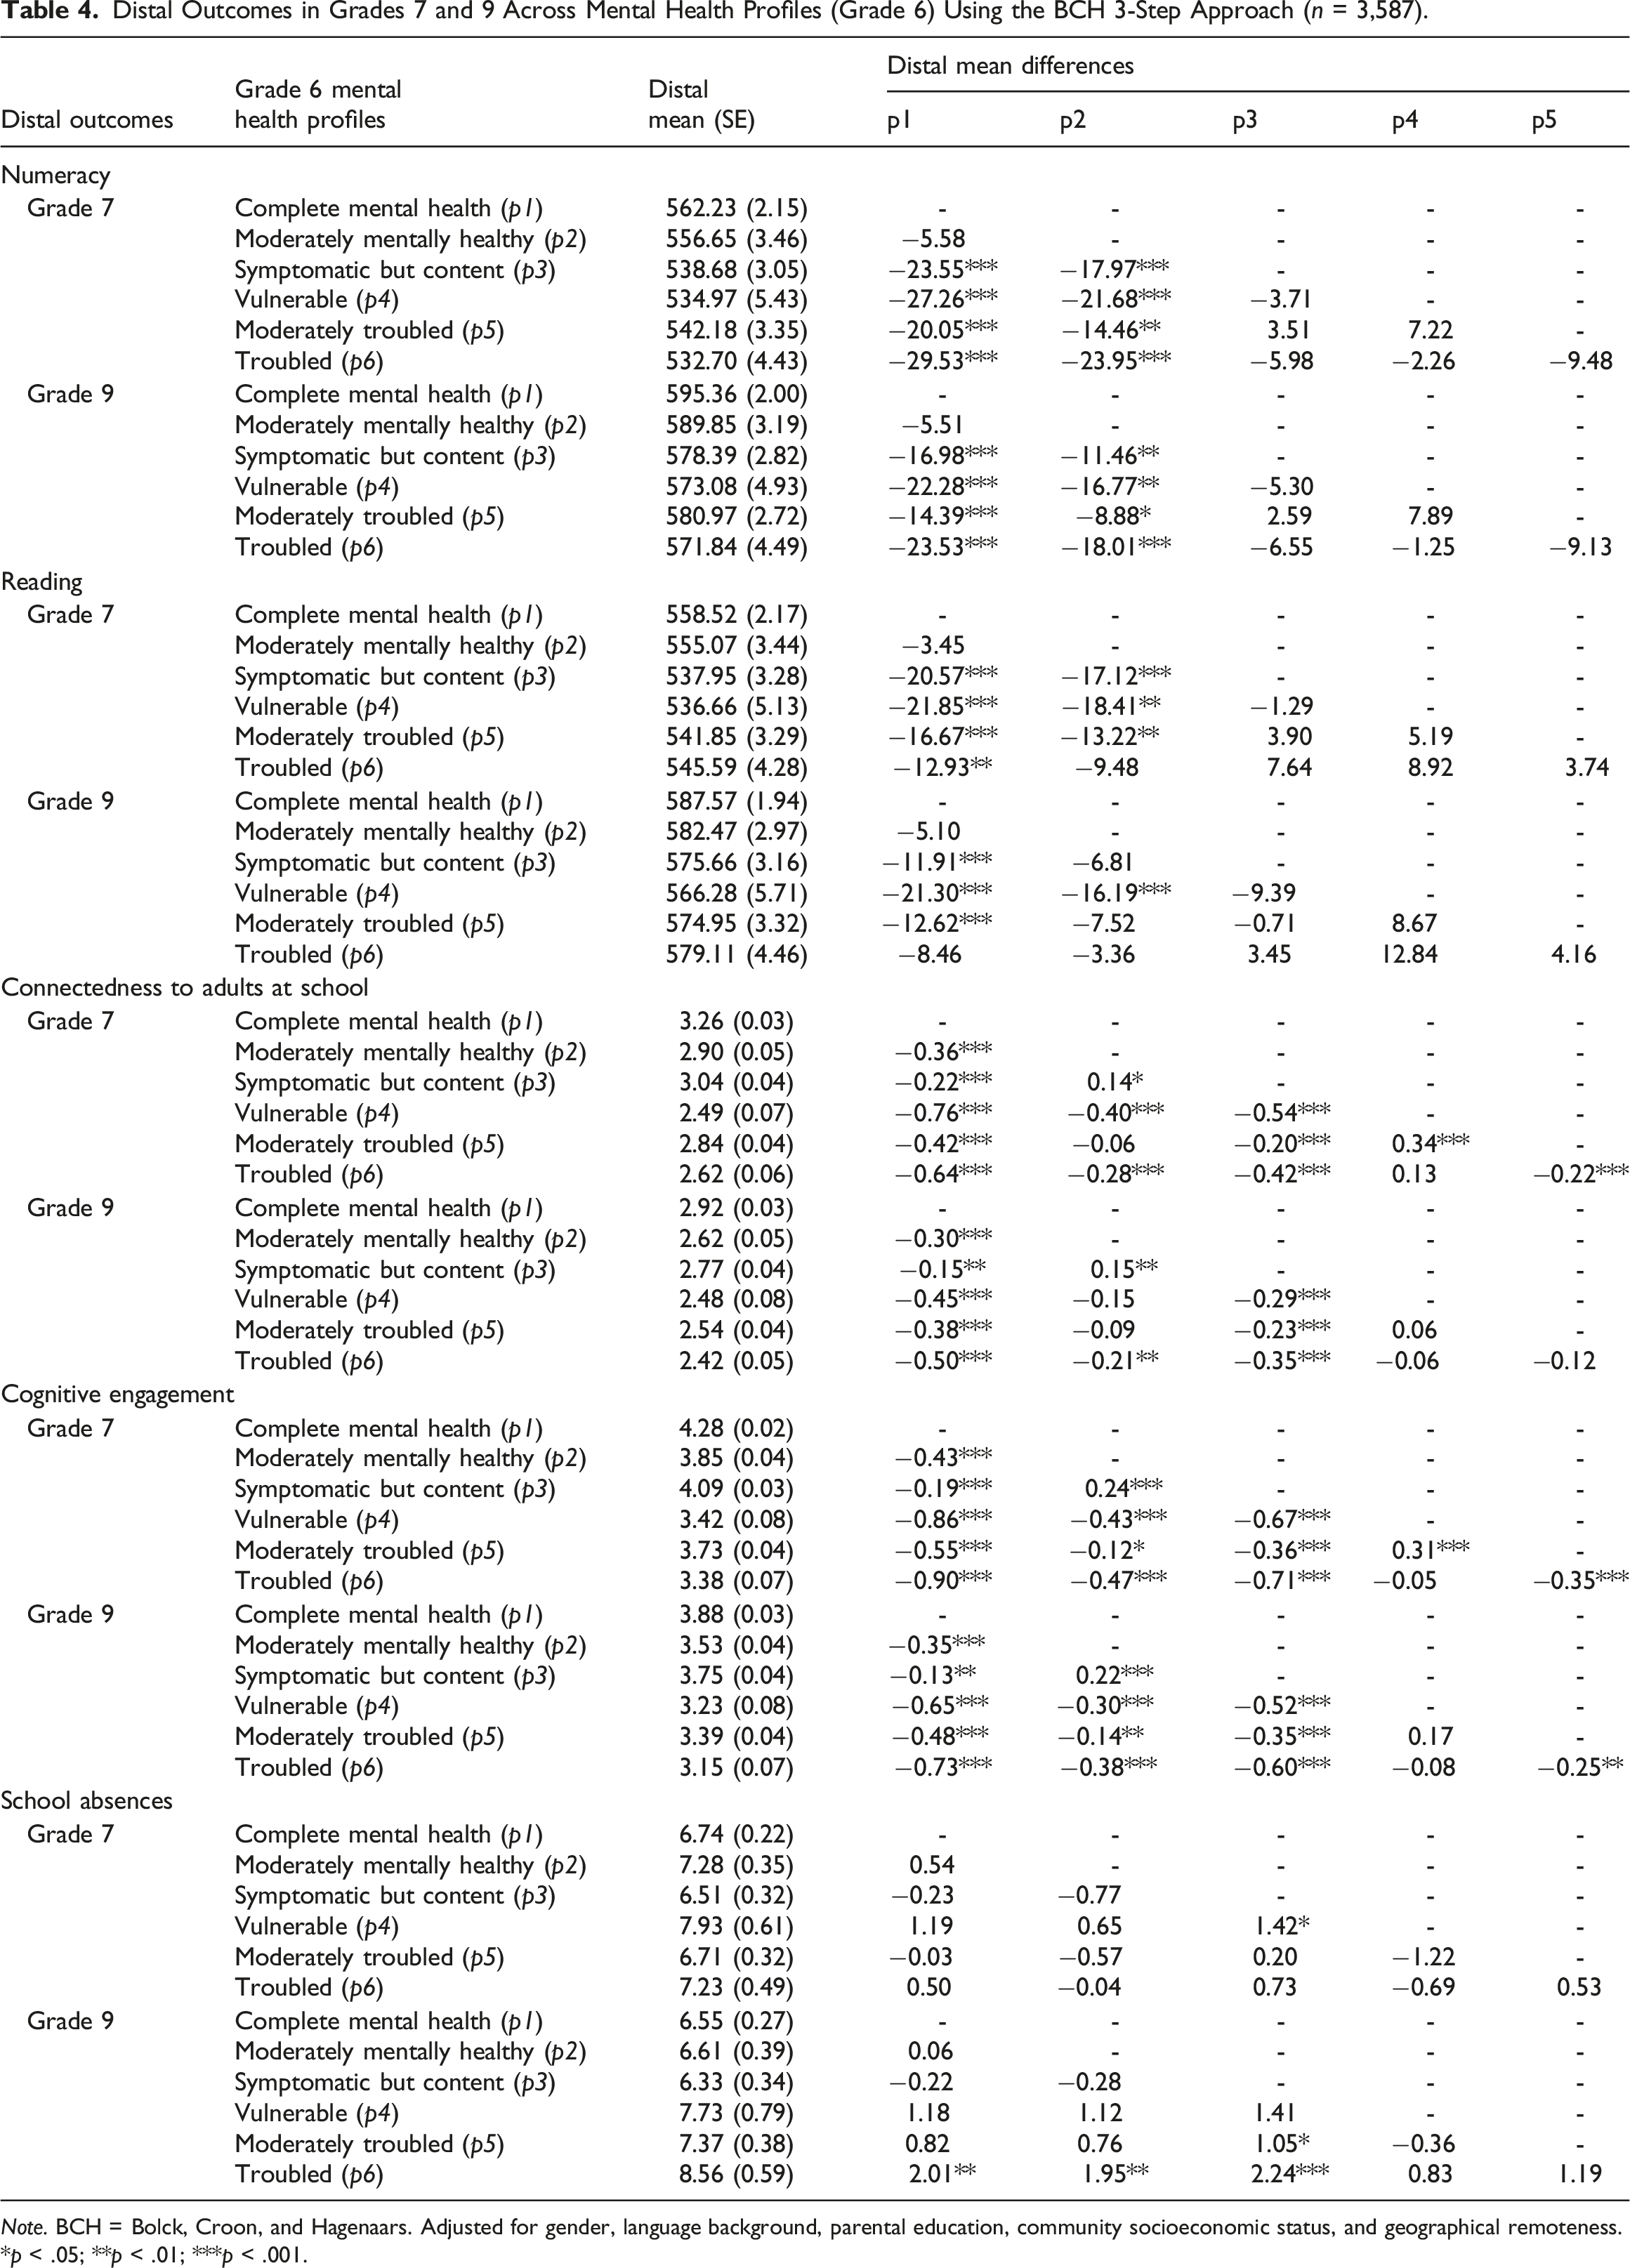
Note. BCH = Bolck, Croon, and Hagenaars. Adjusted for gender, language background, parental education, community socioeconomic status, and geographical remoteness.
*p < .05; **p < .01; ***p < .001.
Connectedness to adults at school, cognitive engagement, and school absences in grades 7 and 9 also differed depending on students’ mental health profiles in grade 6. Overall, results showed students with vulnerable and troubled profiles had the lowest levels of school engagement one and three years later. Compared to the complete mental health profile, students in all other profiles had significantly lower levels of connectedness to adults at school and cognitive engagement one year later, and these differences remained significant three years later. Students in the symptomatic but content profile reported higher levels of connectedness to adults at school and cognitive engagement in grades 7 and 9 than those moderately mentally healthy, vulnerable, moderately troubled, and troubled profiles. The effects of the mental health profiles on the levels of connectedness to adults at school and cognitive engagement were sustained over time from grades 7 to 9. Results were slightly different in the number of school absences. In grade 7, there were no significant differences in school absences between mental health profiles, except for a small difference between students in the vulnerable profile, and those in the symptomatic but content profile. By grade 9, there was evidence that students in the troubled profile had a significantly higher number of school absences than students in the complete mental health profile, moderately mentally healthy, and symptomatic but content profiles.
Discussion
Applying the dual-factor model of mental health, many studies have shown a concurrent relationship between mental health profiles and school outcomes (King et al., 2021; Rose et al., 2017; Suldo & Shaffer, 2008); however, there is a lack of research examining the relationship between mental health profiles of students and later school outcomes. The present study utilised a population-level dataset to, first, identify different profiles of mental health based on self-reported measures of positive and negative wellbeing indicators of students in grade 6 and, second, explore the association between mental health profiles and school outcomes one and three years later. The analysis identified six different mental health profiles consisting of complete mental health (i.e. high wellbeing and low distress), moderately mentally healthy (i.e. average wellbeing and low distress), symptomatic but content (i.e. high wellbeing and above-average distress), vulnerable (i.e. low wellbeing and below-average distress), moderately troubled (i.e. below-average wellbeing and high distress), and troubled (i.e. low wellbeing and high distress). Additionally, this study found that students with vulnerable or troubled profiles experienced the poorest academic achievement and school engagement one and three years later. Although two additional profiles (i.e. moderately mentally healthy and moderately troubled) were identified, these findings support the applicability of the dual-factor model and its relationship with long-term school outcomes.
Mental health profiles
Consistent with previous research applying the dual-factor model of mental health (Suldo & Shaffer, 2008), this study found that the largest percentage of students (30%) were allocated to the complete mental health profile, characterised by the highest levels of wellbeing and the lowest levels of distress. However, the current study also found a moderately mentally healthy profile (18% of students) characterised by average levels of wellbeing and low levels of distress. These findings were similar to those of Moore et al. (2019) who found 31%, 41%, and 21% of students in grades 9, 10, and 11, respectively, in the complete mental health profile, while 43%, 32%, and 44% of students, respectively, were in the moderately mentally healthy profile. In contrast to cut-point methods where students are allocated into one of four profiles that often result in 50%–70% of students classified in the complete mental health group (King et al., 2021; Smith et al., 2020), this study was able to differentiate between a group of students with high wellbeing and low distress (i.e. complete mental health) and a group of students with moderate wellbeing and low distress (i.e. moderately mentally healthy). This distinction can offer more precise and effective information for tailored programs aimed at supporting students in the education system. For example, the current study found students in the moderately mentally healthy profile had similar academic achievement and attendance rates to those in the complete mental health profile but poorer school engagement. As such, students with these two profiles might benefit from the same universal support for academic achievement and school attendance with some additional targeted support for students in the moderately mentally healthy profile for school engagement.
Consistent with the dual-factor model, the current study identified both symptomatic but content and vulnerable profiles. Specifically, 19% of the students had a symptomatic but content profile, suggesting that despite experiencing sadness and worries, these students reported high levels of life satisfaction, optimism, and happiness. A smaller percentage of the sample (6%) reported not only low levels of wellbeing but also below-average levels of distress (i.e. vulnerable), suggesting that absences of sadness and worries are not necessarily accompanied by high levels of wellbeing. These findings provide further support for the dual-factor model, which posits that wellbeing and distress reflect distinct constructs rather than opposite ends of a single mental health continuum (Greenspoon & Saklofske, 2001). The results in the current study are consistent with previous research using cut-point methods that found that the percentage of students in the symptomatic but content group was higher than the percentage of students in the vulnerable group (e.g. King et al., 2021). Nonetheless, several studies using empirical methods have failed to identify a symptomatic but content profile, a vulnerable profile, or both. These contradictory findings may be a result of the different indicators of mental health used in previous studies. For example, using life satisfaction and positive affect as indicators of wellbeing, and internalising and externalising problems as indicators of distress among middle school students in the US, Clark and Malecki (2022) found complete mental health, symptomatic but content, and troubled profiles but failed to identify a vulnerable profile.
Furthermore, the current study identified a moderately troubled profile (19% of students), characterised by below-average life satisfaction, optimism and happiness, and high distress, as well as a troubled profile (8% of students) characterised by the lowest level of wellbeing and highest levels of distress. These findings were similar to those of Kim et al. (2019) who found 40% of male students and 38% of female students in the moderate languishing profile (i.e. low wellbeing and moderate distress) and 17% of male students and 8% of female students in the languishing profile (i.e. lowest wellbeing and highest distress). In agreement with the results of the current study, previous studies have found a small percentage of students (4%–16%) are classified into the troubled profile (Moore et al., 2019; Rose et al., 2017). Evidently, empirical methods such as the LPA can identify profiles of mental health that are more complex than the four profiles described in the dual-factor model. Thus, for a group of students with below-average wellbeing and high distress (i.e. moderately troubled) who, in addition to clinical support to reduce distress, may benefit from programs that also build their positive wellbeing.
Mental health profiles and school outcomes
This study found that students’ mental health profiles identified in grade 6 were associated with their subsequent academic achievement and school engagement one and three years later. Specifically, students in the complete mental health and moderately mentally healthy profiles had better academic achievement (reading and numeracy) than students in all other mental health profiles over the follow-up periods. In terms of the size of these effects, students who were troubled had adjusted mean scores of approximately 0.5 SD and 0.4 SD lower in numeracy one and three years later, respectively, than those with complete mental health. Similarly, those who were vulnerable scored about 0.3 SD lower in reading than students with complete mental health in both grade 7 and grade 9. These findings are consistent with previous studies that indicated students with complete mental health had higher GPAs and higher reading and math scores up to one year later than students in other mental health groups (Lyons et al., 2013; Suldo et al., 2011). For instance, Suldo et al. (2011) found that students in the troubled group showed larger declines in their GPA and math scores in the subsequent one-year period than students with complete mental health, after controlling for socioeconomic status and parent marital status. Additionally, Lyons et al. (2013) found that students with a vulnerable group experienced a significant decline in their GPA compared to students with complete mental health, five months later. Together, these findings indicate that students with the highest levels of wellbeing and lowest levels of distress tend to achieve more favourable academic outcomes over time. Conversely, students who reported low levels of wellbeing, irrespective of their level of distress, appear to be at the highest risk of experiencing later academic challenges.
Furthermore, the study found that grade 6 students classified into the complete mental health profile had the highest levels of engagement at school up to three years later. After covariate adjustment, both troubled and vulnerable students had the lowest levels of connectedness to adults and cognitive engagement at school. For instance, troubled students showed effects equivalent to 0.8 SD and 1.2 SD points below the mean in the short term (grade 7) and 0.6 SD and 0.9 SD points below the mean in the longer term (grade 9), for connectedness to adults and cognitive engagement, respectively, compared to students in the complete mental health profile. This finding supports previous research indicating that low levels of wellbeing, combined with low or high levels of distress, can have long-term deleterious effects on students’ relationships with their teachers and their interest in school-related activities (Lyons et al., 2013). In addition, our study found that students in the complete mental health and symptomatic but content profiles had greater levels of school engagement than those in the moderately mentally healthy profile. For example, students in the symptomatic but content profile characterised by high wellbeing and above-average distress, had 0.2 SD and 0.3 SD points above the mean on connectedness to adults and cognitive engagement at school, respectively, in both grade 7 and grade 9, compared to students in the moderately mentally healthy profile. Our findings suggest that initial levels of wellbeing, regardless of levels of distress, appear to be fundamental for students’ engagement at school in later years. This highlights the importance of supporting students’ wellbeing to ensure sustained engagement and success in their educational journey.
This study found a weak association between mental health profiles and the number of days absent from school. Interestingly, results showed that students with the complete mental health profile did not have the best school attendance; instead, symptomatic but content students had the lowest number of school absences. Although few significant differences were observed in the short term, several significant associations emerged in the longer term. Students in the troubled profile missed, on average, two additional days of school in the first two terms of grade 9 compared to their peers in the complete mental health, moderately mentally healthy, and symptomatic but content profiles. These results contradict those of Suldo et al. (2011), who found students in the troubled group experienced a significant increase in school absences one year later. Additionally, in contrast to our findings, their study indicated that students in the complete mental health group had the best attendance, while symptomatic but content students had significantly more absences than those in the complete mental health group. It is important to note that the relatively weak association between mental health profiles and school absences in this study may relate to the fact that students who demonstrated high levels of absenteeism may have been excluded from the analysis sample, as they could be more likely to be absent on the day of the WEC survey and/or NAPLAN tests.
Limitations
This study has expanded upon previous research in several ways, but there are also several limitations. First, students attending non-government schools were excluded from the analysis, as students’ sociodemographic characteristics, school attendance, and NAPLAN scores could not be linked to the WEC data. In South Australia, non-government school students often live in the most advantaged communities compared to government school students (Australian Bureau of Statistics, 2020). Second, among government school students, the analysis sample was less representative of students living in the most disadvantaged communities. Previous research has shown that children from socioeconomically disadvantaged communities are less likely to have a complete mental health profile and are more likely to have symptomatic but content, vulnerable, and troubled profiles (Gregory et al., 2024; Rose et al., 2017). Therefore, our study might have underestimated the percentage of students in some of these profiles. Although the analysis sample is less likely to reflect the outcomes of non-government school students and those at the extremes of socioeconomic advantage and disadvantage, the sample is much larger than most other samples in this field and has captured information across 334 schools in South Australia. Finally, the absence of measures of externalising problems as indicators of distress may have implications for the mental health profiles that emerge. Given that the current study utilised existing data from an ongoing, annual census of wellbeing, only measures of internalising behaviours were available to define mental health profiles, as measures of externalising behaviours were not collected. Therefore, it is plausible that the lack of externalising measures captured in this study may have impacted the mental health profiles that emerge as well as their relationships with school outcomes.
Implications
The findings of this study have implications for educational systems seeking to understand and support student wellbeing and mental health. Considering recent Australian government funding for the Student Wellbeing Boost program, aimed at addressing the impact of the COVID-19 pandemic on students’ mental health (Ministers of the Education Portfolio, 2023), the current study provides timely information. Some Australian jurisdictions have already introduced tools designed to support mental health in school, for example, the South Australia DfE has provided schools with a list of evidence-based wellbeing programs that can be adopted to promote students’ wellbeing (Department for Education, 2023). Given these circumstances, it is important that school staff involved in supporting the mental health and wellbeing of students take a person-centred approach to determine the most appropriate holistic support, rather than considering individual-level indicators in isolation from each other. In practice, it would be ideal if school staff who supports students’ mental health partner with data-based teams in education departments to evaluate student mental health profiles using LPA. In the absence of these resources, schools are encouraged to use the traditional cut-point approach and take a holistic view of children’s mental health to inform data-driven and person-centred interventions. If relying on cut-point approaches, based on the results of this study, it is important to add additional cut-points to define more than just a high/low group. For example, defining a group of students who fall within the middle ranges on the wellbeing indicators, as well as low and high wellbeing. This may lead to the identification of six mental health groups comparable to those observed in this study and provide more nuanced information to inform interventions.
In view of the different mental health profiles found in this study, it is recommended that schools provide population-level as well as individual-level programs tailored to meet the unique needs of their students. For instance, Doll et al. (2021) describe a multi-tiered system that supports students with different mental health profiles. Tier 1, which encompasses universal programs, could provide all students with opportunities to increase their wellbeing. Tier 2, which includes targeted programs, could offer symptomatic but content students with specific strategies to manage symptoms of distress, and vulnerable students with services that develop their wellbeing and school engagement skills (Doll et al., 2021). Lastly, Tier 3, which involves intensive programs, could provide specialised support to troubled students, helping them reduce symptoms of distress, and improve their wellbeing. Given this study found two additional profiles, we speculate that students in the moderately mentally healthy profile might benefit from Tier 2 support, particularly from services targeted to increase school engagement while students in the moderately troubled profile might benefit from Tier 3 services like individual counselling. However, more research is needed to decide how to allocate these two ‘moderate’ profiles to mental health services in schools.
The observed association between mental health profiles and subsequent school outcomes provides impetus for the integration of early preventive and comprehensive programs into the school curriculum. Initiatives focused on early universal and/or targeted wellbeing and mental health interventions have proven to be effective in mitigating students’ disengagement from school and their academic learning in later years (see Suldo and Parker (2022)). Future research could expand on these findings by exploring associations between mental health profiles and school outcomes using latent transition analysis. This approach could offer a deeper understanding of how mental health profiles evolve over time and their influence on students’ educational outcomes.
Conclusion
This study provides evidence that the mental health profiles of students in grade 6 are associated with their school outcomes one and three years later. Students in grade 6 were classified into six mental health profiles, which were consistent with the dual-factor model of mental health. Students with a complete mental health profile had the highest academic achievement and school engagement one and three years later, and students with a troubled and vulnerable profile had the poorest school outcomes. Thus, the utility of the dual-factor model may inform on the levels of mental health needs of students to provide them with targeted mental health interventions appropriate to their level of need along with universal interventions for all, which may have flow-on effects on students’ later school outcomes.
Supplemental Material
Supplemental Material - Associations between mental health profiles and later school outcomes
Supplemental Material for Associations between mental health profiles and later school outcomes by Neida Sechague Monroy, Mary Brushe, Alanna Sincovich, Zara Boulton, and Tess Gregory in Australian Journal of Education.
Footnotes
Acknowledgements
The authors would like to thank the schools, teachers, and students who have participated in the Wellbeing and Engagement Collection (WEC).
Declaration of conflicting interests
The author(s) declared no potential conflicts of interest with respect to the research, authorship, and/or publication of this article.
Funding
The author(s) disclosed receipt of the following financial support for the research, authorship, and/or publication of this article: This work was funded through a National Health and Medical Research Council (NHMRC) Partnership Grant (APP1170743), awarded to Professor Brinkman and Dr. Gregory. This grant provided funding from both the NHMRC and an industry partner organisation (South Australian Department for Education).
Data Availability Statement
The linked WEC and NAPLAN data used in this paper was provided via a data application to the South Australian Department for Education. Our data agreement does not allow us to deposit the data in a data repository. However, other researchers can apply for access to the linked data through the South Australian Department for Education (![]() ).
).
Supplemental Material
Supplemental material for this article is available online.