
Abstract
Australian children from regional, rural and remote (RRR) areas exhibit lower educational outcomes than their peers in metropolitan areas. The mechanisms driving the comparatively poorer educational outcomes of children in RRR areas, however, are not well understood. This paper proposes and tests two sets of factors that may be responsible for these disparities: population socio-demographic composition and school climate. Using rich survey and linked administrative data from the Longitudinal Study of Australian Children (n = 9,248 observations), we estimate the relative contribution of these sets of factors to RRR children’s disadvantage in NAPLAN numeracy test scores. Our results indicate that both socio-demographic and school climate factors account for part of the educational disparities between children in RRR and metropolitan areas. These findings suggest that hybrid policy approaches that tackle both the social determinants of educational success and use schools as an intervention site are required to close the achievement gap.
Introduction
Australia is one of the most geographically diverse countries in the developed world, and geographic location constitutes a major factor shaping the personal, social and economic lives of Australian people. A key divide in the Australian geographical hierarchy is that separating major cities – the main hubs of Australian economic and socio-cultural life – and its more isolated and deprived regional, rural and remote (RRR) areas (Anti-Poverty Week, 2019; Baxter et al., 2011; McLachlan et al., 2013; Saunders & Wong, 2012). Typically, individuals residing in major cities tend to fare better than those residing in RRR area across a range of domains, including their education, employment prospects, financial wellbeing, and health outcomes.
Children are not impervious to the disadvantages stemming from living away from urban cores. This observation is in fact well recognised in Australian research on children’s developmental outcomes, including their cognitive and academic progress. For example, children who live in RRR areas exhibit worse educational outcomes than their peers living in metropolitan areas. In 2019, the average National Assessment Program Literacy and Numeracy (NAPLAN) reading score for Year 3 students was 441 scale points in metropolitan areas, compared to 419 in inner regional areas, 406 in outer regional areas, 384 in remote areas, and 311 in very remote areas (Australian Curriculum, Assessment and Reporting Authority (ACARA), 2019). These geographic disparities in student performance have been reported across school years, academic domains, and Australian states/territories, (ACARA, 2019), and their magnitude has increased since NAPLAN was first introduced in 2008 (Smith et al., 2019).
The vast and persistent pattern of educational disadvantage experienced by children from RRR areas has elicited significant policy concerns (ACARA, 2019; Halsey, 2018; Herbert, 2020; Lamb et al., 2015; 2020). Yet the factors driving differences in achievement gaps between children in RRR and metropolitan areas remain poorly understood – hampering progress towards the design and implementation of efficient and effective policy solutions. The present study fills this critical gap in scholarly knowledge by estimating the extent to which achievements gaps between RRR and metropolitan primary- and secondary-school students depend on two sets of factors: (i) children’s and families’ socio-demographic profiles and (ii) the quality and character of school life, as captured by ‘school climate’. Understanding the relative role of these sets of factors has important implications for the types of policies that are necessary to close the gap. To accomplish this, in the remainder of this paper, we leverage unique survey and linked administrative data from Growing Up in Australia: The Longitudinal Study of Australian Children and multiple regression models.
Literature Review
Diverging Educational Outcomes of Children from RRR and Metropolitan Areas
Despite policy efforts to increase equity in the Australian school system (e.g. Halsey, 2018; Herbert, 2020; Lamb et al., 2015; 2020), accumulating empirical evidence points to persistent developmental and educational disparities between children in RRR and metropolitan areas. Disparities favouring metropolitan over RRR students have been reported, for example, in relation to mental health (e.g. Bowman et al., 2017; Dray et al., 2016), academic performance (e.g. ACARA, 2019; Smith et al., 2019; Thomson et al., 2017), and enrolment in higher education (e.g. Chesters & Cuervo, 2021).
Remoteness has also been shown to be negatively associated with various post-school outcomes (Chesters & Cuervo, 2021; National Centre for Vocational Education Research., 2020; Universities Australia, 2020). For instance, despite a significant increase in the number of undergraduate students from RRR areas (from 110,124 in 2008 to 162,985 in 2018), in 2019, the percentage of people aged 25–34 years old with a university degree was 45.5% in metropolitan areas compared to less than a quarter (23.7%) in RRR areas (Universities Australia, 2020). Further, drawing on nationally representative data from the Longitudinal Surveys of Australian Youth (LSAY), Chesters and Cuervo (2021) showed that RRR students are less likely to enrol in higher education, even after controlling for academic achievement at age 15 and Australian Tertiary Admission Rank (ATAR) scores.
Research shows that RRR communities in Australia experience a ‘unique concentration of multiple forms of educational disadvantage’ (Smith et al., 2019, p.135). Young people in RRR areas face various barriers to access support (e.g. Aisbett et al., 2007; Smith et al., 2019) and constraints to achieve better outcomes (e.g. Halsey, 2018; Parker et al., 2016). As Smith et al. (2019) summarised, such barriers include distance to metropolitan areas, higher levels of poverty, a sparse population with limited access to resources, small school sizes with composite classes, and difficulties in attracting and retaining quality teachers. In addition, recent studies point to the unequal availability of cultural and social resources in RRR areas, which limit rural students’ aspirations for higher education options (Cuervo et al., 2019).
Population Composition as a Driver of Differences in Student Outcomes
A wealth of Australian social-science literature shows that children and families in rural areas ‘look’ demographically and socio-economically different to those residing in metropolitan areas (see e.g. Baxter et al., 2011). Critical to our arguments, these differences encompass factors that can act as barriers to, or facilitators of, children’s educational success. One example is parental education, a resource known to dramatically enhance children’s educational outcomes (see e.g. Black et al., 2005; Dickson et al., 2016). This enhancement occurs through channels such as parental ability and predisposition to help children with homework, transmission of educational aspirations and expectations and a shared genetic pool (Davis-Kean et al., 2021). However, the population composition in RRR areas features an overrepresentation of individuals with low levels of formal education. According to the Australian Bureau of Statistics [ABS] (2022), the share of individuals with a bachelor’s degree was 36% in major cities, 20% in inner regional areas, 16% in outer regional areas, and 17% in remote and very remote areas.
Similarly, the Australian household income of people living outside of capital cities in Australia was, on average, 18% lower than that of people living in capital cities, whereas household net worth was 29% lower (ABS, 2017). Yet evidence indicates that parental income is a major enabler to children’s educational achievements, through channels such as the ability to pay for tutors, enrol children in high-quality schools, or purchase expensive educational equipment (e.g. computer hardware and software) (Duncan et al., 1994; Duncan & Brooks-Gunn, 1999). Further, RRR areas tend to house greater shares of individuals from vulnerable population groups, including Aboriginal and Torres Strait Islander Australians – who face significant additional challenges to education, including systemic racism, intergenerational trauma and western-centric curricula (see e.g. Bodkin-Andrews & Carlson, 2016; Brown, 2019).
Collectively, the evidence discussed within this section suggests that socio-demographic factors may explain a non-negligible portion of the achievement gap between students from RRR and metropolitan areas. However, as we elaborate in the next section, other factors at the school level may also play an important role.
School Climate as a Plausible Mechanism Driving RRR Student Disadvantage
Besides differences rooted at the child or family levels, there are also differences between RRR and metropolitan areas in a critical component of the education system: schools. Differences in the characteristics of schools across geographical areas may thus be responsible for the diverging outcomes of students living in RRR and metropolitan areas. Which school characteristics may be at play? To guide this difficult question, we refer to a well-established conceptual framework in education research, namely that of school climate. School climate can be broadly defined as the quality and character of school life; it is ‘based on patterns of people’s experiences of school life and reflects norms, goals, values, interpersonal relationships, teaching and learning practices, and organisational structures’ (Cohen et al., 2009, p. 180).
School climate is a multidimensional construct encompassing many aspects of school life (Cohen et al., 2009; Thapa et al., 2013; Wang & Degol, 2016). Despite a lack of consensus about the specific indicators contributing to school climate (Cohen et al., 2009; Grazia & Molinari, 2020; Thapa et al., 2013; Wang & Degol, 2016), there is some agreement about four key domains. These are as follows: (i) safety (e.g. discipline and order, physical and emotional safety), (ii) academic climate (e.g. teaching and learning practice, quality of instruction and professional development), (iii) relationships and community (e.g. respect for diversity, quality of relationships) and (iv) institutional environment (e.g. size of school, availability of resources). For each of these domains, there is strong empirical evidence – predominantly from the US – indicating that a positive school climate is predictive of students’ academic achievement, school success and healthy development (see e.g. Cohen et al., 2009; Wang & Degol, 2016).
The distribution of school climate factors across the Australian geography is, however, not uniform. Instead, there is evidence that schools located in RRR areas feature less positive school climates than those located in metropolitan areas. For example, an Australian study by Sullivan and colleagues using Programme for International Student Assessment (PISA) data compared school climate factors across metropolitan and rural schools. Their findings indicated that, in rural areas, students reported less positive disciplinary climates, principals perceived less positive teacher and student behaviours, and both students and principals perceived less positive learning environments (Sullivan, et al., 2014).
Similarly, Lamb et al. (2014) argued that differences in educational outcomes between RRR and metropolitan students can be explained by schools in rural areas being smaller. As the authors note, small schools ‘tend to have fewer resources, are often less able to employ specialist staff or offer specialist subjects or programs, have to use composite multigrade classes, provide fewer opportunities for professional development, have more difficulty recruiting and retaining teachers, provide less support for special needs students and offer fewer options for courses’ (Lamb et al., 2014, p. 68).
The comparatively poorer average school climate in RRR compared to metropolitan schools may be traced back to lower levels of government and self-generated funding (relative to need) amongst schools in these areas (Independent Schools Council of Australia, 2017; Lamb et al., 2014), as well as challenges faced by such schools in attracting and retaining suitably qualified staff (Lamb et al., 2014; OECD, 2019; Young et al., 2018). Taken together, this evidence suggests that differences in school climate between RRR and metropolitan areas may be partially responsible for differences in student outcomes between these areas.
The Present Study: Aims and Contributions
The aim of the present study is to quantify the extent to which socio-demographic and school climate factors can explain differences in educational achievement between RRR and metropolitan students. In doing so, we make three key contributions to the literature.
First, we provide distinctly robust and up-to-date estimates of the true extent of the educational disadvantage experienced by RRR students, as denoted by NAPLAN numeracy test scores. These data come from administrative linkages from official records, which minimises the reporting errors and social desirability biases inherent to self- or proxy-reports of educational attainment.
Second, we offer a novel application of the concept of school climate within quantitative education research in the Australian context. Leveraging the rich data at hand, we document how multiple indicators tapping each dimension of school climate are empirically associated with Australian students’ test scores from Years 3–9.
Third, understanding the relative role of socio-demographic and school-level factors as drivers of differences in achievement between RRR and metropolitan students has critical implications for the design and implementation of equity policies that can successfully ‘close the gap’. A preponderance of socio-demographic factors would imply that differences in student outcomes are compositional and depend on the characteristics of families and children who reside in RRR areas. This would hint at the need for policies that address those socio-demographic factors that are malleable – for example, parental education and income. A dominance of school climate factors, however, would indicate that differences in student outcomes are driven by school characteristics and practices. Such a finding would suggest the need to intervene at schools.
Data and Methods
Dataset: The Longitudinal Study of Australian Children
The aim of this study is to examine the degree to which socio-demographic and school climate factors can explain the diverging academic performance of students in RRR and metropolitan areas. To accomplish this, we use data from a large-scale longitudinal survey, Growing Up in Australia: The Longitudinal Study of Australian Children (LSAC). LSAC is a nationally representative study following the development of ∼10,000 children in Australia. The study began in 2004 with a representative sample of children from urban and rural areas of all states and territories in Australia (Mohal et al., 2022). Data are collected every 2 years from two cohorts of young people, one comprising children aged 0–1 year in 2004 (B cohort) and one comprising children aged 4–5 years in 2004 (K cohort). As of mid-2021, 8 full waves of LSAC data are available.
LSAC study informants include the study child, their parents (both resident and non-resident), teachers and carers. With informant (parent) consent, the LSAC data have also been linked to several administrative databases. This includes NAPLAN scores capturing official assessments of children’s literacy and numeracy performance in Years 3, 5, 7 and 9, as well as school-level data from the My School dataset maintained by the Australian Curriculum, Assessment and Reporting Authority’s (ACARA). The latter provides information about key characteristics of the child’s school, such as location, sector, and student and staff numbers.
The LSAC data are ideal to achieve our research aims, as they incorporate rich information on key socio-demographic characteristics of students and their families, including their place of residence; multiple indicators tapping the four domains of school climate (including through linkages to administrative records on schools’ institutional features); and objective measures of students’ academic achievement (from linkages to NAPLAN). For the purposes of this project, we use data from Waves 2 to 5 for K-cohort children, for whom we were able to observe NAPLAN numeracy scores for school Years 3, 5, 7 and 9. After listwise deletion of records with missing data on the explanatory variables, our analytic sample includes 9,248 observations from 3,698 children. 1
Measures
Key Explanatory Variable: RRR Status
Our RRR measure is based on the Remoteness Areas Structure within the Australian Statistical Geography Standard (ASGS), which provides a statistical hierarchy of areas based on a measure of relative access to services (ABS, 2022). Consistent with current practice in Australian education research (see e.g. Halsey, 2018), we construct an indicator capturing regional, rural and remote (RRR) areas by combining the following categories of the ASGS: inner regional areas, outer regional areas, remote areas and very remote areas. The remaining category of major cities is therefore used as the contrast. Across LSAC survey waves, 11.7–15.2% of our sample resided in RRR areas.
Outcome Variable: NAPLAN Numeracy Test Scores
To measure academic performance, we use objective test scores obtained from LSAC’s administrative data linkages. Specifically, we use scores from the National Assessment Program – Literacy and Numeracy (NAPLAN), a national standardised testing program assessing students’ fundamental literacy and numeracy skills. NAPLAN is undertaken annually by students in Years 3 and 5 (primary school) and Years 7 and 9 (secondary school). In this paper, we primarily use results from NAPLAN numeracy tests, which assess students on their proficiency in understanding, fluency, problem-solving and reasoning across the three content strands of mathematics (numbers and algebra, measurement and geometry, and statistics and probability) (ACARA, 2017). The use of NAPLAN numeracy scores as a global indicator of academic achievement is common in Australian education research (see e.g. Smith et al., 2019; Tomaszewski et al., 2020). NAPLAN scores range from a theoretical minimum of 0 to a theoretical maximum of 1,000, with higher scores indicating greater performance.
Intervening Variables: Socio-Demographic and School Climate Factors
The socio-demographic variables used in the analyses represent factors known to affect children’s educational performance. They include child’s age (expressed in months), child’s sex (male/female), child’s Aboriginal and Torres Strait Islander background (yes/no), child’s non-English-speaking background (NESB) (yes/no), maternal educational qualifications (degree-level/below degree-level), weekly parental income (expressed in AU$1,000s), household type (two-parent family/one- or no-parent family) and presence of siblings (yes/no).
The richness of the LSAC data allow us to derive several indicators for each domain of school climate. This includes: • two indicators of the school-safety domain (teacher-reported school discipline policy, and student-reported experiences of bullying); • four indicators of the academic domain (teachers’ evaluations of the quality of their work environment, teachers’ self-efficacy, frequency with which teachers organise their class by achievement level, and teachers’ use of computers in class); • six indicators for the domain of relationships and community (teachers’ perceptions of parent involvement in school activities, teachers’ perceived relationships with the students, parents’ perceptions of their interaction with the school, teachers’ perceptions of students’ behavioural engagement in school, students’ perceptions of their relationship with teachers, and students’ enjoyment of school); and • four indicators of the institutional environment domain, retrieved from linked administrative data from the MySchool dataset (school sector, school size, staff-to-student ratio, and proportion of students from non-English speaking backgrounds).
Details on the derivation and properties of each of these school-level variables are presented in Table A1 in the Appendix. Due to data availability, some of these indicators are only used in analyses of primary school outcomes (NAPLAN scores for Years 3 and 5) and some are only used in analyses of secondary school outcomes (NAPLAN score for Years 7 and 9). 2
Analytic Strategy
To estimate the degree to which (i) socio-demographic factors and (ii) school climate factors are responsible for the observed gaps in test-score outcomes between RRR and metropolitan students, we fit a series of ordinary least squares (OLS) regression models using Stata 17 software (StataCorp, 2021). We begin by fitting a base model (Model 1) in which the outcome variable is the NAPLAN numeracy test score for a given school year (3, 5, 7 or 9) and the only explanatory variable is an RRR indicator. This model gives us a base or raw estimate of the achievement gap between RRR and metropolitan students, as captured by the coefficient on the RRR variable.
We subsequently fit additional regression models in which we add to Model 1 socio-demographic factors (Model 2), school climate factors (Model 3), and both socio-demographic and school climate factors (Model 4). By comparing the magnitude and statistical significance of the coefficient on the RRR variable across models, we can ascertain the degree to which socio-demographic and school climate factors can account for differences in NAPLAN scores between RRR and metropolitan students. Specifically, any movement of the RRR coefficient towards zero or towards statistical non-significance indicates that the added variables are responsible for (part of) the differences. We repeat this process for the four outcome variables of interest, capturing NAPLAN numeracy test scores for school Years 3, 5, 7 and 9. 3
Findings/Results
Unadjusted Differences in Test Scores, Socio-Demographic Factors and School Climate Factors between RRR and Metropolitan Students
Sample Means/Percentages for Model Variables.
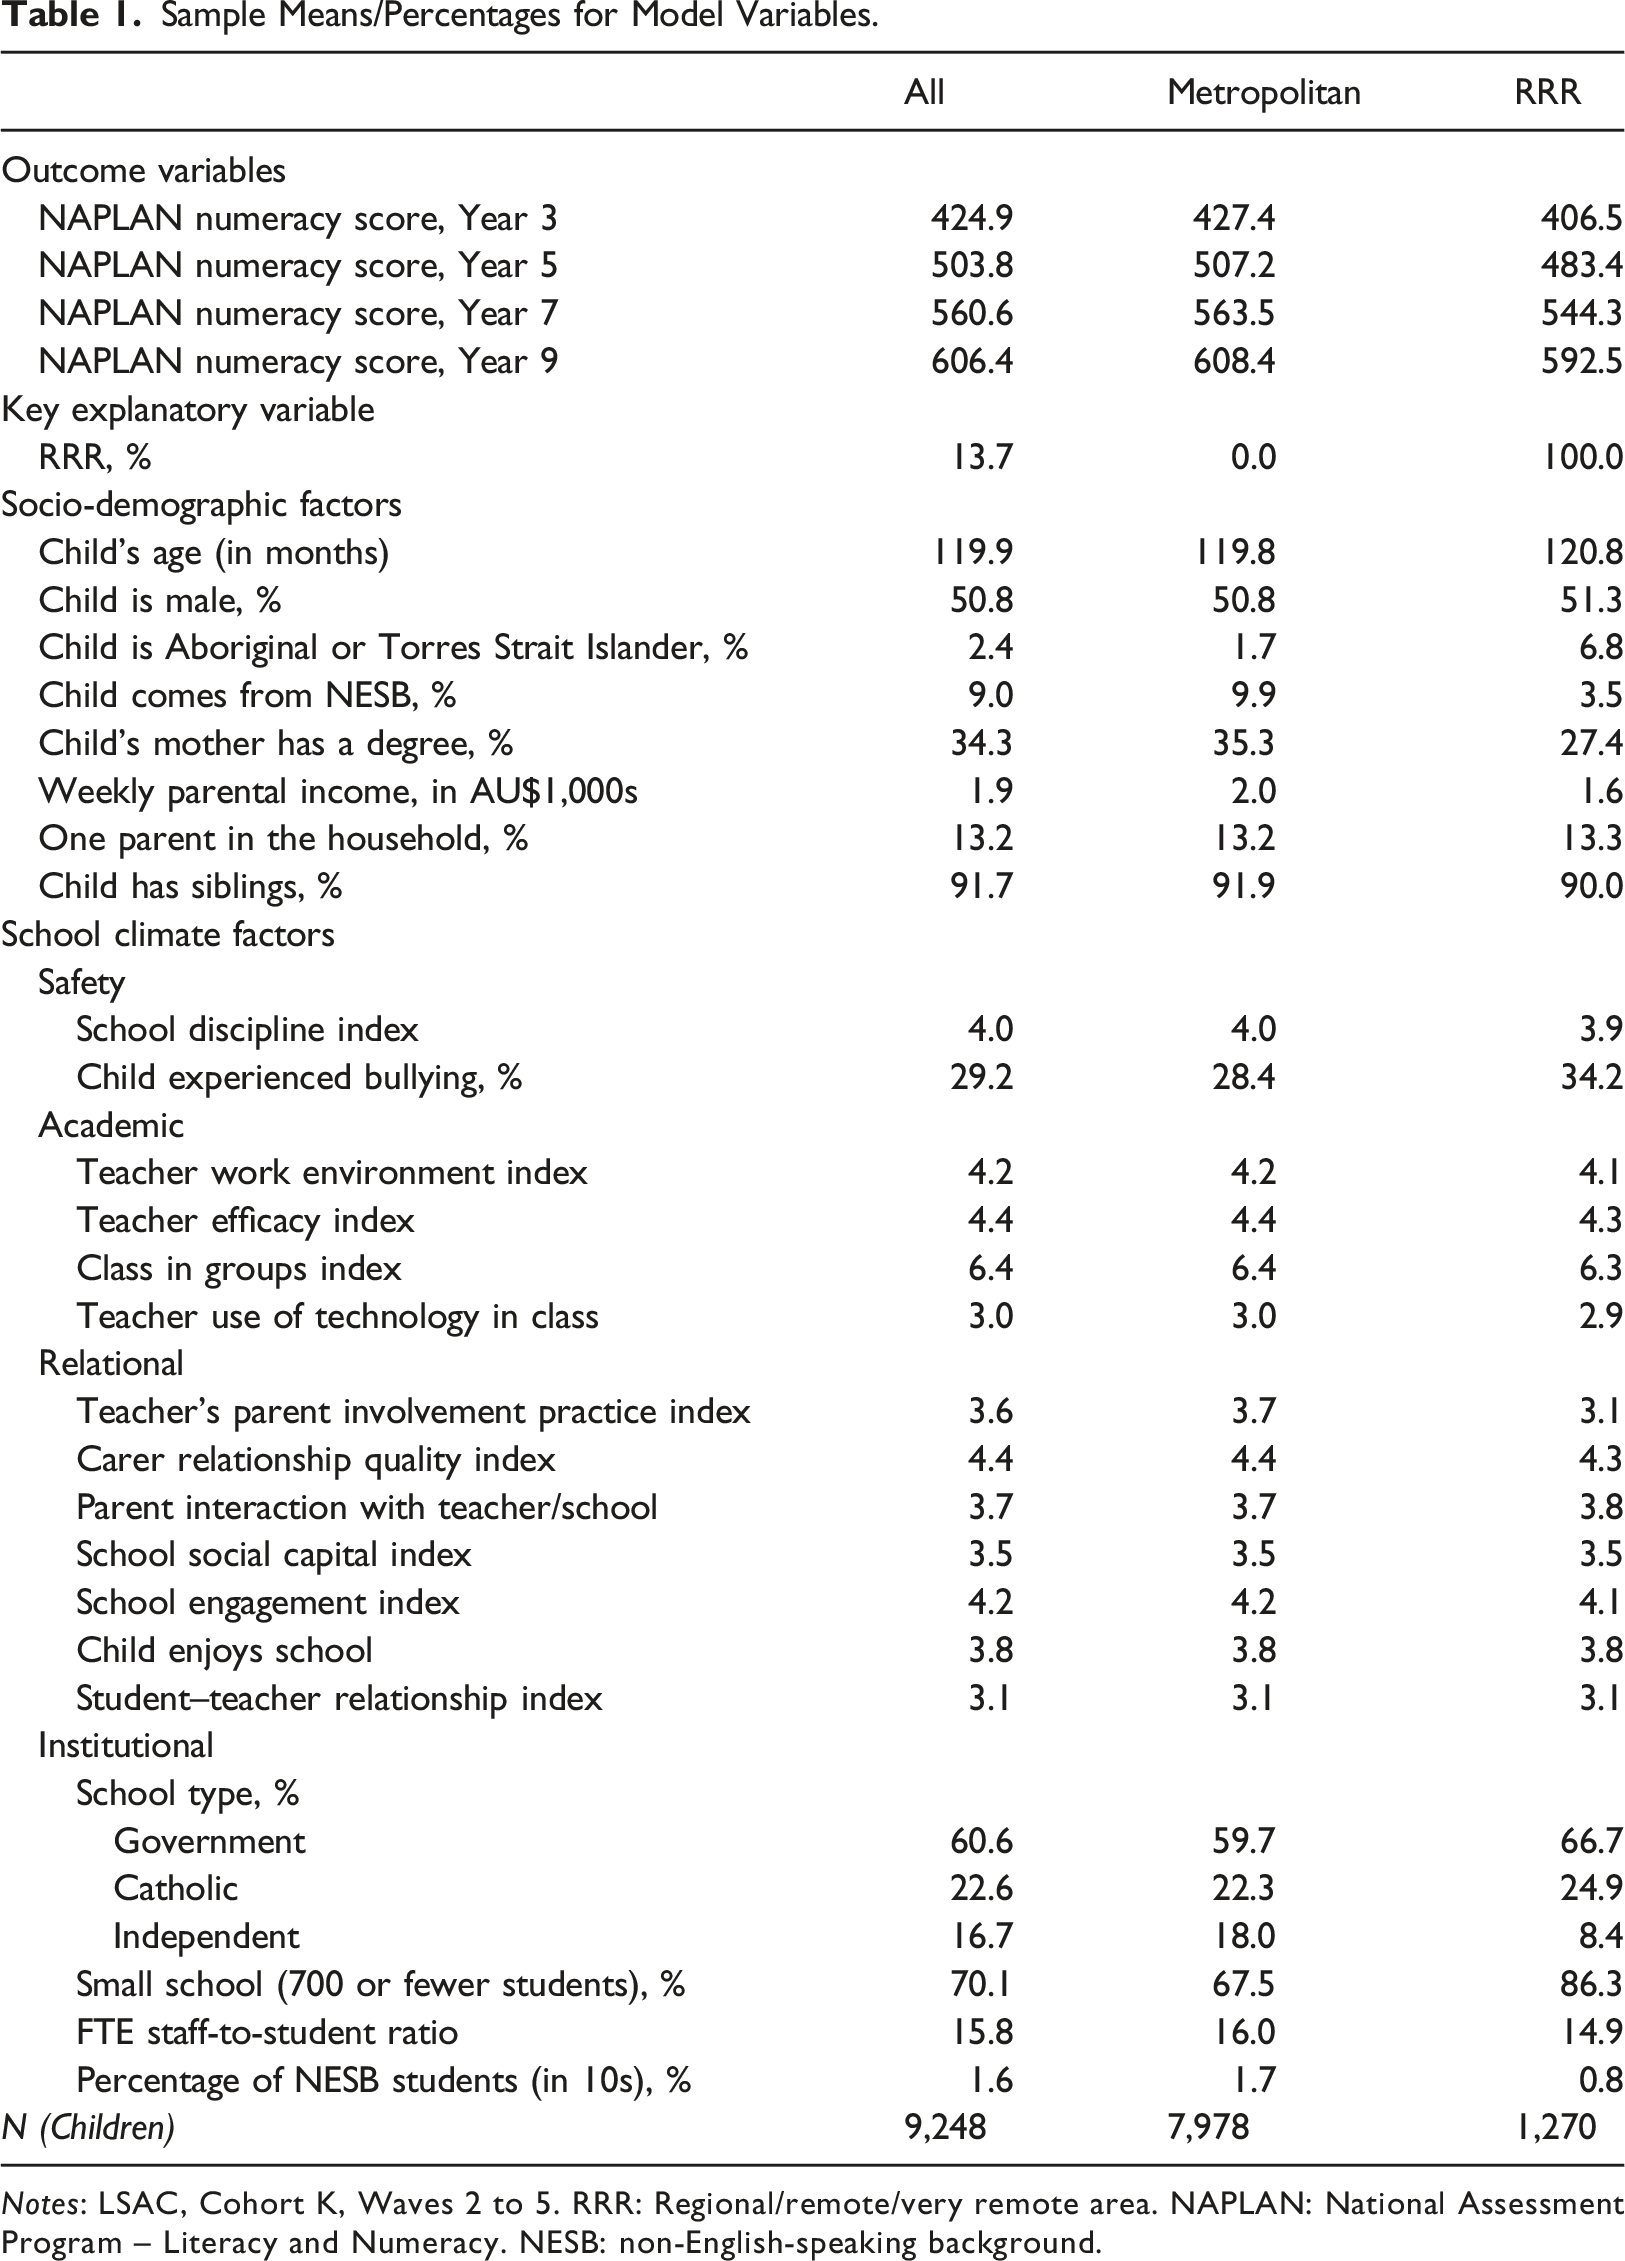
Notes: LSAC, Cohort K, Waves 2 to 5. RRR: Regional/remote/very remote area. NAPLAN: National Assessment Program – Literacy and Numeracy. NESB: non-English-speaking background.
As expected, there were also statistically significant differences in the socio-demographic characteristics of RRR and metropolitan students. For example, a greater share of RRR (6.8%) than metropolitan (1.7%) students were Indigenous, whereas a greater share of metropolitan (9.9%) than RRR (3.5%) students were from non-English speaking backgrounds. A higher percentage of mothers had university-level qualifications in metropolitan compared to RRR areas (35.3% compared to 27.4%) and weekly parental income was approximately $400 greater in metropolitan than RRR areas ($2,000 compared to $1,600). There were smaller geographical differences in household composition, children’s ages and gender, and presence of siblings.
The characteristics of schools also differed by area of residence. For example, compared to children in RRR areas, children in metropolitan areas faced greater levels of school discipline (4.0 compared to 3.9 units), school engagement (4.2 compared to 4.1 units), positive teacher work environments (4.2 compared to 4.1 units), teacher efficacy (4.4 compared to 4.3 units), use of technology in class (3.0 compared to 2.9 units), parental involvement practices (3.7 compared to 3.1 units), carer relationship quality (4.4 compared to 4.3 units) and staff-to-student ratios (16.0 compared to 14.9), and were more likely to attend independent schools (18.0% compared to 8.4%). Meanwhile, compared to children in metropolitan areas, children in RRR areas had greater levels of parents’ interaction with teachers (3.8 compared to 3.7 units) and were more likely to be bullied (34.2% compared to 28.4%) and to attend small (86.3% compared to 67.5%) and government (66.7% compared to 59.7%) schools.
Altogether, these descriptive statistics point to systematic differences of various magnitudes between children in RRR and metropolitan areas in socio-demographic and school climate factors. Typically, students in metropolitan areas were in more advantageous circumstances than their peers from RRR areas. These factors may act as intervening variables in the relationship between area of residence and children’s test scores. In the next section, we empirically examine this proposition.
Estimating the Contribution of Socio-Demographic and School Climate Factors to Test-Score Gaps between RRR and Metropolitan Students
Regression Models of NAPLAN Numeracy Test Scores.
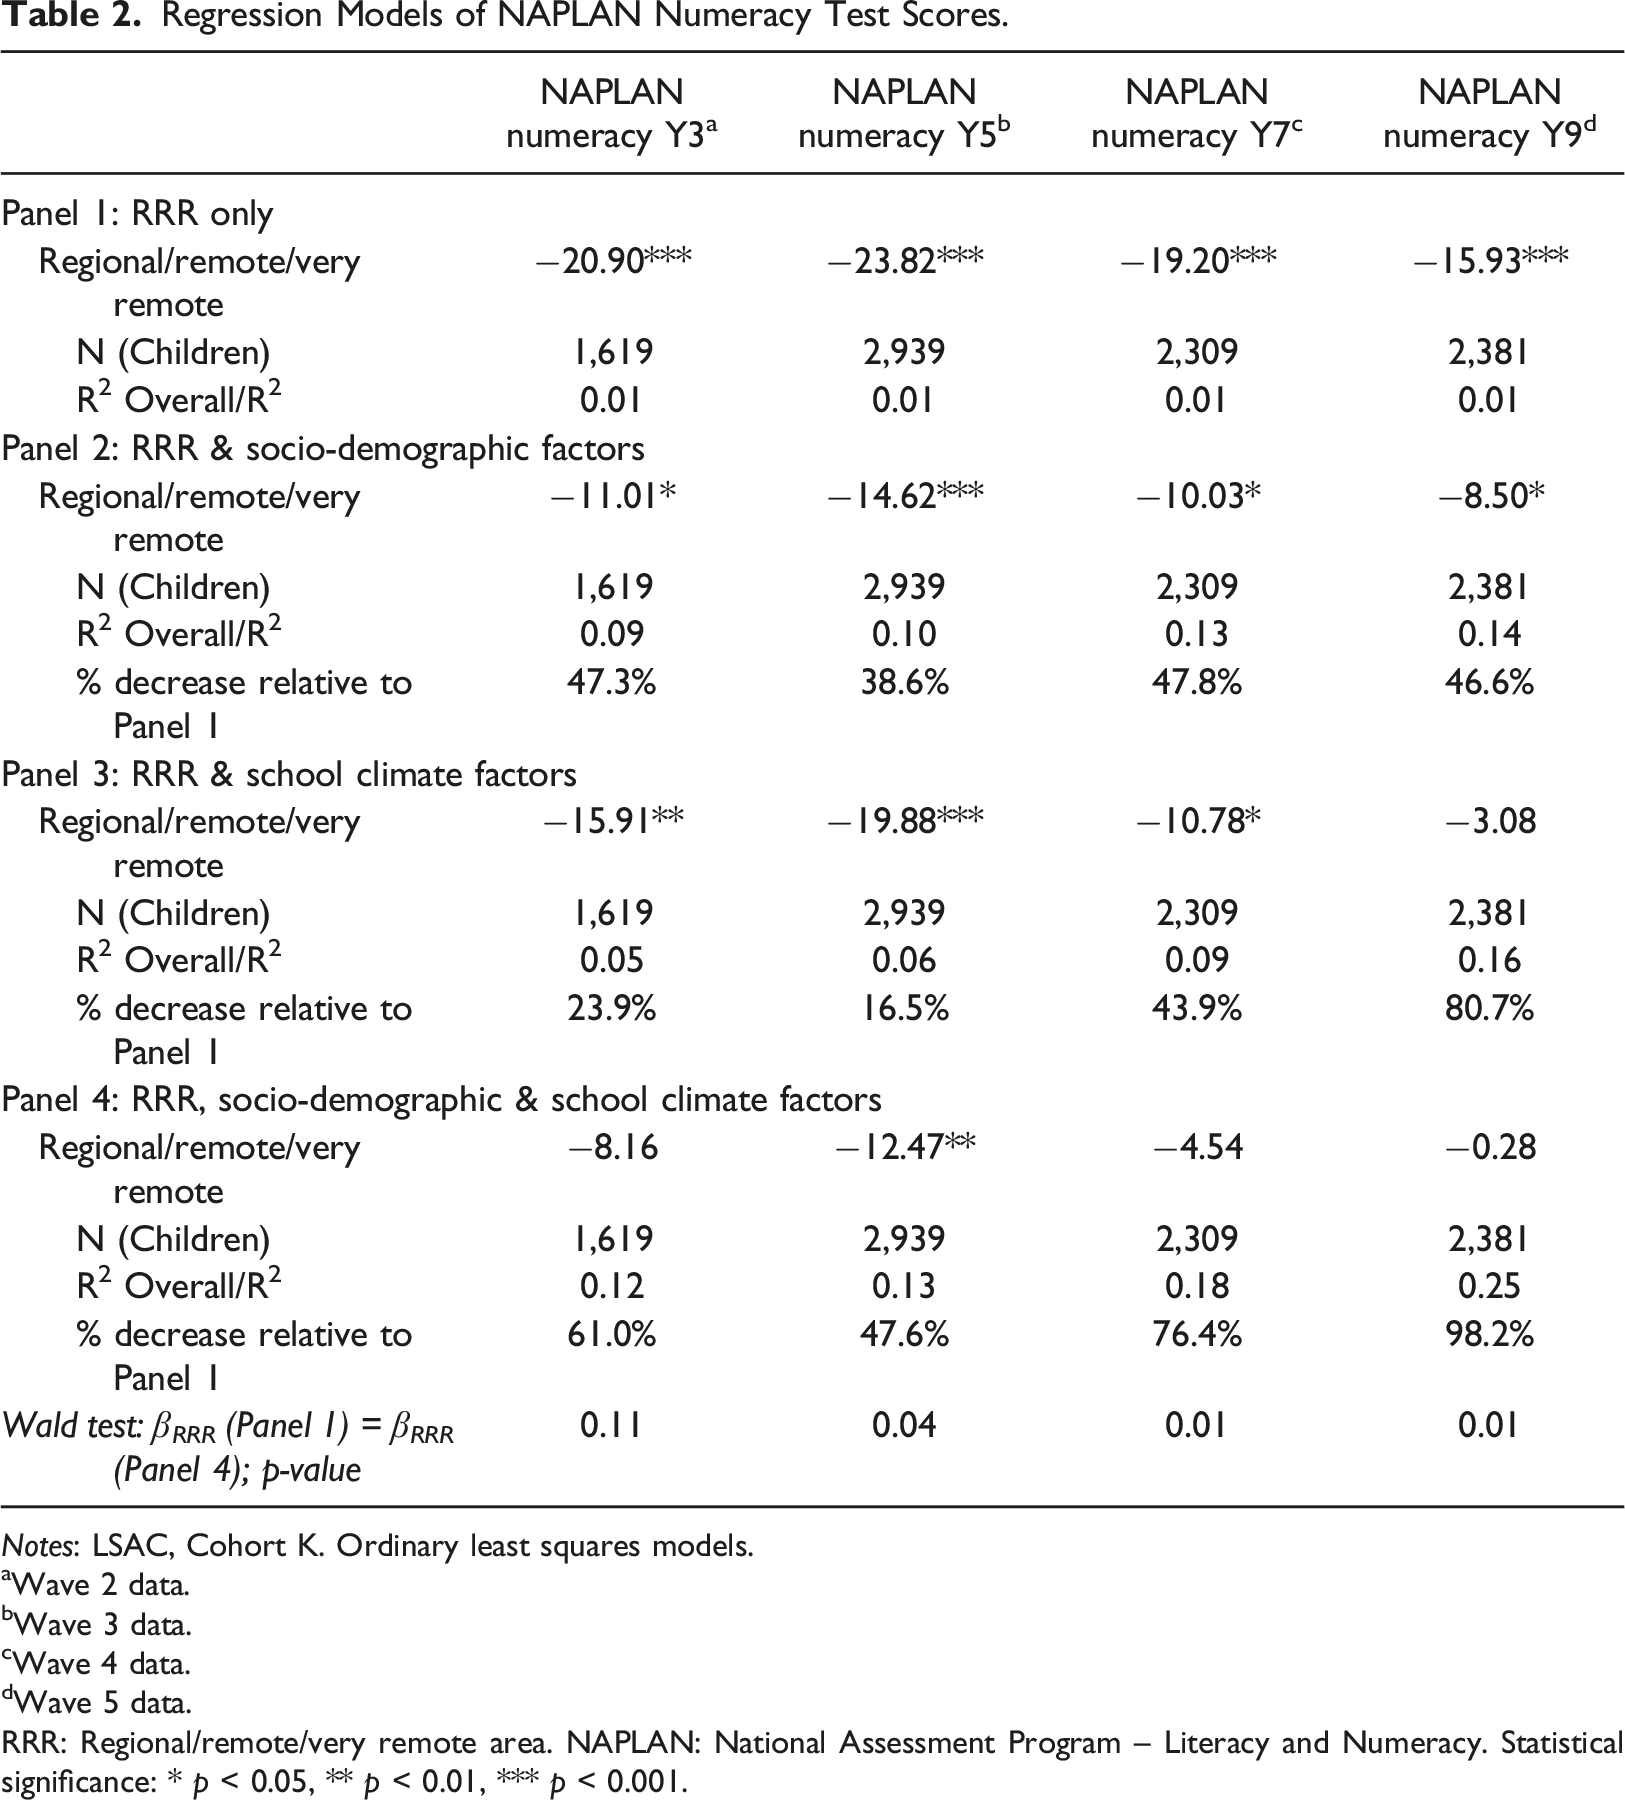
Notes: LSAC, Cohort K. Ordinary least squares models.
aWave 2 data.
bWave 3 data.
cWave 4 data.
dWave 5 data.
RRR: Regional/remote/very remote area. NAPLAN: National Assessment Program – Literacy and Numeracy. Statistical significance: * p < 0.05, ** p < 0.01, *** p < 0.001.
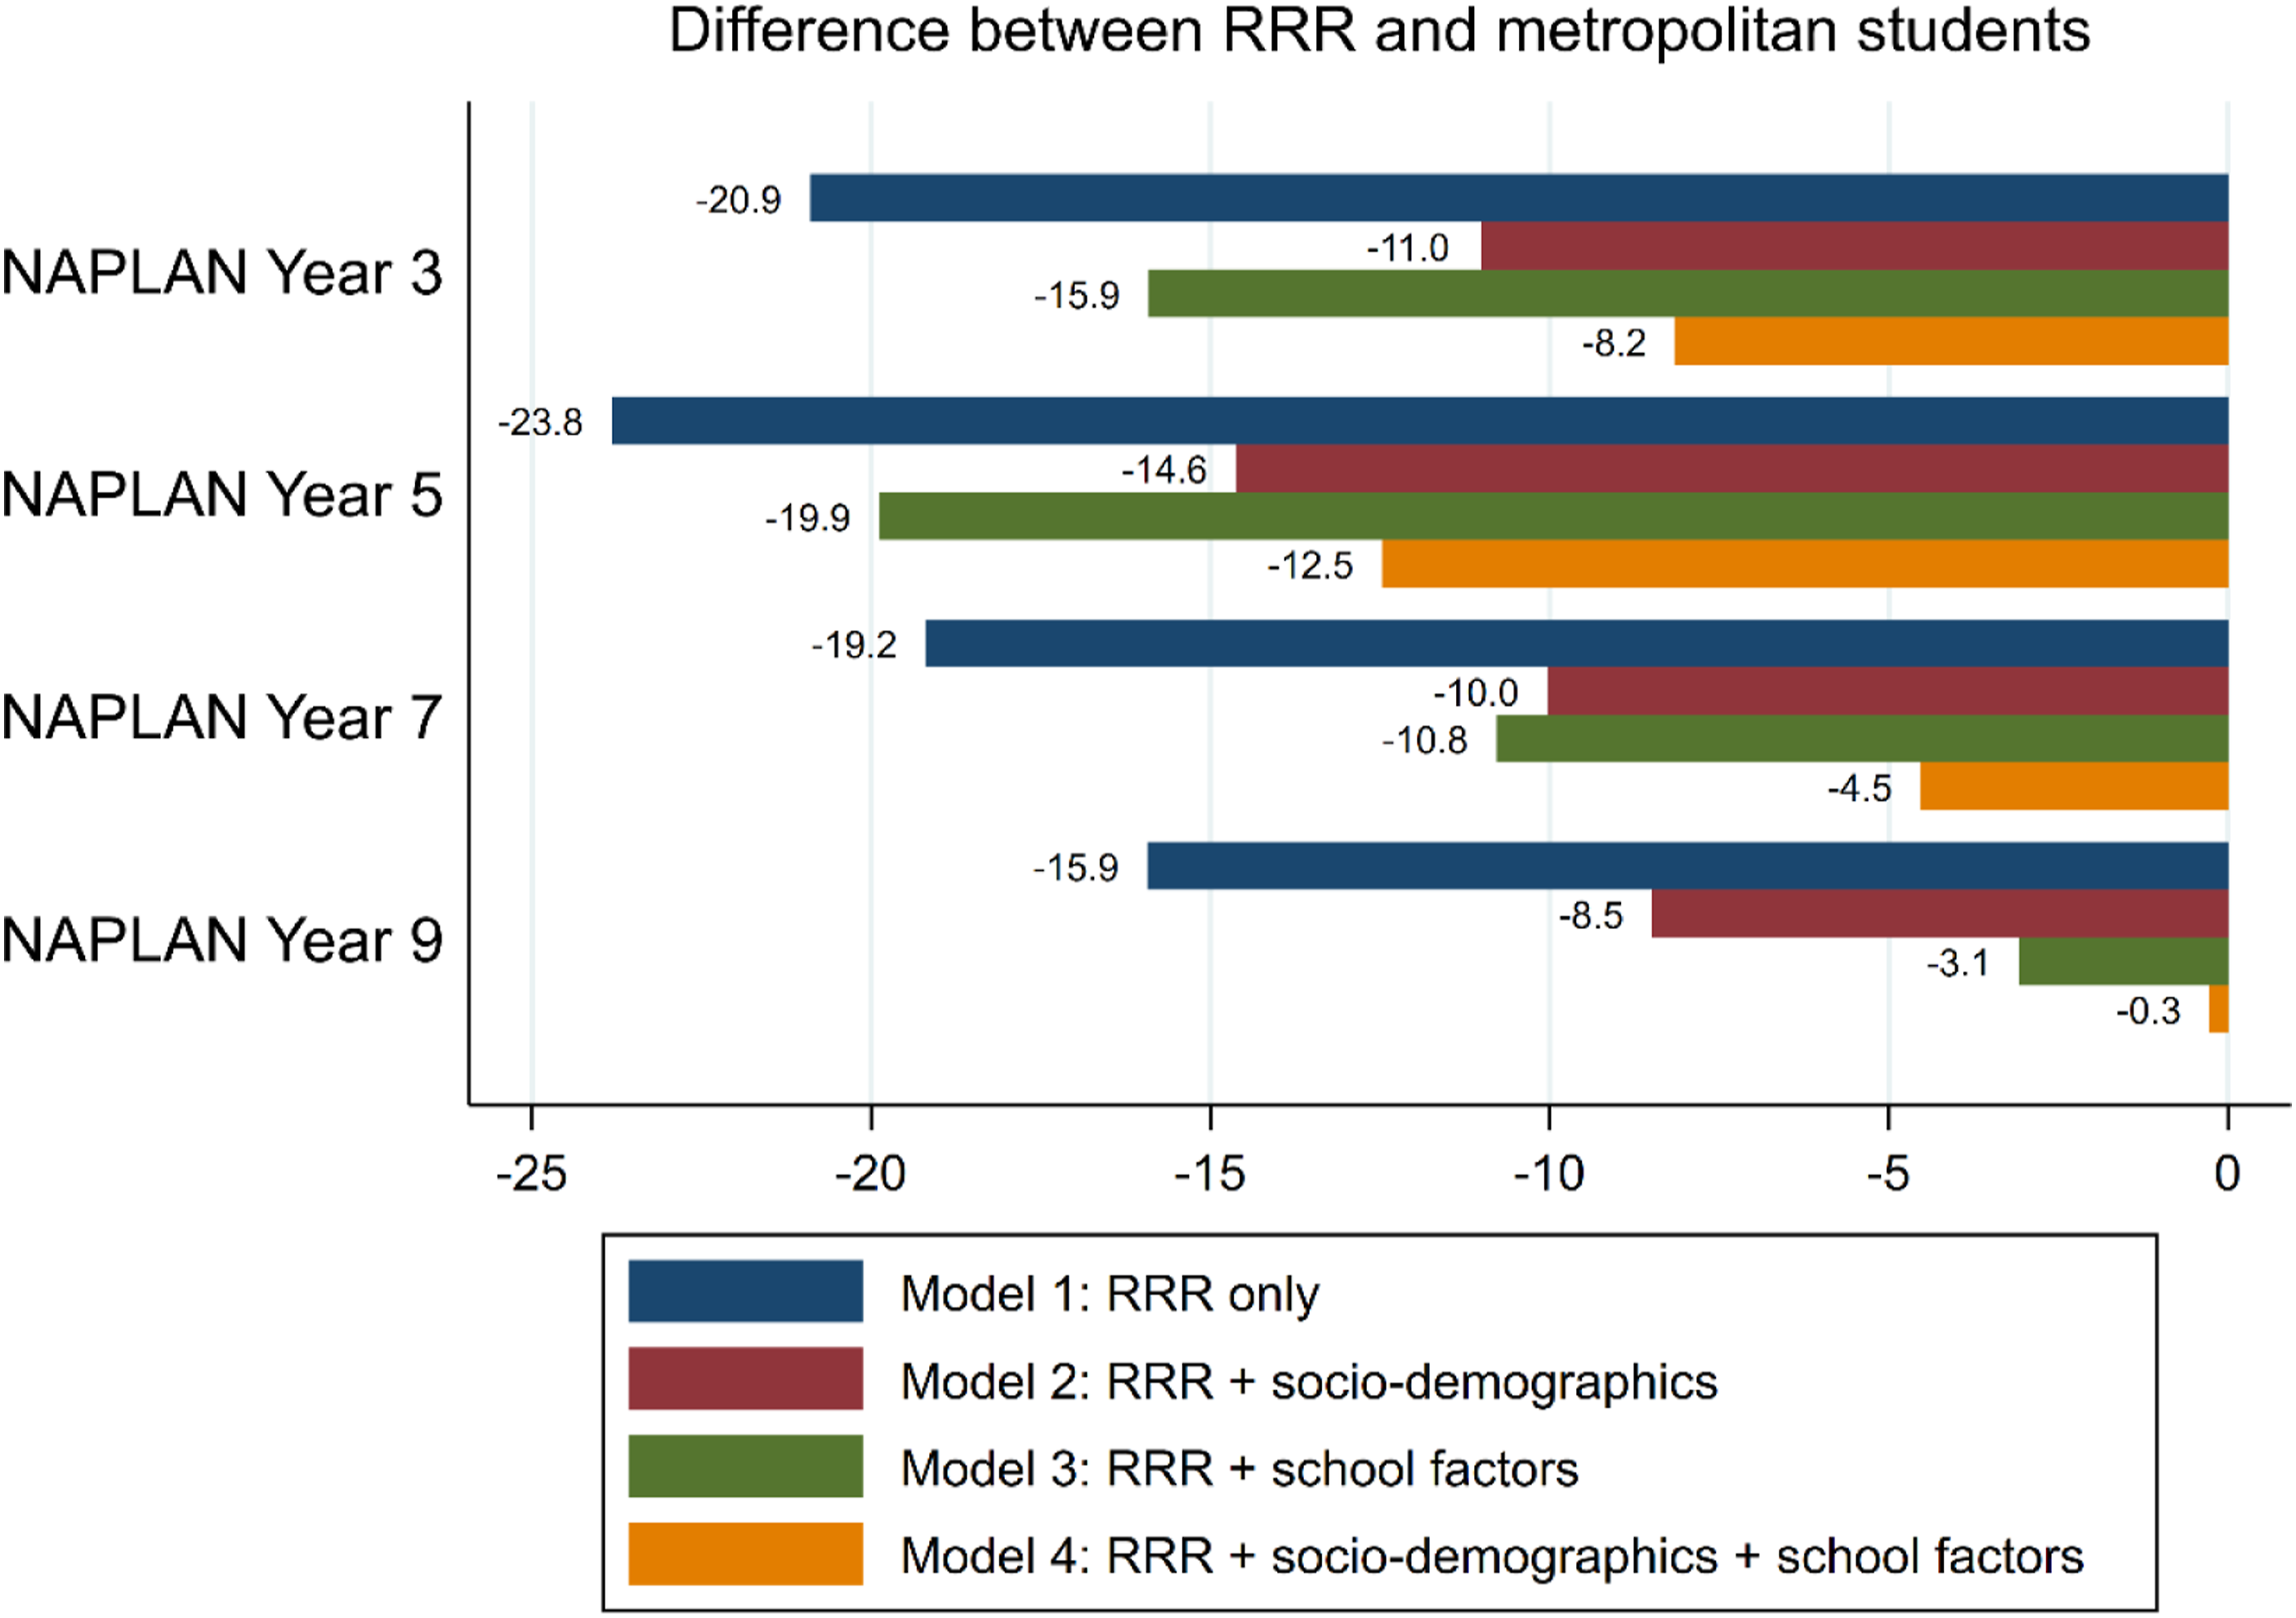
Differences in NAPLAN numeracy test scores between students from RRR and metropolitan areas. Notes: LSAC, Cohort K, Waves 2 to 5. Based on the results presented in Table 2. RRR: Regional/remote/very remote area. NAPLAN: National Assessment Program – Literacy and Numeracy.
The addition of the socio-demographic factors in the models within Panel 2 reduces these differences by 38.6% (Year 5) to 47.8% (Year 7), relative to the models in Panel 1. However, all differences remain statistically significant (at, at least, p < 0.05). Similarly, the addition of the school climate factors in Panel 3 reduces the differences in NAPLAN numeracy scores between RRR and metropolitan students by 16.5% (Year 5) to 80.7% (Year 9), relative to the models in Panel 1. Yet again, the RRR coefficients remain statistically different from zero.
The models in Panel 4 incorporate both socio-demographic and school climate factors simultaneously. In these models, differences between RRR and metropolitan students are reduced even further, from 47.6% (Year 5) to 98.2% (Year 9), relative to the raw estimates in Panel 1. In these fully specified models, the test-score gaps are thus much smaller: 8.16 units in school Year 3, 12.47 units in Year 5, 4.54 units in Year 7 and 0.28 units in Year 9. Only the difference for school Year 5 remains statistically significant. Results from Wald tests indicated that differences in the RRR coefficients in the models in Panel 1 and Panel 4 were statistically different from each other, at p < 0.05, in 3 of 4 cases. The only exception was the difference for the Year 3 NAPLAN scores, which only approached but did not reach statistical significance (p = 0.11). This is likely due to the smaller sample sizes in these models.
Collectively, these results suggest that, consistent with expectations, both socio-demographic factors and school climate factors contribute to the academic disadvantage experienced by RRR students.
Individual, Family and School Factors that Improve Student Test Scores
Regression Models of NAPLAN Numeracy Test Scores, Fully Specified Models.
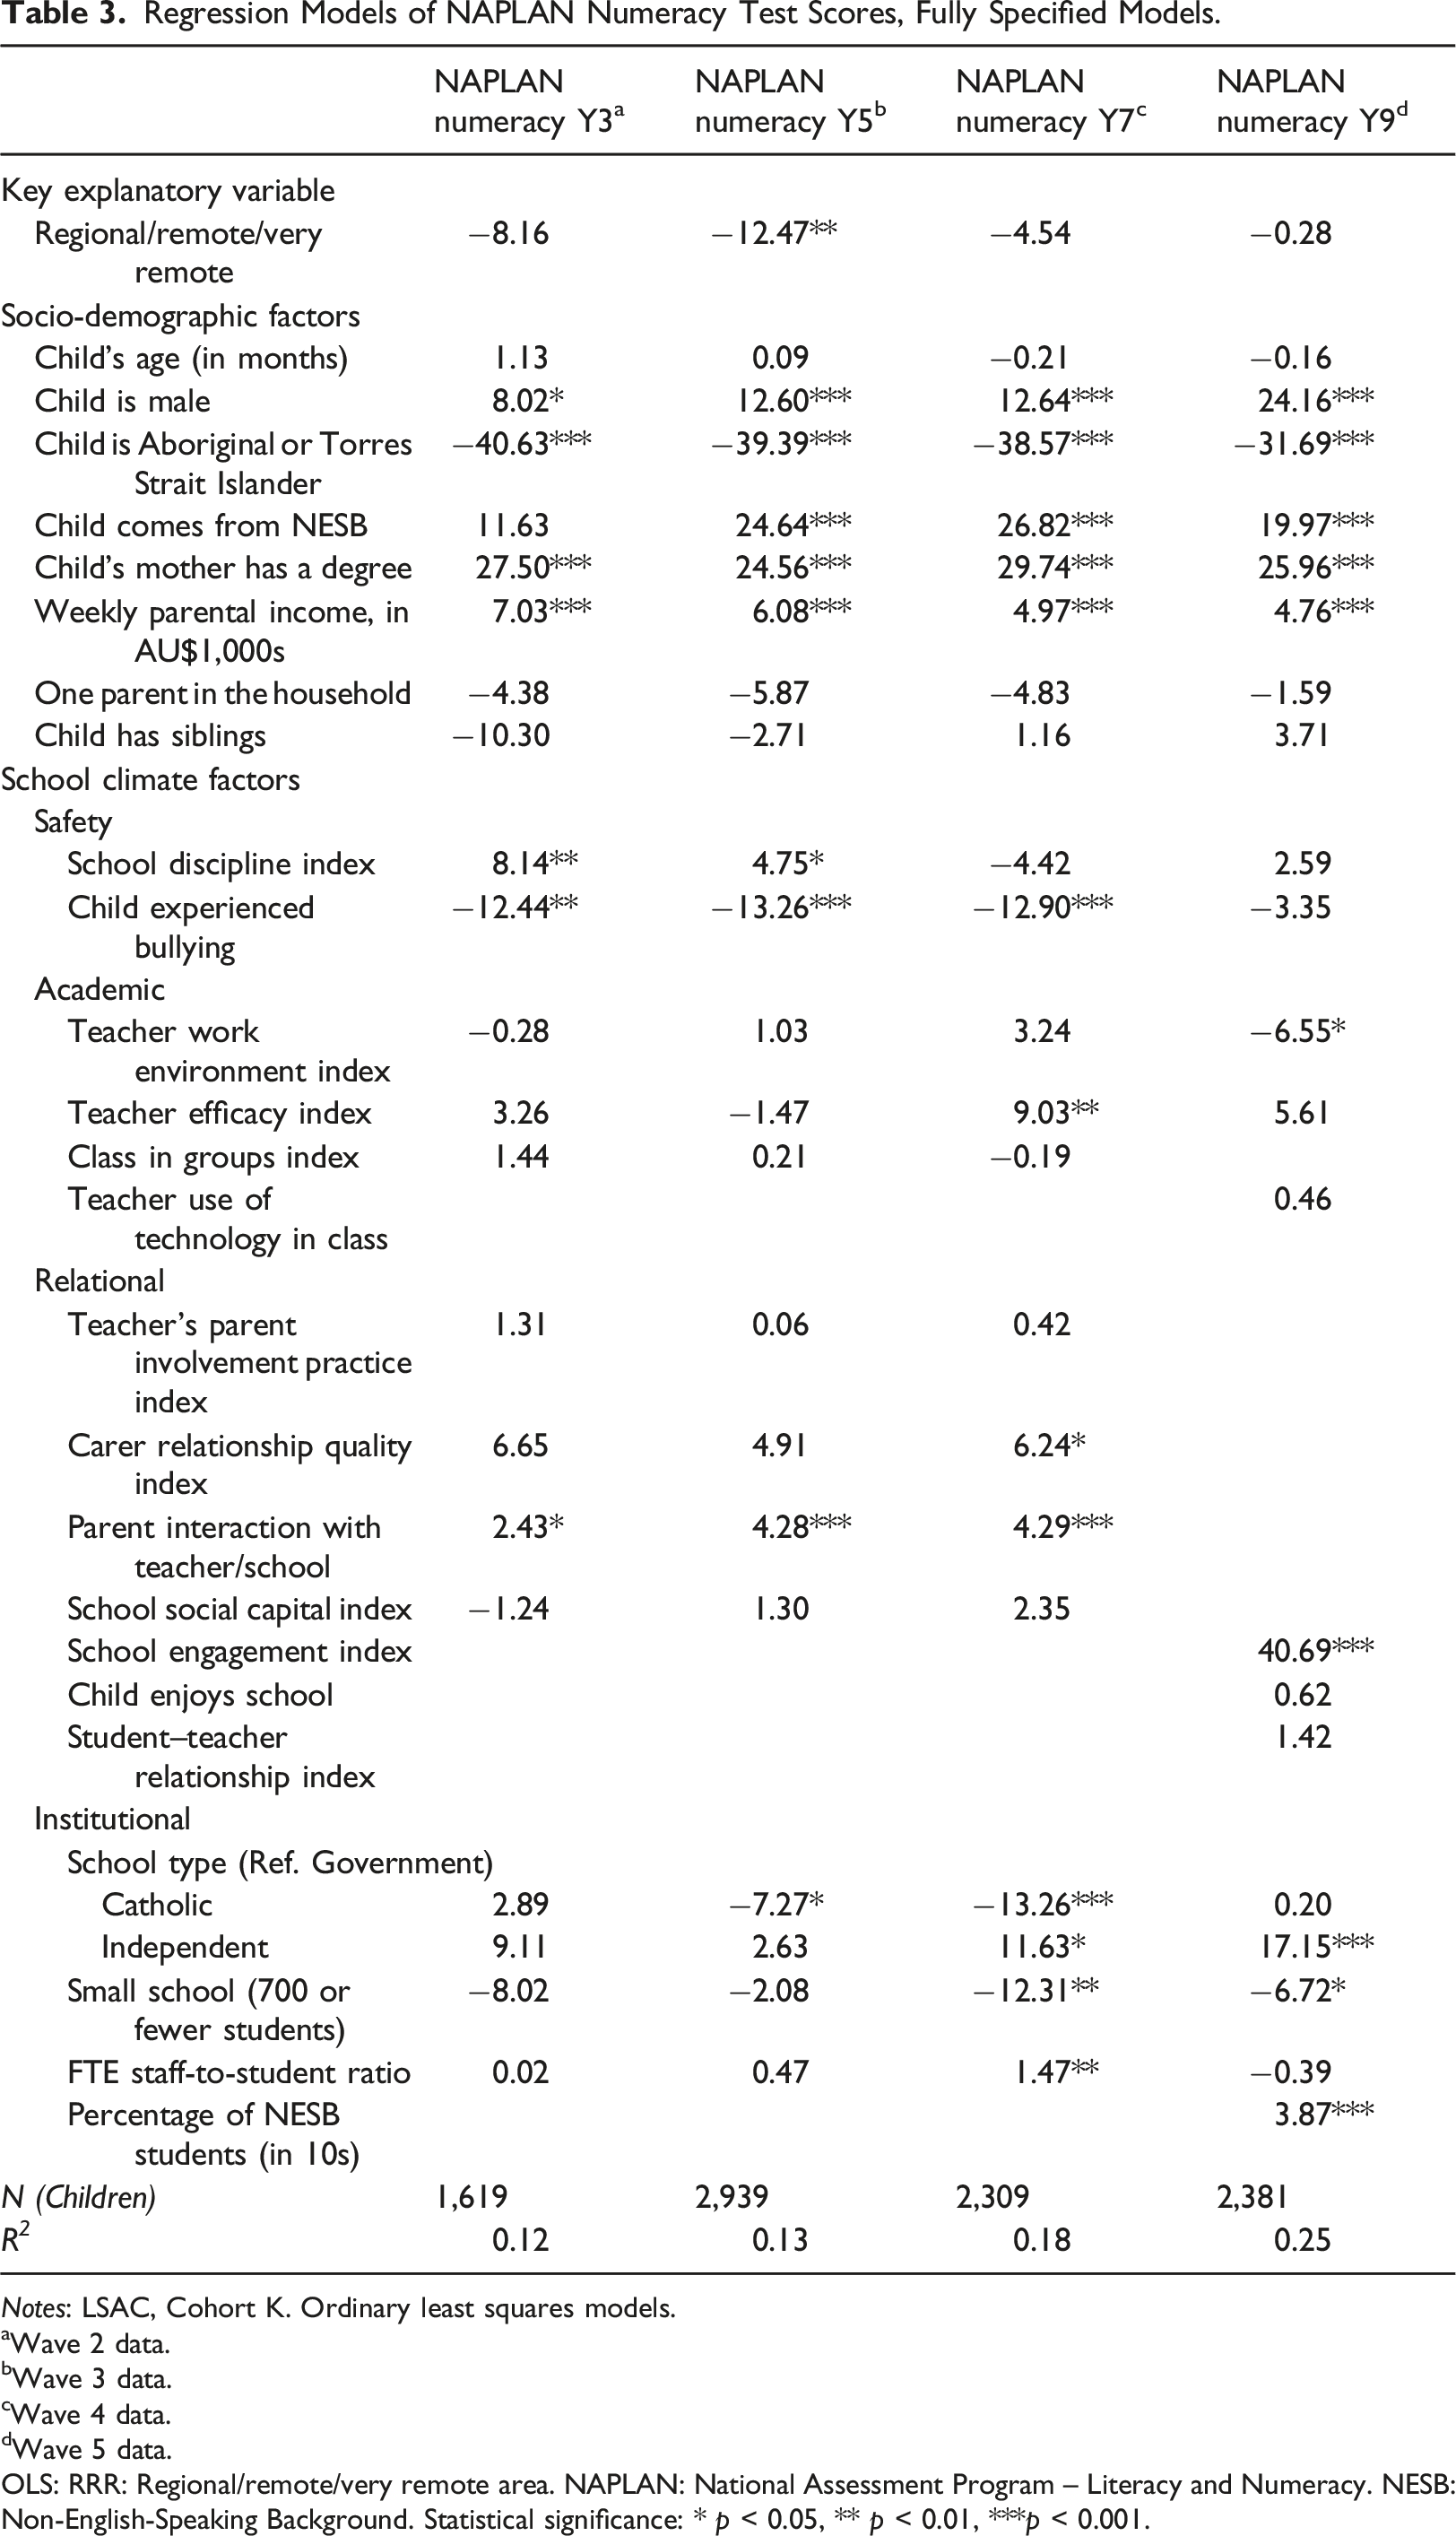
Notes: LSAC, Cohort K. Ordinary least squares models.
aWave 2 data.
bWave 3 data.
cWave 4 data.
dWave 5 data.
OLS: RRR: Regional/remote/very remote area. NAPLAN: National Assessment Program – Literacy and Numeracy. NESB: Non-English-Speaking Background. Statistical significance: * p < 0.05, ** p < 0.01, ***p < 0.001.
We observe some significant associations for socio-demographic factors. Across models, boys achieve higher NAPLAN numeracy test scores than girls, and this difference increases over time. Aboriginal or Torres Strait Islander students receive consistently lower scores than non-Indigenous students, whereas students from non-English speaking backgrounds attain consistently higher scores than students from English-speaking backgrounds. Both maternal education and parental income exhibit large, positive and statistically significant associations with children’s NAPLAN numeracy test scores.
The estimated effects on the school climate factors are less patterned and, in almost all cases, they are modest in terms of effect size (Cohen’s D <0.20). However, many are statistically significant in ways that align with theoretical expectations. For example, in the domain of safety, greater levels of school discipline are associated with greater test scores in Years 3 and 5, whereas experiences of bullying are associated with decreases in test scores in Years 3, 5 and 7. In the academic domain, teachers’ self-efficacy are associated with increases in Year 7 test scores. In the relational domain, greater carer relationship quality (in Year 7) and parental interactions with teachers (in Years 3, 5 and 7) are associated with increases in test scores, and so does the child’s degree of school engagement (in Year 9). In the institutional domain, there are some statistically significant differences in students’ test scores by school type (government, catholic or independent), some penalties to attending small schools (in Years 7 and 9), and a premium to ethnic diversity (in Year 9).
Altogether, these results are largely consistent with expectations, and point to issues with equity in student achievement along the lines of socio-demographic and school climate factors.
Discussion and Conclusion
Our results revealed that, if RRR students came from the same socio-demographic backgrounds and went to schools with the same school climate characteristics as metropolitan students, their disadvantage in NAPLAN numeracy performance would narrow from approximately 16–24 units (depending on the year) to approximately 0.3–12.5 units, or by 48%–98%. Socio-demographic factors alone explained 38.6%–47.8% of the gaps, compared to 16.5–80.7% for school climate factors alone. While the explanatory power of socio-demographic factors was consistent across school years, that of school climate factors was substantially greater in secondary school (Years 7 and 9). In relation to theory, our results confirm the applicability of the concept of school climate and its different dimensions to quantitative education research in Australia. In this regard, we document that associations that had been previously reported in research based in the United States of America (e.g. Cohen et al., 2009; Wang & Degol, 2016), are also apparent in Australia. For example, we found that school-level factors such as school discipline, bullying prevention, teachers’ self-efficacy, teacher–student relationship quality and parental engagement were positively associated with academic outcomes. These results point to avenues to improve schools in ways that can both lift the educational outcomes of all students and reduce achievement disparities between metropolitan and RRR students.
Limitations
Despite the high representativeness of the LSAC dataset, children residing in remote and very remote areas are under-represented in the sample and more likely to experience panel attrition (see Mohal et al., 2022). Therefore, the findings presented here may not account fully for the experiences of the relatively small number of children in remote and very remote areas. Second, the small sample sizes for these groups precluded analyses of differences between different types of regional areas (i.e. inner regional, outer regional, remote and very remote areas). Future studies may wish to replicate our findings using data that do not suffer from these shortcomings. Third, despite the many school climate indicators available in LSAC, some potentially important ones are missing. For example, we are unable to incorporate information on school resources or teacher experience, both of which have been shown to be important school climate factors contributing to students’ academic success (see e.g. Wang & Degol, 2016). The omission of these variables may result in an under-estimation of the role of school climate factors in explaining differences in school outcomes between RRR and metropolitan students. Future research should therefore aim to incorporate these and other school climate factors into the analyses.
Implications
Despite these limitations, our results bear important implications for policy and practice. Since both population socio-demographic traits and school characteristics played a prominent role in our analyses, we interpret our findings as calling for hybrid policy approaches to reducing RRR student disadvantage.
On the one hand, interventions should continue targeting the social determinants of children’s educational performance. For example, broad policies that increase access to (parental) education and lift incomes in RRR areas are likely to have indirect, positive effects on the school outcomes of children in these areas. Similarly, policies aimed at improving Indigenous access to education may have downstream effects by lifting the school outcomes of children in RRR areas to a greater extent. Increases in the quality of education and educational attainment of young people in regional areas are likely to result in long-term effects not only on their own skills and earnings capacity but also on their children’s developmental and educational outcomes. It is nevertheless possible that policies aimed at lifting parental education and income in regional areas would not immediately change the educational outcomes of the current cohort of children, as parental influences on their children’s development occur early within the life course and begin prior to school entry (Fay-Stammbach et al., 2014).
On the other hand, our results confirm that schools are a social environment ripe for policy intervention (see also Halsey, 2018). In this regard, programs that target bullying (e.g. the National Safe Schools Framework, Positive Behaviour for Learning, Friendly Schools, KidsMatter and MindMatters), teacher self-efficacy (see George et al., 2018; Klassen & Tze, 2014; Morris et al., 2017; Zee & Koomen, 2016); and parental engagement (see Barger et al., 2019; Castro et al., 2015; Willis et al., 2021), amongst others, may result in better educational outcomes for children in RRR areas.
Nonetheless, in implementing any of the aforementioned strategies to lift the outcomes of students in RRR areas, it is important to recognize the role of marketisation dynamics – including school choice and sector dynamics – in generating segregated school contexts in many RRR communities. For example, well-off families often send their children to boarding schools in metropolitan areas, or to non-government schools in nearby regional towns (see e.g. Perry, 2018). These dynamics, which are arguably supported and incentivised by federal and state policies, might lead to residual school contexts in regional areas (Perry, 2018). It follows that successfully improving educational outcomes in regional areas may also require efforts to make schools less socially segregated.
Supplemental Material
Supplemental Material - Explaining achievement gaps between students from regional and metropolitan areas: Accounting for socio-demographic and school climate factors
Supplemental Material for Explaining achievement gaps between students from regional and metropolitan areas: Accounting for socio-demographic and school climate factors by Francisco Perales, Melissa Johnstone, Ning Xiang, and Wojtek Tomaszewski in Australian Journal of Education
Footnotes
Declaration of Conflicting Interests
The author(s) declared no potential conflicts of interest with respect to the research, authorship, and/or publication of this article.
Funding
The author(s) disclosed receipt of the following financial support for the research, authorship, and/or publication of this article: This research was funded by the Queensland Department of Education through the Education Horizon research grant scheme. Any claims made in this article represent the authors’ views, and do not necessarily represent the views of the Department. The research was also supported by the Australian Research Council Centre of Excellence for Children and Families over the Life Course (project number CE200100025).
Supplemental Material
Supplemental material for this article is available online.