
Abstract
Despite historic efforts to improve rates of higher education participation for educationally disadvantaged students, equity students remain under-represented in Australian universities. University-run equity or ‘outreach’ programs which target secondary students are one way to encourage higher education access and participation of equity students. However, there have been few national assessments of these equity initiatives. Using a representative sample of Australian schools from the GENERATION survey of Australian youth, this research examined the characteristics and targeting of university-run equity initiatives in schools during 2022. Analysis showed that approximately one-quarter of secondary schools in Australia reported receiving an equity initiative. Programs mostly focused on increasing aspirations for higher education among low socioeconomic, Aboriginal and Torres Strait Islander, and rural and regional students. However, our findings indicated that these programs did not effectively target disadvantaged or regional schools. Moreover, programs may be implemented too late to impact students’ career and educational aspirations.
Introduction
Educationally disadvantaged students remain significantly under-represented in higher education in Australia (Koshy, 2019; O’Kane et al., 2024; Tomaszewski et al., 2023). In Australia, there are six identified ‘equity groups’ 1 , who face considerable challenges in both participation and success in higher education (O’Kane et al., 2024; Tomaszewski et al., 2018). Further, other cohorts, such as students who have care experience, refugee students, and veterans, are identified as ‘emerging equity cohorts’ in the Universities Accord final report (O’Kane et al., 2024). The multiple barriers driving underrepresentation of equity groups in higher education include financial, socio-cultural, geographical, age, and institutional factors (Crawford & McKenzie, 2023; Naylor & Mifsud, 2020; Zacharias & Ryan, 2021). Increasing the proportion of equity students in higher education is important, not only for social justice reasons, but also for raising the skills of the working-age population (O’Kane et al., 2024).
The Australian government has made a sustained and significant investment in increasing the access of equity students in higher education since the ‘Dawkins Reforms’ in 1998. In 2010, in response to a substantial review of higher education with the ‘Bradley Report’ (Bradley et al., 2008), the Australian Government introduced the Higher Education Participation and Partnerships Program (HEPPP) (The Department of Education Employment and Workplace Relations, 2009). The HEPPP originally focused on increasing higher education participation of students living in the bottom quarter of disadvantaged geographical areas of Australia (i.e. students from low SES backgrounds); it was expanded in 2021 to also focus on students from regional and remote areas and Aboriginal and Torres Strait Islander students (Department of Education, Skills & Employment, 2020). Other Commonwealth funded initiatives that target equity students include the Disability Support Program, Regional Loading Program, and Demand-Driven Access for First Nations regional students; however, the HEPPP has long been the Australian Government’s largest equity program, accounting for 40% of equity program funding (Tomaszewski et al., 2023). We note that this may soon change, with the HEPPP being replaced by Needs-Based Funding and a separate Outreach Fund (Australian Government Department of Education, 2024).
A major strategy for improving equity in higher education participation and access is through equity initiatives, such as aspiration-raising ‘outreach’ activities (Bennett et al., 2024; Sellar & Storan, 2013). Via outreach, higher education institutions can provide career information, guidance, and support for students who are educationally disadvantaged (Gore et al., 2017). As the HEPPP specifically provides funding to Australian universities to implement widening participation activities, the implementation of the HEPPP has been a major driver of university-run outreach initiatives in Australian schools (Bennett et al., 2015). In 2010, Gale and colleagues conducted a review of 59 outreach programs provided by 26 universities in Australia. Their review found that the majority of these initiatives were aimed at Year 10 students, that the most common type of outreach was for aspiration-raising with financial assistance the least common, that many were one-off events (tasters/campus visits), and that 39% included 20+ schools, whereas 27% involved 6–10 schools, and a third of the programs included 201–500 students. Gale et al. (2010) suggest that the most effective outreach is ‘early, long-term, and sustained’ (p. 5). Universities may also provide higher education access and participation initiatives, including the provision of scholarships, altered university entrance requirements, or enabling programs (Bennett et al., 2024; Zacharias & Ryan, 2021).
At the time of writing, HEPPP-funded higher education providers design the equity initiatives; however, a criticism is the design of the programs is ‘an act of faith’ (Naylor et al., 2013). Reviews of the HEPPP program in the mid-2010s (e.g. ACIL Allen Consulting, 2017; Bennett et al., 2015; Zacharias, 2017) indicated generally positive effects on students’ higher education retention and success. Nevertheless, due to the different mix of activities within the equity initiative, it is challenging to systematically evaluate and quantify their effectiveness (Tomaszewski et al., 2023). While the Student Equity in Higher Education Evaluation Framework (SEHEEF) has been developed to help address this problem (Robinson et al., 2022), it is currently in the early stages of implementation by higher education providers. Consequently, we do not have a recent national picture of what equity practices are offered to facilitate aspirations and access of school-aged equity students.
School-Based Equity Initiatives
To inform government policy, it is important to understand the national picture of equity initiatives in schools. In this study, we use the Equity Initiatives Framework (EIF 3.0) (Bennett et al., 2024) to help categorise the components of equity initiatives, focussing on the first two stages – pre-access and access – which primarily target secondary school students. In 2021, $33 million was spent on pre-access HEPPP activities and $21 million was spent on access HEPPP activities in Australia (Tomaszewski et al., 2023).
Pre-access
Pre-access activities focus on increasing awareness of higher education pathways, opportunities, and associated careers by supporting and developing aspirations and expectations (Bennett et al., 2015, 2024). Outreach activities – or university-run interventions in or with schools – are a key focus at this stage and may be implemented during primary or secondary school. Outreach activities commonly consist of informational interventions, which provide students with material about the benefits of higher education, and experiential interventions, which present opportunities for students to experience university life (Gale et al., 2010). 2
Access
Activities within the access phase of the student life cycle centre on senior school students and school leavers and aim to provide opportunities for higher education access through pathways and admissions (Bennett et al., 2024). In Australia, students typically apply for a higher education place during their final year of high school – applications are assessed based on a combination of school-based assessments and end-of-year exams, culminating in an Australian Tertiary Admissions Rank (ATAR) (Pilcher & Torii, 2018). The availability of alternative (non-ATAR), and arguably more inclusive, entry schemes is increasing in Australia (Jackson et al., 2023). Some higher education providers offer direct or early admission for students who meet certain criteria (Martin & Tam, 2024), meaning students can receive a higher education offer without their Year 12 rank (Pilcher & Torii, 2018). In addition, universities may provide opportunities for equity students to be evaluated for admission against a lower ATAR cut-off (ACIL Allen Consulting, 2017). The HEPPP funding has also been used to fund enabling courses for students who may not meet university entry requirements (ACIL Allen Consulting, 2017); completion of these courses results in opportunities to receive a university place (Vernon et al., 2019).
Targeting of Equity Initiatives
To focus on equity cohorts, universities recruit schools for implementing equity initiatives; however, little is known about which schools universities work with. The location of higher education providers can influence the effectiveness of equity initiatives, either facilitating, limiting, or undermining efforts to support specific equity groups (Benson-Egglenton, 2022), especially for students who experience cumulative educational disadvantage. For instance, universities may struggle to implement equity programs in schools significantly out of their catchment area (Zacharias & Mitchell, 2020). Further, regional and rural universities, which typically have larger proportions of equity students, may prioritise increasing overall enrolments rather than specifically targeting equity students (Peacock et al., 2014).
Moreover, the competitive landscape of higher education may lead some institutions to focus on recruiting the most advantaged students in a disadvantaged area (Rainford, 2017). As Tomaszewski et al. (2023) write, HEPPP equity targets may have unintended consequences of excluding some equity populations by incentivising a focus on higher SES schools in inner regional areas due to ease of access and lower cost. As Peacock et al. (2014) note, providers in their study sought to target the ‘best and brightest’ equity students. Higher education providers may also focus on students in their final years of school; these students likely aspire for higher education and are ready to choose a university. In such cases, equity programs may not be expanding access but rather serving as a tool for higher education recruitment (Rainford, 2017).
Given the significant government investment, equity initiatives should target educationally disadvantaged students. It is therefore timely to explore the proportion and type of equity initiatives reported by a nationally representative sample of secondary schools, and the school characteristics associated with having an equity initiative. In this article, we examine the state of play of equity initiatives from the perspective of a national sample of secondary schools in Australia. Using newly available nationally representative survey data from secondary schools and students in Australia gathered through the GENERATION school and young person survey (Edwards et al., 2023), this article addresses the following two research questions: (1) What are the goals and activities of equity initiatives in Australian schools? (2) What are the characteristics of schools with equity initiatives, and are the initiatives targeted to schools with higher proportions of equity students?
Methodology
The data for this research uses the first wave of the GENERATION survey, a longitudinal study of young people in Australia beginning in 2022 (Edwards et al., 2023). The study consists of an initial sample of over 15,000 students in Year 10, who were recruited via their school. The design followed a stratified-random sample of students in Australian schools. Schools were selected to represent all Australian states/territories and school sectors (i.e. Government, Catholic, and independent schools). 17 percent of approached schools participated in the study, with Catholic schools, schools in the Northern Territory and schools in very remote areas under-represented. Further information about the survey and sampling method is provided in Edwards et al. (2024).
In addition to a young person survey, school leaders in participating schools were invited to complete an online school survey. This survey included items pertaining to the school’s programs, policies, and procedures. The school coordinator responsible for the school survey was asked to share the survey link with other members of staff who may be better suited to answer any items. Surveys were completed from late June to early December 2022.
The sample for the current study included 244 schools who answered whether there was a university-operated equity program at their school during 2022. A summary of the (weighted) participation rates by state, sector, socioeconomic status, and geographical area is provided in Appendix A. Respondents to the school survey were predominately careers teacher (61% of respondents). The school survey was also completed by heads of year level/heads of department (27% of respondents), assistant principals (21%), classroom teachers (9%), principals (7%), and school administrators (4%). 3
Measures
Equity Initiatives
Schools indicated whether there were any university-operated programs in their schools that ‘aimed at increasing higher education enrolments from under-represented groups’. Based on their response to this item, a dummy variable was created to indicate whether schools had an equity initiative in 2022. Schools then answered items pertaining to the characteristics of any equity programs. Subsequent survey items asked about the number of different programs offered, the year levels included in the program (i.e. below Year 7 to Year 12), the under-represented groups targeted (i.e. students from low socioeconomic backgrounds, students from regional and remote areas, Aboriginal and Torres Strait Islander students, students with a disability, students of refugee or humanitarian migrant background, and students from families with no prior experience of higher education), and the goals of the program. Schools were also asked, via free text responses, the name of the equity programs in their school, and this information was coded by JA. Further information about the coding of the equity program text data is provided in Appendix B.
Socioeconomic Status
School socioeconomic status was firstly determined by the Socio-Economic Indexes for Areas (SEIFA) – Index of Education and Occupation, by the Australian Bureau of Statistics (ABS) in 2021. This measure reflects the educational and occupational level of communities: a low score indicates relatively lower education and occupation levels of people in the area. Secondly, a school-based measure of socioeconomic status was utilised. The Index of Community Socio-Educational Advantage (ICSEA) is a measure of socio-educational advantage at the school level, based on parent-reported education level and occupational status. A low score indicates schools with students of disadvantaged backgrounds. As the data was provided in deciles, these measures were categorised into the bottom 30%, middle 40%, and top 30% of socioeconomic status. 4
Distance
The distance between a school and their closest university campus was calculated using the geosphere package in R., as the crow flies. As some universities have multiple campuses, the distance calculation was restricted to university campuses with more than 400 students.
Data Analysis
Descriptive analysis was employed to show the types of equity initiatives delivered in schools, and the characteristics of the schools that have such initiatives. Logistic regression analysis was used to predict the presence (or absence) of a university-run equity initiative in a school, based on school characteristics (sector, state, type, size, SEIFA, geographic area, Aboriginal and Torres Strait Islander student enrolments, school size, and distance to closest university). ANOVA models and Wald
Descriptive results, ANOVA, and analyses were adjusted using school weights. School weights account for differences between schools that participated in the study compared to those that did not. The use of school weights allows the data to be generalised to the broader population, specifically secondary schools in Australia. Schools with missing values on any of the variables of interest were excluded from the analysis (list-wise deletion). STATA version 18 was used for data analysis.
Results
Equity Initiatives
Focus of equity initiatives as reported by schools (percentages).
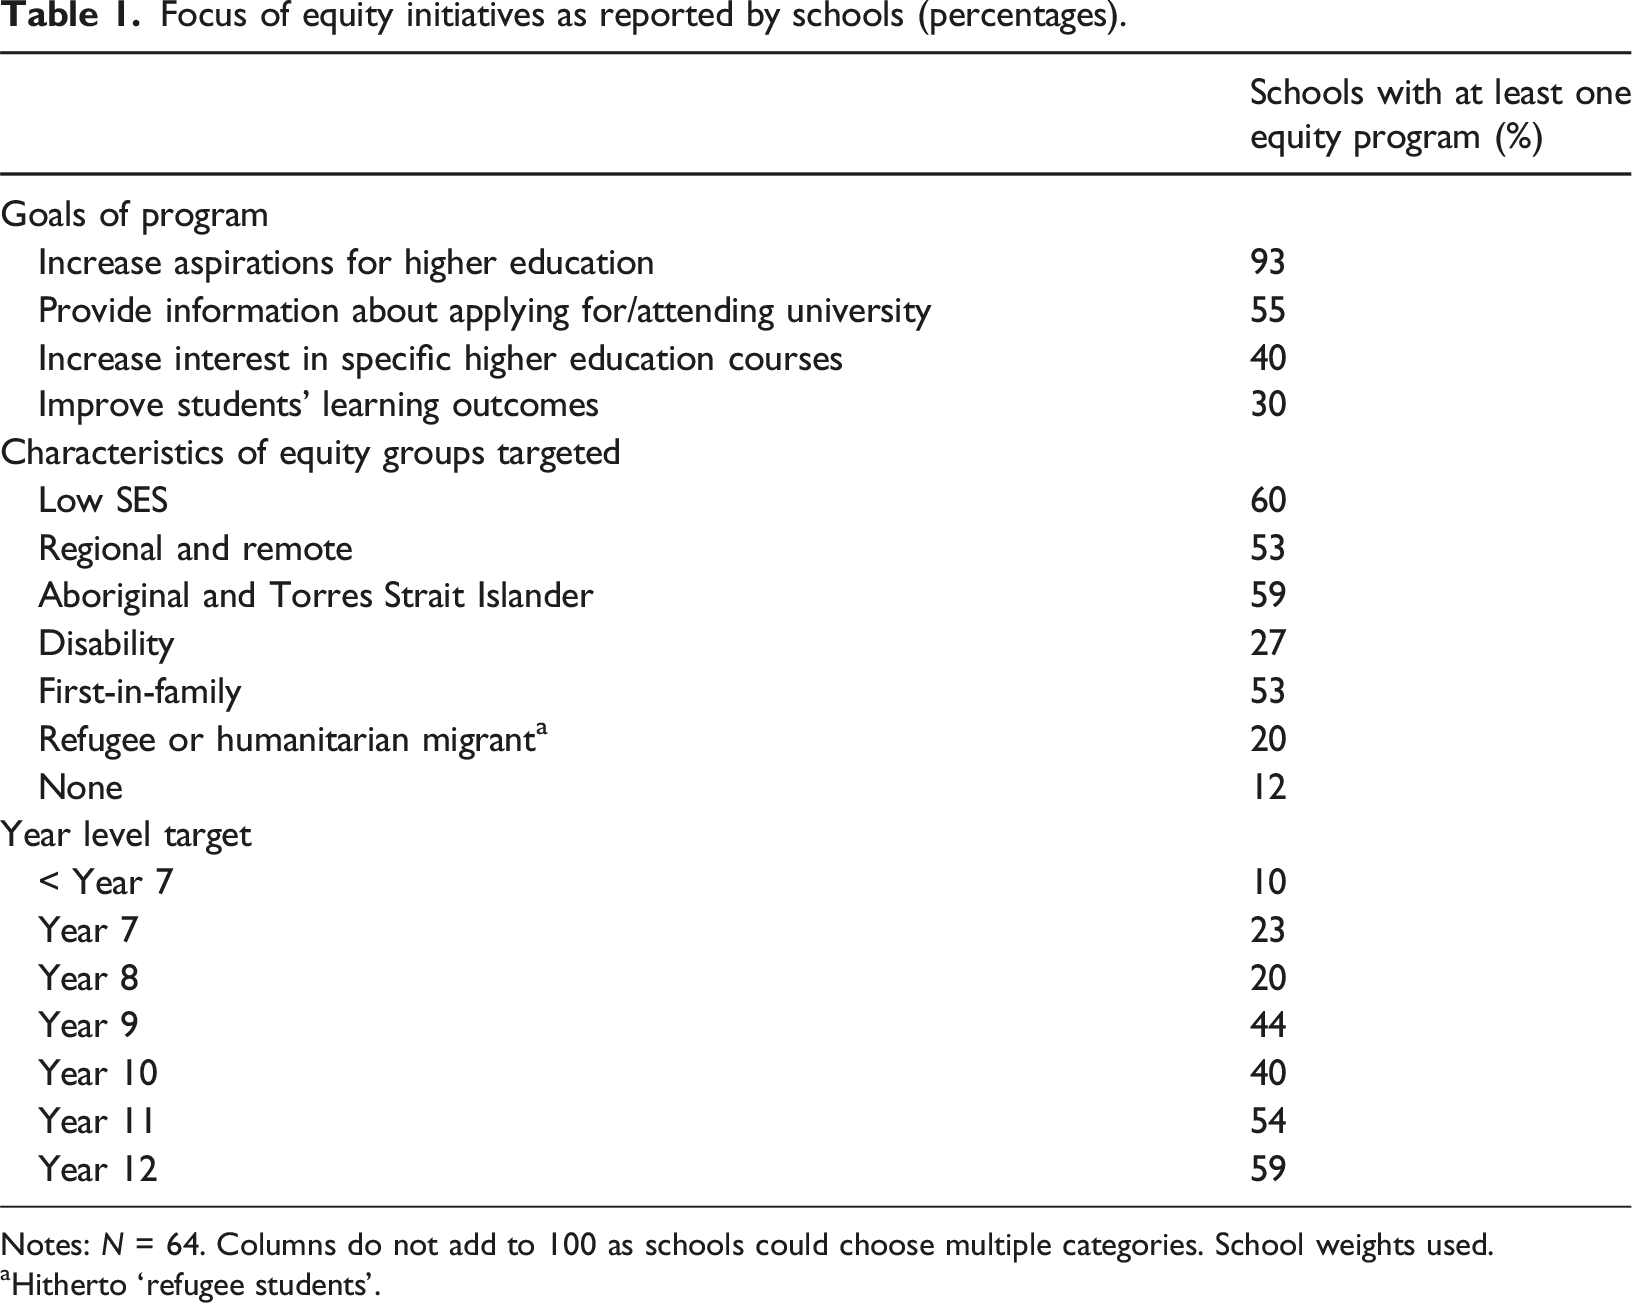
Notes: N = 64. Columns do not add to 100 as schools could choose multiple categories. School weights used.
aHitherto ‘refugee students’.
Of the 64 schools with at least one equity program, over half (59%) had a program targeted at Year 12 (i.e. final year) students. Initiatives targeting students in Year 8 and below were less common. Four equity groups were commonly targeted: students from low socioeconomic status backgrounds (SES), Aboriginal and Torres Strait Islander students, students from regional or remote area, and students whose families have no prior experience with higher education (first-in-family). It was less common for schools to report having an equity initiative targeting students with a disability or students of refugee or humanitarian migrant background. 11 percent of schools did not select any of these categories, possibly indicating that their equity initiatives were targeting all students or other groups (e.g. high achievers).
Detailed information about the equity initiatives was able to be sourced for 80% (N = 51) of the schools with an equity program. Schools reported the names of up to three equity programs in their schools, which resulted in a sample of 70 equity programs. 56% of these initiatives targeted the pre-access stage of the student life cycle and 44% of programs focused on the access stage. The programs typically consisted of activities to build student’s skills (skills and attainment, 72%) and/or activities which provided information and experiences about post-school options (information and experiences, 57%). Only a small number of the programs provided students with tangible resources such as scholarships, financial assistance, or laptops (resources, 7%).
Further detailed information about the kinds of activities included in these initiatives was analysed. As shown in Figure 1, the most commonly reported component of an equity initiative was a university campus visit. Mentoring and offering a series of workshops were also common features of the equity programs. Less common components of equity programs included industry visits, application help, providing a one-off workshop or lecture, a first-year university subject offering, or a scholarship/payment. Types of activities included in equity initiatives.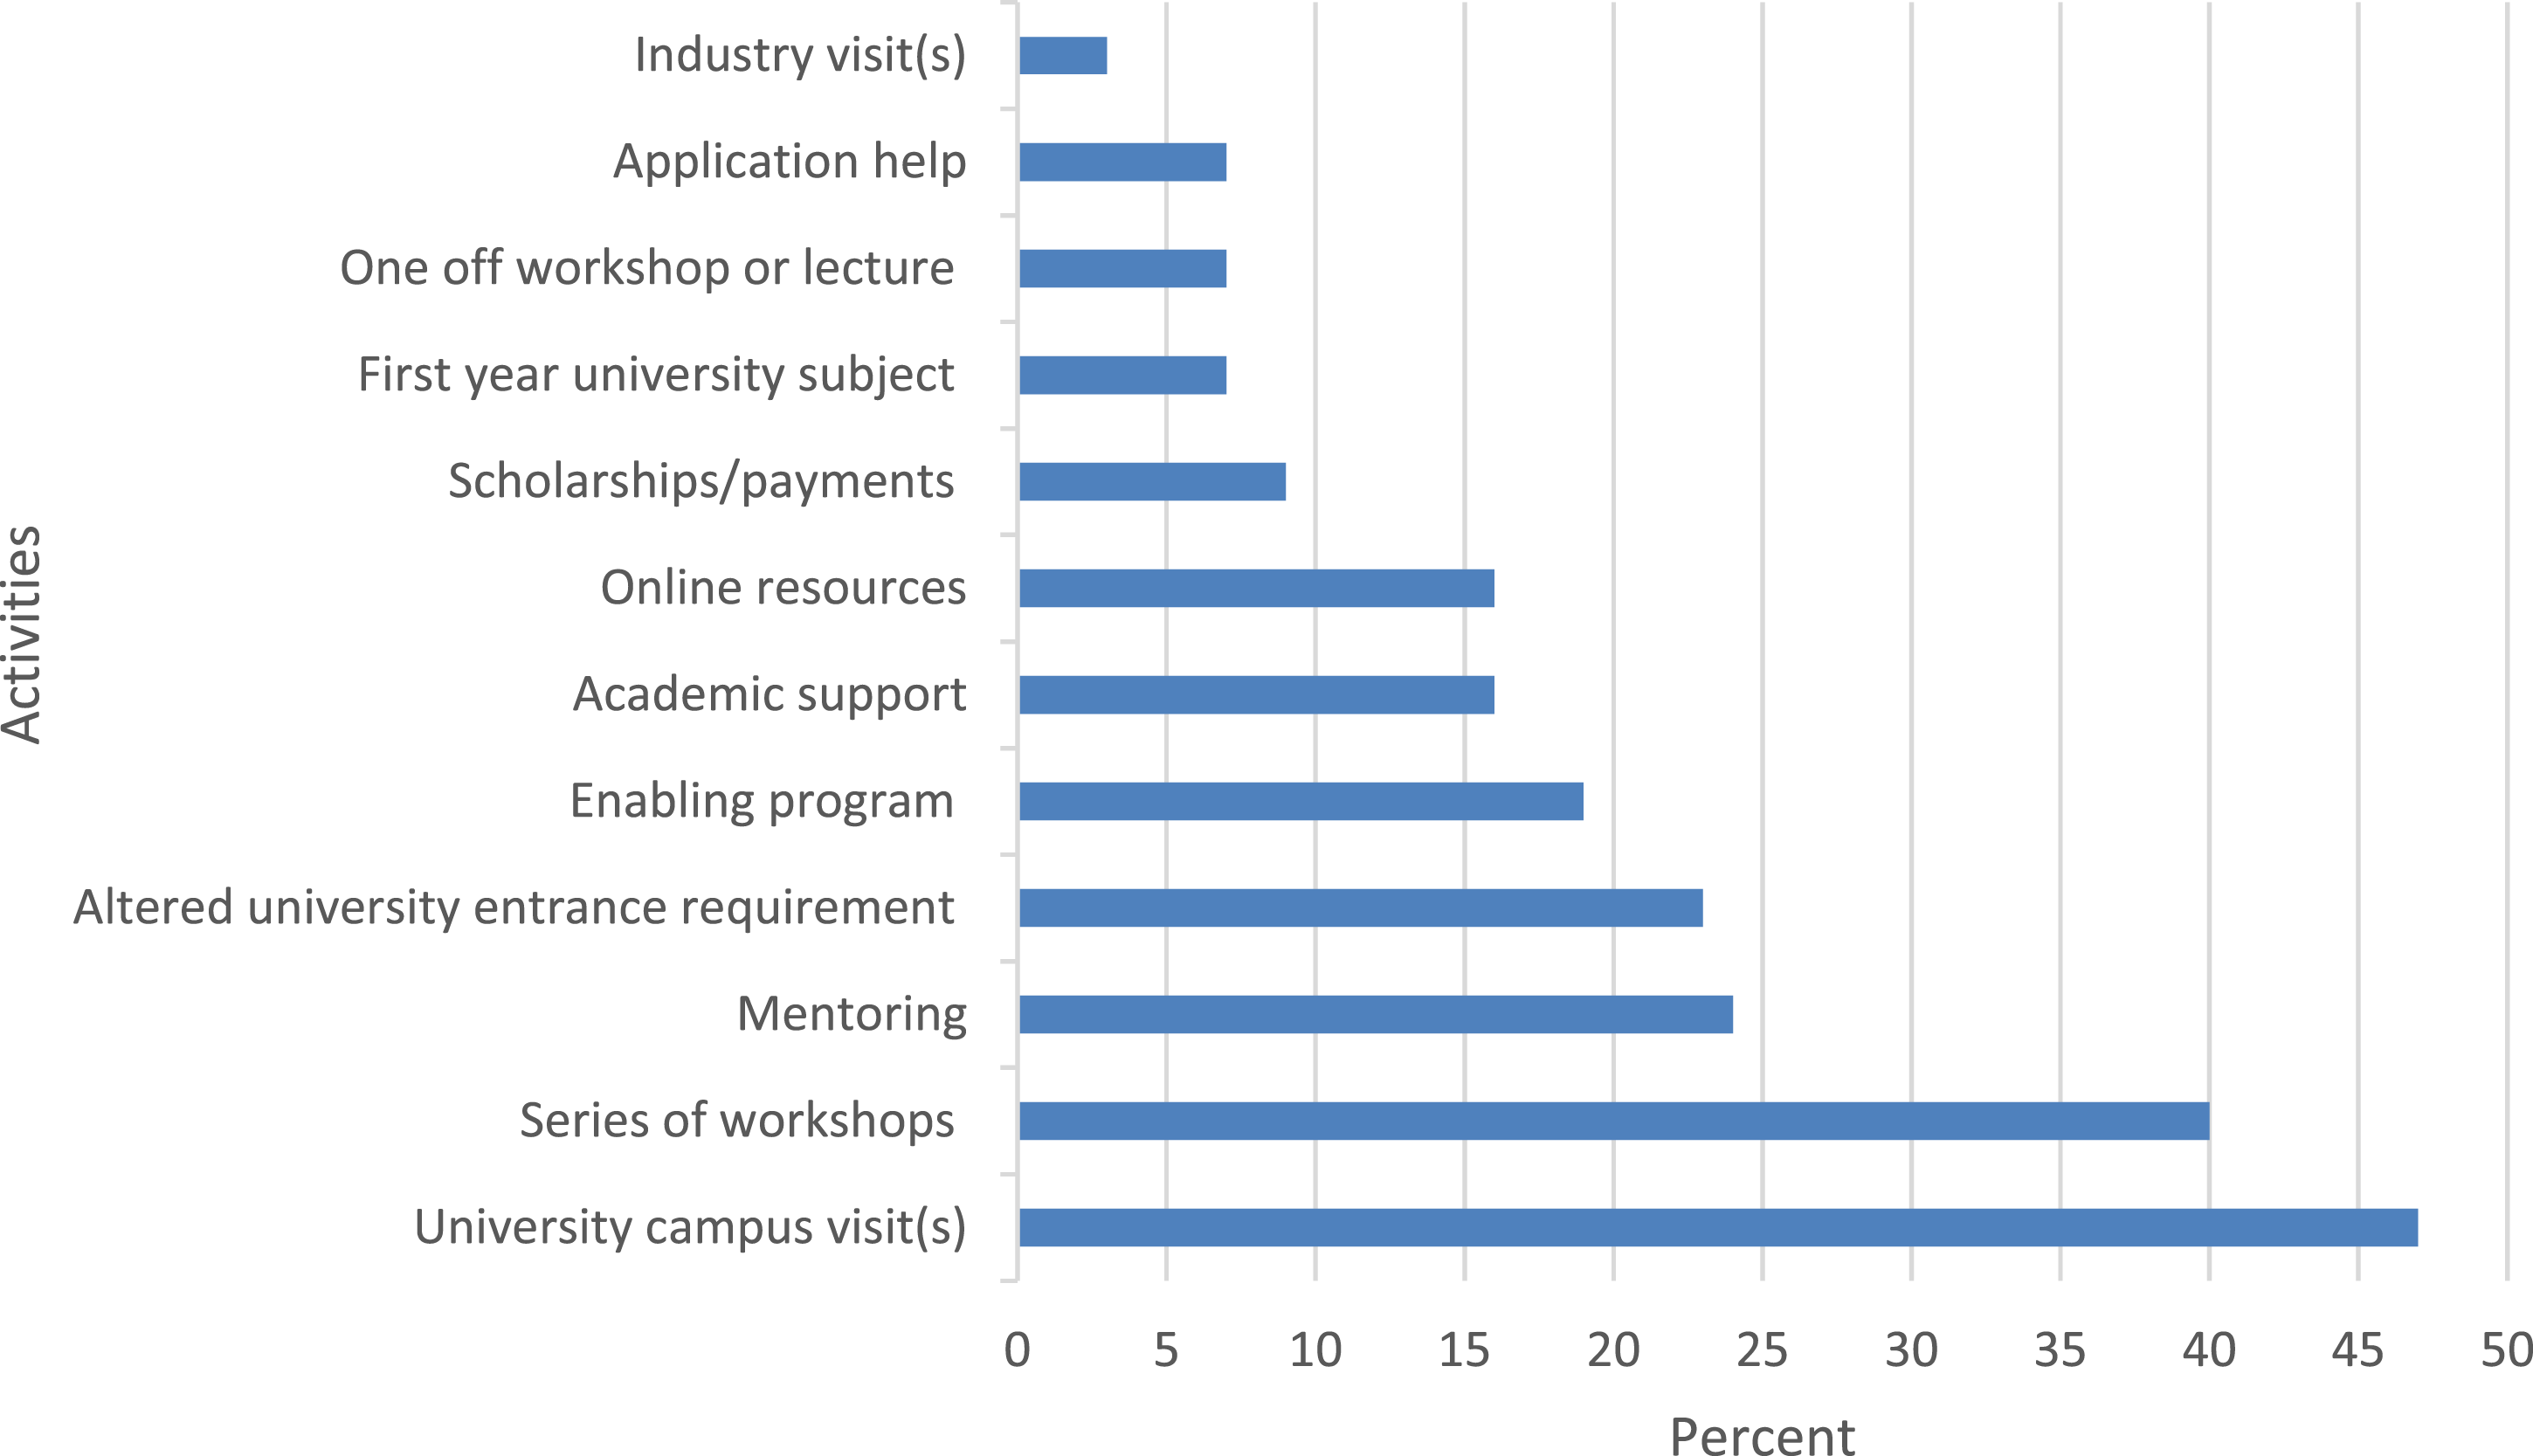
Characteristics of Schools with an Equity Program
Equity initiatives in schools by school characteristics.
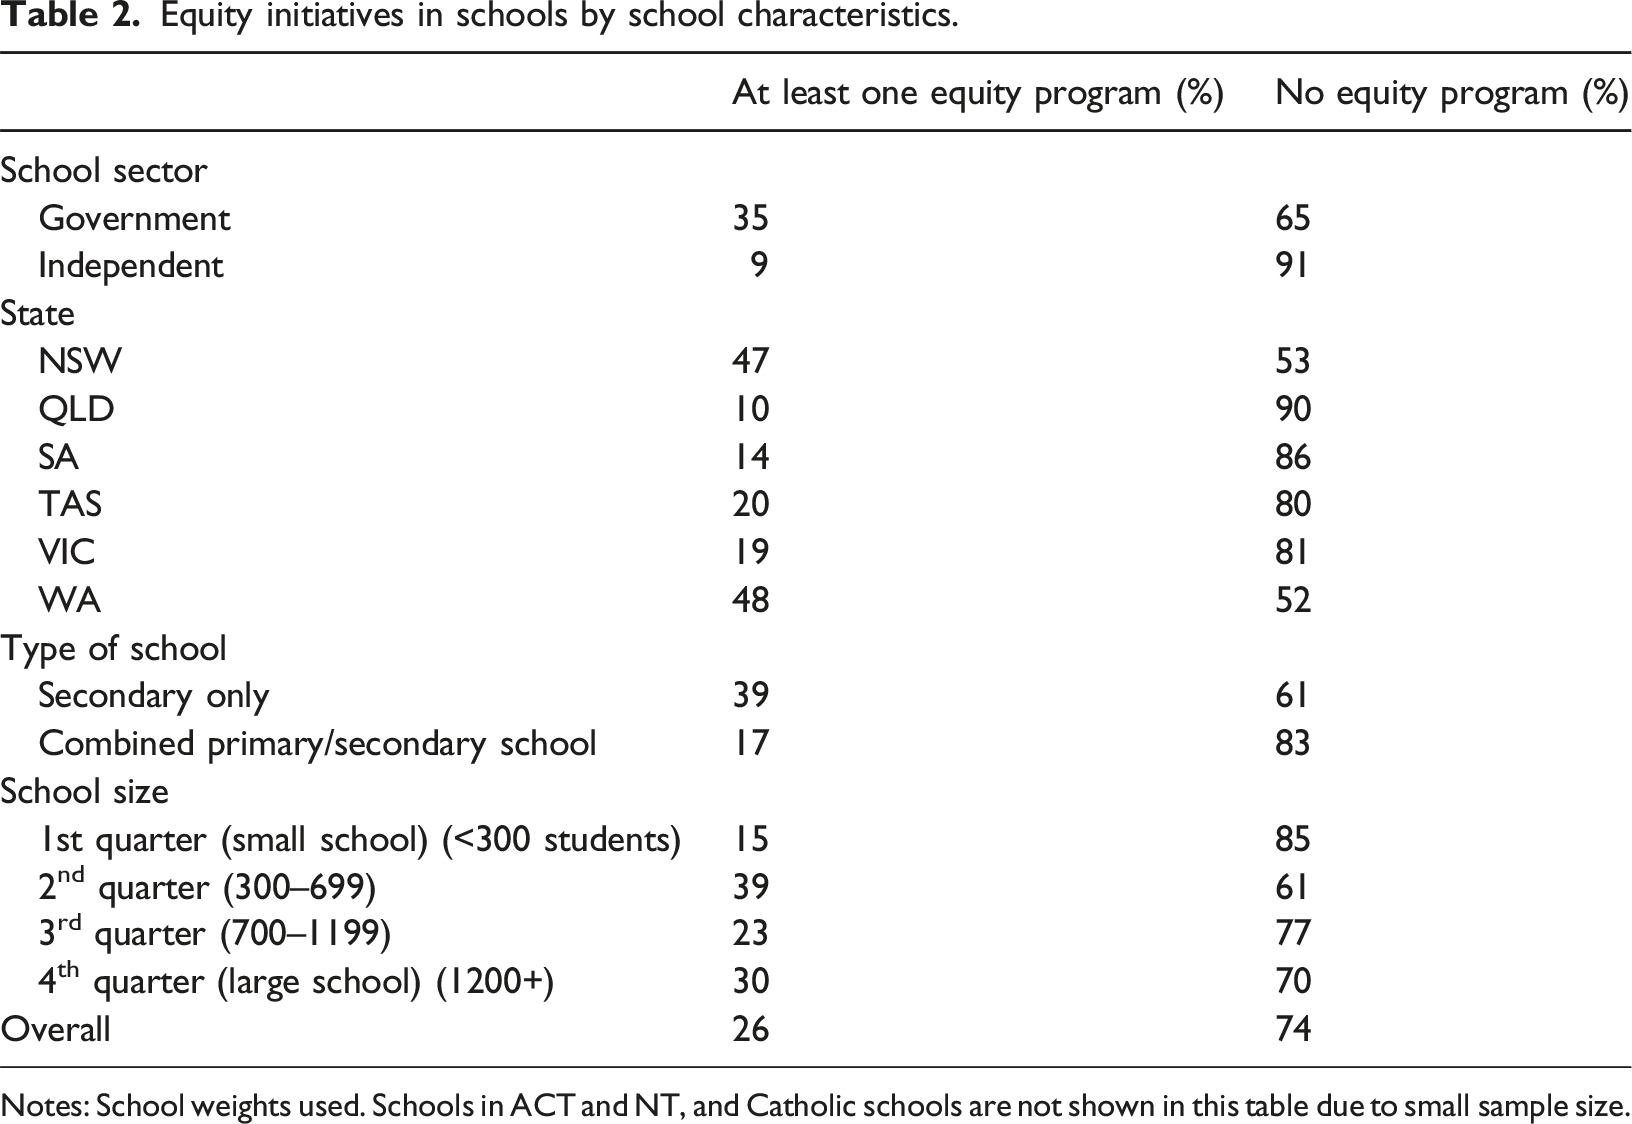
Notes: School weights used. Schools in ACT and NT, and Catholic schools are not shown in this table due to small sample size.
School socioeconomic status by equity initiative.
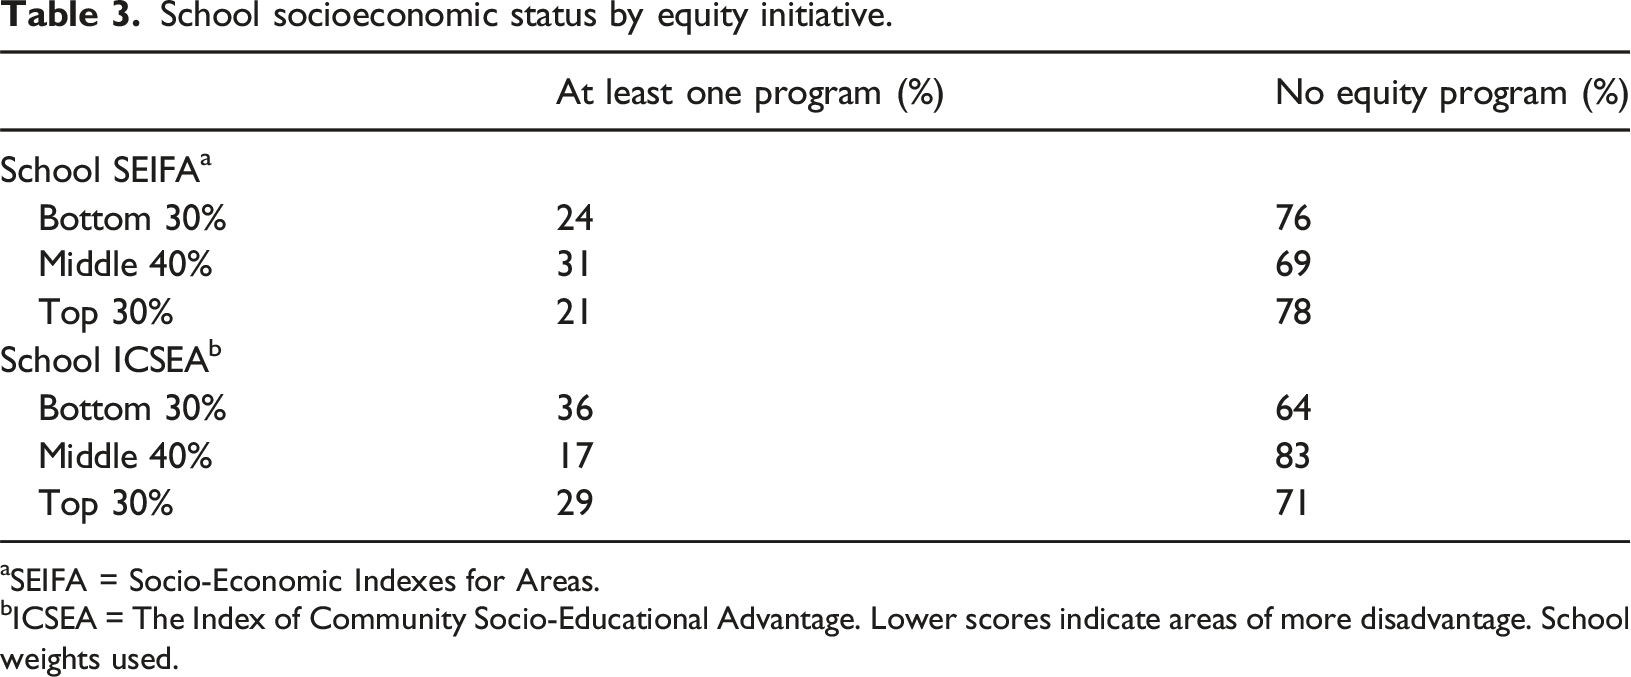
aSEIFA = Socio-Economic Indexes for Areas.
bICSEA = The Index of Community Socio-Educational Advantage. Lower scores indicate areas of more disadvantage. School weights used.
Equity initiative in schools by geographical area, distance to closest university, and proportion of Aboriginal and Torres Strait student enrolments.
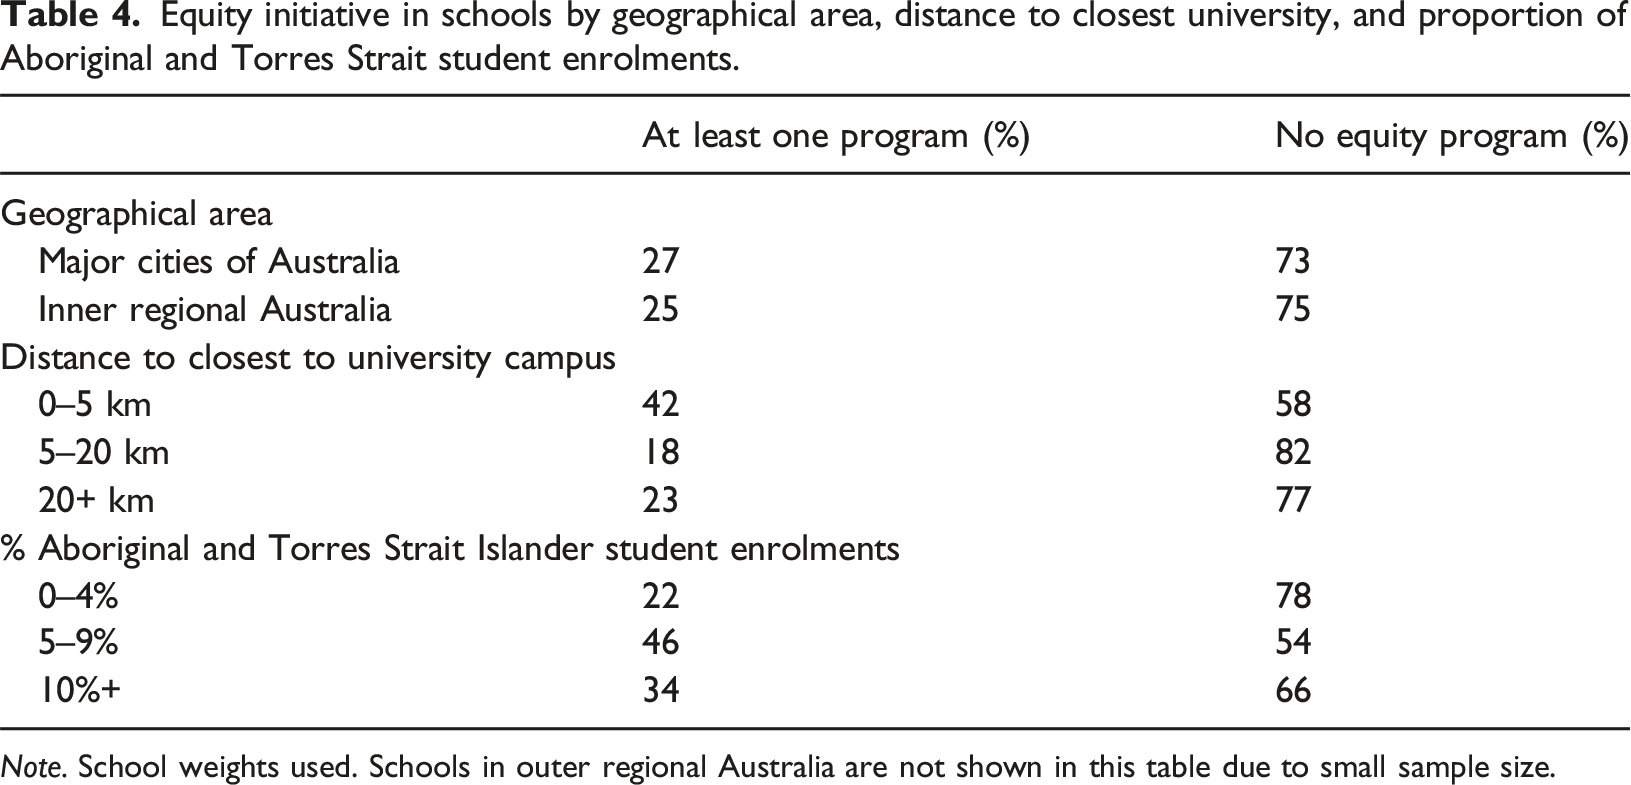
Note. School weights used. Schools in outer regional Australia are not shown in this table due to small sample size.
Logistic regression models of schools with equity initiatives.
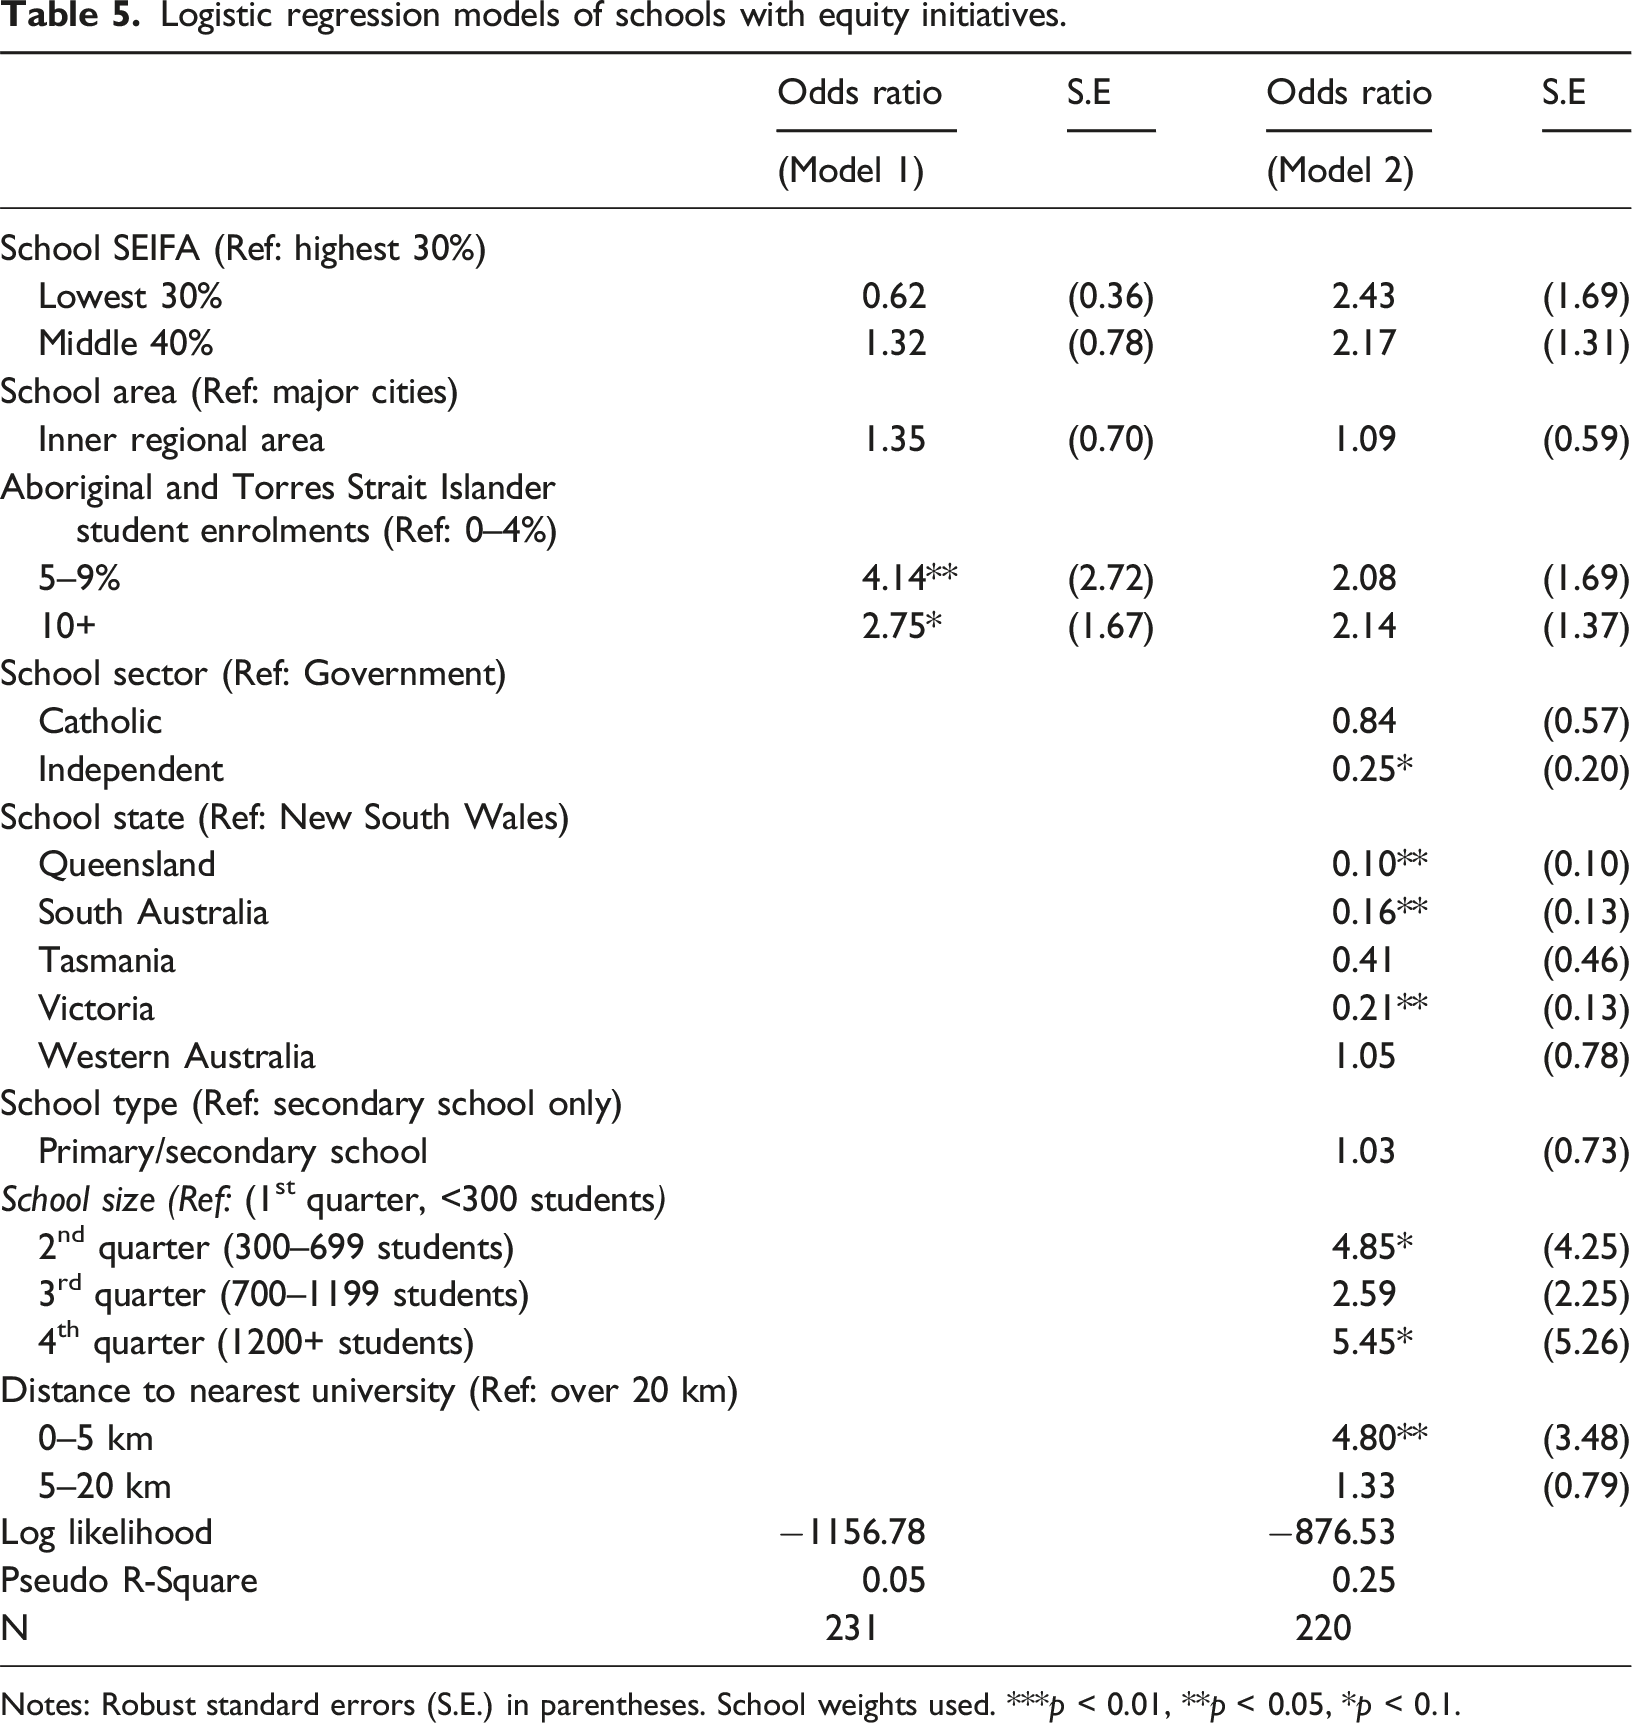
Notes: Robust standard errors (S.E.) in parentheses. School weights used. ***p < 0.01, **p < 0.05, *p < 0.1.
In Model 1, the logistic regression analysis showed that, compared to schools with enrolments of 0–4% Aboriginal and Torres Strait Islander students, the odds of having an equity program were 4.1 times higher for schools with enrolments of 5–9% of Aboriginal and Torres Strait Islander students and 2.8 times higher for schools with enrolments of 10% or more. However, in Model 2, when additional school characteristics were controlled for, the proportion of Aboriginal and Torres Strait Islander student enrolments was not a significant predictor of having an equity program. In Model 2, the logistic regression analysis revealed that independent schools were significantly less likely to have an equity initiative compared to government schools. Additionally, schools in Queensland, South Australia, and Victoria were less likely to have an equity program compared to schools in New South Wales. Furthermore, being in the second and fourth quarter of school size was positively associated with having an equity program, indicating that larger schools are more likely to have an equity program compared to small schools. The distance to the nearest university campus was also a significant predictor of having an equity program; schools within 5 kms of a university campus were more likely to have an equity initiative compared to schools located more than 20 kms from a university campus, but there was no significant relationship for schools between 5 and 20 kms from a university. School socioeconomic status or geographical location were not significant predictors in either logistic regression model.
Targeting of Equity Initiatives
We also analysed whether schools with an equity program targeting a specific equity group had higher proportions of the target population compared to schools without a targeted equity program, based on the six possible equity groups asked about in the GENERATION survey.
Percentage of schools by equity program classification.
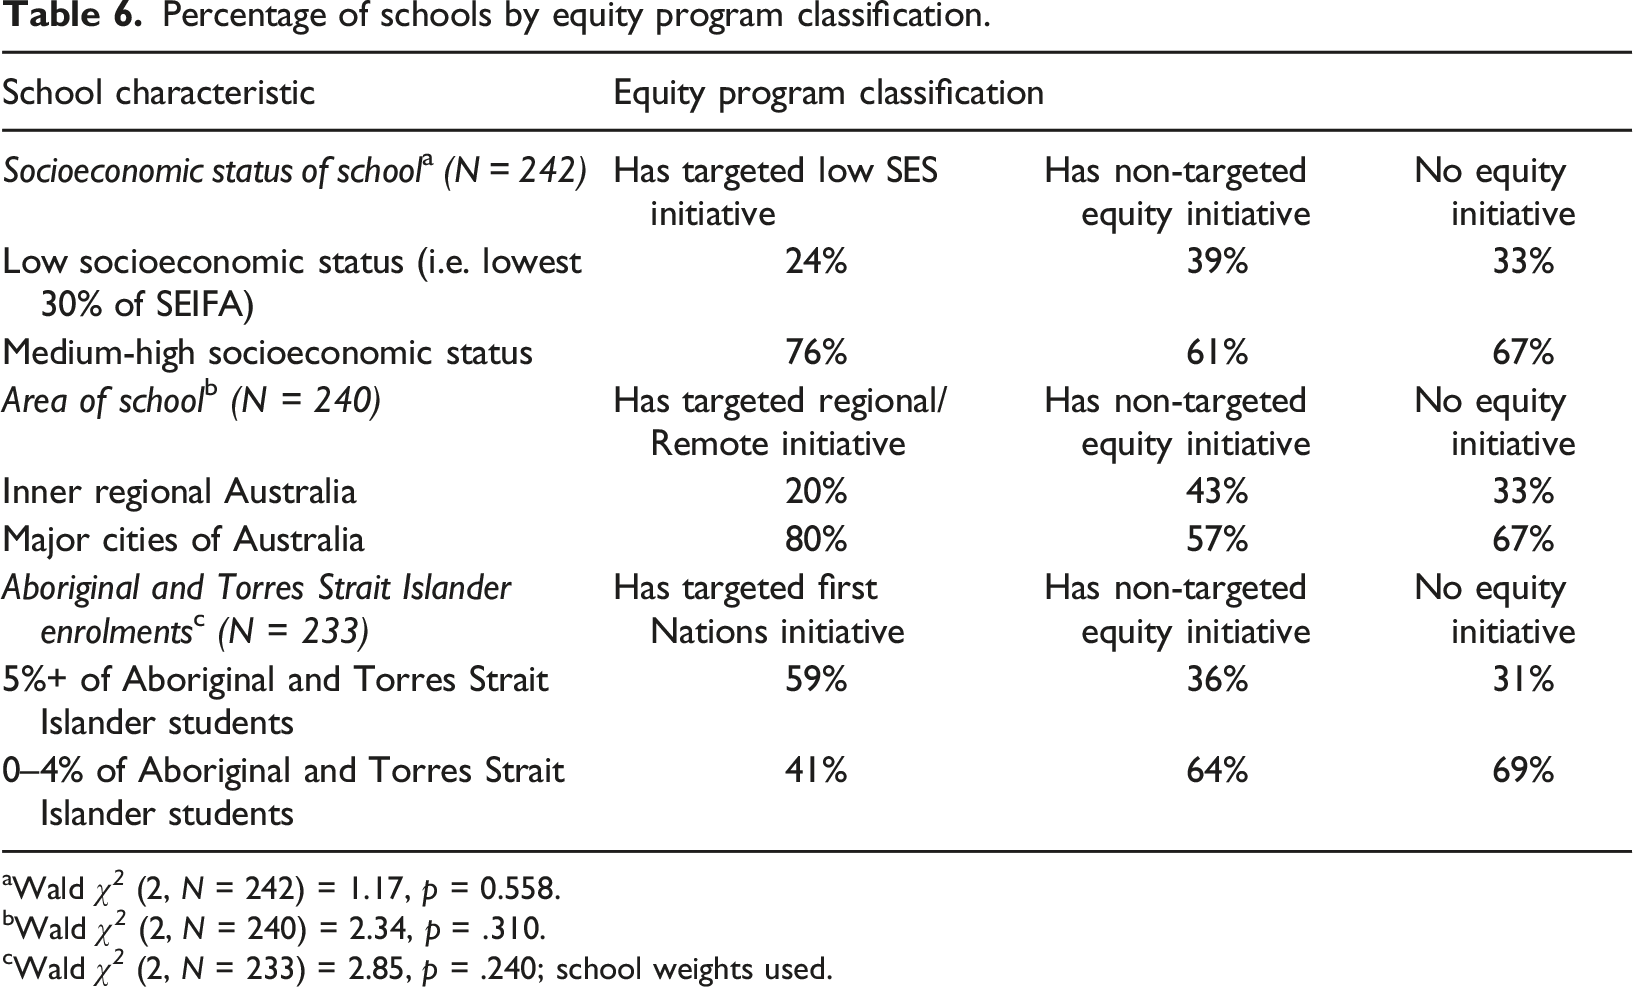
aWald χ 2 (2, N = 242) = 1.17, p = 0.558.
bWald χ 2 (2, N = 240) = 2.34, p = .310.
cWald χ 2 (2, N = 233) = 2.85, p = .240; school weights used.
Mean proportions of school characteristics by equity program classification.
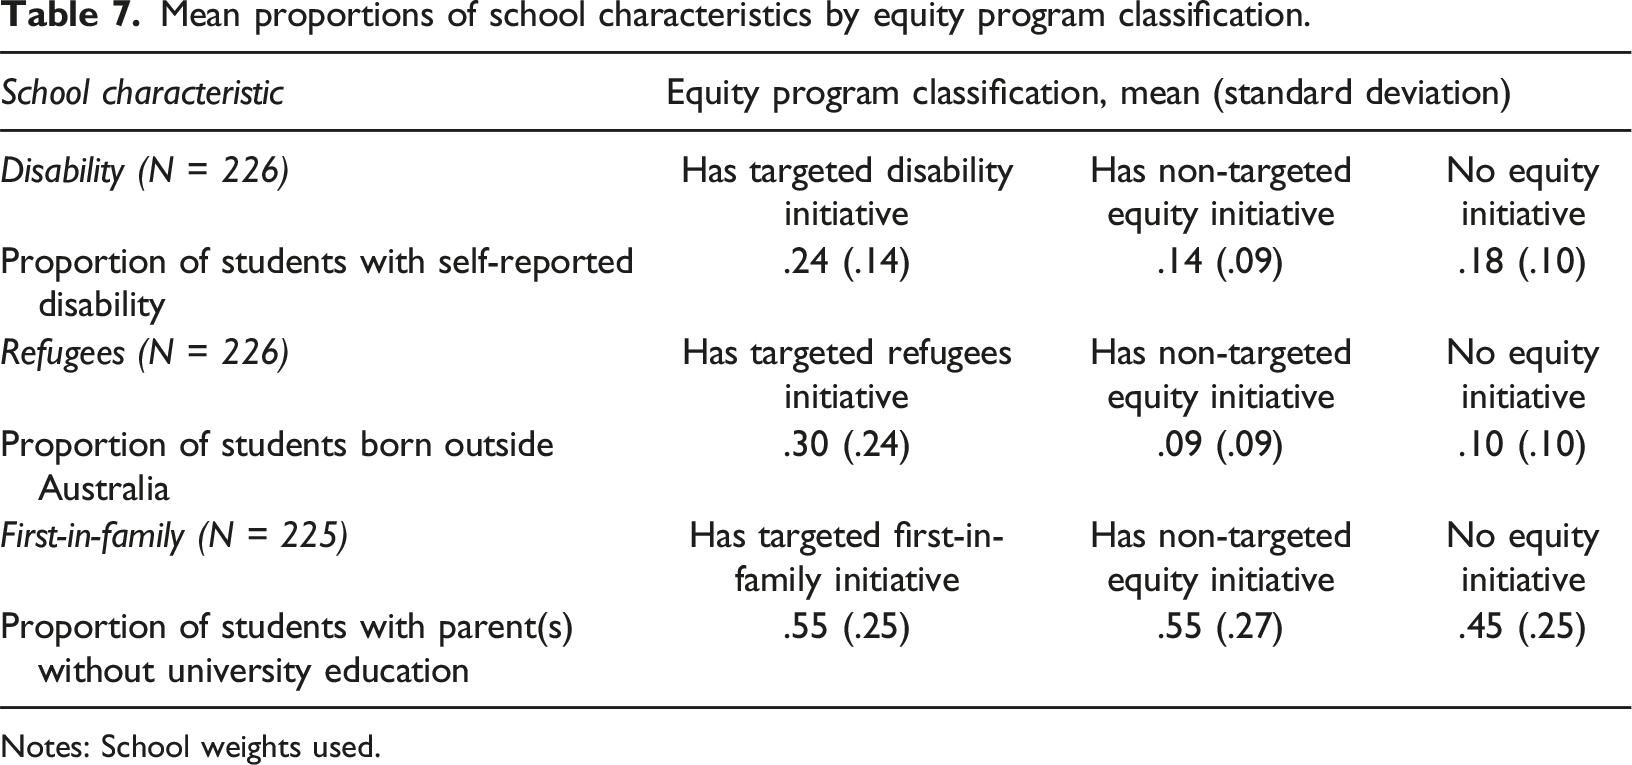
Notes: School weights used.
Three one-way ANOVA tests were conducted to assess whether the mean proportion of equity students differed significantly between the classification of equity initiatives (Table 7). The results indicated significant variation in the proportion of students with a self-reported disability according to the classification of equity initiative, F (2, 223) = 5.67, p = .004. Post hoc pairwise comparisons using the Bonferroni adjustment were performed. These showed that the mean proportion of students with a self-reported disability was higher in schools with an equity initiative specifically targeting students with a disability (M = 0.24) compared to schools without a targeted equity initiative for disabled students (M = 0.18), p = .011. The results also indicated significant variation in the proportion of students in a school born outside Australia according to the type of equity initiative, F (2, 223) = 21.15, p < .001. The proportion of students in a school born outside of Australia was higher in schools with an equity initiative targeting refugee students (M = 0.30) compared to schools without a targeted initiative (M = 0.09) and schools with no equity initiative (M = 0.10), p < .01 and p < .01, respectively. Finally, the results indicated that the proportion of students without university-educated parents varied significantly between equity initiatives, F (2, 222) = 3.93, p = .021. The proportion of students without university-educated parents was higher in schools with a targeted equity initiative for first-in-family students (M = 0.552), compared to schools that had no equity initiative (M = 0.45, p = .076). The proportion of students without university-educated parents was not significantly different in schools with a non-targeted equity initiative (M = 0.548) and schools that had no equity initiative, p = .147.
Discussion
This research offers a contemporary national picture of the presence of equity initiatives delivered in Australian secondary schools. Using a stratified-random sample of schools from the GENERATION study, we explored which schools had equity initiatives, the goals and activities of equity initiatives from the school perspective, and modelled the presence of an equity initiative according to school characteristics. Approximately one-quarter of secondary schools reported having a university-run equity program in their school. Schools reported that the programs most often focused on increasing students’ aspirations for higher education, thus fortifying the assumption that low aspirations are a key barrier to widening participation, despite the critique of this framing (Gale & Parker, 2015; Naylor & Mifsud, 2020).
Consistent with the targets of the HEPPP, schools reported that university-run equity initiatives mostly targeted students from low socioeconomic backgrounds, Aboriginal and Torres Strait Islander students, and students from regional, rural, and remote areas, as well as students who would be first-in-family to attend university. Programs targeting other students, such as those living with a disability or refugee students, were uncommon. Students with a disability are likely rarely targeted by university-run equity programs as neither the HEPPP nor the Disability Support Program funds outreach or pathways into Higher Education for students with a disability (Tomaszewski et al., 2023).
Compared to early secondary schooling, programs were most commonly reported in the final years of secondary school (i.e. Years 11 and 12). Indeed, only 23% of schools reported an equity initiative focussing on Year 7 students. As students in Australia often select their vocational pathway at Year 10, receiving information about higher education and careers in Year 11 and 12 is likely too late to make a meaningful impact on students’ education and occupational aspirations (Gale et al., 2010; Raciti & Dale, 2019).
Further, analysis of the kinds of activities that made up the equity programs reported by schools in the GENERATION study revealed that equity activities targeted both the pre-access and access phase of the student life cycle. University campus visits were the most common component of the programs, followed by series of workshops for students, and student mentoring. Activities encouraging higher education access included altered entry processes (i.e. reduced entry requirements for equity groups), enabling programs, academic support, and application help. Equity scholarships, which previous research suggests has direct impact on retention rates (Zacharias & Ryan, 2021), were rarely seen as part of the equity initiatives.
When we examined the characteristics of schools with equity initiatives, we found notable patterns. The analysis indicated that schools in low socioeconomic areas and inner and outer regional locations were not significantly more likely to have equity initiatives. As the HEPPP funding was provided to universities to target equity cohorts, this is a surprising finding. One explanation may be that higher education providers are targeting higher-socioeconomic status schools within inner regional areas, at the expense of students in outer regional, rural, and remote areas, aligning with concerns raised in Tomaszewski et al. (2023). Schools with higher proportions of Aboriginal and Torres Strait Islander students had greater odds of having an equity initiative compared with schools with low proportions of Aboriginal and Torres Strait Islander students, but this finding did not hold when other school characteristics were added to the model. We also found that school state/territory and school size were significantly associated with having an equity program. In comparison to New South Wales, schools in Queensland, South Australia and Victoria had lower odds of having an equity program. Schools of moderate size (i.e. 300–699 students) and very large schools (i.e. more than 1200 students) had greater odds of having an equity initiative compared with small schools (i.e. less than 300 students).
Moreover, we found that the odds of having an equity initiative in schools within 5 kms of a university campus were almost five times greater compared to schools located more than 20 kms away from a university. This may suggest that universities were more likely to contact schools in their local catchment areas (and students in regional areas have fewer universities to target them). In their interviews with higher education providers implementing widening participation programs in Queensland, Zacharias and Mitchell (2020) found that the costs of transport and accommodation – necessary for delivering programs to remote schools or enabling their students to participate in on-campus experiences – were significant barriers to engaging regional schools.
Finally, when examining the targeting of equity initiatives to specific cohorts, there was some evidence suggesting that schools with a targeted equity initiative for students with a disability or for refugee students had a significantly larger population of these students, respectively. The proportions of potential first-in-family university entrants in schools was also higher in schools with targeted equity initiatives. However, given the restricted focus of equity funding on broad groups (i.e. students of low socioeconomic status backgrounds, Aboriginal and Torres Strait Islander students, and students from regional, and remote areas), there is limited incentive in existing policy and funding arrangements for universities to create initiatives that respond to students who are outside of these categories.
Implications
Although the Universities Accord Report recommends the continued use of university outreach initiatives to widen participation (O’Kane et al., 2024), the findings from this research suggest a need to rethink the goals and implementation of university outreach. Firstly, the significance of relative distance on the likelihood of schools hosting a university-operated equity initiative tells us that universities, which are primarily located in urban areas, are struggling to make connections or take their equity initiatives to schools outside of a travelable radius. Consequently, universities are limited in how many schools they can reach if they rest on traditional in-person activities. Two possible options could address this restriction. Firstly, universities could develop scalable online outreach activities. Secondly, the Regional University Study Hubs (RUSHs) offer an important mechanism for revised outreach, leveraging community assets to engage, design, and delivery tertiary education preparation and study support in local areas.
A second area of reform to outreach is the relationship between schools, community, and universities. If the outreach model is based on universities inviting schools to participate (and the funding fully flows to universities to engage in this work), it stands to reason that some schools will opt-out because there are limited incentives for them to be involved in the busy-work of liaising, organising, and engaging in university outreach (Zacharias & Mitchell, 2020). If equity initiatives were co-designed with local schools, leveraging funding to resource the time and creative space needed by school staff to undertake such work, motivation to engage would likely be higher. This would require both top-level (government mandate/encouragement), bottom-up (local relationships and network connections), and mid-level (sectoral collaboration) investment.
Limitations
Potential limitations of the study include the use of a school self-report to accurately record information about the presence of equity programs in schools and the representativeness of the sample. However, to mitigate possible inaccuracies, the designated school contact person was instructed to share the survey with another staff member if they were uncertain how to answer specific items. Given that most survey respondents were careers teachers, who were likely involved in the organisation of any university-run initiatives, the recall of equity programs is likely to be reliable. Additionally, the GENERATION survey was designed as a stratified-random sample of Australian schools and students in 2022, ensuring that the results provide a reliable snapshot of the state of equity initiatives in that year. The use of school weights during the analysis also addresses any potential sample bias. Once enacted, future research could examine information collected by the Student Equity in Higher Education Evaluation Framework (SEHEEF) (Robinson et al., 2022) to further analyse aspects of equity initiatives in Australian schools.
An additional limitation of the study is the use of school-level socioeconomic status, as measured by school characteristics, rather than student-level socioeconomic status, which is typically based on a student’s home address, as a measure of low SES. However, this is likely consistent with the information higher education providers have – universities would not be privy to students’ SEIFA until their home address is provided during university applications; thus, they must rely on publicly available school-level socioeconomic information, such as that provided through the MySchool website.
Conclusion
Overall, this research examined the kinds of activities that commonly make up equity initiatives in Australia and the characteristics of schools with equity initiatives. While one in four schools in the survey had a university-run equity initiative, the results suggested that university-run equity initiatives may not be effectively targeting educationally disadvantaged students from low socioeconomic or rural/remote areas, and instead targeting local schools. Additionally, the majority of the programs were targeted in Years 11 and 12 which may not be effective in widening participation of equity students. Further research is required to understand what kinds of equity initiatives are effective in improving higher education participation of equity groups.
Supplemental Material
Supplemental Material - On Widening Participation in Higher Education: A National Examination of Equity Initiatives in Australian Secondary Schools
Supplemental Material for On Widening Participation in Higher Education: A National Examination of Equity Initiatives in Australian Secondary Schools by Jessica L. Arnup, Ben Edwards, Sally Baker in Australian Journal of Education
Footnotes
Acknowledgements
The authors wish to express thanks to Professor Andrew Norton for helpful discussions related to this work.
Funding
The author(s) received no financial support for the research, authorship, and/or publication of this article.
Declaration of Conflicting Interests
The author(s) declared no potential conflicts of interest with respect to the research, authorship, and/or publication of this article.
Supplemental Material
Supplemental material for this article is available online.
Notes
Appendix
Sample characteristics. aSEIFA = Socio-Economic Indexes for Areas. Percentages adjusted by school weights. Total N = 242.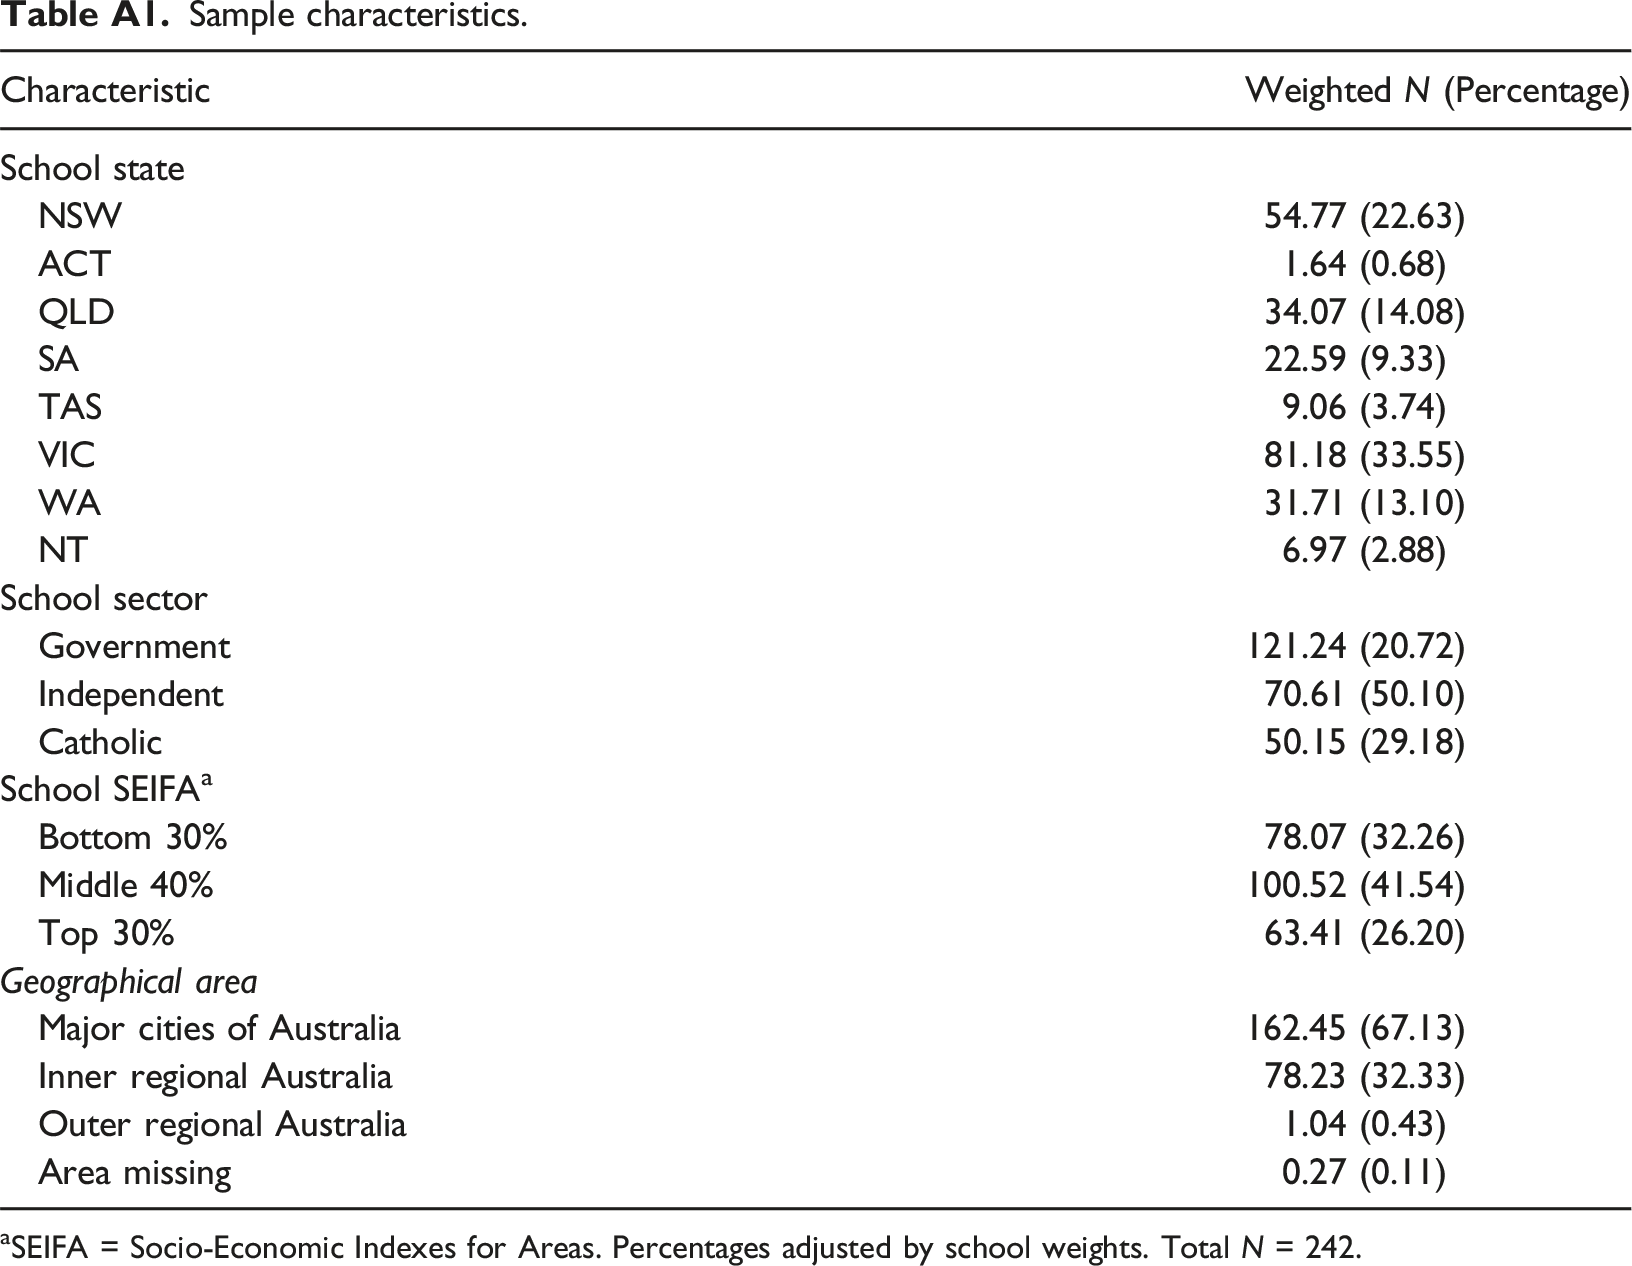
Characteristic
Weighted N (Percentage)
School state
NSW
54.77 (22.63)
ACT
1.64 (0.68)
QLD
34.07 (14.08)
SA
22.59 (9.33)
TAS
9.06 (3.74)
VIC
81.18 (33.55)
WA
31.71 (13.10)
NT
6.97 (2.88)
School sector
Government
121.24 (20.72)
Independent
70.61 (50.10)
Catholic
50.15 (29.18)
School SEIFA
a
Bottom 30%
78.07 (32.26)
Middle 40%
100.52 (41.54)
Top 30%
63.41 (26.20)
Geographical area
Major cities of Australia
162.45 (67.13)
Inner regional Australia
78.23 (32.33)
Outer regional Australia
1.04 (0.43)
Area missing
0.27 (0.11)
School socioeconomic status by number of equity programs. aSEIFA = Socio-Economic Indexes for Areas, N = 242, two schools did not provide the number of programs.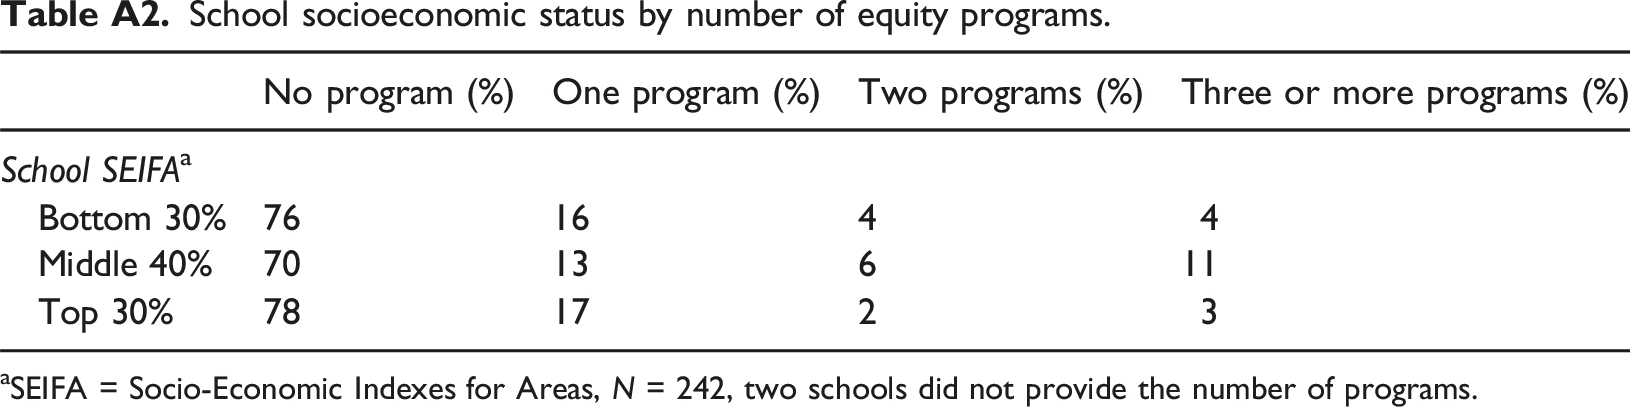
No program (%)
One program (%)
Two programs (%)
Three or more programs (%)
School SEIFA
a
Bottom 30%
76
16
4
4
Middle 40%
70
13
6
11
Top 30%
78
17
2
3
References
Supplementary Material
Please find the following supplemental material available below.
For Open Access articles published under a Creative Commons License, all supplemental material carries the same license as the article it is associated with.
For non-Open Access articles published, all supplemental material carries a non-exclusive license, and permission requests for re-use of supplemental material or any part of supplemental material shall be sent directly to the copyright owner as specified in the copyright notice associated with the article.