
Abstract
Since 2006 there have been significant changes in the labour market for university graduates, most notably the Global Financial Crisis of 2007 and the subsequent downturn in gross domestic product growth, and a huge expansion in university places. This article presents estimates of the monetary returns in Australia associated with the completion of bachelor degrees in 2016 for a range of fields of study and compares them to the estimates for 2006. The results show that for the median person, there are still good monetary incentives to complete these degrees and the private rate of return compares favourably with the long-term real bond rate. However, the article also concludes that the return to an individual investing in bachelor education had mostly declined in the period 2006–2016. There is, again, considerable variation between disciplines and for some, completion of a bachelor degree does not yield positive returns. The key factors determining the monetary rate of return are the discipline of the degree and the graduates’ subsequent labour force status. Graduates in full-time employment in most disciplines avoided being among those with low (or negative) rates of return. In addition, there is some evidence of skills mismatch and over skilling among the lowest paid university graduates.
Introduction
There have been significant changes in the market for university graduates in Australia since earlier studies by the authors (Daly & Lewis, 2010; Daly, Lewis, Corliss, & Heaslip, 2015) presented calculations for the private rate of return to a university degree using data from the 2006 Census. Among these were the effects of the Global Financial Crisis (GFC) on the demand for skilled workers and the shift to a demand-driven system for determining the supply of university places, beginning in 2009 and fully operational from 2012. This article updates the earlier estimates of the monetary benefits associated with the completion of bachelor degrees for a range of fields of study at the undergraduate level to 2016 and compares these estimates to those calculated for 2006.
Recent changes in the market for new graduates
There have been important changes in the university funding model used by the Commonwealth government since the authors’ earlier calculations based on 2006 Census data (Daly et al., 2011; 2015). Although the relative importance of the Australian Government as a source of direct income to the universities has declined over time, it still accounts for about 40% of direct income (OECD, 2019). From the 1970s until the phasing in of the demand-driven system in 2009, universities were given Commonwealth support for an agreed number of places allocated, following negotiations, across broad discipline areas. In this environment, the demand for university places exceeded the supply and the university entry score acted as the price which cleared the market – courses and institutions for which there was high demand only accepted students with high university entrance scores. Students often did not receive a place in their first choice of institution and/or field of study (Norton, 2013a).
The shift to a demand-driven system in 2009, following the Bradbury Report (Department of Education, Employment and Workplace Relations (DEEWR), 2009), changed this. Universities were free to expand the number of undergraduate places they offered and to choose the fields of study in which they offered them (with Medicine remaining the exception, as the number of places offered is determined by the Australian government, with input from the Australian Medical Association). It was argued that Australian society would benefit from a larger cohort of university graduates with the stated aim of having 40% of 25–34 year olds with a bachelor degree or higher by 2025 (Norton, 2012). It was also argued that the demand-driven system would promote more competition between universities and increase the opportunities for students to study in their preferred disciplines and at their preferred institutions. The expansion of the system was also expected to promote opportunities for students from disadvantaged backgrounds (Norton, 2013b). This expansion in enrolments also substantially increased Commonwealth expenditure on higher education.
The shift to a demand-driven system appears to have achieved the predicted changes. Norton (2013a) reported that by 2012 the percentage of applicants receiving an offer of a university place had risen from 77 to 81% and they were more likely to be matched to their highest preference. Offer rates rose particularly in the broad field of study categories: Society and Culture, Management and Commerce, Education, and Creative Arts. In a further study, Norton (2013b) presented evidence that uncapping the system increased the number of students from low socio-economic backgrounds (see also Kemp & Norton, 2014).
While the number of enrolments has risen, the number of domestic students graduating from Australian universities has also increased substantially since 2001, as shown in Figure 1. This followed an earlier increase following the ‘Dawkins era’ reforms of 1989. However, the number of undergraduate degree completions soared in the wake of the GFC in 2007 as the jobs market became slack and investment in a university education became more attractive. The already strong growth in university places was further boosted by the introduction of the demand-driven system in 2012.
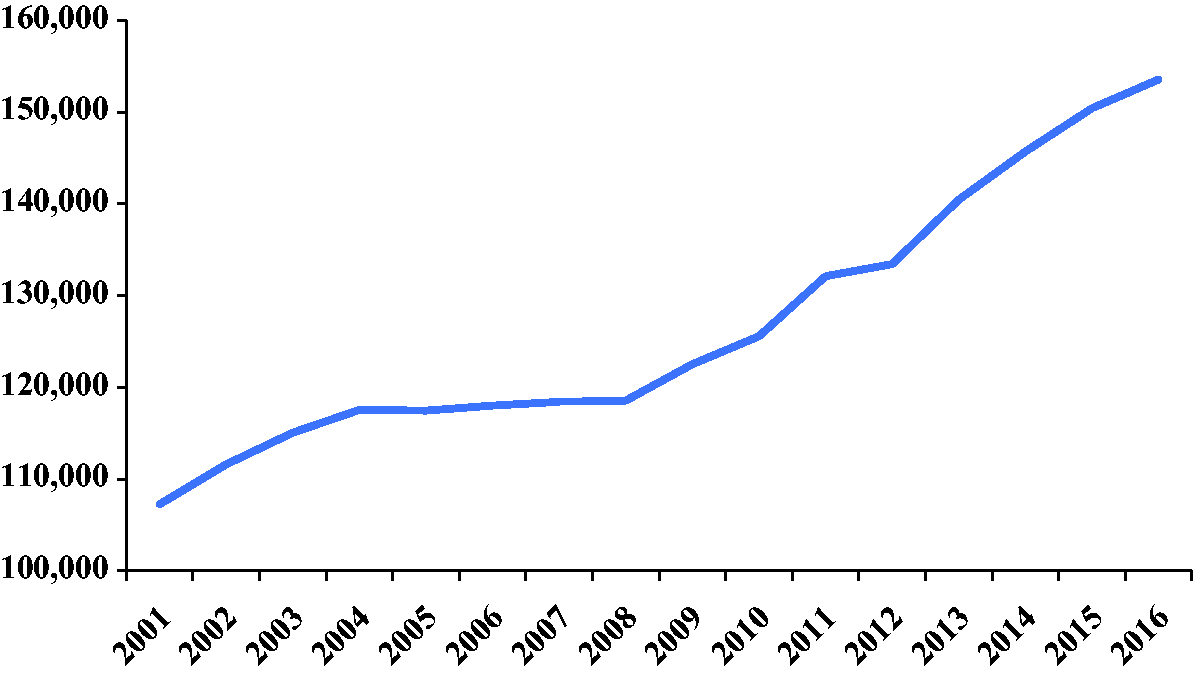
Total completions of bachelor degrees, 2001–2016.Source: Department of Education and Training (2018), uCube, Higher Education Data.
Between 2001 and 2016 the number of bachelor completions rose by 43.2%, with an increase of 30.1 percentage points between 2006 and 2016. Such a large increase in the number of new graduates entering the labour market during a period of slow-to-modest growth in employment (Lewis, 2015) may be expected to have a significant impact on graduate employment and earnings, especially for new entrants to the labour market. The following discussion will focus on the period of this study, 2006–2016.
When examining the returns to university education, it is usual to compare degree graduates’ outcomes to outcomes of those whose highest level of educational attainment is Year 12. Table 1 provides a brief summary of the stock of university bachelor degree holders and median salaries of these university degree holders compared to the Year 12 completer comparator cohort.
Summary statistics for bachelor graduates and Year 12 completers, 2006 and 2016.
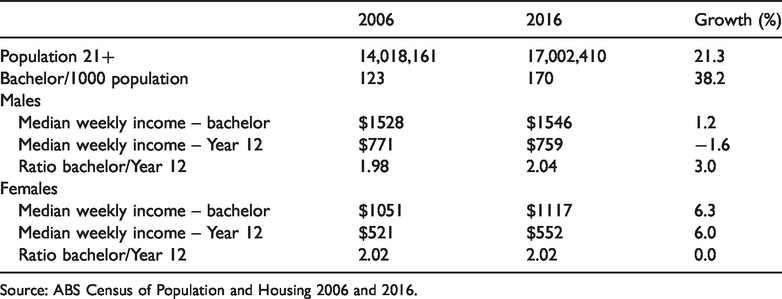
Source: ABS Census of Population and Housing 2006 and 2016.
It can be seen that the number of people holding a university degree rose at a faster rate than the population over 21 years. This increased the number of bachelor degree holders per head of population from 123 per thousand in 2006 to 170 per thousand by 2016. The real median incomes of both male and female graduates with a bachelor degree remained about double those of Year 12 completers.
These simple summary measures mask the complexity of what determines median income. These include not just salaries but labour force status, the composition of degree holders by discipline, and age of graduates. For example, median income will depend to a large extent on whether someone is employed full-time, part-time, or not employed at all – either unemployed or not in the labour force. This latter factor is more likely to be important when looking at median incomes of women (ABS, 2018).
Interestingly, the increase in bachelor graduations was not evenly distributed across disciplines, as indicated in Figure 2 which presents the growth between 2006 and 2016 by broad field of study. The growth in graduates reflects the growth in population over the period and seems only partly to reflect changes in labour market demand. For instance, while the growth in graduates in the health professions accords with the growth in demand for personal services and projected growth in the health sector (Lewis, 2015), the second biggest growth rate was in Creative Arts, an area identified by Daly et al. (2015) as yielding the poorest economic rewards for graduates.
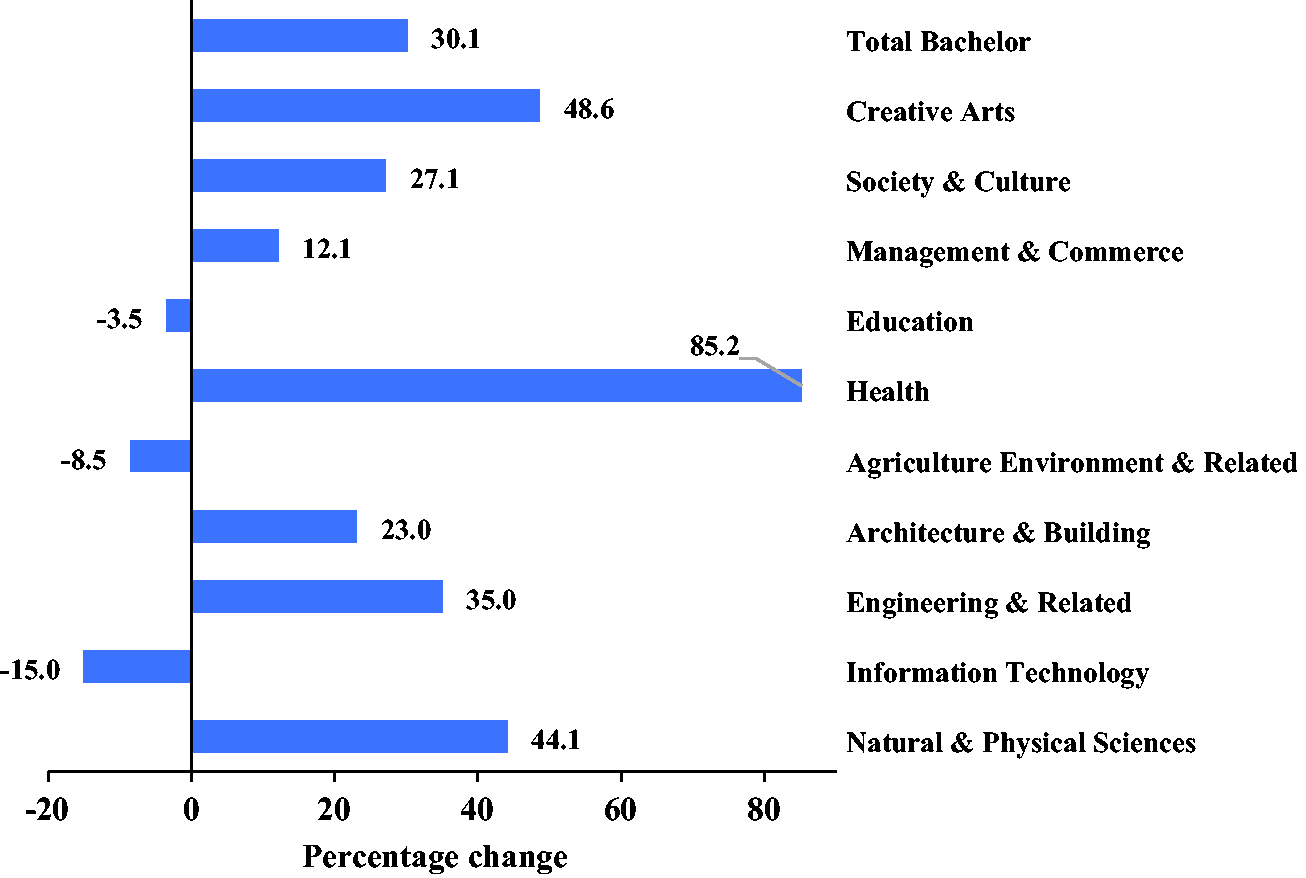
Completions of bachelor degrees by broad field of study, percentage change, 2006–2016.Source: Department of Education and Training (2016), uCube, Higher Education Data. Note: For comparison, the number of completions in 2006 were Natural and Physical Sciences (11,805); Information Technology (4672); Engineering and related (6377); Architecture and Building (2716); Agriculture, Environment and related (2294); Health (15,913); Education (13,201); Management and Commerce (22,512); Society and Culture (28,696); and Creative Arts (9822).
The magnitude of the increase in numbers of new graduates from 2006 to 2016 in a period of only modest growth in employment would be expected to have had an impact on the graduate labour market, particularly for new graduates. This is confirmed by the employment data on new graduates from the Graduate Destinations Survey (GDS), now the Graduate Outcomes Survey (GOS) (GCA, various years; QILT, various years). Results from the surveys indicate that, in the period up to 2006 about 80% of all those new graduates wanting a full-time job had one, but during the boom period this rose to over 85% (the rate was somewhat lower for females than for males) (GCA, various years) After the economic contraction following the GFC and the large unprecedented expansion in university graduates, the percentage of graduates obtaining a full-time job fell almost continuously each year until reaching a low of 68% in 2014. There were some small signs of recovery thereafter but not to the ‘boom’ levels of 2006 or the levels observed before then. Real starting salaries for new graduates also fell between 2007 and 2014 followed by some increase in 2015 but not back to pre-2007 levels (GCA, various years; QILT, various years).
One of the shortcomings of the GDS/GOS is that it focuses on graduate outcomes very shortly after graduation (about four months) but it is possible to use Census data to look at longer term outcomes for graduates, as presented in Figures 3 and 4.
Unemployment rates of bachelor graduates under 25 years of age, 2006 and 2016, per cent. Source: Census of Population and Housing, 2006 and 2016, unpublished (ABS, 2016).
Unemployment rates for all bachelor graduates by discipline of degree, 2006 and 2016, per cent. Source: Census of Population and Housing, 2006 and 2016, unpublished.
The deterioration in the graduate labour market for relatively young graduates between 2006 and 2016 is evident in Figure 3. Among all graduates under 25 years of age in 2006, the unemployment rate was about 5% but by 2016 this had risen to 9%.
This overall rate of unemployment disguises quite different rates of unemployment between the disciplines. For instance, although there were some increases in the unemployment rate for Health and Education graduates, they experienced the lowest unemployment rates of all fields of study in both years. Interestingly, the so-called STEM disciplines had the worst graduate unemployment rates for those under 25 years. Information Technology and Engineering had the highest unemployment rates in both 2006 and 2016.
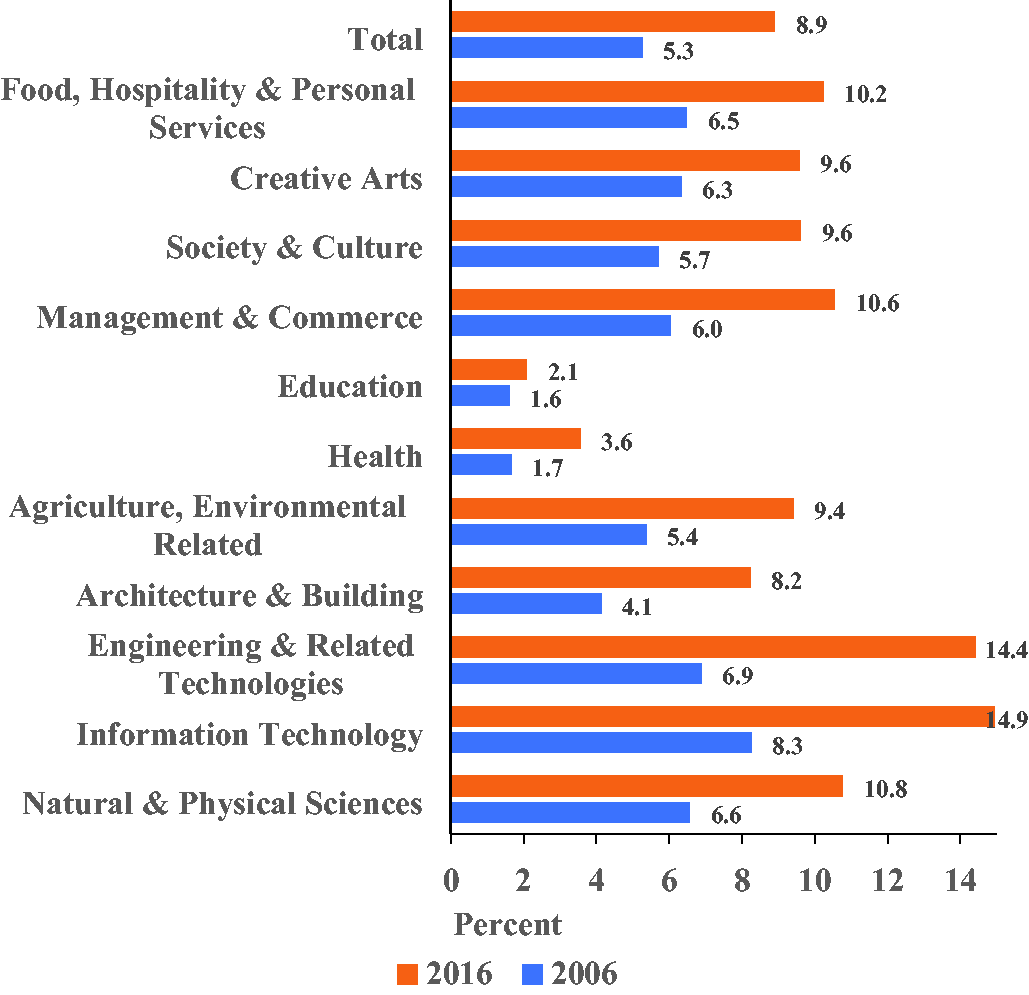
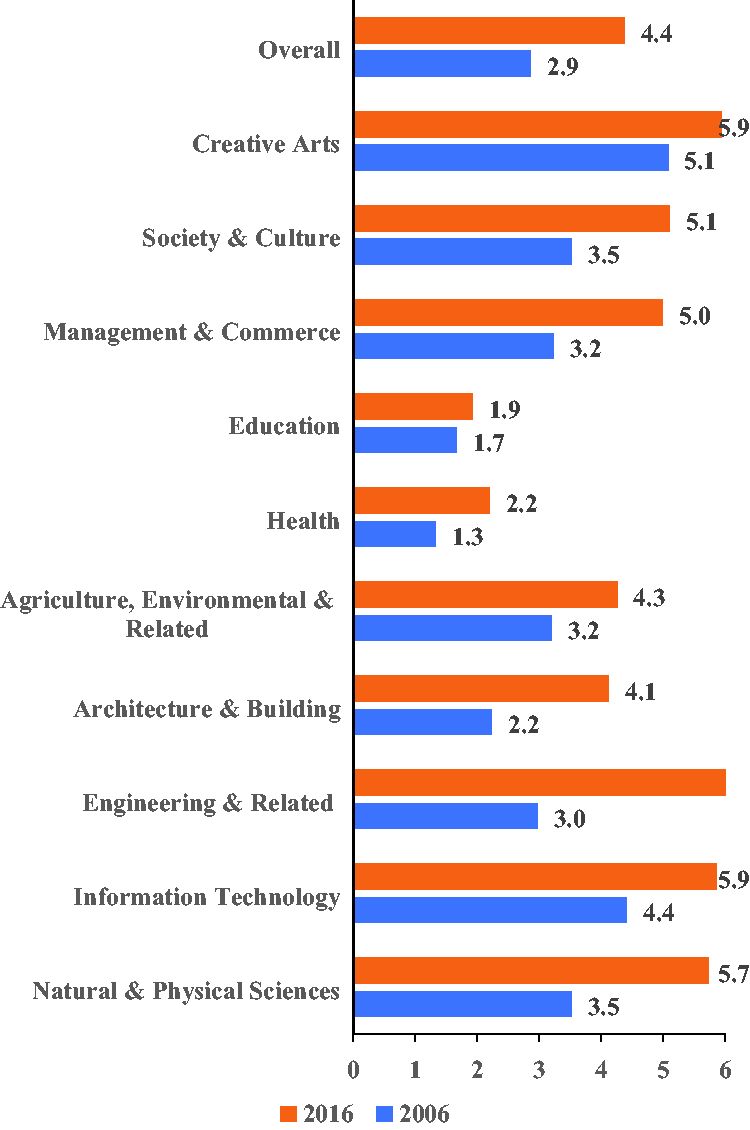
As Figure 4 demonstrates, the unemployment rate for bachelor graduates as a whole (of all ages) rose between 2006 and 2016. In 2006, the unemployment rate of all those holding a bachelor degree was 2.8% compared to the national rate of unemployment of 4.8%. By 2016 the comparative figures for all bachelor graduates and for the workforce as a whole were 4.4 and 5.7%, respectively. A university degree still reduced the unemployment rate for graduates but it did not make a graduate immune to the effects of the business cycle. The reasons for this are open to conjecture but the explanation is probably found in changes on both the supply and demand side of the labour market, with increased numbers of new domestic graduates, increased numbers of skilled migrants and lower rates of economic growth over the period in question.
However, there were substantial differences between the disciplines of degree holders with respect to unemployment as reported in Figure 4. For instance, Creative Arts graduates had an unemployment rate almost twice that of all graduates in 2006. In 2016, their unemployment rate had increased but not as much as it had for graduates of other fields of study.
The highest unemployment rates in 2016 were the STEM-related disciplines of Engineering and Related Technologies, Information Technology and the Natural and Physical Sciences, as well as Creative Arts. Graduates in these disciplines had higher rates of unemployment than for the total graduate workforce in 2016 and the greatest increases in unemployment rates compared to 2006 of all disciplines.
The returns to a bachelor degree depend not just on the salary associated with a job but being able to find a job. The above data suggest the rate of return to a bachelor degree would have fallen since 2006 but particularly so for graduates of some disciplines. However, since the usual unit of measurement is the median earnings of graduates, a rise in graduate unemployment is most likely to impact on those graduates observed in the lower percentiles of the earnings distribution. In order to capture the labour market experience over the graduate’s lifetime, it is necessary to examine the rate of return to a degree.
Methodology and assumptions of this study
The results presented below are based on a well-established methodology for calculating the private economic benefits of completing a university degree, the internal rate of return, and applied in the previous study (Daly et al., 2015) which simplifies comparisons across time and across disciplines. The underlying theoretical model is human capital theory (Becker, 1964; Mincer, 1974). According to this theory, people can invest in themselves, through improved health and education, for example, to promote their productivity in employment and are rewarded by higher earnings and more employment opportunities. This is not to deny the consumption benefits of education for its own sake, but these benefits are not included in the calculations reported below.
The internal rate of return is the discount rate which makes the net present value (NPV) of an investment zero. An alternative is to specify a discount rate and calculate the NPV of the future income stream net of costs. The decision rule is then to invest where the NPV is positive. In the case of the returns to education, the NPV of an investment is the difference between the discounted present value of lifetime monetary benefits from obtaining an additional qualification or years of education and the costs incurred in this investment.
The internal rate of return for a three-year degree is defined by the following equation
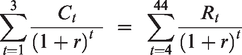
Here Rt
Usually a rate of return for the median of graduates as a whole is estimated. Given the dispersion in the distribution of individuals facing different costs and benefits, the median (50th percentile) may not be a good guide to the expected rate of return to any given individual. From a policy makers’ point of view, it does not address the question of the return to education for the marginal student. We address this issue by also calculating the rate of return for those gaining the lowest returns to a degree represented by the 20th percentile graduate income within each broad field of study.
There have been estimates of the private rate of return to investment in a university education in Australia dating from the 1970s and they show that, on average, it has been a very worthwhile investment for individuals (see a list of references in Daly et al., 2015; Norton, 2012). These calculations take into account the costs incurred by an individual in going to university (such as earnings foregone, fees, books and equipment) and the benefits received in the future from higher earnings, all appropriately discounted. Individuals in Australia, on average, have been estimated to earn a higher rate of return by completing a university degree than by investing in alternative capital assets such as government bonds. The results presented in these studies vary according to their underlying assumptions and also show substantial differences in the private rate of return according to the field of study. Similar calculations have also been made for the social rate of return to investment in a university education which takes into account any expenditure by or benefits accruing to the wider community, for example the higher taxes paid by university graduates and the government subsidies to higher education (Chapman & Lounkaewk, 2011).
It is possible to refine the calculations to test different assumptions that have been made. Here we follow Daly et al. (2015) and present private rates of return using different assumptions about the length of a degree, student earnings while studying, the timing of HECS payments, and the returns to individuals in the bottom 20% of graduate income earners.
There are a number of key assumptions which must be made in order to calculate an internal rate of return. These include the following:
The length of the degree and therefore the period for which earnings are foregone, Whether students earn any income while studying or not, The size of direct costs including the purchase of books and equipment and fees, The size of any adjustment for ability or other unmeasured characteristics which are likely to affect the rate of return.
The following discussion outlines the assumptions made in the base case reported here. The following fields of study were identified: Humanities, Science, Allied Health, Mathematics and Statistics, Information Technology, Engineering, Architecture, Medicine, Nursing, Dentistry, Education, Management and Commerce, Economics, Law, and Creative Arts.
In the base case for a bachelor degree, the length of the degree is assumed to be three years for Humanities, Science, Mathematics and Statistics, Information Technology, Nursing and Creative Arts; four years for Allied Health and Engineering degrees; and five years for degrees in Architecture, Medicine, and Dentistry. There have been some recent changes in the configuration of the qualifications required to practice in some of these professions. Medicine is now a post-graduate qualification at some universities and Architecture has changed from a five-year undergraduate degree to a three-year undergraduate degree followed by a two-year masters. As most of the current holders of these qualifications completed their degrees under the earlier system as undergraduate degrees, this assumption has been applied to all graduates in those fields of study.
To carry out the analysis, special tabulations of median income by qualification for each age (from 18 to 64 years inclusive) were prepared from the 2016 Census. These incomes are the medians for all people with a given qualification in an age category and all labour market states are included: full and part-time employed, unemployed, and not in the labour force. A simple regression relating median income to age and age squared was estimated to provide a smooth series for median incomes at each age. Net incomes were then calculated using the 2015/16 income taxation rates. The foregone earnings of undergraduates in each year of their study were assumed to be the median earnings of a high school graduate in that same year after leaving school.
The base case is the simplest case which can be modified to test the sensitivity of results to changes in assumptions. It assumes that university students start university immediately after completing Year 12, do not earn income while studying, and that there are explicit costs for students – undergraduates incur $2170 per year (in 2016 dollars) in direct study cost. These direct cost estimates were taken from the Australian Universities Student Finances Report 2006 (AVCC, 2007) and updated to 2016 prices. In addition, students are assumed to pay upfront the student fees applicable for each field of study and year at the 2016 rate of the Higher Education Contribution Scheme (HECS) charge and collect a 20% discount for paying fees upfront (this option is no longer available). This assumption will be altered to reflect the fact that the majority of students repay their HECS debt after they have completed their studies and reached the repayment threshold. The base case results do not make any adjustment for ability or other unmeasured characteristics which may affect the private rate of return.
Results
Base case
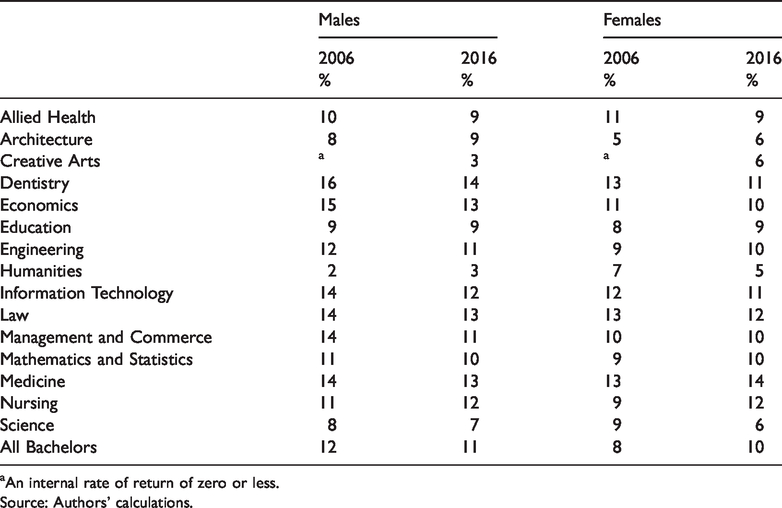
The results presented in Table 2 show the estimated private rates of return to bachelor degrees by field of study using the base case assumptions.
Internal rates of return for bachelor degrees, base case, 2006 and 2016.
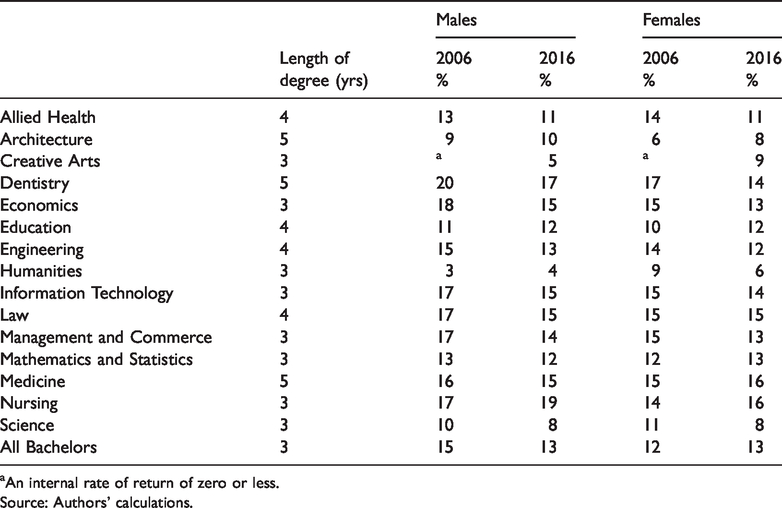
aAn internal rate of return of zero or less.
Source: Authors’ calculations.
Table 2 shows quite clearly there is substantial incentive for private individuals to attain a bachelor degree, as it exceeds the long-term bond rate of 2–3% for most fields of study. However, as measured by the internal rate of return, this incentive decreased somewhat between 2006 and 2016 for most fields of study.
There is considerable variation in the internal rate of return for the different fields of study. The highest rates of return for both men and women in 2006 and 2016 were in Dentistry, Nursing, Commerce, Law, Economics, and Information Technology. Both men and women had a high rate of return in Nursing and in Education in 2016, and improved on the rate of return in 2006. The lowest rates of return for both males and females were in the Creative Arts (negative rate of return in 2006 but improving to a positive rate of return in 2016), Humanities, and Architecture. In most, but not all, cases the internal rates of return were slightly higher for males than for females, most notably in Dentistry and Nursing. On the other hand, females with a Humanities or Creative Arts qualification received a higher rate of return than their male counterparts. Further scrutiny of the data reveals there have been significant compositional changes in Creative Arts enrolments, with most of the growth in student numbers occurring in the more vocationally based sub-disciplines such as Media Studies. Norton and Cherastidtham (2018) calculated expected lifetime earnings of men and women using 2016 Census data, according to a smaller number of disciplines. Where the results can be compared, they show a similar ranking to those reported in Table 2, with Medicine having the highest lifetime earnings and Performing Arts the lowest.
It is interesting to compare the rates of return with the growth in the number of completions over the period from 2006 to 2016 (Figure 5), which can be regarded as a measure of the supply response of students to market signals (in this case the rate of return). This must be qualified somewhat since for some disciplines, such as Medicine, places are strongly ‘rationed’ or limited.
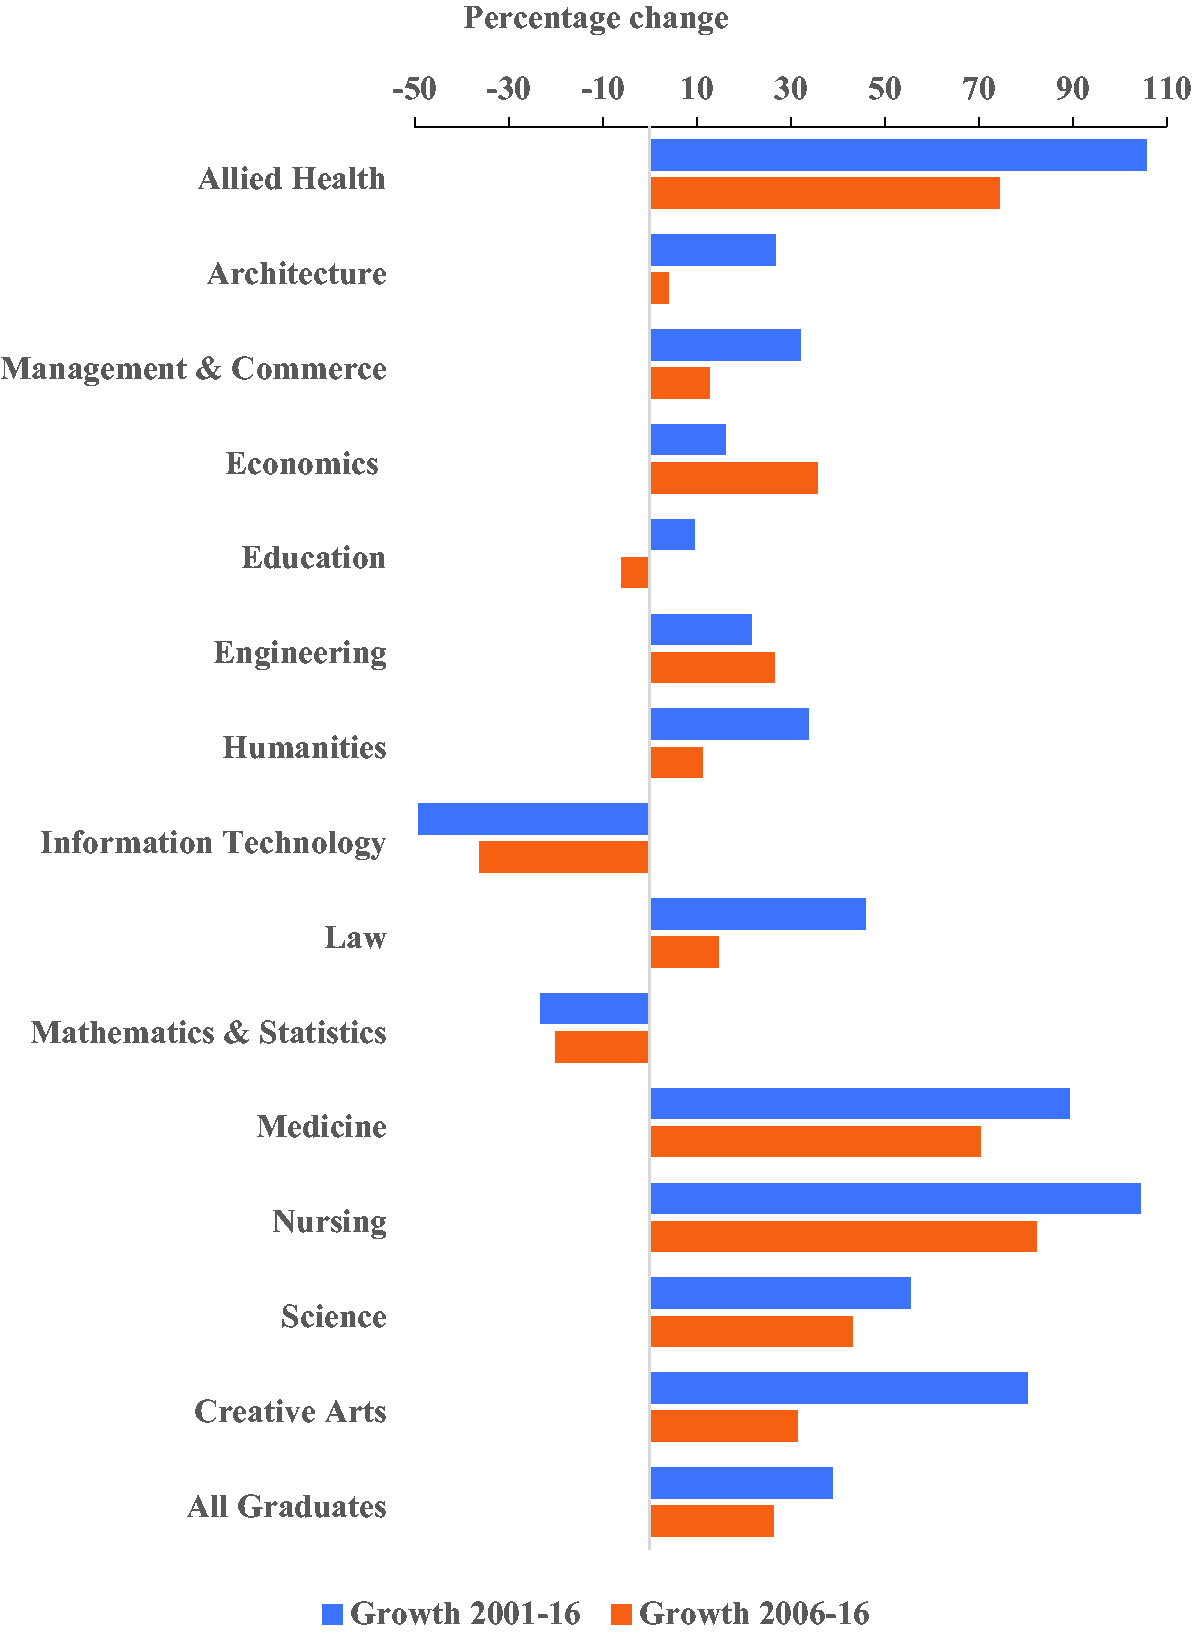
Growth in bachelor completions, 2001–2016 and 2006– 2016, per cent. Source: Australian Government, Department of Education and Training, unpublished.
Dentistry has been excluded from Figure 5 because the rise in number of completions (with growth of over 175% between 2001 and 2016 and almost 100% between 2006 and 2016) would have completely dominated the figure. This large rise in Dentistry completions has not stopped Dentistry from yielding a comparatively high rate of return, particularly for males. The areas of Nursing and Medicine have had high rates of growth in completions without noticeable deterioration in rates of return. This indicates that, for these two disciplines, the high growth in new entrants has corresponded with high growth in demand for health professionals. By contrast, the fall in growth in new Education graduates is associated with a low unemployment rate and high rate of return suggesting that even though there is a healthy demand for teachers and good career prospects, students are finding other university courses, and alternative careers, more attractive.
Sensitivity analysis
Extra year of study
The base case assumes completion of a bachelor degree in the minimum time; however, it is possible for students to take longer to complete their undergraduate studies than the three years assumed above.
To capture this, an additional year of study is added to all the fields of study to investigate its effect on the internal rate of return (see Table 3). The overall effect is to lower the internal rate return, on average about two to three percentage points, for both men and women (compare Tables 2 and 3). The most affected bachelor degrees are Dentistry and Nursing, specifically for male graduates. The least affected degrees appear to be the Humanities, Science, and Architecture, disciplines which already have relatively low rates of return and thus, perhaps, less to lose by taking extra time to graduate.
Internal rates of return for bachelor degrees with an additional year of study, 2006 and 2016.
aAn internal rate of return of zero or less.
Source: Authors’ calculations.
Part-time work while studying
According to a survey conducted for Universities Australia in 2012, 80.6% of domestic full-time undergraduates were in paid employment (Universities Australia, 2013). This has a significant effect in reducing the opportunity cost of attending university.
Daly et al. (2015) assumed students worked an average of 15 hours a week and earned $18 an hour over a year. Adjusting wage rates to 2016 prices yields an estimate of $21,795 per year before tax. This can be incorporated here to more realistically estimate the internal rate of return and NPV for the various bachelor fields of study. Furthermore, most students did not pay HECS upfront, but instead paid once they reached the repayment threshold after completion of their study (Norton & Cherastidtham, 2018). Table 4 shows the internal rates of return for students working part-time, studying full-time, and paying HECS, at the rate provided by the Australian Tax Office, upon completion of studies once they reached the HECS repayment earnings threshold.
Internal rates of return for bachelor degrees studying full-time, working part-time, and paying HECS on completion of study.
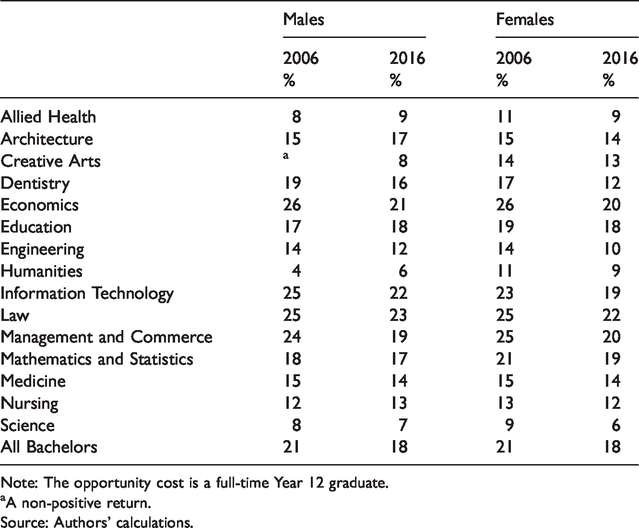
Note: The opportunity cost is a full-time Year 12 graduate.
aA non-positive return.
Source: Authors’ calculations.
Under these assumptions, the estimates show there is considerable incentive in all fields of study to attain a bachelor degree, even in the Humanities and Creative Arts. The most notable results for males are Economics, Commerce, and Information Technology, while for females the most notable are Economics and Commerce.
Full-time employment
In the base case, everyone is included in the internal rate of return and NPV estimates no matter whether they are employed full- or part-time, unemployed, or not in the labour force. For graduates of some fields of study, unemployment or a greater incidence of casual work may significantly affect the returns to a degree. One means of controlling for this is to restrict the analysis to only those who are employed full-time. Just as only the university graduates working full-time are included, the comparator group (Year 12 completers) also only includes only those working full-time (see Table 5).
Internal rates of return for bachelor degrees employed full-time, 2006 and 2016.
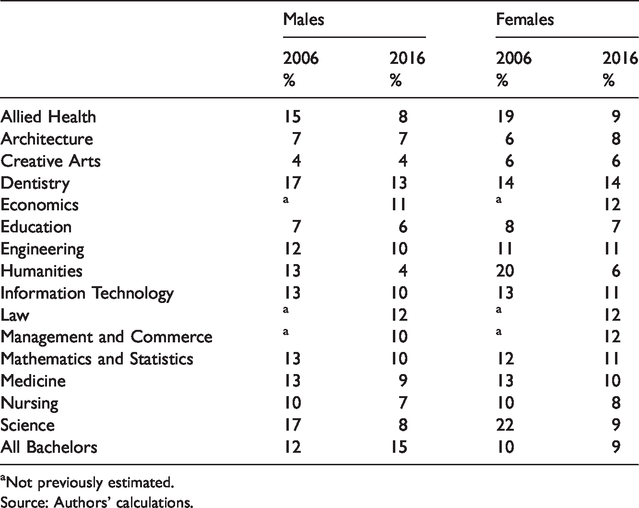
aNot previously estimated.
Source: Authors’ calculations.
Although an improvement in the internal rate of return was not apparent for all fields, some fields improved dramatically. In particular, returns for Humanities and Science graduates improved for both men and women. In contrast, the largest falls in the internal rates of return were recorded for Nursing (men and women) and Information Technology (men). While at first it may appear odd that the internal rate of return is reduced when focusing only on the individuals who are employed full-time, the explanation can be found in the fact that part-time work, unemployment, and not being in the labour force were more commonly reported among Year 12 completers than among university graduates. This contributes to a larger gap in earnings between the two groups when all people are included in the calculation, compared to when the comparison is restricted to those who are employed full-time.
20th percentile of graduate earners
Thus far, the focus has been on the median earnings of individuals attaining a bachelor degree to calculate the returns to investment in education for the typical degree holder. We now examine the returns for those graduates who are less well paid, specifically those graduates at the 20th percentile of earnings for each field of study. Here, as in the base case, the opportunity cost of study is taken to be the median earnings of the Year 12 completer as this group is presumed to be a better comparator than the worst paid Year 12 certificate holder. That is, we assume that a university graduate should have the human capital to get them at least the income of the median Year 12 completer. In this particular case, the results of the internal rate of return nearly all cannot be calculated or are negative, that is for the lowest paid university graduates they would be better off not going to university. However, the NPV can be calculated, and the estimates are included in Table 6.
Net present value of bachelor degrees 20th percentile earnings, 2006 and 2016 in 2016 prices.
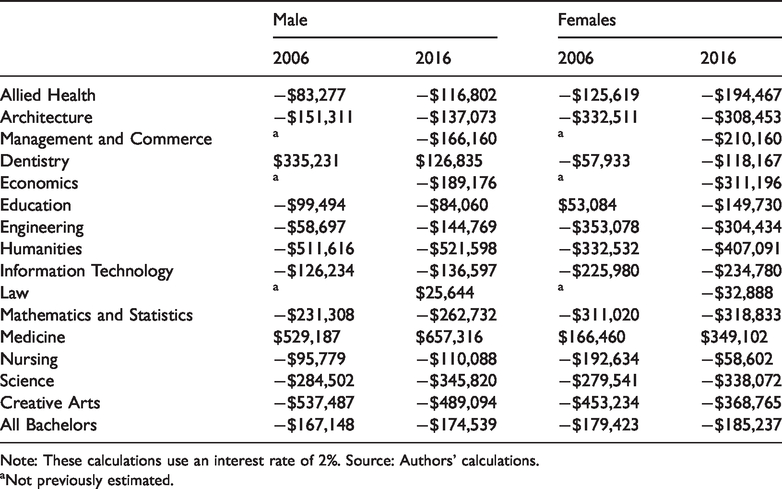
Note: These calculations use an interest rate of 2%. Source: Authors’ calculations.
aNot previously estimated.
Table 6 presents that, for most of the lowest paid bachelor degree holders, their lifetime earnings would be greater had they graduated from Year 12 and immediately obtained full-time employment. The financial rewards for the lowest paid male and female graduates of Medicine and male graduates of Dentistry still made the investment in their degrees worthwhile. For female graduates of Education, however, there was a change between the time points – what had been a profitable investment in an Education degree in 2006 was no longer profitable by 2016. Further analysis of employment rates among the 20th percentile of graduate earners (not shown) suggests that not staying in full-time employment is a very strong factor in determining graduates’ place in the earnings distribution and consequently the return on their investment in university education. Among those in employment, graduates in the bottom 20% of earners were more likely to be in occupation groups that did not require a university qualification, for example the categories Clerical, Sales and Community Workers and Machinery Operators, Technicians and Trades and Labourers, and less likely to be in occupation groups associated with university qualifications, such as Managers and Professionals. This may reflect the individual preferences of the people involved or competition for more skilled employment pushing some graduates into employment for which they could be considered overqualified.
Conclusion
Between 2006 and 2016, there was a substantial growth in the number of university graduates in the Australian population, from 123/1000 in the population to 170/1000 in the population. This was linked to the growth in graduate completions by almost a third over the same period. This expansion took place at the same time as there was slow growth in the demand for graduates following the GFC. The combination of these changes in both the supply and demand for graduate skills might be expected to have implications for the labour market outcomes for university graduates. Surveys of new graduates over the period document reductions in real starting salaries and declining employment rates, with some disciplines, such as Engineering and related disciplines and Information Technology, being particularly hard hit. Given the substantial costs incurred in undertaking a bachelor degree, these trends lead to questions as to whether it was still financially worthwhile to undertake a university degree and, if so, whether that holds true across all fields of study?
This article presents estimates of the rate of return to bachelor degrees in Australia in 2006 and 2016 under a number of different assumptions. The results show that these were profitable investments for most individuals, providing a rate of return at median income which was above the long-term bond rate. Various assumptions were adopted in order to provide a sensitivity analysis of the robustness of these estimates. The results suggest that changing the assumptions for a cohort of graduates at any point in time makes considerable differences in the returns to a degree. However, using exactly the same methodology for all disciplines does allow valid conclusions to be made about the returns to degrees in different disciplines and between genders. By adopting the same methodology at different points in time, in this case 2006 and 2016, conclusions can be made about the impacts of labour market changes, such as the business cycle, immigration, and graduate completions, on returns to university education.
The rates of return for bachelor degrees in most disciplines declined between 2006 and 2016, as would have been expected due to the increase in supply of graduates and the low growth in demand for graduates after the ‘boom’ economic conditions ended with the GFC. The exceptions to this general decline were Nursing and Education, both areas with large public sector workforces. Graduates of these disciplines, under most scenarios, did as well or better in 2016 than in 2006. Corliss, Lewis, and Daly (2013) show business cycle and supply changes were also important in determining the decline in the private rate of return to a business masters degree following the GFC.
In 2016, returns to university education were generally positive and there were large differences between disciplines. For instance, the rates of return to a bachelor degree were particularly large in some fields of study, notably Dentistry, Medicine, and Information Technology. Completion of a Creative Arts degree, however, was not a good financial investment for either men or women. The importance of choice of discipline over other factors, such as choice of university, has been emphasised in other studies of the economic benefits of attending university in Australia (Carroll, Heaton, & Tani, 2019; Koshy, Seymour, & Dockery, 2016; Norton & Cherastidtham, 2018).
Not all students receive benefits from obtaining a university degree, however. Many of the lowest paid university graduates would have done better, in terms of lifetime earnings, by finishing their education at Year 12 and entering full-time employment at the median income level.
The key factors determining rate of return were the discipline of the degree and labour force status. Maintaining full-time employment was necessary in most disciplines to avoid being among those with low (or negative) rates of return. There was also evidence of skills mismatch and over skilling among the lowest paid university graduates.
The basic conclusion from the analysis is that overall returns to investment in university bachelor degree education were still usually high relative to Year 12 alternatives but that for a number of graduates in most disciplines, and for the median graduate in some disciplines, an investment in a bachelor degree was not worthwhile in terms of financial rewards.
It should be acknowledged that the estimates reported here are based on data from the Population Census conducted by the ABS and therefore use information collected at one point to estimate lifetime incomes for graduates and the comparison group, those who completed Year 12. It was, therefore, necessary to make the assumption that the current income of, for example a 50-year-old Law graduate, is a good guide to the income that will be received by a 25-year-old Law graduate when they are 50 years old. Although this may be the best available indicator of their likely income, there are many reasons that future incomes may differ from those currently observed. These include the changes in the supply of graduates documented in this article and any changes in demand due to changes in the economy, such as those brought about by technological innovations in the future.
As discussed above, the estimated rate of return is influenced by the choice of underlying assumptions made and is based on the median income earner. Results can vary substantially between individuals graduating in a given discipline for a wide range of reasons including personality traits and luck. Nevertheless, these results offer some useful information to policy makers and individuals when considering investment in a bachelor degree education.
Footnotes
Declaration of Conflicting Interests
The author(s) declared no potential conflicts of interest with respect to the research, authorship, and/or publication of this article.
Funding
The author(s) disclosed receipt of the following financial support for the research, authorship, and/or publication of this article: This research was funded by the Australian Government Department of Education and Training.