
Abstract
This article presents estimates of the private monetary benefits in Australia associated with the completion of Bachelor degrees for a range of fields of study under a range of different assumptions. For the average person, results show strong monetary incentives to complete these degrees and the private rate of return compares favourably with the real long-term bond rate. However, differences can be observed in rates of return according to gender and discipline of study with, generally, lower returns for women and for those holding degrees in the humanities. The results are calculated on varying assumptions which provide evidence of the robustness of the conclusions. Finally, implications for policy, such as university financing and increases in university places, are discussed.
Introduction
This article reports some estimates of the private rate of return to investment in a Bachelor degree by discipline of study for Australia, using 2006 Census data. It also shows the effects of changing the assumptions on which these calculations are made on the estimated rates of return. It builds on research by the authors reported in an earlier article (Corliss, Lewis, & Daly, 2013). While this earlier article was concerned with how the rate of return to a degree changes as the state of the national economy changes, in this article the major question of interest is the extent to which returns to a degree differ between individuals by gender, discipline and income distribution at a point in time when the economy was undergoing a boom, namely 2006. While data are now available for 2011 repeating the exercise would be extremely resource intensive and costly and the findings of Corliss et al. (2013) suggest that the results are unlikely to differ greatly from those of 2006.
Numerous international and country-specific studies have been undertaken of the rate of return to individual’s investment in education. Education not only provides consumption benefits to students but it is also an investment which involves sacrificing income in the present to raise future income. According to the human capital framework (Becker, 1964), time spent in education has the potential to raise future income by enhancing people’s skills and raising their productivity. An alternative interpretation of the higher earnings of the more educated is derived from the screening hypothesis (Arrow, 1973) which argues that formal education does not actually alter an individual’s productivity but acts as a screening device used by employers to select workers. It has, in fact, proven difficult to support the claims of these competing explanations of why the more educated earn more on average than the less educated. However, clarification of the reasons for this difference is not the focus of this article. Instead, what is important here is that, on average, people with higher levels of education earn more than those with lower levels of education across a wide range of countries and time periods (see, for example, Psacharopoulos, 1973, 1981; Psacharopoulos & Patrinos, 2004 for surveys). From an individual’s private point of view, the evidence strongly suggests that investing in education is worthwhile.
The existence of consumption benefits, on the one hand and consumption costs on the other hand, such as stress and reduced leisure arising from participating in higher education, mean that assessing the value of investment in education to a private individual only tells part of the story about the total value of higher education. Other considerations in measuring the value of higher education to society as a whole are the positive and negative externalities generated in its production. On the positive side, Weale (1993) summarizes three benefits associated with endogenous growth. First, the higher productivity of the educated raises the productivity of the less educated. The second benefit relates to the effects of mothers’ education being linked to lower fertility and improved child development. The third benefit is linked to the generally better health outcomes of the more educated. It has also been argued that a more highly educated workforce contributes to a more informed and tolerant society (Lewis, Garnett, Hawtrey, Treadgold, 2010). On the negative side, increased levels of education can lead to credentialism and, where there is an excess supply of graduates, the creation of a group with unsatisfied expectations about their position in the job market. As most countries subsidize higher education, there is also the opportunity for cost associated with the use of these public funds; for example a new hospital or improved transport infrastructure. While the social rate of return is frequently discussed in the literature, a relatively small number of studies have attempted its quantification (Chapman & Lounkaew, 2011; Haveman & Wolfe, 1984; Psacharopoulos, 2009, Weisbrod, 1964).
In an earlier article, Corliss et al. (2013) used cross-sectional data from four Australian Censuses: 1991, 1996, 2001 and 2006 to calculate changes in the returns to higher education over the business cycle. Results showed that while the returns were generally positive and made the investment in higher education worthwhile, the returns for some diminished as the economy grew over the boom leading up to 2006, while for others the returns grew over the entire period. Additionally, differences were found in the patterns of the rates of return by field of study. The analyses reported in that article were useful in looking at the impact of structural change, technological change and the business cycle on the returns to higher education over time. The study used standard assumptions found in the literature.
In the analyses reported here which are based on one year of data, namely 2006, we specifically examine the extent to which the estimates of the rates of return are sensitive to the assumptions that are generally used. More specifically, we estimate the rates of return on the basis of a number of varying assumptions regarding the work and study patterns of typical students. We find that although the estimates for rates of return are fairly robust to some of the assumptions, they are very sensitive to others and therefore great care must be taken when interpreting the results and comparing between fields of study.
General issues in estimating the returns to education
The results presented here are based on cross-sectional data from the 2006 Census and are therefore an estimate of the expected average rate of return to investment in a Bachelor degree if the earnings differentials between high school and university graduates observed in 2006 were to continue over the course of a graduate’s working life. A number of reasons may invalidate this assumption. For example, the quality of education received by different cohorts may vary and there may be significant changes in the returns to skills over time. The ex post income stream of a graduate may differ substantially from the expected income stream at the time that the decision was made to undertake a Bachelor degree program. Evidence presented by Daly, Fleming, and Lewis (2006) for Australia and Heckman, Lochner, and Todd (2005) for the US shows that differences between ex ante and ex post returns can be substantial. In the case of Australia, the skill premium for male graduates compared with year 12 graduates rose 12.5% between 1986 and 2001 and for females it rose 40% creating a higher return to degrees ex post than predicted (Daly et al., 2006). The problem is that to calculate an ex post return requires 40 or more years of data on income over a working life and while the results may be of interest to the individuals concerned, they will be of limited value to people deciding whether to invest in higher education now in anticipation of a return in the future. The current incomes of graduates of different ages therefore provide a useful guide to inform such a decision.
Changes in the skill premium over an individual’s working life will reflect changes in the demand and supply of graduates. The supply of graduates in Australia has increased substantially in recent years with the total number of undergraduates per 1000 population nearly doubling compared with the early 1990s, increasing from 87 graduates per thousand in 1991 to 156 graduates per thousand population in 2006. Without a matching increase in the demand for skilled workers, the rate of return to a degree would be expected to decline as a result. It is also possible that as the number of university students has increased the quality of students has decreased as a result of this expansion which may also alter the average rate of return (Wei, 2008). Offsetting this, real incomes would be expected to rise over time with increases in productivity and the growth of the economy. While some studies make adjustments to incomes for the likely effects of economic growth over time, this adjustment has not been made in the studies reported in this article given the difficulties of predicting the effects of economic growth on average incomes of people with different levels of skills.
Another important caveat in estimating the returns to higher education is the effect of unmeasured characteristics such as natural ability, motivation and family background on outcomes. If people with higher ability are more likely to complete a university degree because the costs for them in terms of time, effort and money are lower than for people with low ability, education will look like a more profitable investment than it really is. Alternatively, people may use educational credentials to compensate lower levels of ability. If the opportunity cost of continuing in education is lower for those with less ability, they are more likely to continue in education (Leigh, 2008). If average ability is assumed in the calculations and ability is correlated with completion of a degree, this will alter the estimated rate of return to education compared to its true value. In a summary of US evidence, Card (1999, 2001) argued that ability biases to the estimates of the return to education are not large, and in the results presented here, there is no correction made for ability.
Family background is another unmeasured variable that may influence the rate of return to a university degree. Evidence from the UK indicates that the rate of return differs according to the occupational status of parents whereby graduates with parents from lower occupations particularly benefit from additional education (Weale, 1993).
Education increases income along two paths: firstly by raising the hourly wage and secondly by increasing participation in employment (Leigh, 2008). Both these factors will raise the return to education. Individuals with interrupted participation in employment—including many women—may experience lower returns to investment in education if they work fewer hours or are in employment that enables them to accommodate their nonmarket work or obligations. The completion of one level of qualifications also creates the option of continuing to the next education level which is an additional benefit often ignored (Heckman, Lochner, & Todd, 2005; Wei, 2007). Wei (2007) shows that the option value of completing secondary education in Australia grew between 1986 and 2001.
While completing a qualification provides an individual with the option of continuing in further study, there is also considerable risk associated with commencing a university degree. Costs are incurred at the beginning of the degree and nearly 30% of students do not complete their degrees. These students will incur the upfront costs and may not receive any long-term benefits. It is difficult to estimate the effects of risk on the calculated rates of return. One approach adopted by Long and Shah (2008) with respect to vocational qualifications was to assume that the risk represented approximately a 10% increase in the costs of undertaking the degree. No adjustment for dropout rates has been included here as the relevant information by type of degree is not readily available.
Methodology
In the early 1960s, authors such as Schultz (1961) and Becker (1964) applied the internal rate of return method to education. The internal rate of return (or private rate of return) is the discount rate which sets the net present value (NPV) of an investment to zero. An alternative and equivalent method is to specify a discount rate and calculate the NPV of the future income stream net of costs. The decision rule is then to invest where the NPV is positive. In the case of the returns to education, the NPV of an investment is the difference between the discounted present value of lifetime monetary benefits from obtaining an additional qualification or years of education and the costs incurred by this investment.
The private rate of return for a three-year degree is defined by the following equation
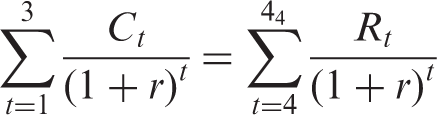
Limitations to this methodology remain. Factors such as the current state of the business cycle, self-selection of individuals into the level of education that is most likely to produce the highest returns for them and the limitations outlined earlier relating to the use of cross-section data remain important considerations. Corliss et al. (2013) have presented evidence of the impact of the business cycle on the private return to investment in a Bachelor degree and argue that over the period 1991–2006, the rate of return in Australia moved with the cycle.
A number of Australian studies of the private rate of return to investment in an undergraduate degree have been carried out over the past 30 years. While differences in the underlying assumptions and methodologies of these studies make direct comparisons difficult, they generally agree that investment in an undergraduate education is highly profitable from an individual viewpoint (Borland, 2001; Borland, Dawkins, Johnson, & Williams, 2000; Chapman & Salvage, 1997; Daly & Jin, 1997; Daly & Lewis, 2010; Daly, Fleming, & Lewis, 2004; Larkins, 2001; Leigh, 2008; Leigh & Ryan, 2005; Lewis, Daly, & Fleming, 2004; Maglen, 1994; Miller, 1982; Wei, 2010).
Assumptions of this study
A number of key assumptions must be made in order to calculate a private rate of return. These include the following:
The length of the degree and the associated earnings foregone; Students earnings while studying; The size of direct costs including the purchase of books and equipment and fees; The size of any adjustment for ability or other unmeasured characteristics which are likely to affect the rate of return; The size of any adjustment to future earnings to reflect rising living standards.
We begin with what we term the “base case,” where the assumptions are specified below. Income calculations are from the 2006 Census of Population and Housing. The following 11 fields of study were identified: Humanities, Science, Allied Health, Mathematics and Statistics, Information Technology, Engineering, Architecture, Medicine, Nursing, Dentistry, Education and Visual and Performing Arts. The paper also includes estimates from previous studies (Daly & Lewis, 2010) on three additional fields, namely Economics, Law and Business.
The length of the Bachelor degree is assumed to be three years for Humanities, Science, Mathematics and Statistics, Information Technology, Nursing and Visual and Performing Arts; four years for Allied Health and Engineering; and five years for Architecture, Medicine and Dentistry Bachelor degrees. In this context it should be noted that the duration of undergraduate degrees in some professions has recently changed. Medicine is now a postgraduate qualification at some universities and Architecture has changed from a five-year undergraduate degree to a three-year undergraduate degree followed by a two-year Masters degree. As most of the current holders of these qualifications completed their degrees under the earlier system, the assumption of a longer undergraduate degree has been applied to all graduates in these fields of study. While the aggregated groups of Humanities and Science are homogenous in the minimum length of time required to complete a degree, Allied Health contains some variation within the field. Out of the seven subfields of study identified in Allied Health, four subfields require four years to complete (Radiography, Rehabilitation Therapies, Complementary Therapies and Pharmaceutical), two subfields take three years to complete (Public Health and Other Health) and one subfield of study takes five years to complete (Optical Science).
To carry out the analysis, special tabulations of median income by qualification for each age between and including 18–64 years are prepared from the 2006 Census. We use the median income here because it is more typical than the average and is not influenced by a few individuals earning high incomes. Additionally, it is not possible to determine the mean income due to the open bracket in the top income range used in the census. These incomes are the medians for all people with a given qualification in an age category and all labour market states are included, namely full- and part-time employed, unemployed and not in the labour force. Incomes therefore reflect the different income and employment outcomes for graduates compared with year 12 completers and males compared with females. The census asks people to state their gross income from all sources which includes earnings from employment, rent, dividends and welfare payments. It is therefore an assumption of these calculations that earnings from employment account for the major part of income for people of working age. Calculations from the ABS Survey of Income and Housing show that earnings from employment account for about 75% of income of Australians of working age. While it would be preferable to have a measure of earnings from employment for the purposes of calculating a rate of return, unfortunately it is not available in the census. A simple regression relating median income to age and age squared was estimated to provide a trend series for median incomes at each age rather than using the raw data which include random fluctuates in income between individual ages creating some spurious results. Net incomes were then calculated using the 2005/06 income taxation rates.
The results presented here are based on cross-sectional data from the census and the foregone earnings of undergraduates were assumed to be the median earnings of a high school graduate. The base case assumes that university students do not earn income while studying and that there are explicit costs for students of $1720 per year (in 2006 dollars) in direct study costs. These direct cost estimates are taken from the Australian Universities Student Finances Report 2006 (AVCC, 2007). In addition, students are assumed to pay upfront the student fees applicable for each field of study at the 2006 rate of the Higher Education Contribution Scheme (HECS) charge and therefore collect a 20% discount for paying fees upfront. This assumption will later be altered to the case where students repay their HECS debt after they have completed their studies and reached the repayment threshold. The base case results do not make any adjustment for ability or other unmeasured characteristics, such as parental occupation or changes in real incomes due to the growth of the economy which may affect the private rate of return.
Results
Base case returns to bachelor degrees
Median income for all graduates by field of study, 2006.
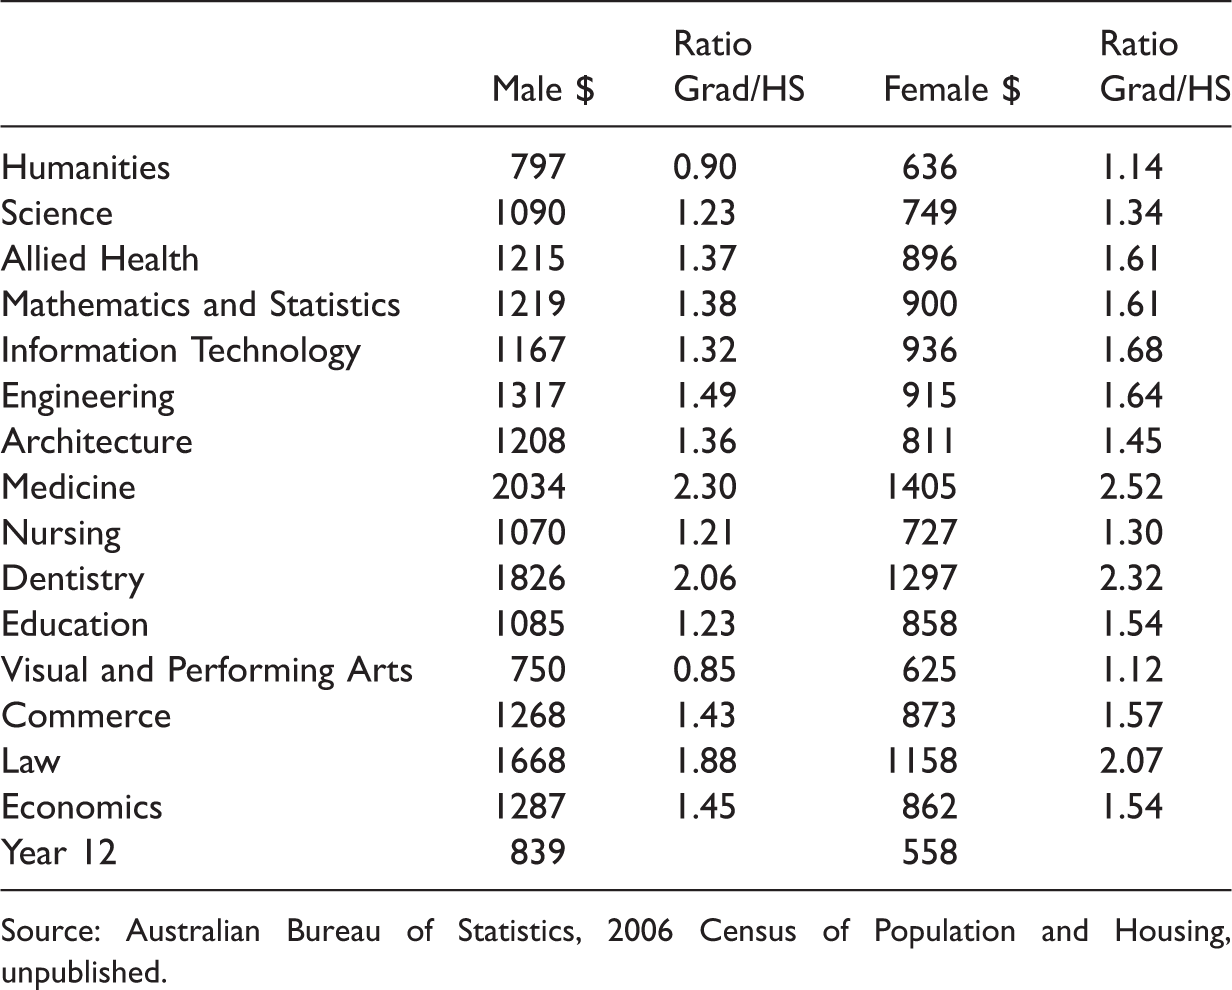
Source: Australian Bureau of Statistics, 2006 Census of Population and Housing, unpublished.
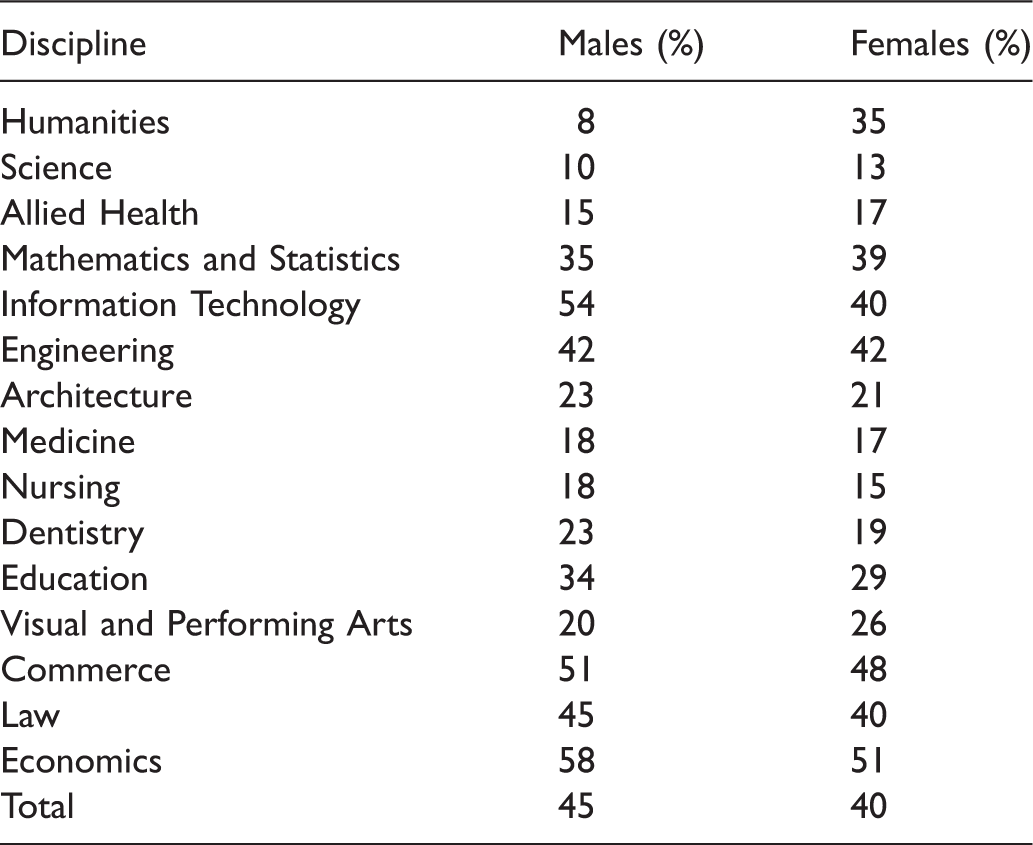
Employment status by field of study, 2006.
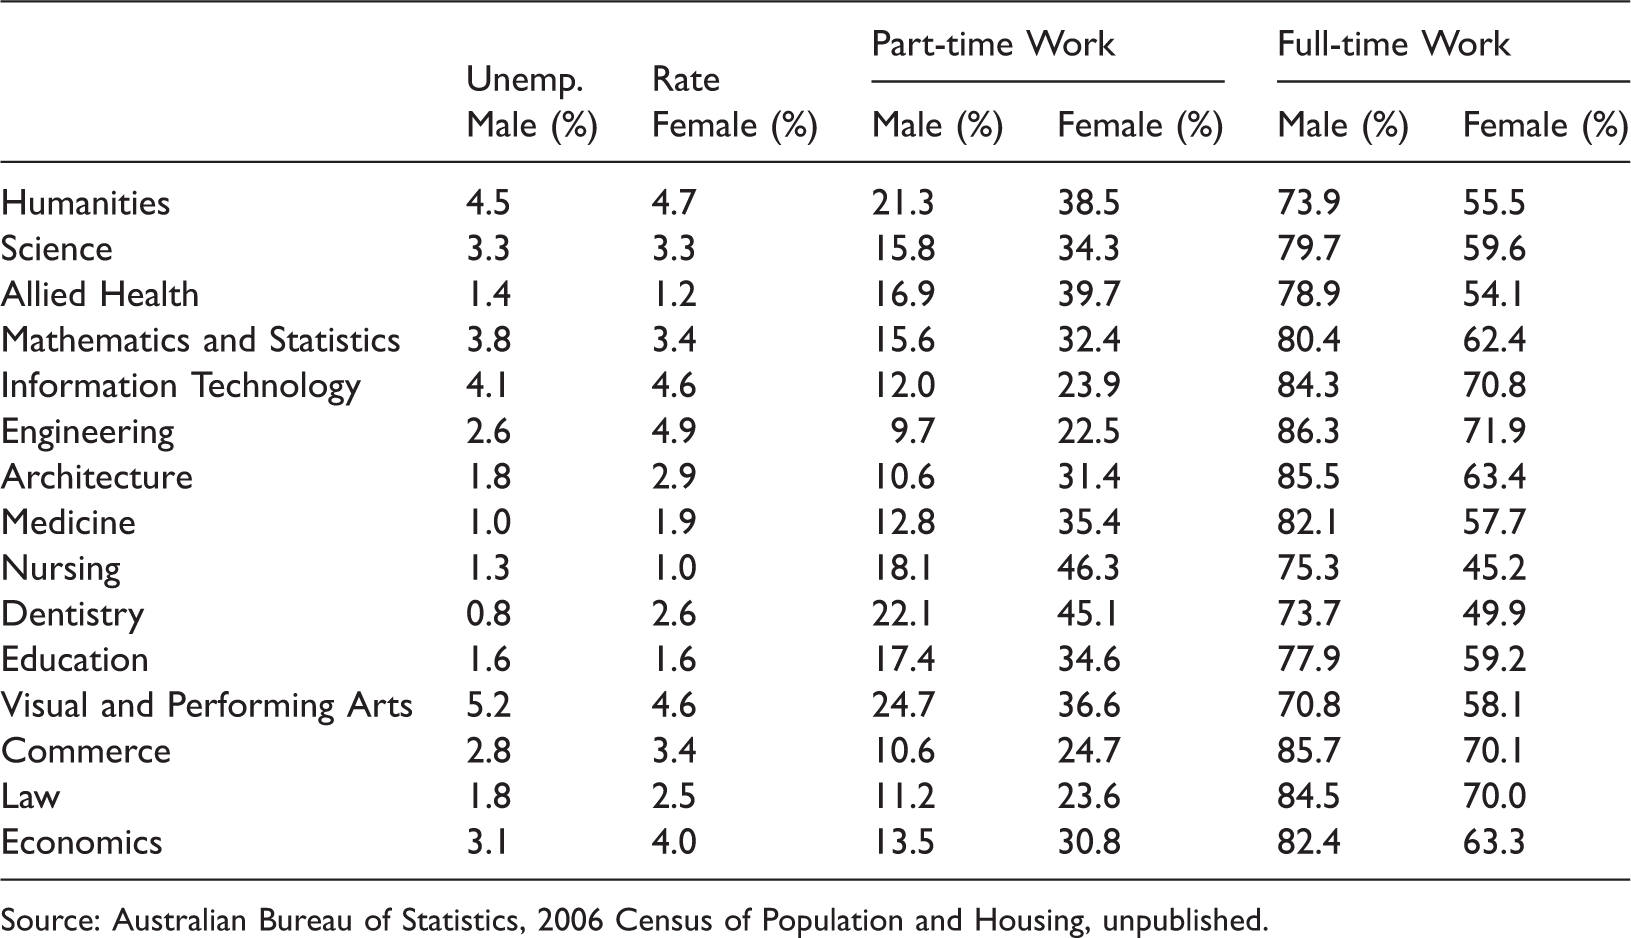
Source: Australian Bureau of Statistics, 2006 Census of Population and Housing, unpublished.
Table 2 shows fields of study with the highest unemployment rates for both males and females were Visual and Performing Arts, Humanities and Information Technology. The lowest unemployment rates were in Dentistry and Medicine; although extremely low levels of unemployment were also found in Law, Education, Nursing, Architecture and Allied Health. This was at a time when perceptions of labour shortages in a variety of industry/occupations were commonplace and included medical practitioners, nurses, schoolteachers, pilots, economists, tradespersons and engineers, through to agricultural workers and shop assistants (Corliss & Lewis, 2012). Generally, the unemployment rates of the various fields of study seen here were well below the national unemployment rate of 5.2% in 2006 (Corliss et al., 2013). This shows evidence of the strong employment effect of completing a degree in Australia.
Table 2 also shows the part-time and full-time employment status by field of study for 2006. The data in the table indicate that not only are the incomes of both males and females with a Humanities or Visual and Performing Arts degree low, but these fields of study also show the highest proportion of part-time employment at 21.3 and 24.7%, respectively. What was not expected, given the very high income for Dentistry, was that Dentistry also had a relatively high proportion employed part-time, 22.1%. Clearly, the salaries must be high to yield high income for part-time work. The fields of study with the lowest proportion of part-time employment were Engineering, Architecture and Commerce at 9.7, 10.6 and 10.6%, respectively. A much larger proportion of female graduates worked part-time in all disciplines. This was particularly true of Dentistry and Nursing where a half of all female graduates worked part-time.
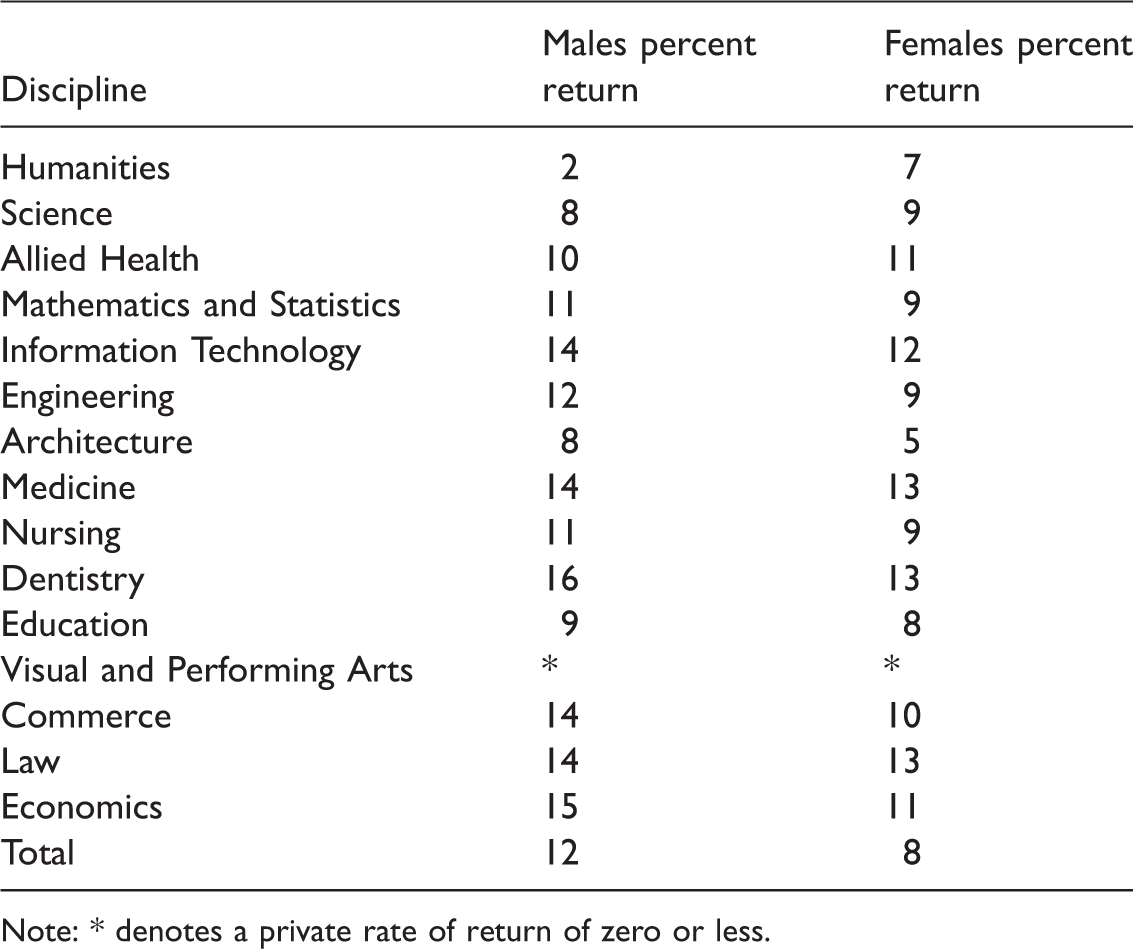
Private rates of return for bachelor degrees.
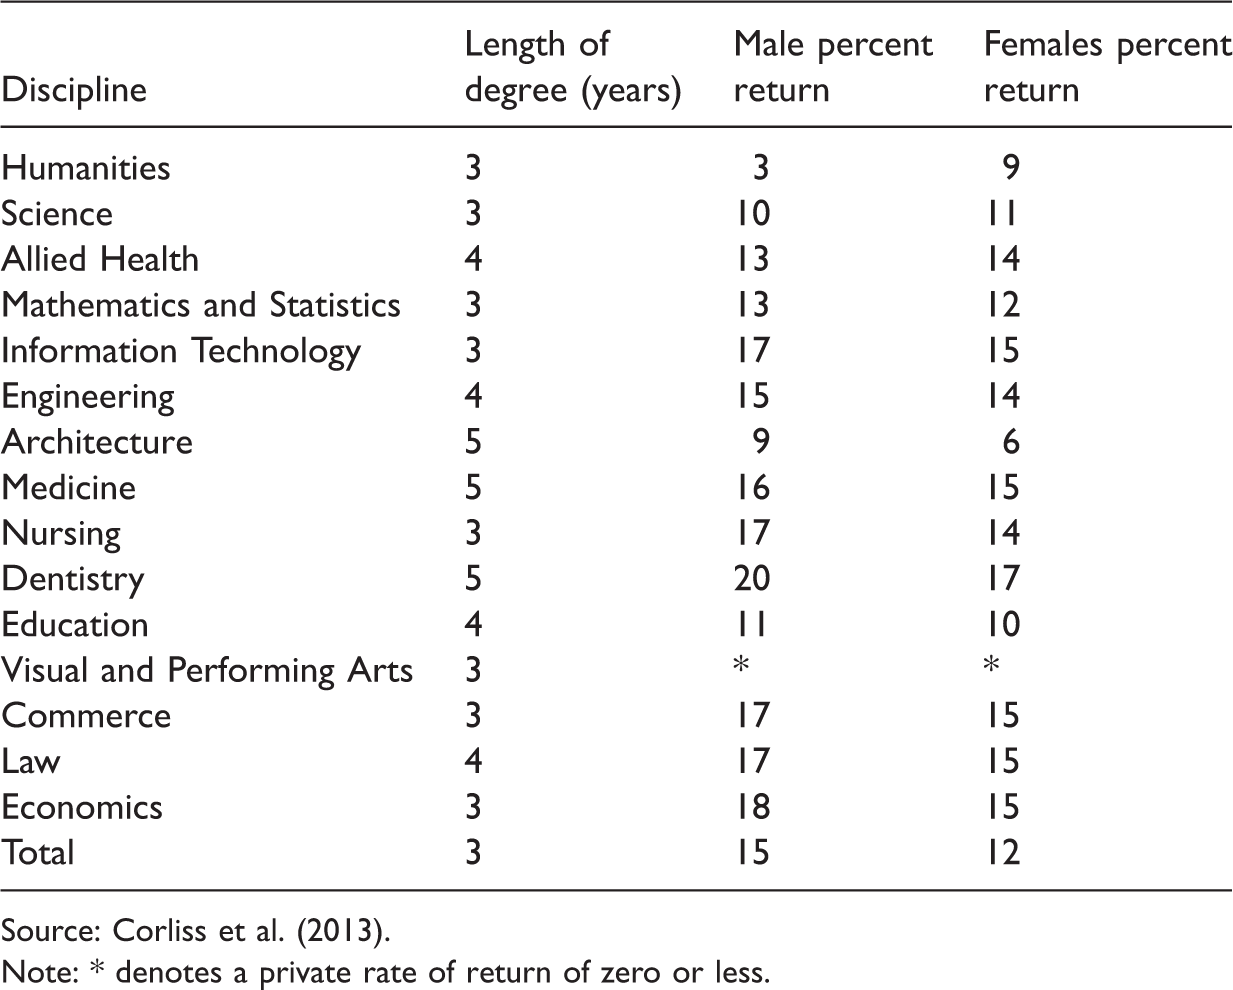
Source: Corliss et al. (2013).
Note: * denotes a private rate of return of zero or less.
Table 3 shows quite clearly a substantial incentive for private individuals to attain a Bachelor degree in most disciplines and that the private rate of return for the different fields of study varies. It also shows that there are important differences in rates of return according to gender. The highest rates of return for men were in Dentistry, Nursing, Commerce, Law, Economics and Information Technology. For women the highest rates of return were in Dentistry, Medicine, Commerce, Law, Economics and Information Technology. The lowest rates of return for both males and females were in the Visual and Performing Arts (negative rate of return), Humanities and Architecture. In most cases but not all, the private rates of return were slightly higher for males than for females, most notably in Dentistry and Nursing. On the other hand, females with a Humanities qualification received a private rate of return of 9% compared to 3% for their male counterparts.
An additional year of study
Private rates of return for bachelor degrees with an additional year of study.
Note: * denotes a private rate of return of zero or less.
The overall effect is to lower the private rate of return, in some cases quite considerably, for both men and women. The most affected Bachelor degrees are Nursing and Dentistry for men and Nursing, Commerce, Economics and Information Technology for women. In contrast the degrees least affected by an additional year appear to be the Humanities, Science and Architecture for men and the Humanities and Architecture degrees for women.
Students working part-time paying HECS upon completion
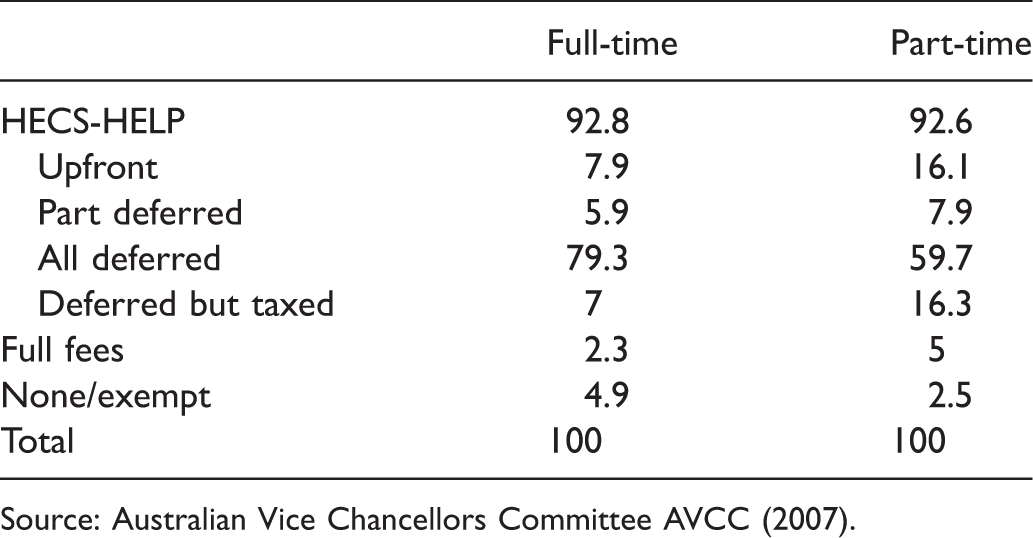
Students will often work part-time and study full time during the course of their studies. A survey by McInnes et al. (2000) found that students work an average of 15 hours a week and earn $18 an hour over a year. This can be incorporated into the analysis to estimate more realistically the private rate of return for the various Bachelor fields of study. This assumption has been made for all the degree programs that were not laboratory based as suggested by McInnes et al. (2000), i.e. humanities, education, social sciences, economics, law, business but not engineering, science, medicine, dentistry. In these laboratory-based disciplines, students spend more time in class work which mitigates against part-time work. Furthermore, many (possibly most) students do not pay HECS upfront, but instead choose to pay after they completed their study.
Course fees, undergraduate Higher Education Contribution Scheme (HECS) payment, all students, 2006, percent.
Private rates of return for bachelor degrees studying full time, working part time and paying HECS on completion of study.
Under these assumptions the estimates show a considerable incentive in all fields of study to attain a Bachelor degree even in the Humanities and Visual and Performing Arts. The most notable results are Economics, Commerce and Information Technology for males and Economics and Commerce for females. For many of the fields of study, application of these assumptions improves the private rate of return from the base case substantially. In Architecture, for instance, the rate of return increases from 8 to 23% for males and from 5 to 21% for females.
The bottom 20% paying HECS upon completion
Net present value of bachelor degrees 20th percentile earnings HECS paid on completion of study for different real interest rates.
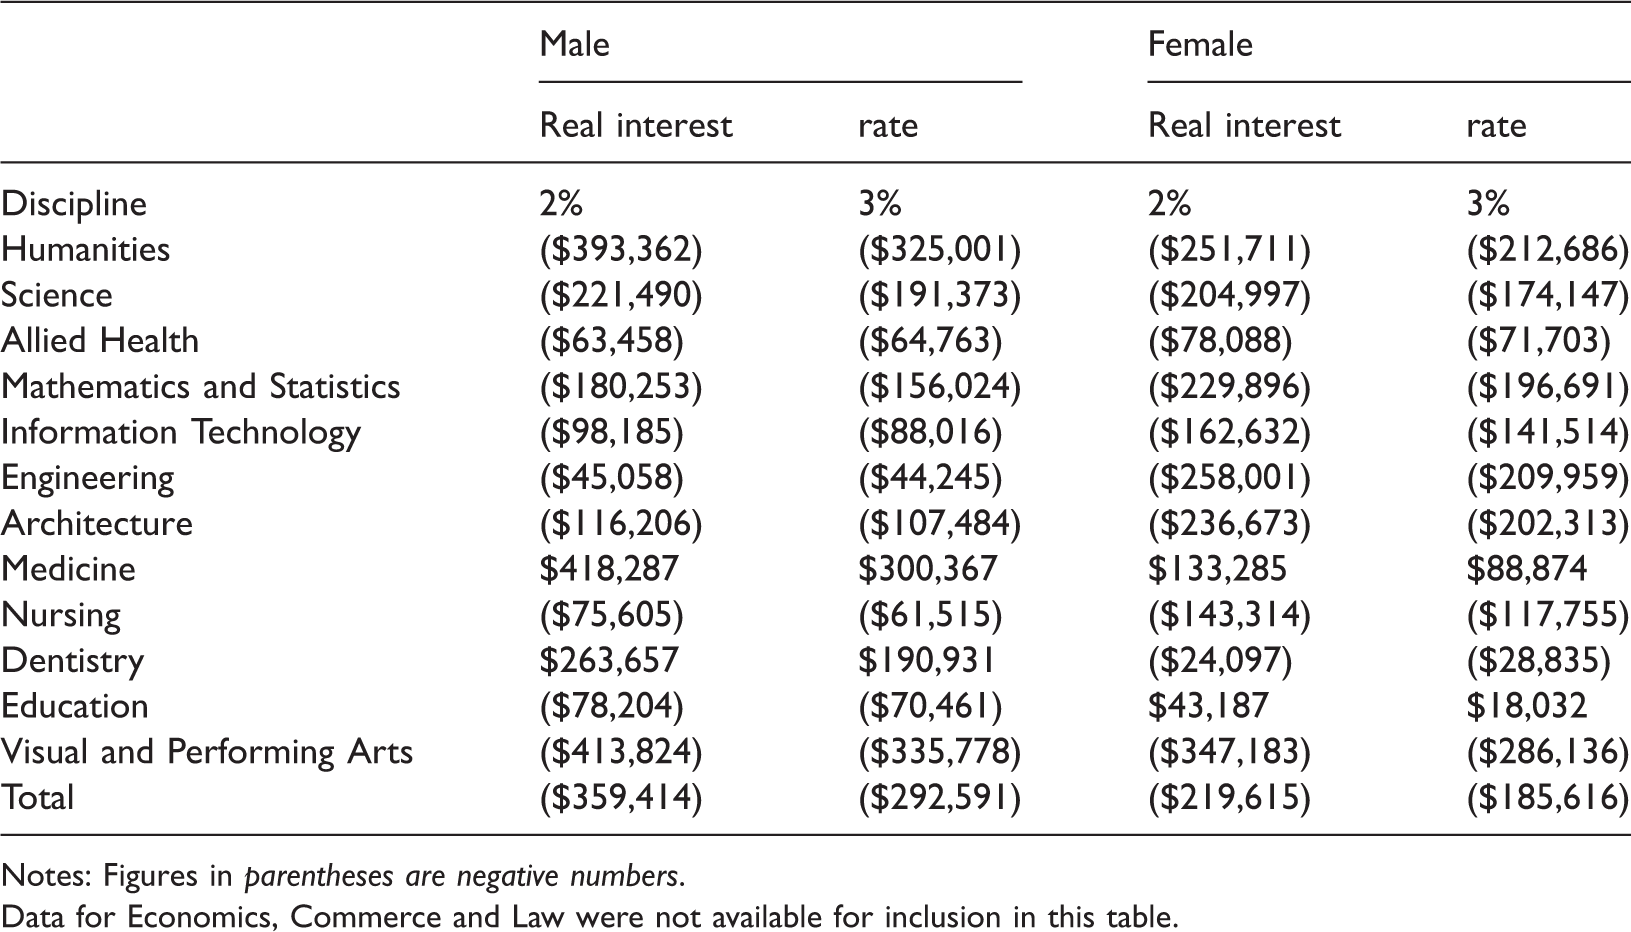
Notes: Figures in parentheses are negative numbers.
Data for Economics, Commerce and Law were not available for inclusion in this table.
The results show that delaying the repayment of HECS reduces the losses faced by the bottom 20% of income earners compared to paying HECS upfront, even with the discount of 20% which the upfront payment attracts. The reduction in the size of the losses is generally in the order of 2–4%. With this change in the assumptions, only a couple of fields of study are found to be worthwhile for low income earners, namely Medicine, for both men and women, Dentistry for men and Education for women.
It is interesting to note from the income data that the worst paid mostly pay back HECS; that is, their incomes are above the threshold for repayment of HECS for sufficiently long periods to repay their debt. The exception are graduates in the Humanities and the Visual and Performing Arts where low income earners do not earn enough to reach the HECS threshold.
Conclusion and policy implications
This article presents some initial calculations of the rate of return to Bachelor degrees in Australia. The results show that these are profitable investments for individuals, providing a rate of return which is above the real rate of interest. Various assumptions have been adopted in order to provide a sensitivity analysis of the robustness of these estimates.
While returns to university education are generally high, large differences can be observed between disciplines. For instance, the rates of return to a Bachelor degree are particularly large in some fields of study, notably Dentistry, Medicine and Information Technology. In contrast, the results show that the completion of a Visual and Performing Arts degree is not a good financial investment for either men or women. Moreover, not all students receive considerable benefits from obtaining a university degree. For instance, many of the lowest paid university graduates would have been better off if they had finished their education at year 12 and entered full-time employment, assuming, of course, that full-time employment was available.
The ranking of the returns by discipline of study changes according to the assumptions used in the calculations. The ability to work part-time while studying substantially increases the rate of return. A comparison of the results in Table 3, where no paid work is assumed to be undertaken during study and Table 6, where part-time work while studying is assumed, shows only a small increase in the rate of return for Dentistry and Medicine where there are limited opportunities for part-time work while studying but substantially raises the returns on Commerce and Information Technology.
Students in different degree programs pay differing proportions of the costs of their education although the actual cost of providing higher education is difficult to determine because of the joint production of both teaching and research in universities. The scope to shift more of the costs of a degree onto the students varies between fields as in some areas, such as business and law, students are already paying a high proportion of the estimated costs.
The results show that under the current system an undergraduate degree provides a substantial private return to the average student and suggests scope to raise fees to students. However, this varies between fields of study. It raises the question as to whether the social return might differ from the private return for those degrees with a low private return in a way that justifies a continuing subsidy to these degrees. These social rates of return have not been calculated here and these reported results make no adjustment for any externalities that are created by the higher education system. While education is often used as an example of a positive externality, only few empirical estimates of the size of this effect are available (see, for example, Organisation for Economic Cooperation and Development, 2011).
The results presented here show that low earning graduates would have been better off not attending university if they instead had earned the median income for high school graduates. It is not possible to say from the census data whether or not these graduates were the marginal entrants with low university entry scores or not. Therefore, it is not possible to draw definitive conclusions about the likely effects of an expansion of the university sector for the welfare of the marginal entrants to the sector. However, the results do suggest a need for caution in encouraging a larger proportion of year 12 completers into university study especially where good employment opportunities exist for apprentice-trained skilled workers.
The estimates show that the private rate of return to women is below that for men for most degrees but there are a number of reasons why these results should be treated with caution. The estimates are based on the assumption of no change in the patterns of labour force attachment between cohorts but there is evidence that younger women return to work after having children sooner than did older cohorts. The lower rates of return suggest possible long-term implications for career development as a consequence of taking time out of the workforce which results in lower earnings for women. As the data used in these calculations are cross-sectional in kind, it is not possible to establish the working history of individuals to undertake the average calculation. Therefore, this area requires further research. Although this study does provide some estimates to highlight this issue, the evidence presented in this article is insufficient to argue for a differential HECS rate according to gender.
The main arguments for government intervention in the financing of higher education relate to equity issues. Access to education is an important way of promoting inter-generational mobility. Limited access to funds and lack of information about the potential benefits of higher education are likely to deter potential students from disadvantaged socioeconomic backgrounds. The implications of any changes in the financing of higher education for access for these potential students are therefore important. An income contingent loan reduces the risks of starting a degree for students from disadvantaged backgrounds but as a high proportion of the new debt is not expected to be repaid—18% according to DIICCSRTE estimates (2013)—the scheme adds substantial costs to the federal budget.
This article has focused on the narrow monetary costs and benefits of attending university. In addition, nonmonetary consumption costs and benefits, which may be significant, may influence the decision to undertake university education. Results presented in this article offer a basis for further research that might be aimed at integrating monetary and nonmonetary costs and benefits of attending university.
Footnotes
Funding
This research was partially funded by the then Department of Employment Education and Workplace Relations (DEEWR).
Declaration of conflicting interests
None declared.