
Abstract
Urban Indigenous students’ school attendance and factors contributing to annual attendance rates are relatively unknown, and yet almost 80% of the Indigenous population resides in non-remote regions. Our longitudinal study evaluated an urban primary school where Indigenous families preferentially enrolled their children because they recognised it supported their children in ways that celebrated Indigenous culture and ameliorated school-related symptoms of poverty. Indigenous students’ attendance influences appeared in phases: Indigenous status, poverty, and family characteristics, until significant influences for attendance were exhausted. While Indigenous students’ mean attendance rates were bounded between 80% and 90%, and below non-Indigenous peers’ attendance in each year, slight improvement occurred, even as poverty universally pervaded the Indigenous community. As poverty among non-Indigenous students increased, their mean attendance also declined below the 90% national benchmark.
Keywords
Introduction
Australian Indigenous 1 education policy has focused on ‘closing the gap’ for educational outcomes over the past decade. The Closing the Gap report card (Australian Government, 2017) indicates most targets have remained static since 2014 and the target to ‘close the gap in school attendance by 2018 is not on track’ (Australian Government, Department of Prime Minister and Cabinet, 2018, p. 9), which suggests different approaches are required to meet attendance aspirations. Indigenous students’ attendance rates vary across Australia according to geographical location (Australian Government, 2017; Northern Territory Government, Department of Education, 2017). Schools in remote and very remote regions, comprising mainly Indigenous students, achieve lower rates of attendance (and school retention) than most other Australian schools (Australian Government, 2015; Silburn, McKenzie, Guthridge, Li, & Li, 2014). While fortunate to be living ‘on Country’ 2 , geographically remote Indigenous students experience particular educational barriers: proximity to schools, curriculum relevance, learning English as a second or other language, family and early-life health issues and lack of school to employment pathways (Guenther, 2015; Hughes & Hughes, 2012; Osborne, 2013; Silburn et al., 2014). Indigenous students living in remote localities’ low levels of attendance and barriers to higher levels of attendance have been established (Australian Government, 2015; Guenther, 2013; Hughes & Hughes, 2009; Zubrick et al., 2006).
With the exception of three studies (Baxter & Meyers, 2016; Briggs, 2016; Mander-Ross, 1995) we know little about school attendance for Indigenous students living in urban areas. This is important because almost 80% of Australia’s Indigenous population now live in regional and metropolitan areas (Australian Government, 2017), while Eastern Australian centres provided destinations of choice for many. For example, 48,000 Indigenous people live in Victoria (Australian Bureau of Statistics, 2017a). Their number comprises historical inhabitants from aeons past, historical and recent migrations, and forced relocations to live on missions and reserves.
The generations of children removed in this way are known as the Stolen Generation. A higher proportion of Victoria’s Indigenous population has been directly affected by the forcible removal from their families than Indigenous people from other states and territories (Stolen Generation Victoria Ltd, 2008; Victorian Department of Planning and Community Development, 2012). As a result of being removed from their families, they carry significant trauma and disadvantage that continues across generations (Atkinson, 2002) that carries the likelihood to influence attendance and primary school education of Indigenous students (Australian Government, 2017). With more Indigenous people living in urban Australia than ever, at no time has an understanding of Indigenous student attendance in urban centres represented a more pressing need.
Strengthening Indigenous students’ attendance rates represents one solution to increase students’ retention in formal education and their aspirations for overcoming poverty and disadvantage (State Government of Victoria, Department of Education and Early Childhood Development, 2014; State of Victoria, Department of Education and Training, 2016). Frequent and regular school attendance creates opportunities for engagement in learning and maximises exposure to learning experiences. Indigenous students remain an educationally vulnerable subset of the student population with two out of every five students in grade three achieving below the minimum reading standard, increasing to one out of every two students in grade five (Tarbetsky, Collie, & Martin, 2016). High attendance at primary school increases students’ learning opportunities that logically provide strong academic foundations for secondary school learning (Hancock, Shepherd, Lawrence, & Zubrick, 2013).
Between early childhood education and secondary school education, primary school garners limited research. However, primary school may prove a critical turning point for improving Indigenous students’ attendance rates. Exploration of Indigenous students’ primary school experience, and in particular their attendance, has gained little research attention (Australian Government, Productivity Commission, 2016; Daraganova, 2012; Daraganova, Mullen, & Edwards, 2014). Attendance patterns formed in the primary school years are important (State Government of Victoria, Department of Education and Early Childhood Development, 2012) because early attendance patterns become habits that students carry into later school years (McLaughlin & Peace, 2008). Baxter and Meyers (2016) reported that declines in Indigenous students’ attendance begin in the later years of primary school, a pattern that continues and intensifies in secondary school (Hancock et al., 2013; Ministerial Council for Education Early Childhood Development and Youth Affairs, 2011).
Shepherd and Zubrick (2012) emphasise the importance of nurturing children in the early years of life to overcome the worst effects of disadvantage because childhood ‘represents a critical period where skills are acquired and accumulated for benefit throughout the lifecourse’ (p. 81). Frequent and regular school attendance throughout primary school has been generally accepted as the way to accrue necessary learning for later years. Yet, it has also been found the relationship between regular attendance and learning does not always hold in remote schools (Guenther, Disbray, & Osborne, 2014; Ladwig & Luke, 2014). Hence, further research is required to investigate ways to strengthen Indigenous students’ attendance at primary school in order to increase learning opportunities and to prevent attendance declines as students’ transition to secondary school. In this study, longitudinal data from one urban primary school are used to examine Indigenous students’ attendance patterns and explore potential factors related to Indigenous students’ attendance.
Methodology
Study site
Watney 3 , an urban Victorian primary school, serves a disadvantaged school community (Australian Curriculum Assessment and Reporting Authority [ACARA], 2012, 2017a) within a disadvantaged area (Australian Bureau of Statistics, 2013a) and local school neighbourhood (Pope, 2011). Forty-one percent of the entire student population lived in households where the primary caregiver was not in paid work. For students with a second caregiver (58.5%), almost two-thirds had employed second caregivers. Unemployment was more pervasive in the Indigenous students’ primary caregiver population (74%) than the non-Indigenous population. Fewer Indigenous students had a second caregiver (42%) compared to non-Indigenous students, and less than one-third were employed.
Watney also educates a disproportionately large Indigenous student population, according to census data for the local area (Australian Bureau of Statistics, 2017b). Between 2005 and 2015, Indigenous student enrolments averaged 22% of Watney’s school population each year, peaking in 2010 at almost 25%, then declining by 11.4% over the following years. From 2010 onwards, the non-Indigenous student population also declined (3%).
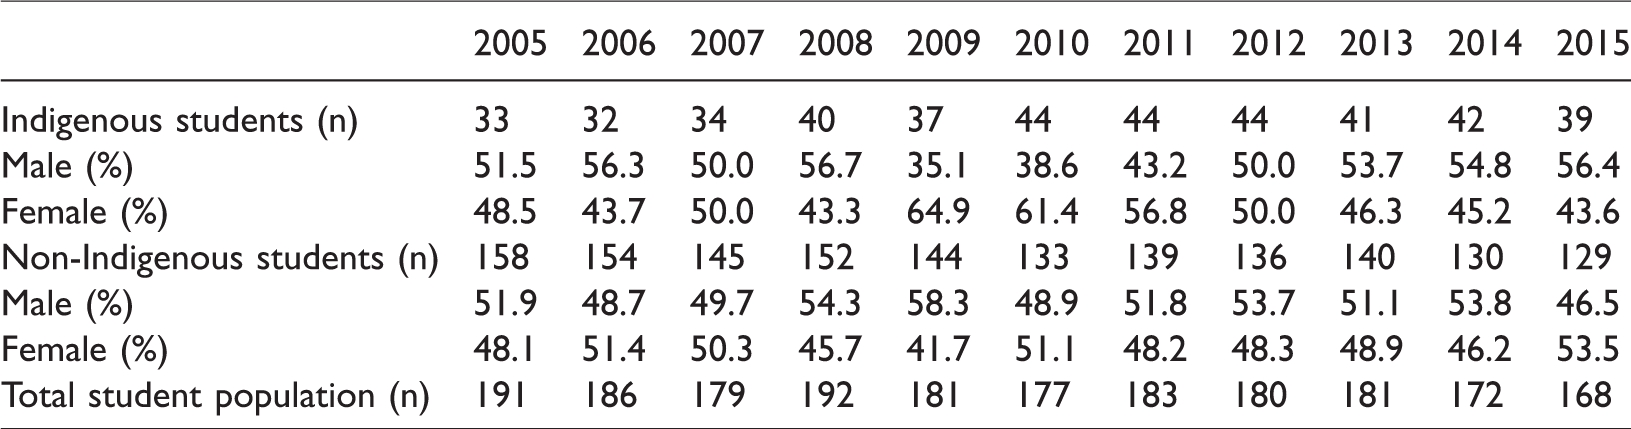
Between 2010 and 2015, census data show an 11.4% reduction of potential students (people < 15 years of age) living in Watney’s catchment (Australian Bureau of Statistics, 2017a). Over the study period, Watney’s entire student population declined by 12%, although attribution for the decline was different for each student cohort. While the Indigenous student cohort showed a population increase, the non-Indigenous student population declined by 18.4% over the study period (Table 1).
Student population at Watney with Indigeneity and gender, for the academic years 2005–2015.
Watney employs an Indigenous Worker because the size of the Indigenous population warrants it. The Indigenous Worker has strong connections with the Indigenous school community. The role includes supporting Indigenous students and their families, monitoring students’ attendance and disseminating cultural support to school staff. According to the Indigenous Worker (personal communication, October 2015), only one Indigenous family were descendants of the traditional owners of the land on which the school is situated and many were descendants of the Stolen Generation, like many Victorian Indigenous families (Stolen Generation Victoria Ltd, 2008).
Data
Our study featured the student data for urban primary school students’ attendance rates and potential factors related to attendance. A total of 160 Indigenous students were included in the 11 years of data which were analysed. Between 32 and 44 Indigenous students were enrolled at Watney in each academic year (Table 1). Each student was represented in at least one and up to eight academic years. Across the study years, the average Indigenous proportion of the school’s student population was greater than or equal to 22%, an over-representation when compared with Victoria’s Indigenous population which comprises less than 1% of the population (Australian Bureau of Statistics, 2017b). Among Watney’s Indigenous – and non-Indigenous – students, the number of male and female students was evenly balanced in most years (Table 1).
Eleven complete academic years of de-identified attendance data (2005–2015) were collected that included attendance data for each student period of enrolment. Available attendance data were recorded variously as half-day or whole-day absences for each academic year. Absences were then calculated as whole-day absences for consistency. The number of days students are required at school varies across academic years. Calculation of data in this way enhanced our analysis because the number of days students are required at school varies between schools and across academic years and we used the exact number of days for each academic year. We report students’ attendance rather than absence in recognition of Indigenous students’ (and their families’) best endeavours to be at school. The annual attendance rate was calculated as: 1 – whole-day absences/student days for year × 100. We included all students in the sample, including those enrolled for part of a year, calculating the required school days for each student (taking pupil-free days etc. into account) in each school year. We also calculated each student’s attendance across their entire enrolment to produce an overall attendance rate to compare individual students and factors related to attendance – student-level analysis. Attendance rate for enrolment was calculated in a similar way to annual attendance: 1 – whole-day absences during enrolment period/student days of enrolment × 100.
Students’ attendance data were linked with a unique identifier to the enrolment data recorded in the school’s administrative database. The school collects student data on enrolment, which it updates when student circumstances change. We used de-identified student information collected as part of a federally mandated data collection that included:
Indigenous status
Caregivers’ education; post school qualification; occupation status 4 ; Education Maintenance Allowance (EMA) eligibility 5 and their relationship to the student
Students’ gender; integration status 6 ; repeating the preparatory year (i.e. ‘prep’, the year prior to Year 1); and whether students lived in one or two caregiver families
The dataset was cleaned and validated to remove duplicate entries and ensure completeness of records. Reasons for absence had been recorded inconsistently and were therefore not included in the data analysed in this study.
Students were grouped into Indigenous and non-Indigenous cohorts, to enable a comparison of attendance rates and an investigation of potential factors related to Indigenous students’ attendance. Non-Indigenous student results were included as a comparison with the results for Indigenous students.
Preliminary data analysis, including frequencies and descriptive statistics, were conducted in SPSS (IBM Corp, 2012). Where potential factors related to student attendance had two groups only – EMA eligibility, gender, integration status, repetition of the preparatory year and number of caregivers in the home – Independent Samples t-tests were employed to investigate differences. Where potential factors had more than two groups – caregivers’ education, post school qualification, occupations band, and relationship to students – analyses of variance (ANOVAs) were used in the analysis of attendance for each academic year. The effect of Indigenous status on attendance was also examined using the whole student population in each year.
While Independent samples t-tests and ANOVAs were used to examine the effect of each factor on student attendance in isolation, the study also sought to ascertain which factors – when analysed together with other potential factors – had the strongest effect on Indigenous students’ attendance. To this end, General Linear Modelling (GLM); (IBM Corp, 2012) was used as it protects against Type I errors through simultaneous analysis of multiple variables and covariates on one dependent variable. In this way, GLM analyses were used to examine the significance of the various factors on Indigenous students’ attendance in each academic year. Similarly, GLM analyses were used to examine the effect of Indigenous status on student attendance as one factor among others in each academic year.
Results
Over the 11 study years, the student population changed as students moved through the school – enrolling, graduating and transferring out of Watney. The school demographic – student and family characteristics 7 , changed over time as students enrolled, transferred and graduated from the school. From 2005 to 2015, single caregiver families at Watney increased to constitute almost 45% of the student population, bolstered by the change for Indigenous students, who went from almost half with single caregivers to 69% of the cohort. During the same period, Watney’s employed primary caregivers decreased by 36.6%, leaving almost half the school population dependent on government welfare. In 2005, a higher proportion of Indigenous students’ families were reliant on welfare (57.6%) than non-Indigenous families (23.4%). We also note, in 2012 the non-remote Indigenous employment rate was 56.9% (Australian Bureau of Statistics, 2013b) and the most recent National Aboriginal and Torres Strait Islander Social Survey reports a lower employment rate of 49%, suggesting employment rates for non-remote Indigenous people are declining (Australian Bureau of Statistics, 2016). Between 2005 and 2015, welfare dependency doubled in Watney’s Indigenous and non-Indigenous student cohorts. However, in every year, a lower proportion of Indigenous students, compared to non-Indigenous students were living in households with an employed caregiver.
Annual attendance rates associated with student and family characteristics
Mean attendance rates
The mean attendance rates for Indigenous students between 2005 and 2015 ranged from 80% to 90% (Table 2). Indigenous students’ attendance varied by up to 9.1 percentage points between years.
Mean, maximum and minimum attendance rates for Watney’s Indigenous and non-Indigenous students for the years 2005–2015.
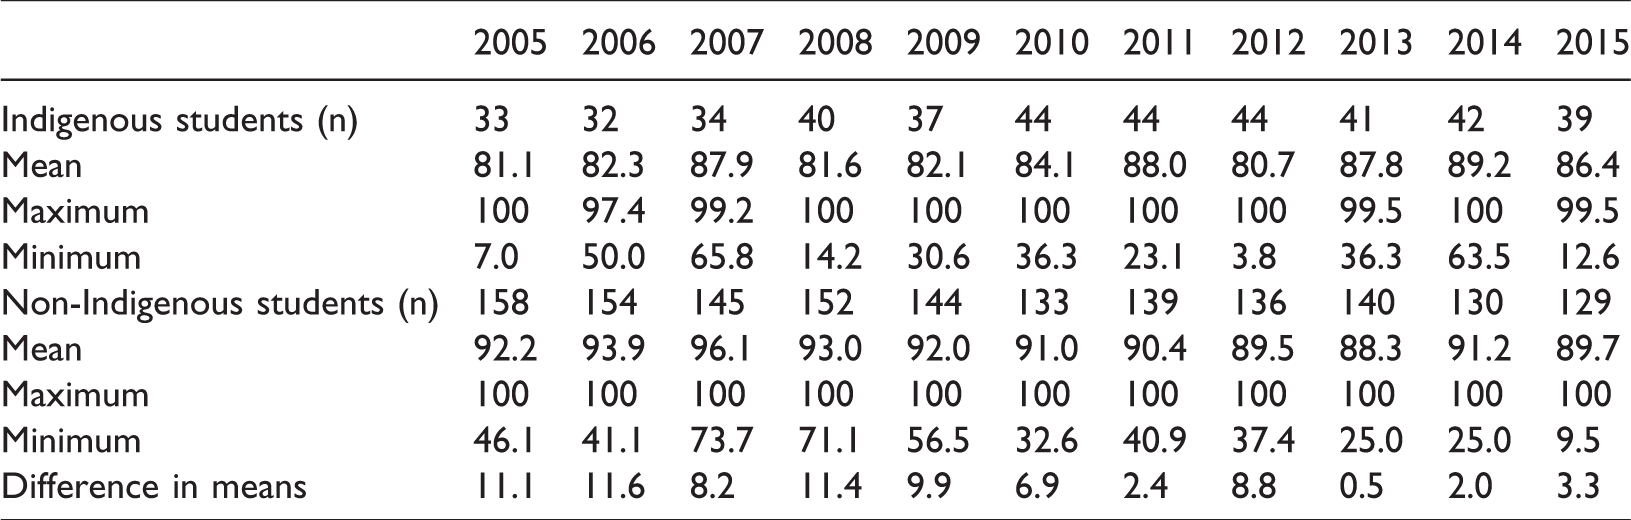
Non-Indigenous students’ mean attendance remained around the 90% national attendance benchmark (ACARA, 2017b), with less variation than their Indigenous peers (7.8 percentage points) (Table 2). Non-Indigenous students’ mean attendance increased from 2005 to 2007 (96.1%) and progressively declined until 2013 (88.3%). In 2014, mean attendance increased by 2.9 percentage points, followed by a decline in 2015 (89.7%). Low mean attendance occurred for both student cohorts in 2008 and 2012. Indigenous students’ three mean attendance peaks in 2007, 2011 and 2014 were only shared with non-Indigenous peers in two years (2007 and 2014).
Maximum and minimum attendance
In each year, at least one non-Indigenous student achieved 100% attendance (Figure 2), while the less numerous Indigenous students were unable to achieve 100% attendance consistently (Figure 1), missing 100% attendance by less than 1% in three years (2007, 2013 and 2015) and by less than 3% in 2005.
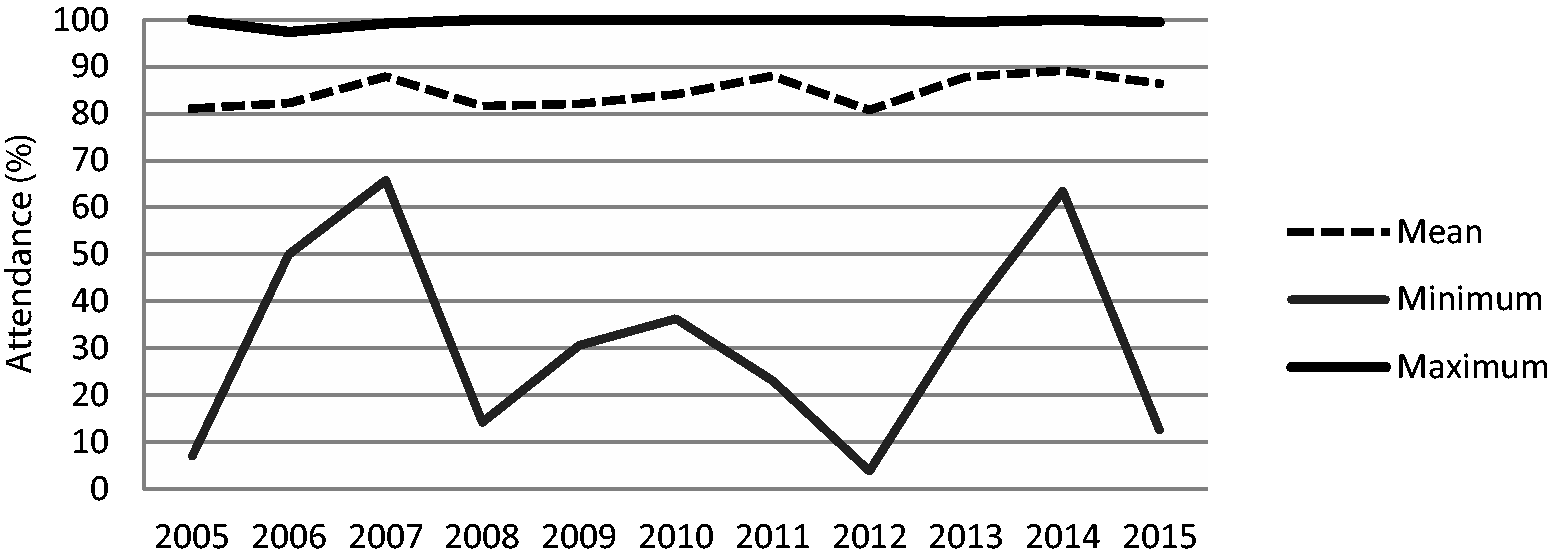
Watney’s Indigenous students’ mean, minimum and maximum annual attendance rates (%) for the school years 2005–2015.
Minimum attendance rates varied widely between student cohorts (Figures 1 and 2). In 2007, the minimum attendance for Indigenous students’ (68.5%), and non-Indigenous students (73.7%) was higher than other years. For many of those years, the lowest attending student in each group recorded very low attendance.
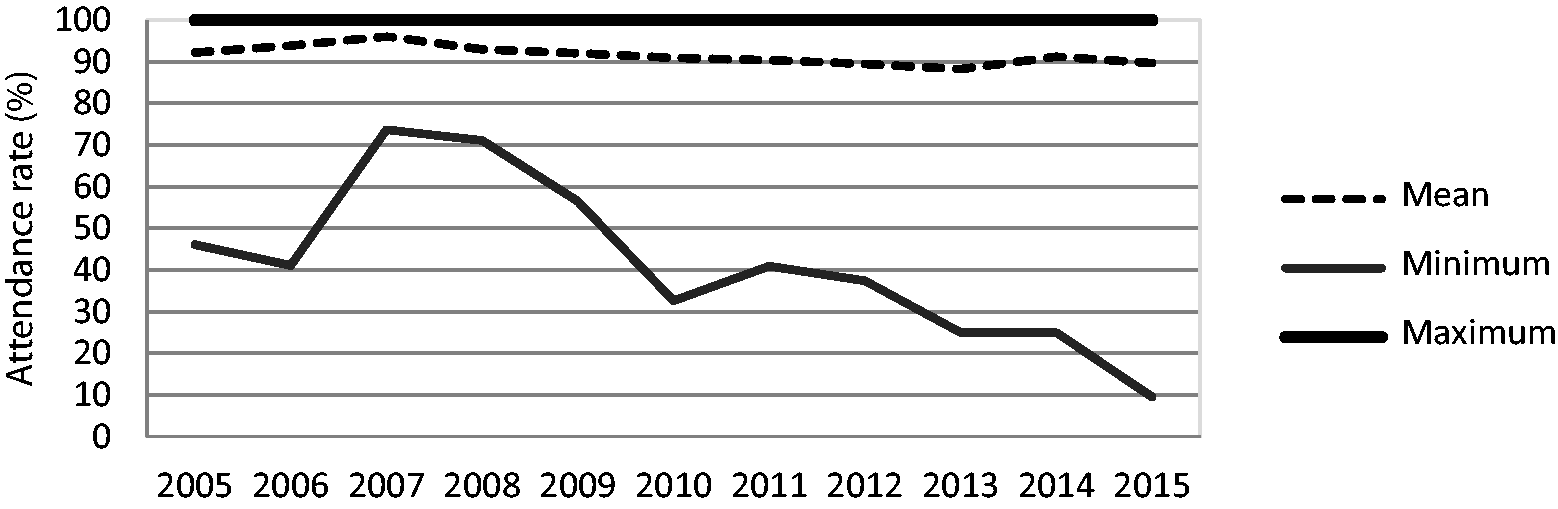
Watney’s non-Indigenous students’ mean, minimum and maximum attendance rates (%) for the school years 2005–2015.
For six years, one Indigenous student recorded Watney’s lowest attendance. An integration-funded Indigenous student, enrolled for 73 days, had the lowest attendance rate in 2012 (3.8%). The lowest attendance rates for Indigenous students in other years occurred when a student enrolled for 14 days (7%), a student enrolled only in one year (12.6%) and a student enrolled for 53 days (14.2%).
Indigenous students recorded lower mean attendance than their non-Indigenous peers in every study year (Figures 1 and 2). Differences in cohorts’ mean attendance rates each year varied between 0.5 and 11.6 percentage points, with the greatest differences occurring between 2005 and 2009 (Figure 3). From 2011, mean attendance rate differences remained less than 3.3 percentage points with the exception of 2012 (8.8 percentage points). In 2012, both cohorts showed low mean attendance – Indigenous students’ lowest attendance (80.7%) and non-Indigenous students’ second lowest attendance (89.5%). Results of an Independent Samples t-test (Table 3) indicated that Indigeneity was significantly associated with lower mean attendance rates from 2005 to 2010 (p < 0.010) and again in 2012 (p = 0.012).
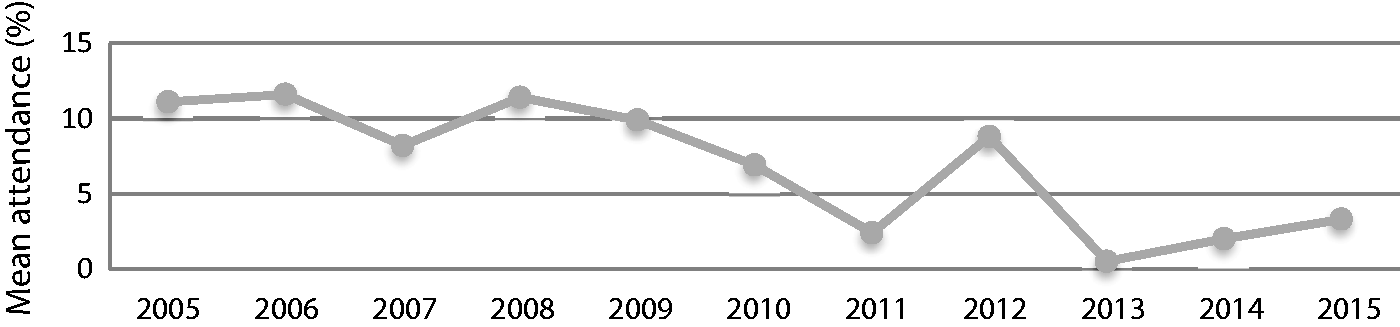
Mean attendance differences (%) between Indigenous and non-Indigenous students at Watney for the 2005–2015 school years.
Association of Indigeneity with Watney’s students’ mean attendance from 2005 to 2015.
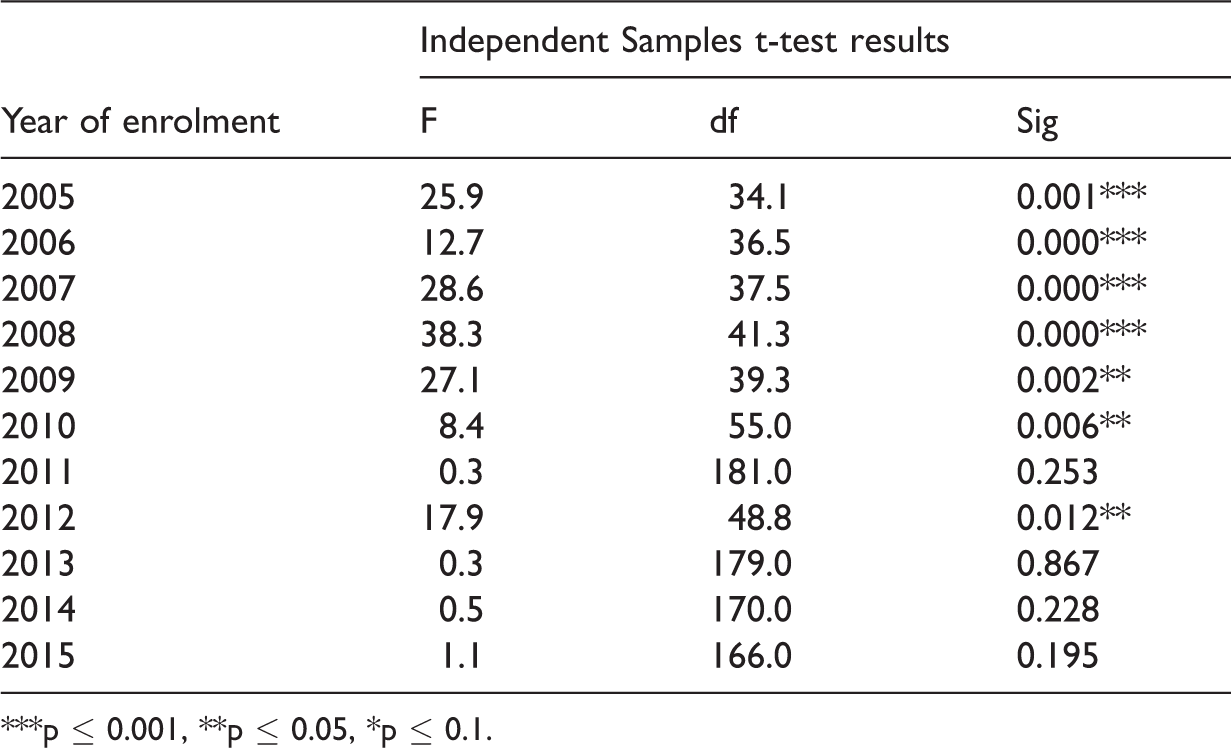
***p ≤ 0.001, **p ≤ 0.05, *p ≤ 0.1.
Factors associated with annual student attendance
As an indicator of family affluence, we used students’ families’ eligibility for Education Maintenance Allowance (EMA), a government financial support for essential school items. While approximately 9 in 10 Indigenous students were eligible for EMA, around half of the non-Indigenous student population at the school was eligible. Whether in receipt or not of EMA, attendance rates among Indigenous students were similar. This finding also held true for non-Indigenous students.
We analysed two other student characteristics, namely Indigenous students’ integration status, which identifies students requiring additional learning support and age of commencement of primary school. Results of the analyses indicated no significant relationship between the integration status of Indigenous students and attendance (p > 0.05) in any study year. However, results showed that Indigenous students’ age when commencing primary school was significantly associated with attendance in two years – 2005 (F(19) = 3.0; p = 0.024) and 2013 (F(15) = 5.7; p = 0.000). We interpreted linear associations in scatterplots to suggest students who began school at a young age achieved higher average attendance than those who started at a later point. However, potential variations at grade level may be confounded with analysis at academic year level. Consequently, we make no report of a relationship between students’ age and attendance.
Family factors analysed included whether students lived with one or two caregivers, and the relationship of the caregiver to the student. Comparison of attendance data for Indigenous students with one caregiver and two caregivers revealed no significant differences, except for 2014 (p = 0.010). In this year, twice as many Indigenous students were living with a single caregiver than two caregivers, and their attendance (87.4%) was significantly lower than students with two caregivers (92.7%). Among non-Indigenous students, those living with a single caregiver had lower mean attendance rates than those living with two caregivers in 2008, 2011 and 2012 (p < 0.05). Living with a single caregiver may be associated with non-Indigenous students’ mean attendance, but it has very little influence for Indigenous students.
We also analysed the caregivers’ relationship to the student as a factor in addition to the number of caregivers. The type of caregiver(s) was associated significantly with mean attendance (p = 0.000) only in 2014 (Table 4). In that year, most Indigenous students lived with one parent (60%) or two parents (19%). Students living with one parent recorded the second lowest mean attendance (88.0%), 22 percentage points higher than students living with relatives other than parents or grandparents (66.2%). Those very few students living in out-of-home care recorded the highest mean attendance (97.1%).
Watney’s Indigenous students’ mean attendance rate (%) for the 2014 school year and ANOVA result showing significance for the residential guardian for students’ families.
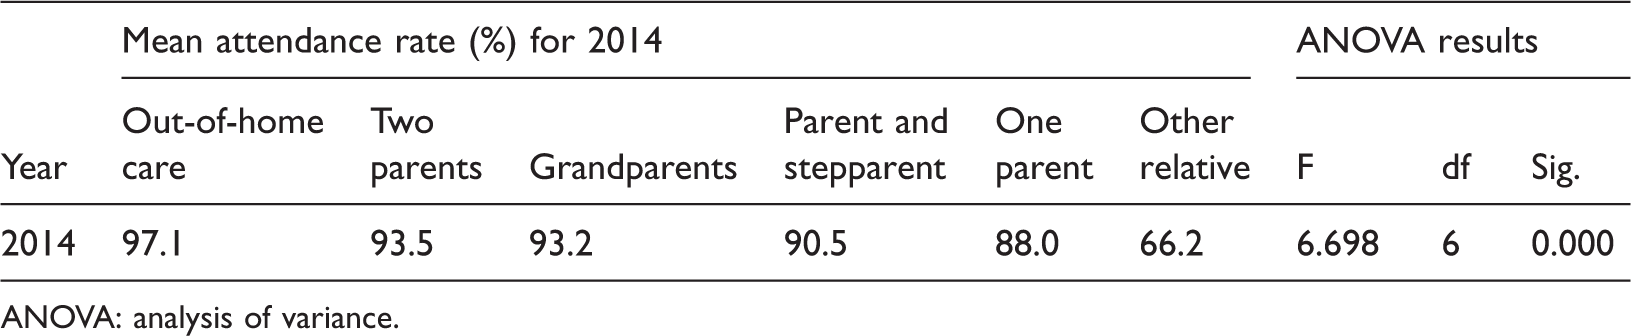
ANOVA: analysis of variance.
No statistically significant differences in the attendance rates of Indigenous students’ emerged depending on the students’ primary caregivers’ education level, post-school qualification or occupation in any of the study years. Nor was the secondary caregivers’ employment level related to student attendance in any study year. In only one year, 2012, did caregivers’ post-school qualifications and occupation types influence attendance rates (p ≤ 0.01) (Table 5). The attendance rate for Indigenous students whose records lacked some caregiver information were included in the analysis since data were available that informed other aspects of the analysis, and missing caregiver data have been associated with low socio-economic circumstances (Daraganova et al., 2014; Hancock, 2017; Hancock et al., 2013). Students with missing caregiver data at Watney exhibited the lowest mean attendance (44.2%). Indigenous students’ mean attendance increased as their secondary caregivers’ qualifications increased from no qualification (82.4%) to diploma qualification (97.1%).
Indigenous students’ mean attendance rates and ANOVA results for secondary caregivers’ post-school qualifications for the 2012 school year.
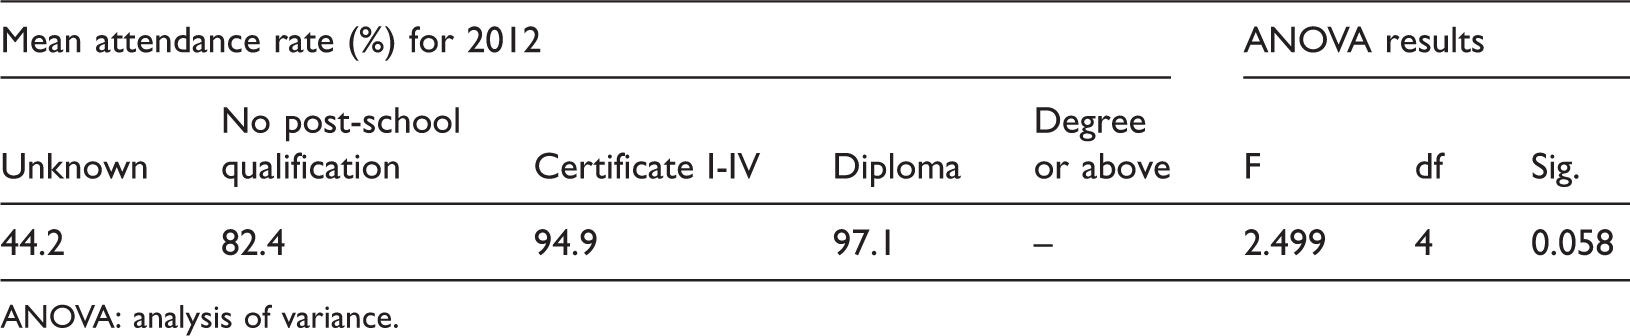
ANOVA: analysis of variance.
Information on caregivers’ occupations (see Note 4), as collected by the school in terms of School Family Occupation (SFO) bands, was also analysed. Occupation group (for the 52.3% of secondary caregivers who were employed) was associated with Indigenous students’ mean attendance only in 2011 (p = 0.027) (Table 6). Most secondary caregivers (61%) were working in low and unskilled occupations, and none were working in a professional capacity. Students with caregivers working in low-skilled occupations had the highest attendance, while the very few students whose parents had a Group B occupation (e.g. business managers, arts/media/sportspersons, associate professionals) recorded the lowest mean attendance.
Indigenous students mean attendance rates for 2011 and ANOVA results by secondary caregivers’ type of occupation.
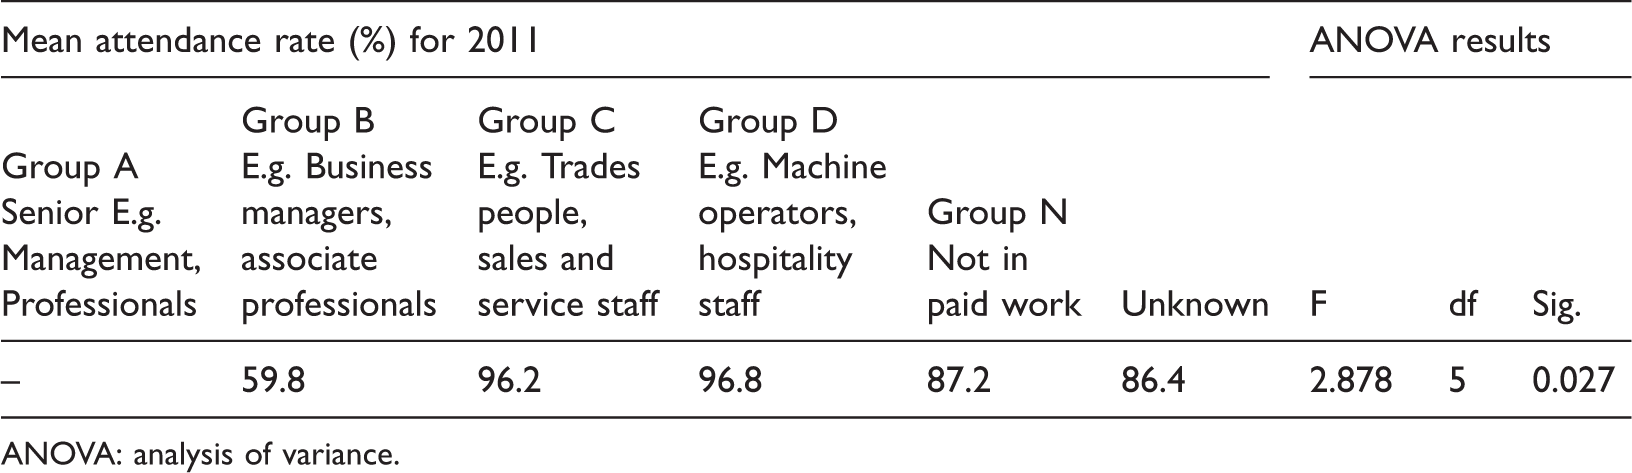
ANOVA: analysis of variance.
Further analysis
To examine which factors were associated with students’ attendance, when analysed together, we analysed the data using GLM, first with attendance of all Watney students as the dependent variable, second with attendance of only Indigenous students at Watney as the outcome variable.
Results of the first GLM analysis showed that Indigenous status was significantly (p = 0.000) associated with Watney’s students’ attendance from 2005 to 2008 (Table 7). The effect of Indigenous status on attendance was smaller in 2009 (p = 0.004) and 2012 represented the last year where Indigenous status showed a significant effect on attendance (p < 0.05).
General Linear Modelling results showing the effect of Indigenous status for students’ annual mean attendance for the school years 2005–2015.
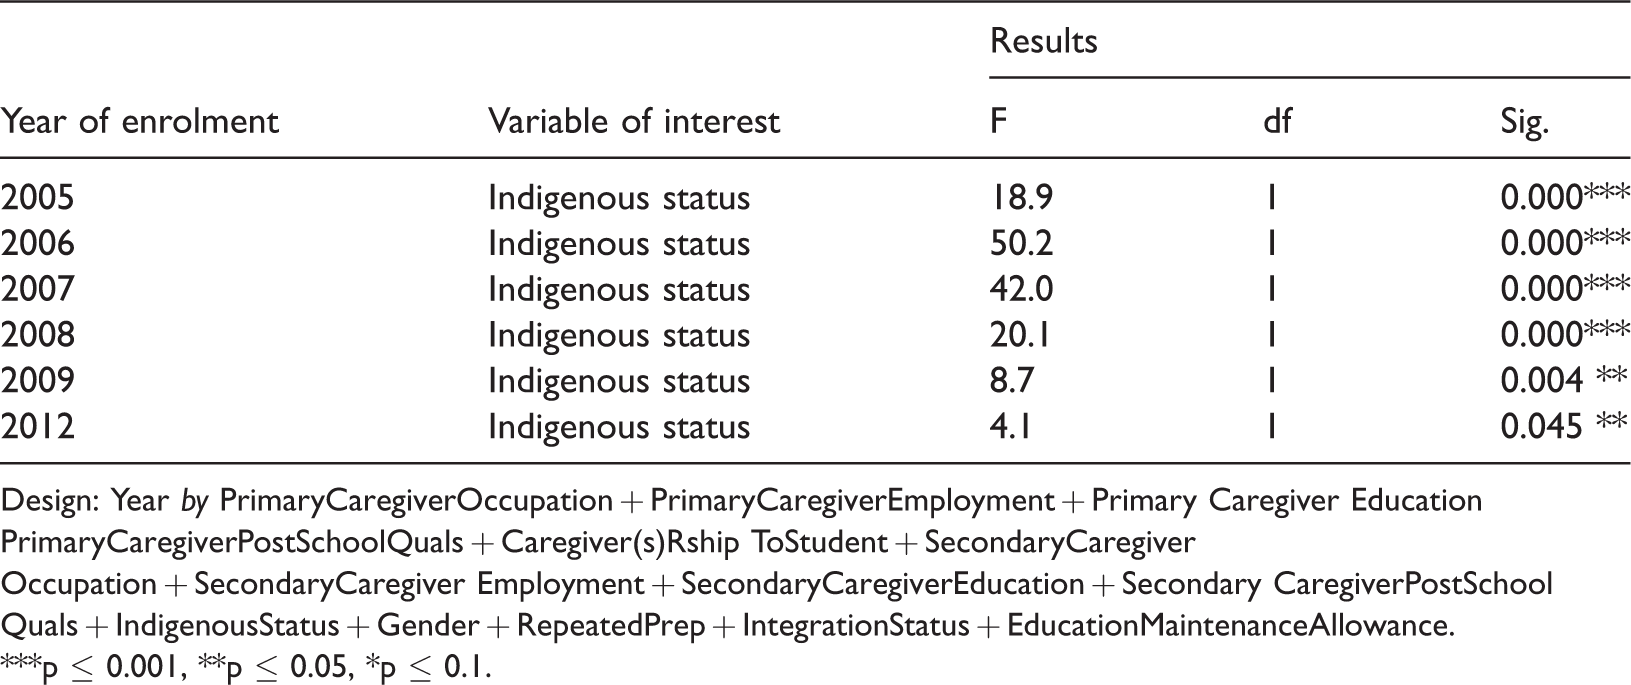
Design: Year by PrimaryCaregiverOccupation + PrimaryCaregiverEmployment + Primary Caregiver Education PrimaryCaregiverPostSchoolQuals + Caregiver(s)Rship ToStudent + SecondaryCaregiver Occupation + SecondaryCaregiver Employment + SecondaryCaregiverEducation + Secondary CaregiverPostSchool Quals + IndigenousStatus + Gender + RepeatedPrep + IntegrationStatus + EducationMaintenanceAllowance.
***p ≤ 0.001, **p ≤ 0.05, *p ≤ 0.1.
Results of the second GLM analysis showed EMA as the variable that was associated with Indigenous students’ mean attendance (p < 0.05) from 2009 to 2011 (Table 8). In addition, 2011 was the only year in which more than two factors emerged as significant: EMA and caregiver(s) relationship to student showed stronger effects followed by primary caregiver’s education level and their eligibility for integration funding. None of the variables included in the analysis was significantly associated with Indigenous students’ attendance in 2013 or 2015. In 2014, caregiver(s) relationship to student was the only factor significantly associated with Indigenous students’ attendance.
General Linear Modelling results showing factors of significance for Indigenous students’ annual mean attendance for the school years 2005–2015.
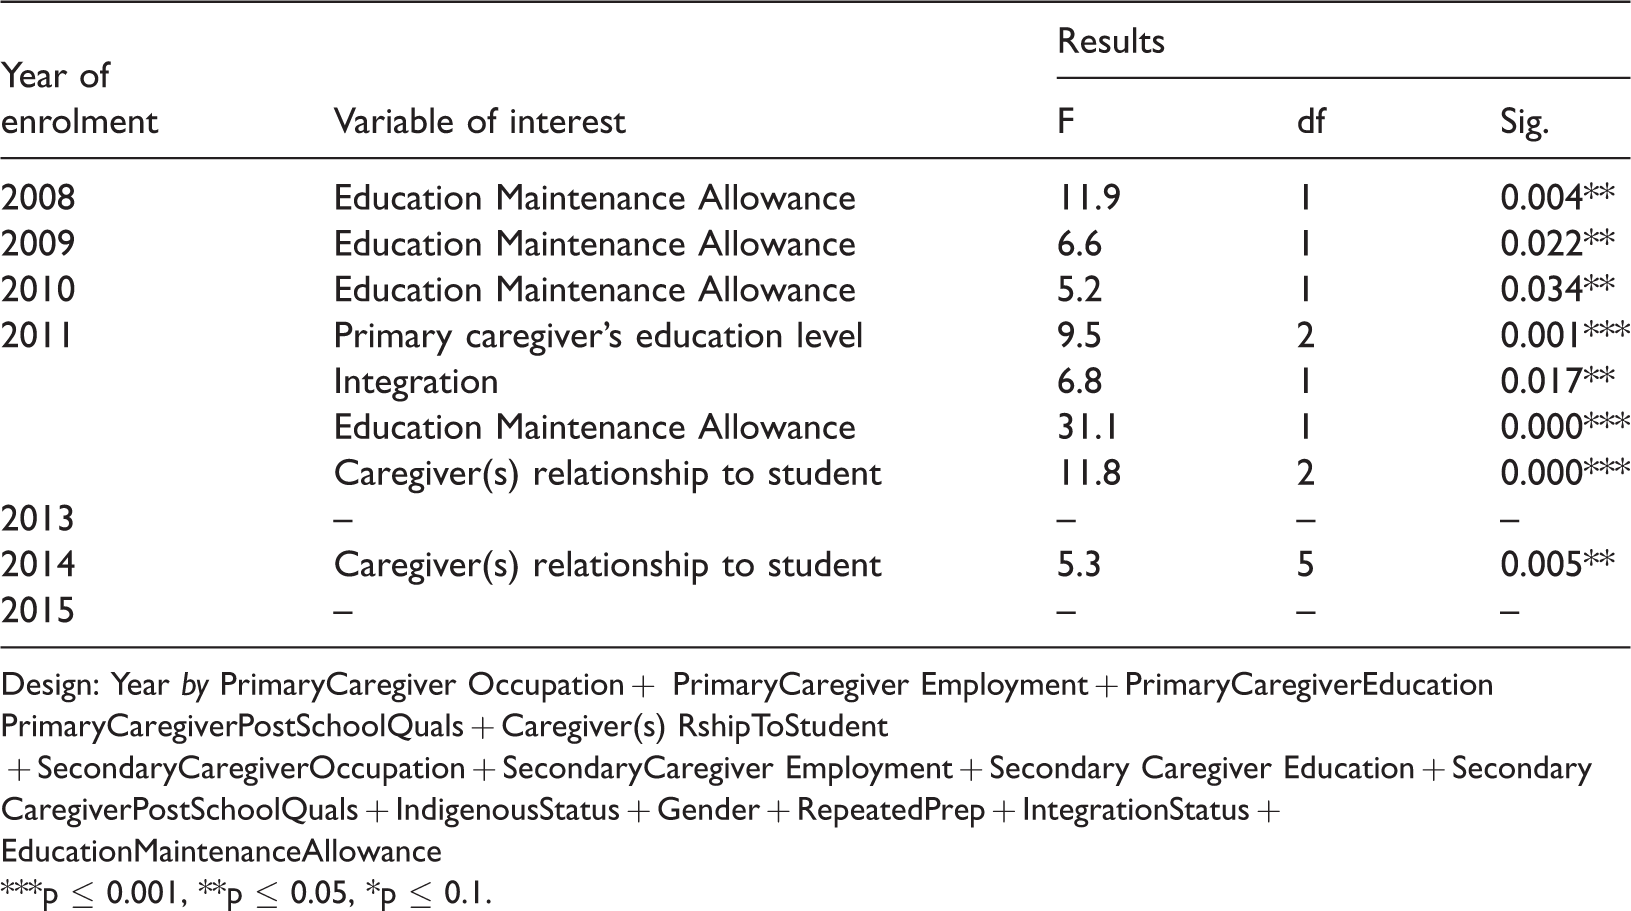
Design: Year by PrimaryCaregiver Occupation + PrimaryCaregiver Employment + PrimaryCaregiverEducation PrimaryCaregiverPostSchoolQuals + Caregiver(s) RshipToStudent + SecondaryCaregiverOccupation + SecondaryCaregiver Employment + Secondary Caregiver Education + Secondary CaregiverPostSchoolQuals + IndigenousStatus + Gender + RepeatedPrep + IntegrationStatus + EducationMaintenanceAllowance
***p ≤ 0.001, **p ≤ 0.05, *p ≤ 0.1.
Discussion
Watney Primary School’s catchment area has an average Indigenous population more than 30% higher than the rest of Watney City. The school’s Indigenous population represents a concentration of students ten times greater than the proportion living in the catchment area. The school secures the majority of, if not all, Indigenous students living in the local area, combined with others external to the school’s catchment area. Indigenous families preferentially enrol their children at Watney, effectively creating an education hub for Indigenous students. With a substantial Indigenous student population, and an Indigenous Worker employed to support students and families, the school offered families a unique choice among local schools.
Individual Indigenous students at Watney recorded widely varying attendance rates in each year. Importantly, many Indigenous students had very good attendance rates, as others have noted (Bourke, Rigby, & Burden, 2000). In six years, at least one Indigenous student achieved perfect attendance, and in a further two years, almost perfect attendance. Remarkably for some Indigenous students (and non-Indigenous students), nothing impedes attendance on any school day; not even illness, a main contributor to non-attendance (Daraganova, 2012). At the other end of the continuum, some Indigenous students attended school very infrequently.
Across the 11 years of the study, however, the lowest attending student was equally likely to come from Indigenous or non-Indigenous student cohort. Irrespective of Indigenous status, a small number of Watney’s students attend school very infrequently. Hence, low school attendance was not related to culture.
Several factors contributed to student attendance
Consistent with previous studies, Indigenous students’ mean attendance was lower than that of their non-Indigenous schoolmates (Baxter & Meyers, 2016; Daraganova et al., 2014; Lamb, Jackson, Walstab, & Huo, 2015; Rothman, 2001; Withers, 2004). During the 11 study years, factors related to Indigenous students’ mean attendance at Watney varied. Between 2005 and 2009, Indigenous status was most strongly related to students’ attendance. After 2009, Indigenous status was no longer a significant factor affecting mean attendance rates, except in 2012 when it had a weak effect before it disappeared entirely.
A change of school leadership coincided with the period (2009) when Indigenous status declined and no longer showed a significant effect on students’ school attendance. According to staff present at the time, the new leadership created different approaches to the support of staff and students to mitigate barriers for high attendance. Importantly, from 2009, in partnership with the Indigenous school community, the school designed culturally inclusive strategies that increased Indigenous students’ sense of belonging. Practices the school now recognises to have improved attendance include, for example school community partnerships, celebration of Indigenous culture, playgroup run by the Indigenous Worker, instalment of permanent cultural symbols and paintings, and a specific focus on Indigenous students’ attendance (Baxter & Meyers, 2016). Our analysis confirms the recollections of school staff. Although, here we can only report on the cumulative impact of the cultural and economic supports that produced greater attendance. Without concurrent, evidence-based analysis of specific strategies, we are unable to identify which strategies carried the greatest influence on school attendance. What we can do is to recognise the potent influence of strong interconnectedness between school and community that these approaches evidence. With barriers to cultural inclusiveness removed, a new challenge emerged formerly swamped by the effect of Indigenous status.
Poverty, as indicated by students’ EMA eligibility was the dominating factor associated with mean attendance between 2008 and 2011. The school implemented strategies to allow all students, irrespective of their family’s socio-economic circumstances, to participate fully in school life (Baxter & Meyers, 2016). Watney accessed equity funding to provide students with school necessities (e.g. stationery), uniforms, and support to attend camps, and other associated curricula activities. The net effect of these strategies minimised the outward manifestations of poverty for students while at school. To help mitigate food insecurity, a common symptom of poverty (Rosier, 2011), the school instituted a breakfast program (and provision of other nourishment throughout the day). The provision of breakfast, a strategy jointly determined by Watney’s staff and the school’s Indigenous community, initially benefitted mostly Indigenous students. Over time though, both Indigenous and non-Indigenous students accessed the service because poverty pervaded the whole school population. Watney catered to the increased prevalence of poverty among Indigenous students and their non-Indigenous peers and their families, and most students and families benefited. Whether removing financial impediments to clothing, resources, or food became the driver for increased attendance requires further investigation. The provision of these resources may have strengthened the school/community partnership in ways that supported higher attendance.
With the outward manifestations of poverty ameliorated, the school passed another milestone in 2011, when family-based and student-based characteristics emerged as having the strongest effects on mean attendance among Indigenous students. In 2011, several factors emerged as being significantly associated with attendance: poverty, integration funding eligibility, caregiver type (relationship to student) and primary caregivers’ education level.
After 2012, caregiver type was the sole remaining factor related to Indigenous students’ attendance – although when analysed independently, the number of caregivers and caregiver type both showed an effect on attendance in 2014. Indigenous students living with grandparents recorded the lowest attendance in 2011, although in 2014, they recorded attendance well above the 90% national attendance benchmark. In 2014, several Indigenous students lived with a relative other than parent or grandparent, and reportedly moved between relatives, as support became available (Indigenous Worker, personal communication, October 2015). Those students had the lowest attendance rates, highlighting the challenges of growing up in circumstances less stable and predictable than most other students. The highest mean attendance for both Indigenous students and non-Indigenous students came from students living in out-of-home care. While carers of students living in out-of-home care are obliged to ensure students attend school (Student Wellbeing Division, Department of Education and Early Childhood Development, & the Children Youth and Families Division of the Department of Human Services, 2011) and out-of-home care students experience potentially reduced financial stress and crises, Osborn and Bromfield (2007) note these children can experience adverse consequences such as placement instability and feelings of loss and grief. At Watney, the Indigenous Worker may have also provided encouragement and support for out-of-home care students to attend school regularly, particularly when experiencing acute periods of stress.
Factors associated with attendance differed for Indigenous students and non-Indigenous students. When analysed individually, fewer factors were related to Indigenous students’ attendance between 2005 and 2015 than non-Indigenous students, and while student and family characteristics were rarely associated with Indigenous students’ attendance, they commonly emerged as significant factors related to non-Indigenous students’ attendance. Setting the effect of Indigenous status aside, which was related to student attendance in many years, poverty was the next most frequent factor, followed by family characteristics. The most frequent influence for non-Indigenous students’ attendance was student characteristics followed by family characteristics. Unlike for Indigenous students, poverty was not a significant factor associated with the attendance of non-Indigenous students’ in any year, which suggests Indigenous students and their non-Indigenous peers experience poverty and its symptoms differently.
As barriers for full school attendance were reduced within the school, Indigenous students’ mean attendance rates fluctuated between 80% and 90%, which approached published national mean attendance rates (ACARA, 2011, 2016, 2017b). Over 11 years, Indigenous students’ mean attendance improved – while the majority of students’ attendance increased, significant variation at the lower margin dampened out any upward attendance trend.
Watney’s Indigenous students’ mean attendance remained below non-Indigenous students’ attendance in each year. The differences in mean attendance ranged between 11.6 and 0.5% until 2011. In 2013, the gap between Indigenous and non-Indigenous students’ mean attendance had almost closed. Indigenous students’ improved attendance made limited contributions to narrowed attendance gaps. Fluctuating between 80% and 90% over the study period, Indigenous students’ mean attendance improved slightly from 2005 to 2015. Non-Indigenous students’ more stable attendance over time showed a slight decline. As a result, non-Indigenous students’ declining attendance rates contributed to reduced attendance.
One explanation for the decline in non-Indigenous school attendance may relate to a larger proportion of students living in poverty. Increasing poverty among the non-Indigenous student population produced the expected outcome of correspondingly lower mean attendance rates (Hancock et al., 2013). While affluence declined across the entire student population, Indigenous students’ attendance remained largely impervious to higher proportions of poverty. Distinct from non-Indigenous peers, universal poverty experienced by Indigenous students was associated with slightly higher mean attendance. The impact on Indigenous students, most already living in precarious financial circumstances, proved proportionally less than the increase in poverty among non-Indigenous students.
We collected and analysed student characteristics, family characteristics and affluence indicators, factors considered influential for high (or low) attendance rates here and in other studies (Australian Government, Productivity Commission, 2016; Daraganova, 2012; Hancock et al., 2013; Lamb et al., 2015). While we analysed data collected at the school, we recognise limitations around student and family information required for government purposes. Schools’ administrative data, although accurate, also provide fewer and less differentiated factors for evaluating attendance than we would prefer, and ‘observable characteristics (like location, health and socioeconomic background) do not explain all of the difference’ (Prout Quicke & Biddle, 2016, p. 13) in attendance rates.
Differences between individuals arise from the myriad of factors that could potentially influence attendance, including wellbeing, motivation, and attitudes for Indigenous students’ regular attendance (Mooney, Seaton, Kaur, Marsh, & Yeung, 2016; Yeung, Craven, & Ali, 2013; Zubrick et al., 2006). Daily nuances, both complex and dynamic, also contribute to whether, as Balfranz and Byrnes (2012) neatly categorised, students cannot, will not or do not attend school. The daily decisions as to whether or not to attend school might relate to individual student circumstances, however family-related influences may be particularly important for day-to-day decisions regarding school attendance. At urban primary schools, Indigenous students’ (and all students’) attendance largely depends on family and parenting factors (Daraganova et al., 2014) to organise students and transport them to school.
The bounds of mean attendance
Watney’s Indigenous students’ mean attendance was bounded between 80 and 90 per cent. The lower bound of attendance for most urban Indigenous students (and non-Indigenous students) experiencing poverty centered around 80% (equivalent to missing forty school days in an academic year). During the 11 study years, Watney’s Indigenous student cohort’s mean attendance remained above 80%, while falling short of reaching the government goal of 90% attendance (Ross, Darby, Macreadie, & Lesman, 2013). During 2005–2015, the proportion of Indigenous students living in families with insufficient income increased from three-quarters to all students (all families eligible for EMA). Proportionally fewer non-Indigenous students were living in households experiencing poverty early in the study and during those times, those students recorded attendance rates greater than 90%. Apparently, higher attendance goes hand in hand with greater affluence.
Indigenous students attending more than 90% of the time may have belonged to that group of families who were at the more affluent end of the poverty spectrum. The converse was true for families of non-Indigenous students’ – as they came to experience higher levels of poverty, mean attendance declined below 90% and approached the attendance of Indigenous students. The decline for non-Indigenous students occurred when poverty affected half their population. Indigenous students’ school attendance remained below 90% because poverty among their population was substantially more pervasive in every year than their peers. Perhaps, if affluence increased and half the Indigenous students became elevated above the poverty line, 90% mean attendance may lie within reach. Based on our analysis, we predict that further declines in affluence across the school population will produce equal attendance of Indigenous and their non-Indigenous peers.
Watney’s Indigenous students may experience other constraints that preclude mean attendance above 90%. Factors associated with far-reaching consequences of the Stolen Generation are burdens for families that may influence the best of intentions and limit opportunities for full attendance. Watney’s school community included descendants of Stolen Generation families (Indigenous Worker, personal communication, October 2015), like many other Victorian Indigenous families (Stolen Generation Victoria Ltd, 2008). They may have experienced ‘displacement from Country, institutionalisation and abuse’ (Atkinson, 2013, p. 2). Poverty, reliance on government benefits and children living away from biological parents are the few Stolen Generation consequences we can determine from schools’ administrative data. Other factors that result from inter-generational trauma remain unknown. The added burdens experienced by Stolen Generation families complicate daily lives and may be a barrier to many families to get their children to school more often than nine days a fortnight.
The effect of poverty
Over the 11 study years, families with caregivers employed in well-paid occupations became increasingly rare in the school population. Across the whole school community, employed primary caregiver’s became ever more located in low-skilled and low-salaried occupations. Concurrently, unemployment levels increased and Watney’s student population’s affluence diminished. By 2015, over three-quarters of Indigenous students’ families relied on welfare. Watney’s Indigenous students’ Education Maintenance Allowance (EMA) eligibility also increased, from almost 85% in 2005 to all students by 2015. Whether from the school’s catchment area or beyond, Indigenous students enrolling at Watney were progressively adding to the school community’s poverty.
Every family’s experience of poverty differs. Duration of poverty, previous affluence, available resources, for example, between families, and the extremes of hardships experienced vary. Hunter (2012) recognised Indigenous families’ experience poverty differently from non-Indigenous families. For Indigenous families, support from family and friends for periods of financial hardship may be limited because they are equally likely to be without paid work and to experience similar financial stress (Lahn, 2012). Cultural influences and obligations for economic management may also impact available resources, through the generosity of sharing scarce resources. Hunter (2012) suggests that differences in the experience of poverty are partially due to Indigenous people’s social exclusion and in urban areas on-going discrimination that persists daily for many Indigenous students (Priest, Thompson, Mackean, Baker, & Waters, 2017). In addition, like many Victorian Indigenous children from Stolen Generation families, Watney’s Indigenous students may experience high levels of abuse, neglect and exposure to violence (Atkinson, 2013). If Watney’s Indigenous students experience these traumas, as do many peers (Hockey, 2008), added burdens make more remarkable Indigenous students attend as often as they do.
Watney’s student population changed during the study years as poverty increasingly permeated the whole school population, and non-Indigenous student enrolments diminished while enrolment numbers strengthened for the Indigenous population. Increasing poverty (Australian Government, Productivity Commission, 2016; Daraganova et al., 2014; Lamb et al., 2015; Zubrick et al., 2006) and higher concentration of Indigenous students (Rothman, 2001; Zubrick et al., 2006) have been identified as factors in reducing Indigenous students’ attendance. Yet over the 11 study years, despite an increasing proportion of Indigenous students enrolled at Watney, Indigenous students’ mean attendance improved.
Non-Indigenous students also contributed to the school community’s increasingly levels of poverty. Household income quartiles for the school’s catchment area from 2011 to 2016 indicate households in the lowest income quartile increased 5.2% and 7.5% in the second lowest income quartile (.id the population experts, 2018). The school-aged population within the school’s catchment areas was diminishing simultaneously (.id the population experts, 2018). Watney’s non-Indigenous students were being drawn from an increasingly impoverished neighbourhood, with a shrinking pool of potential students. Demographic shifts in Watney’s immediate neighbourhood, however, included few Indigenous families because most lived outside the catchment area. However, if the demographic trend continues in Watney’s catchment variations will become reflected in the non-Indigenous student population.
Watney represented a school population in transition, becoming increasingly disadvantaged through a process of ‘residualisation’ (Lamb, 2017). While far from certain, if Watney’s concentration of poverty continues to increase, more economically advantaged students might progressively bypass Watney, because, as Lamb (2017) suggested, they will favour schools with greater community affluence and accompanying high levels of student attendance and educational outcomes. If historic trends continue, the residual population will become more financially homogeneous, living uniformly in poverty. With characteristics associated with low student attendance: Indigenous status and poverty (Daraganova, 2012; Hancock & Zubrick, 2015; Lamb et al., 2015), and an increasing population (Rothman, 2001; Zubrick et al., 2006), Watney’s Indigenous students were particularly educationally vulnerable.
Watney is a primary school where Indigenous families preferentially enrol their children because the school supports their Indigenous culture and provides programs that ameliorate symptoms of poverty that negatively impact students and their school life. As a result, Indigenous students feel happy and culturally included at school (Principal, personal communication, July 2014); a critical foundation for attendance and learning for all students. However, happiness and cultural inclusion alone will not ensure full and regular attendance; while students enjoy school when they get there, they attend less often than their peers and the national attendance benchmark. Broader financial and social conditions, including the continuing harmful effects for students and families of inter-generational trauma and prevalence of unemployment, for example, are beyond the school’s capacity to ameliorate. Watney’s staff needs to continue to work in partnership with the Indigenous school community towards strengthening Indigenous students’ attendance rates.
Conclusion
At an urban primary school with an Indigenous population, that averages more than one-fifth of the student population, Indigenous students’ annual mean attendance wavered between 80% and 90% for more than a decade. Between 2005 and 2015, the entire school population experienced increasingly widespread poverty; nearly all Indigenous families were living at or below the poverty line. Poverty, considered alongside the high number of students living in families without a parent, suggests many urban Indigenous students and families experience life challenges synonymous with inter-generational trauma, commonly associated with the Stolen Generation. Inter-generational trauma may influence families and children differently, to produce the variable student attendance we observed.
Working with the Indigenous school community, the primary school became more culturally inclusive and effectively provided greater equity for Indigenous students to mitigate the effects of Indigenous status and poverty at the school-level. The school’s efforts contributed to students attaining mean attendance above 80% in every year. However, while Indigenous students’ mean attendance improved slightly over time, the quest to secure 90% attendance (the national attendance benchmark) remained elusive.
Poverty was a particular constraint for students’ primary school attendance because when Indigenous and non-Indigenous student populations experience widespread poverty, mean attendance falls short of the national benchmark. However, while poverty impacts everyone, it does so differently and Indigenous students’ attendance rates remained lower than non-Indigenous classmates. The remaining poverty influences for Indigenous students’ attendance occur outside the school and will require (social and economic supports) responses beyond the capacity of schools.
Primary school education builds skills and knowledge as the foundation for secondary school learning and post-school achievement. Frequent school attendance enables students’ maximum benefit from the school curriculum. For urban Indigenous students living in poverty, perhaps the best school-level attendance rate we can hope for will be above 80%. The quest for 90% attendance rates may be neither achievable nor worthwhile because meeting arbitrary delineations may carry less benefit than we hope. However, we should continue to seek improvement because each additional day of attendance increases learning opportunities for Indigenous students.
Footnotes
Acknowledgements
The generous participation and contribution of the Indigenous school community at Watney (a pseudonym) made this work possible. We thank the Elders and community leaders for their support and permission to conduct this project, without which this project would not be possible. Ethical constraints preclude the identification of Country on which the school is situated. We would, however, like to acknowledge and pay our respect to the Dja Dja Wurrung Community as the traditional owners and custodians of the land on which La Trobe University Bendigo is situated and where we conducted the analysis and writing for this paper.
Declaration of Conflicting Interests
The author(s) declared no potential conflicts of interest with respect to the research, authorship, and/or publication of this article.
Funding
The author(s) received no financial support for the research, authorship, and/or publication of this article.