
Abstract
This is a compilation of three items comprising first a commentary on “What are the effective public schools? Insights from New South Wales’ secondary schools using a stochastic frontier analysis with a panel dataset” (Diane Dancer & Vincent Blackburn, Australian Journal of Education, 61(2), 2017. https://doi.org/10.1177/0004944117713555) followed by two responses to that commentary. The commentary by Rob van den Honert examines whether an appropriate measure of efficiency has been used to interpret the results in this study. He also fields the question: ‘is using resources more efficiently more important than achieving superior educational outcomes? In the second item, Diane Dancer and Vincent Blackburn respond to Rob van den Honert’s commentary. The third item by Petra Lietz is a brief response to Rob van den Honert’s commentary.
Keywords
Commentary by Rob van den Honert
In a recent paper in the Australian Journal of Education, the authors use stochastic frontier analysis (SFA), an econometric modelling method, to examine the efficiency and effectiveness of a range of government sector secondary schools in NSW. The efficiency model determines the extent to which financial and demographic input variables are able to produce educational outputs (measured by Year 12 ATAR results). Given the ongoing conversation about optimal determinants of school funding in Australia, this kind of analysis is useful.
The SFA model of efficiency is essentially a regression model of the form
What is acceptable efficiency?
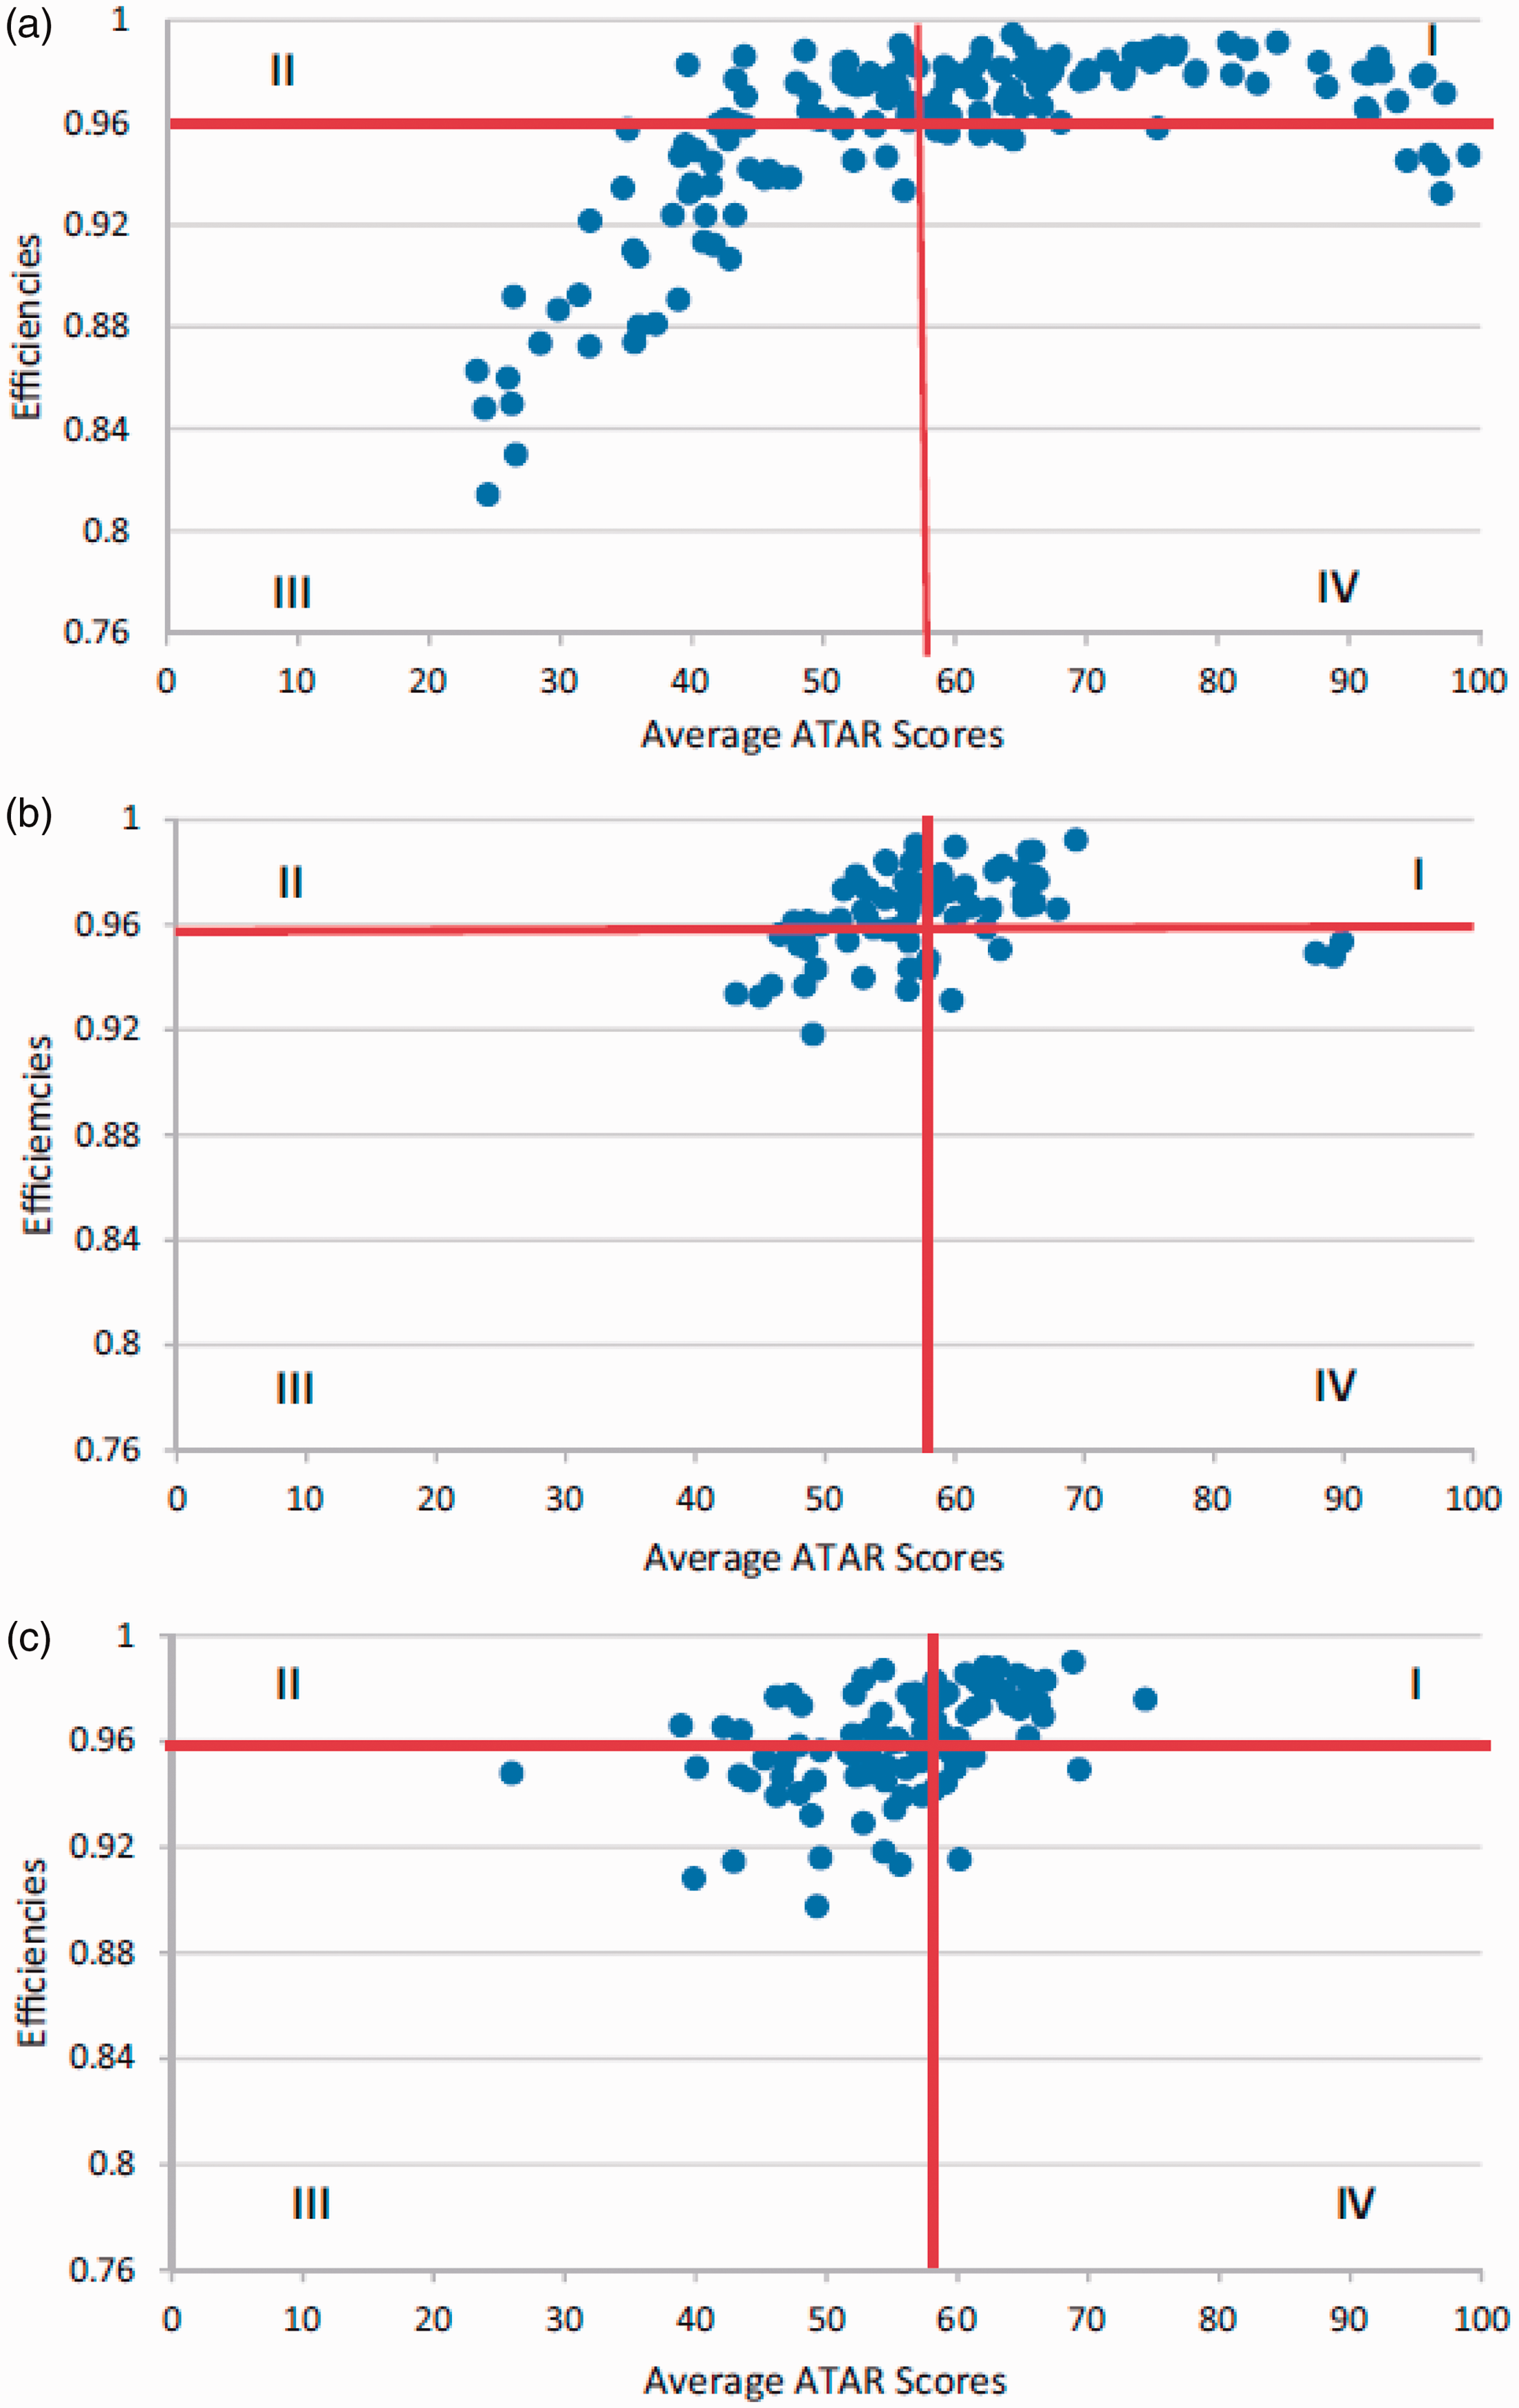
The authors categorise schools’ efficiency and achievement using a classification introduced by Mizala, Romaguerra, and Farren (2002), who used SFA to measure the efficiency of schools in Chile. This classification placed schools into one of four quadrants in the efficiency–achievement plane, where the quadrants were demarcated by the average efficiency and average ATAR of the set of schools. Similar results for the NSW government sector school data produced by the authors are reproduced here for three geographic areas: Metropolitan (i.e. Sydney, 167 schools), Hunter and Illawarra (i.e. large regional cities, 74 schools), and country (i.e. rural and remote areas, 98 schools). Average efficiency across all schools was 0.96 and average ATAR was 57.6. Given that efficiency is maximised at 1.0, most schools could clearly be termed relatively efficient. ATAR is based on ranks across all students (with students not completing school included in the ranking). The median ATAR in NSW in 2016 was 68.65, so the average for the sample implies a sample which has performed well below the state-wide average. Schools in quadrant I exhibit above average achievement with above average efficiency, i.e. they produce more output for a given level of resourcing. Quadrant III has the opposite characteristics: below average effectiveness (performance) and efficiency.
The results elicited a response in the media (Singhal, 2017).
This response begs the question of whether an appropriate measure of efficiency has been used to interpret the results. Is average efficiency an appropriate measure? By definition around half of all schools will have below average efficiency (and half above average efficiency), so in this sense Sydney (Metropolitan) schools are actually doing quite well. We suggest that some absolute measure of efficiency would be better to demarcate the efficiency–inefficiency frontier, for example efficiency of 0.90 or 0.85. Choice of suitable efficiency level here would require further research, but at first glance the charts reproduced here indicate that only four schools in NSW could be termed inefficient at a 0.85 cut-off, and only 16 at a cut-off of 0.90.
In any event the charts indicate a fairly strong positive correlation between efficiency level and average ATAR in all regions, which implies an increasing average ATAR is associated with increasing efficiency. Whilst this does not imply causality it is a pleasing outcome – schools that use their resources efficiently tend to produce relatively better-performing students. Surprisingly, the authors do not comment on this conclusion.
The classification of schools into quadrants on the efficiency–achievement plane leads to a further issue that is at the heart of this research, but which has not been addressed in the paper. This is the question of the relative importance of the two dimensions – is using resources more efficiently more important than achieving superior educational outcomes? Schools in quadrant II use their resources efficiently, but achieve poorer results, while schools in quadrant IV use their resources inefficiently, but achieve excellent results – where should a school ideally be located?
A measure of output – Is average ATAR the appropriate measure?
The measure of output used by the authors is the schools’ average ATAR rank. But ATAR (or any measure of educational attainment, for that matter) in itself does not represent how well a school has performed with its resources; rather it measures the cohort of students’ underlying ability to perform in the HSC examination process. What would be more appropriate as a measure of educational output relative to efficiency would be the year-on-year change in ATAR rank (call this ΔATAR). Under this paradigm a school that is using its resources efficiently will be moving its average ATAR steadily upwards, regardless of the starting point.
We hypothesise that there would be a strong positive correlation between ΔATAR and efficiency, i.e. graphs of similar shape to those in Figure 1 of the paper, but with different schools in the four quadrants.
Those results would be interesting to the school funding debate – classifying the type of schools that are using their resources efficiently to steadily improve educational outcomes for the students in a community, regardless of the internal and external environment they find themselves in.
Not all Year 12 students follow an ATAR pattern of study. Indeed, in 2016 as many as 21% of Year 12 students in government schools in NSW did not get an ATAR. Most of these students complete vocational training courses, which generally require large resource input by the school (machinery, tools, materials, etc.) but do not contribute to the output (i.e. student ATAR). We suggest the authors recalculate all input variables where this might have an effect, e.g. teachers’ salaries per student, other staff salaries per student, schools own expenditure, to reflect only ATAR-related expenditure.
The role of socio-economic status
The authors omitted a variable indicating socio-economic status from the model because the Family, Occupation and Education Index (FOEI) was only available for two of the study years. They compared the model with and without FOEI, found little difference, and concluded that socio-economic status is thus not important as an indicator of Year 12 ATAR rank, whereas the influence of prior attainment (i.e. the student’s Year 10 exam result) was a more significant indicator. Concluding that socio-economic status is not important is in stark contrast with a global body of research that indicates that socio-economic status is the single best indicator of educational achievement (e.g. Aikens & Barbarin, 2008; Brown, Wohn, & Ellison, 2016; Doerschuk et al., 2016; Reardon, Valentino, Kalogrides, Shores, & Greenberg, 2013). Indeed the authors discuss the work of Miller and Voon (2011) which indicates that school Index of Community Socio Educational Advantage is the most influential variable for predicting NAPLAN results in Australia.
This apparent contradiction can be explained by two deficiencies in the authors’ approach: (1) socio-economic status will not change much over a five-year period, so an indicator such as FOEI, or the ABS’ Socio-Economic Indexes for Areas at any point in the study period would be appropriate to indicate variation in socio-economic status of schools across the state, and (2) there is bound to be extremely high multicollinearity between FOEI (or any other measure of socio-economic status), prior attainment (represented here by Year 10 School Certificate results), and Year 12 ATAR ranking. Based on the global research referenced above, socio-economic status is strongly positively correlated with Year 12 ATAR and prior attainment, and prior attainment is positively highly correlated with Year 12 ATAR (the authors quote a correlation of 0.88). In the resulting SFA the regression model simply selects prior attainment over socio-economic status, because these two variables are effectively explaining the exact same portion of the variation in the Year 12 ATAR ranking due to their very high correlation. So whilst the model is technically correct, prior attainment adds little in the way of understanding (and if anything confuses understanding by producing a result which runs counter to accepted wisdom). It is puzzling why prior attainment is included in the model at all, since it is an output in its own right – an interim indictor of achievement based on school inputs.
Conclusion
The methodology used by the authors includes some serious deficiencies which may have a significant effect on the study’s results. This is an important area of debate in educational circles, so getting the data and the model correct is imperative.
The paper might be improved if the authors consider refining their study in the following ways.
Use a measure of change in ATAR across time as dependent variable Recalculate input variables to reflect only ATAR-related school expenditure Include a measure of socio-economic status rather than prior attainment as an input variable Discuss what efficiency actually means in the context of the results produced and what level of efficiency is ‘good’, and propose an appropriate absolute measure of efficiency.
References
Response by Diane Dancer and Vincent Blackburn
The criticisms about the modelling in the paper are valid. However, some of the criticisms cannot be answered due to lack of data.
There has been little discussion of what is an acceptable efficiency level for secondary schools. As noted in the article, the DEA model is not used as it assumes that all variables are measured without error. This assumption is unlikely to hold in the education concept. There is very little literature on efficiency in schools and therefore the paper uses the same definition as Mizala et al. (2002).
Bessent and Bessent (1980) use the DEA model. This article uses the terms, efficient and inefficient schools, depending on whether their comparative efficiency rating is 1 (efficient) or less than 1 (inefficient). The inefficient values are from 0.98 to 0.78 for 24 out of 55 schools.
The advantage of having a matrix structure is that it illustrates that some schools are very efficient and have a very high ATAR score for the school. What is very concerning is the number of schools who do not have a high efficiency score or a high ATAR score. This indicates that there is a need to investigate what help can be given to these schools to improve their performance.
Some authors include prior attainment in their analysis which corresponds to our Year 10 results. After 2010, these Year 10 results do not exist. It is not possible to split the data into ATAR and non-ATAR students as it is not available. It would be very interesting to model the data only using those students completing their Year 12.
This variable for socio-economic status was not available for New South Wales until 2009. The authors modelled the data using only two years of data and found the FOEI variable was not significant for this dataset and in an analysis which also included a measure of prior achievement (Year 10 results).
For Question 2, it is not possible to use only ATAR-related school expenditure. To pull out expenditure hypothecated to ATAR only and Non ATAR $amounts – would be impossible – unless we had supplementary data at the ‘individual student record level’ to make such separations possible to calculate. Indeed without a ‘Student’ level and ‘Teacher’ level class room unit record data set to make such a demarcation, this exercise would be impossible.
For Question 3, our considered judgement is that both a measure of socio-economic status and prior achievement should be used. Our results showed that prior attainment not FOEI was significant for the two years of data.
For Question 4, there needs to be some indication of when the level of efficiency is low in comparison with other schools. To use the words, ‘good’ or ‘bad’ would not be helpful. If another number was used other than the average, there appears to be no comments in the literature what level should be used. The authors do note in the article that all schools are at least 80% efficient. This question is important as putting a value judgement on either a ‘good’ or ‘bad’ efficiency – (maybe worse is a better term), needs further attention in order to assess all the intervening categories from these extremes.
Without access to unpublished data on anonymised individual student and teacher record data sets, (unlike the fully available ‘National Pupil Data Base’ and the ‘‘National Teacher Data Base’ in the UK), we may be hampered in teasing out some of the above issues.
References
Response by Petra Lietz
This response to the comment by van den Honert refers to the assertion that a ‘global body of research […] indicates that socio-economic status is the single best indicator of educational achievement’ and the authors of the original article should ‘include a measure of socio-economic status rather than prior attainment’.
This assertion is incorrect. Thus, for example, Adams (2012), in a paper prepared for the Council of Australian Governments Reform Council, showed that prior attainment – in the form of NAPLAN, 2008 reading performance – predicted more than half the variance in later attainment – in the form of NAPLAN, 2010 reading performance. More specifically, the explained variance in NAPLAN, 2010 reading performance ranged from 52% for the gain between Year 3 and 5 in Victoria to 69% for the gain between Year 7 and 9 in the Northern Territory. Results of the same analysis showed that all available student background characteristics taken together (i.e. geolocation, school sector, gender, Aboriginal and Torres Strait Islander background, language background, parental occupation) explained only between two and eight additional per cent of variance in student achievement once prior attainment had been taken into account. Likewise, studies in the US (e.g. Brenner, Boyle, & Sadler, 2016) and Germany (Baumert et al., 2010) have demonstrated that the association of SES with student performance is relatively small or become trivial when prior performance is taken into account. To some extent, this reflects the problem of multicollinearity between SES and prior performance which results in the stronger predictor – prior achievement – tending to remain in the model. However, whenever possible, models of student performance should include measures of prior performance to avoid misspecification and effects being reported which would disappear or be greatly reduced (as is the case for SES) if prior performance were taken into account. This is of particular importance in analyses where claims are made regarding the extent to which schools are effective – the topic of the Dancer and Blackburn article – or ‘add-value’ to student learning outcomes (see New South Wales Government, 2014).
Declaration of conflicting interests
The author(s) declared no potential conflicts of interest with respect to the research, authorship, and/or publication of this article.
Funding
The author(s) received no financial support for the research, authorship, and/or publication of this article.