
Abstract
This study aims to assess the validity of the Online Multiliteracy Assessment for students in Years 5 and 6. The Online Multiliteracy Assessment measures students’ abilities in making and creating meaning, using a variety of different modes of communication, such as text, audio and video. The study involved selecting two groups of students: the first group (n=19) was used in two pilot studies of the items and the second (n=299) was used in a field trial validating the functioning of the items and assessing the quality of the scale. The results indicated that the Online Multiliteracy Assessment has acceptable test–retest reliability; however, the fit to the Rasch model was less than ideal. Further investigation identified two important areas for improvement. First, the items assessing the higher order skills of synthesising, communicating and creating need to be more cognitively demanding. Second, some items need to be modified in order to improve their functionality.
Introduction
The pervasiveness of technology requires people to be able to make and create meaning from a variety of modes of communication. This is essential for social interactions, working, leisure activities and learning. Students today, from preschool to university, interact with information presented in a range of modes in which they can make meaning of their world and their specific learning tasks. This technology-integrated way of making meaning has led to calls from researchers and educators to broaden the definition of literacy (Baguley, Pullen, & Short, 2010).
The term ‘Multiliteracies’ has been used to represent a societal context that comprises multiple forms of media and communication and emphasises ‘cultural and linguistic diversity’ (New London Group, 1996, p. 63). Other researchers (e.g. Baguley et al., 2010; Burke, Butland, Roberts, & Snow, 2013; Unsworth, 2002) support these concepts by arguing that today’s learners will not only require traditional forms of literacy, but also, a broader skill set. This is required if learners are to make and create meaning from the various forms of communication available to them in the multimodal environment in which they live and learn. However, due to continuing research into literacy, an agreed definition of multiliteracies is difficult to locate. For the purposes of this article, multiliteracies have been defined using two concepts: that language is used to make meaning in different ways in different contexts and meaning is made through the use of different modes and combinations of modes (Dobson, 2003; Kress, 2003).
To further develop the idea of multiliteracies, we propose a conceptual model which outlines and describes the skills associated with multiliteracy. The conceptual model (see Figure 1) is supported by the technology-facilitated environment in which students live and learn and requires them to make meaning from a variety of modes of communication. The eight skills, as detailed in Figure 1, which comprise the conceptual model, are based on Bloom’s original taxonomy plus other more recent revisions (Anderson & Krathwohl, 2001; Bloom, 1956; Churches, 2009; Turcsányi-Szabó, 2012). Each skill comprises of a continuum ranging from lower level to higher level, with the higher level demonstrating a more critical approach.
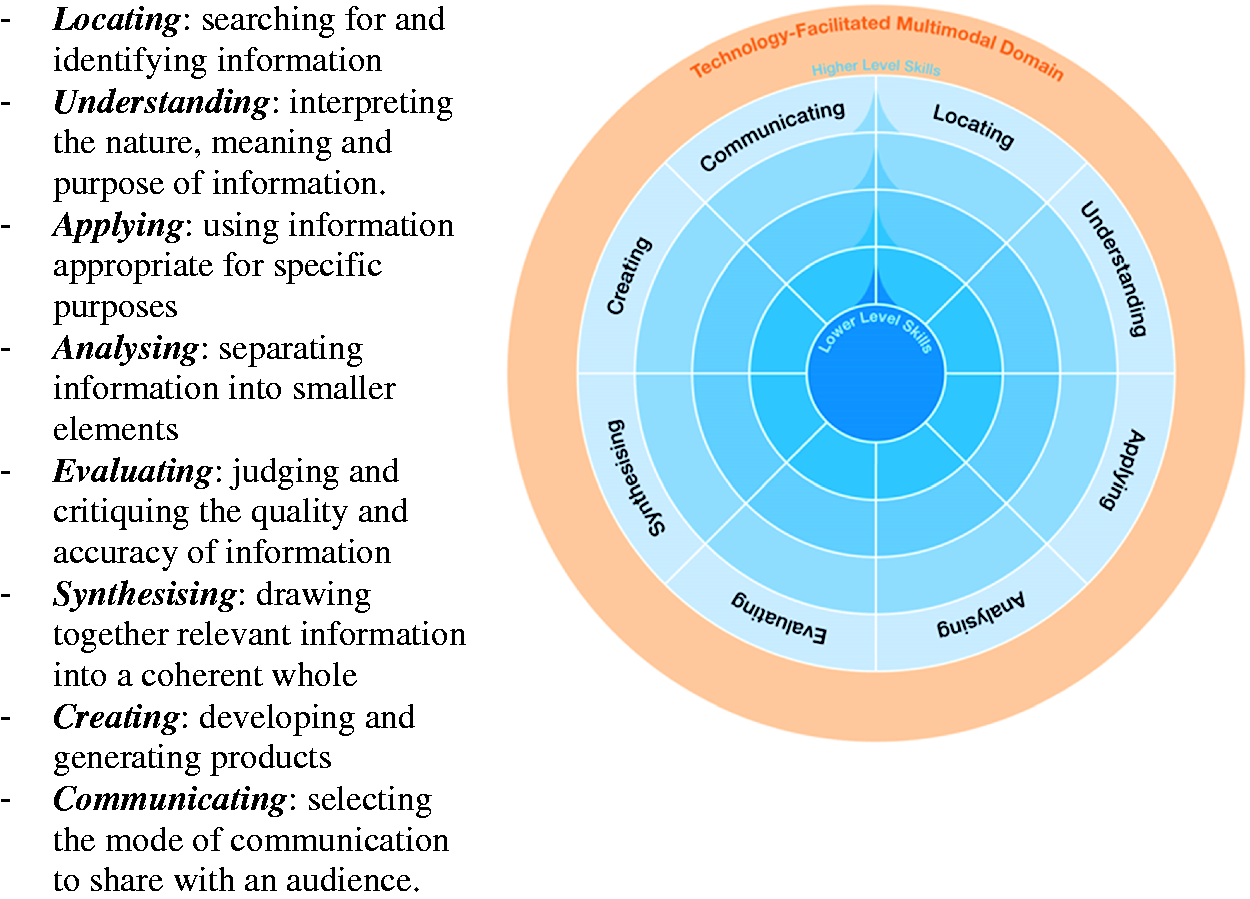
Model of multiliteracy skills.
From theory and research (e.g. Bloom, 1956; Starkey, 2011), the skills that are presented in the model will vary in terms of their difficulty. Difficulty relates to how cognitively demanding the students find each of these skills. For example, those skills that are less demanding, such as locating, the students will find easier and obtain higher scores in assessments. However, those skills which are more demanding, such as communication, the students will find more difficult and obtain lower scores in assessments. These skills could be placed on a developmental continuum, with less cognitively demanding items placed further to the left and more cognitively demanding items placed further to the right.
In the Australian education context, the national curriculum places an emphasis on multimodal learning and the new conceptions of literacy in all of its curricula. This focus encourages teachers to devise lessons using a variety of modes of communication and for students to make meaning from these modes. However, what needs to be answered is to what extent the students can make meaning from a variety of different modes of communication.
Addressing this question requires teachers to assess students’ development of the skills associated with multiliteracies. Current assessment practices that use paper-based formats are too narrow and limited to cater for the technologically rich environments in which students learn today (e.g. Brown, Lockyer, Caputi, & Tognolini, 2010; Dawson & Siemens, 2014; Jewitt, 2003; Johnson & Kress, 2003; Kalantzis, Cope, & Harvey, 2003). However, there is no comprehensive assessment tool that caters for the complexity of learning designs presented to contemporary students.
The current study
The study presented in this article was part of a research project that developed and validated an instrument which used a variety of modes to assess multiliteracy skills. The online multiliteracy (o-Mlit) assessment was developed to measure students’ abilities to make meaning from text, sound, image and video (i.e. multiliteracy skills) in an online environment. As the focus of the o-Mlit was to assess students’ multiliteracy skills, the topics, or content, on which the skills were assessed, could be variable. The three topics chosen were identified as being of interest to students through focus groups with Year 5 and 6 school teachers. The chosen topics included ‘Jump from Space’ (JS), ‘Social Media’ (SM) and ‘Health and Nutrition’ (HN).
The items for the o-Mlit were developed through an iterative process involving feedback from expert reviewers and teacher groups. The items were based on multiliteracy research and the conceptual model of multiliteracy (see Appendix 1 for example items). The structure of the o-Mlit is outlined in Table 1. Content validity was informed by what the item writers and expert reviewers thought about the items in relation to how well the items were assessing the construct of multiliteracy.
Structure of the o-Mlit.
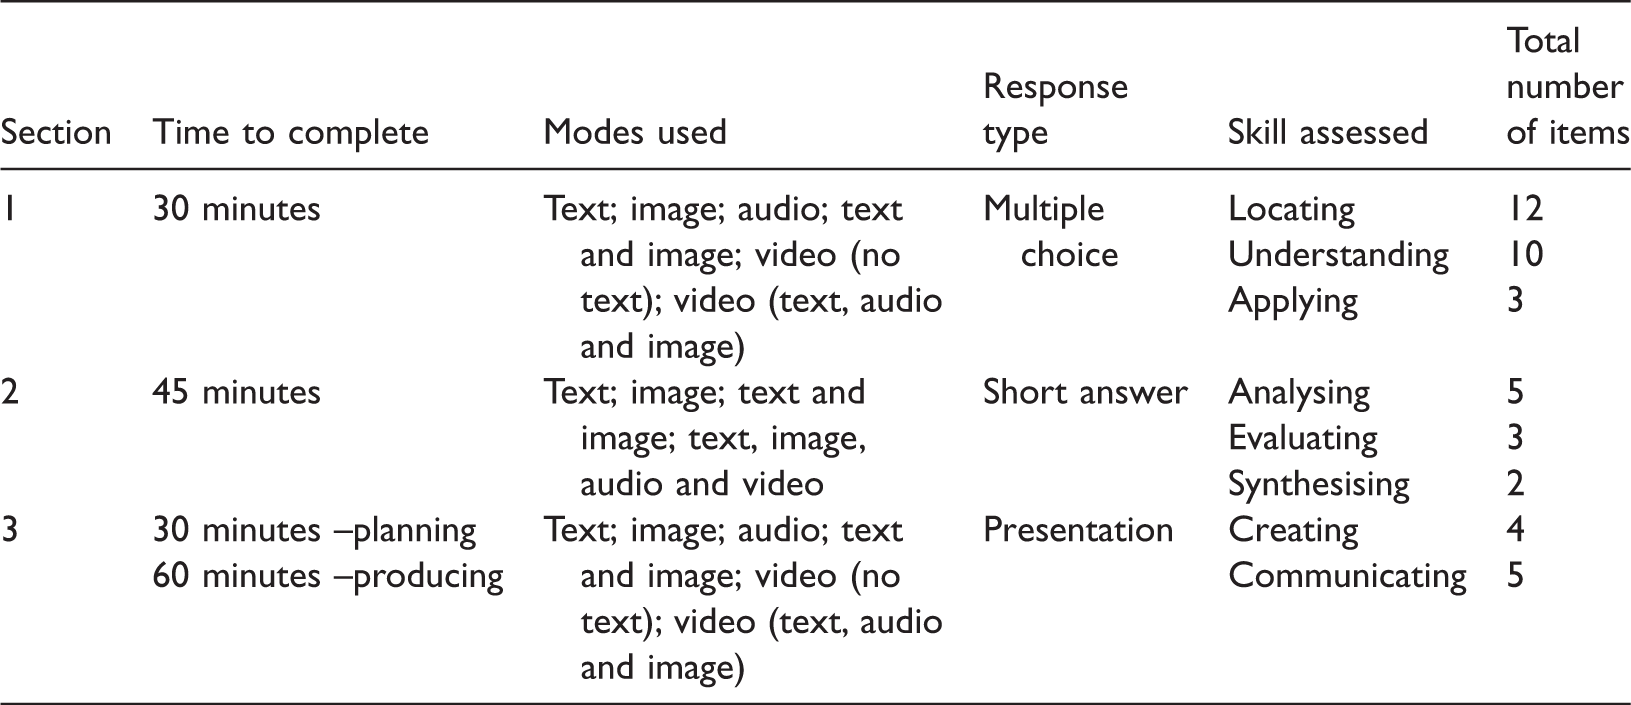
The o-Mlit assessment is structured in three sections with a total of 42 items. All topics (JS, SM and HN) were assessed in section one. In section 2 students selected one of the three topics to be the focus. Section 3 asked students to plan and develop a presentation based on the topic selected in section 2. The presentation (e.g. PowerPoint with embedded videos, word document with inserted images) that the students create is uploaded to the o-Mlit site.
This article reports on a study undertaken to examine the construct validity of the o-Mlit instrument, to identify whether it is measuring what it is purporting to measure. The validity was assessed by focussing on two types of evidence – response process and internal structure (Messick, 1989). The response process focussed on the actions and thought processes of those students undertaking the assessment. The internal structure focused on the reliability and the factor structure of the assessment. The response process and internal structure were investigated in two steps: small pilot studies and then a larger field trial.
Pilot studies
Participants
Two pilot studies were conducted. Pilot study 1 was based on the initial version of the o-Mlit while pilot study 2 was based on the revised version of the o-Mlit. For pilot study 1, nine Year 5 and 6 students from three public schools in New South Wales (NSW) were selected by their classroom teachers. The selection of students was based on the teachers’ knowledge and judgements about the students’ ability to represent a range of literacy levels and be confident enough to give their opinions about the o-Mlit to the researchers.
The average age of the nine students was 11.73 years (range = 11.08–12.57 years) with the majority being female (55.56%) and in Year 6 (55.56%). These students were provided with information sheets and consent forms for themselves and their parents. On the first day of testing, consent forms were collected and students’ understanding of the research process was checked and any misconceptions clarified.
For pilot study 2, 10 students were selected through a snowballing technique. The snowball sampling was used as the study was conducted during school holidays when access to students through schools was not available. The snowball sampling began with an email to employees within the local university. Information sheets and consent forms for the students and their parents were sent via email. The average age of the 10 students at the time of the study was 11.08 years (range = 9.68–12.55 years) with the majority being female (70.00%) and in Year 6 (60.00%). Again on the first day of testing, consent forms were collected and students’ understanding of the research process was checked and any misconceptions clarified.
Method
The o-Mlit was administered to 19 students in order to ascertain their reactions to the items (e.g. requiring clarification, reason for selecting a distractor in a multiple choice item). Assessing the response process, that is the actions and thought processes of those students undertaking the test, can highlight what the students actually do during the assessment and how that matches with the constructs being assessed (Cook, Cook, & Beckman, 2006).
For each pilot study, students’ reactions to the items in the o-Mlit were captured using audio-recorded ‘Think Aloud Protocol’ (TAP) (Ercikan et al., 2010) and screen-capture technology (e.g. Barmby, Harries, Higgins, & Suggate, 2009). Students were asked to speak about everything they were thinking while completing the task. It was suggested that they acted as if they were alone in a room speaking to themselves (e.g. Camps, 2003).
Students were also provided with a description of how their mouse movements and clicks on the screen as well as their voice would be recorded using ‘Camtasia Studio 8’ software. Students were provided with a demonstration of the TAP and Camtasia and were then able to practice using the protocols and technology.
For pilot study 1, students completed the study one day a week over four weeks, for a maximum of one hour. Students completed section 1, section 2 and two sections 3, one on planning and one on creating. This process ensured that the impact on the student was reduced as well as increasing the flexibility for the classroom teacher in regards to the timing of the study. In pilot study 2, students were only asked to work through section 1 and 2 due to the majority of amendments occurring in these sections. To reduce the impact on the family and students, testing was completed in one session in the second pilot study, lasting a maximum of 1.5 hours.
Analysis
When examining item validity in terms of response processes, identifying the link between the item and how the students respond to that item was important. Therefore, the thoughts and questions of each student about each item, as well as his/her movements on screen, were transcribed and analysed by the researchers.
A two-stage process based on grounded theory was used to identify codes to analyse the students’ responses to the items (Charmaz, 2006). Initial coding was the first step in the process and focussed on a few students’ responses to each item of the o-Mlit. This highlighted a number of issues students encountered when using o-Mlit. Focussed coding was then completed which applied the initial codes to all students’ responses. The codes developed from the focussed coding were subsequently grouped into two themes, namely ‘test items’ and ‘technical issues’. Finally, the researchers discussed the two themes and identified ways to improve the items, source material and/or layout of the o-Mlit assessment. This process occurred for both pilot studies.
Results
For pilot study 1, students’ responses to items were coded as shown in Table 2. As a consequence of the results, the researchers changed the wording of some of the questions (e.g. changed ‘adolescent’ to ‘teenager’); changed some of the source material (e.g. made the access to websites clearer; changed from text-link to thumbnail-link); changed some of the response formats (e.g. introduced a different text box for each of the required responses asked within a question) and reformatted some of the items to make them more similar. It became clear that some of the source material was quite complex for the less proficient students. However, the researchers decided not to change the more complex source material because the material was intended to be as authentic as possible.
Themes and codes for the pilot studies.
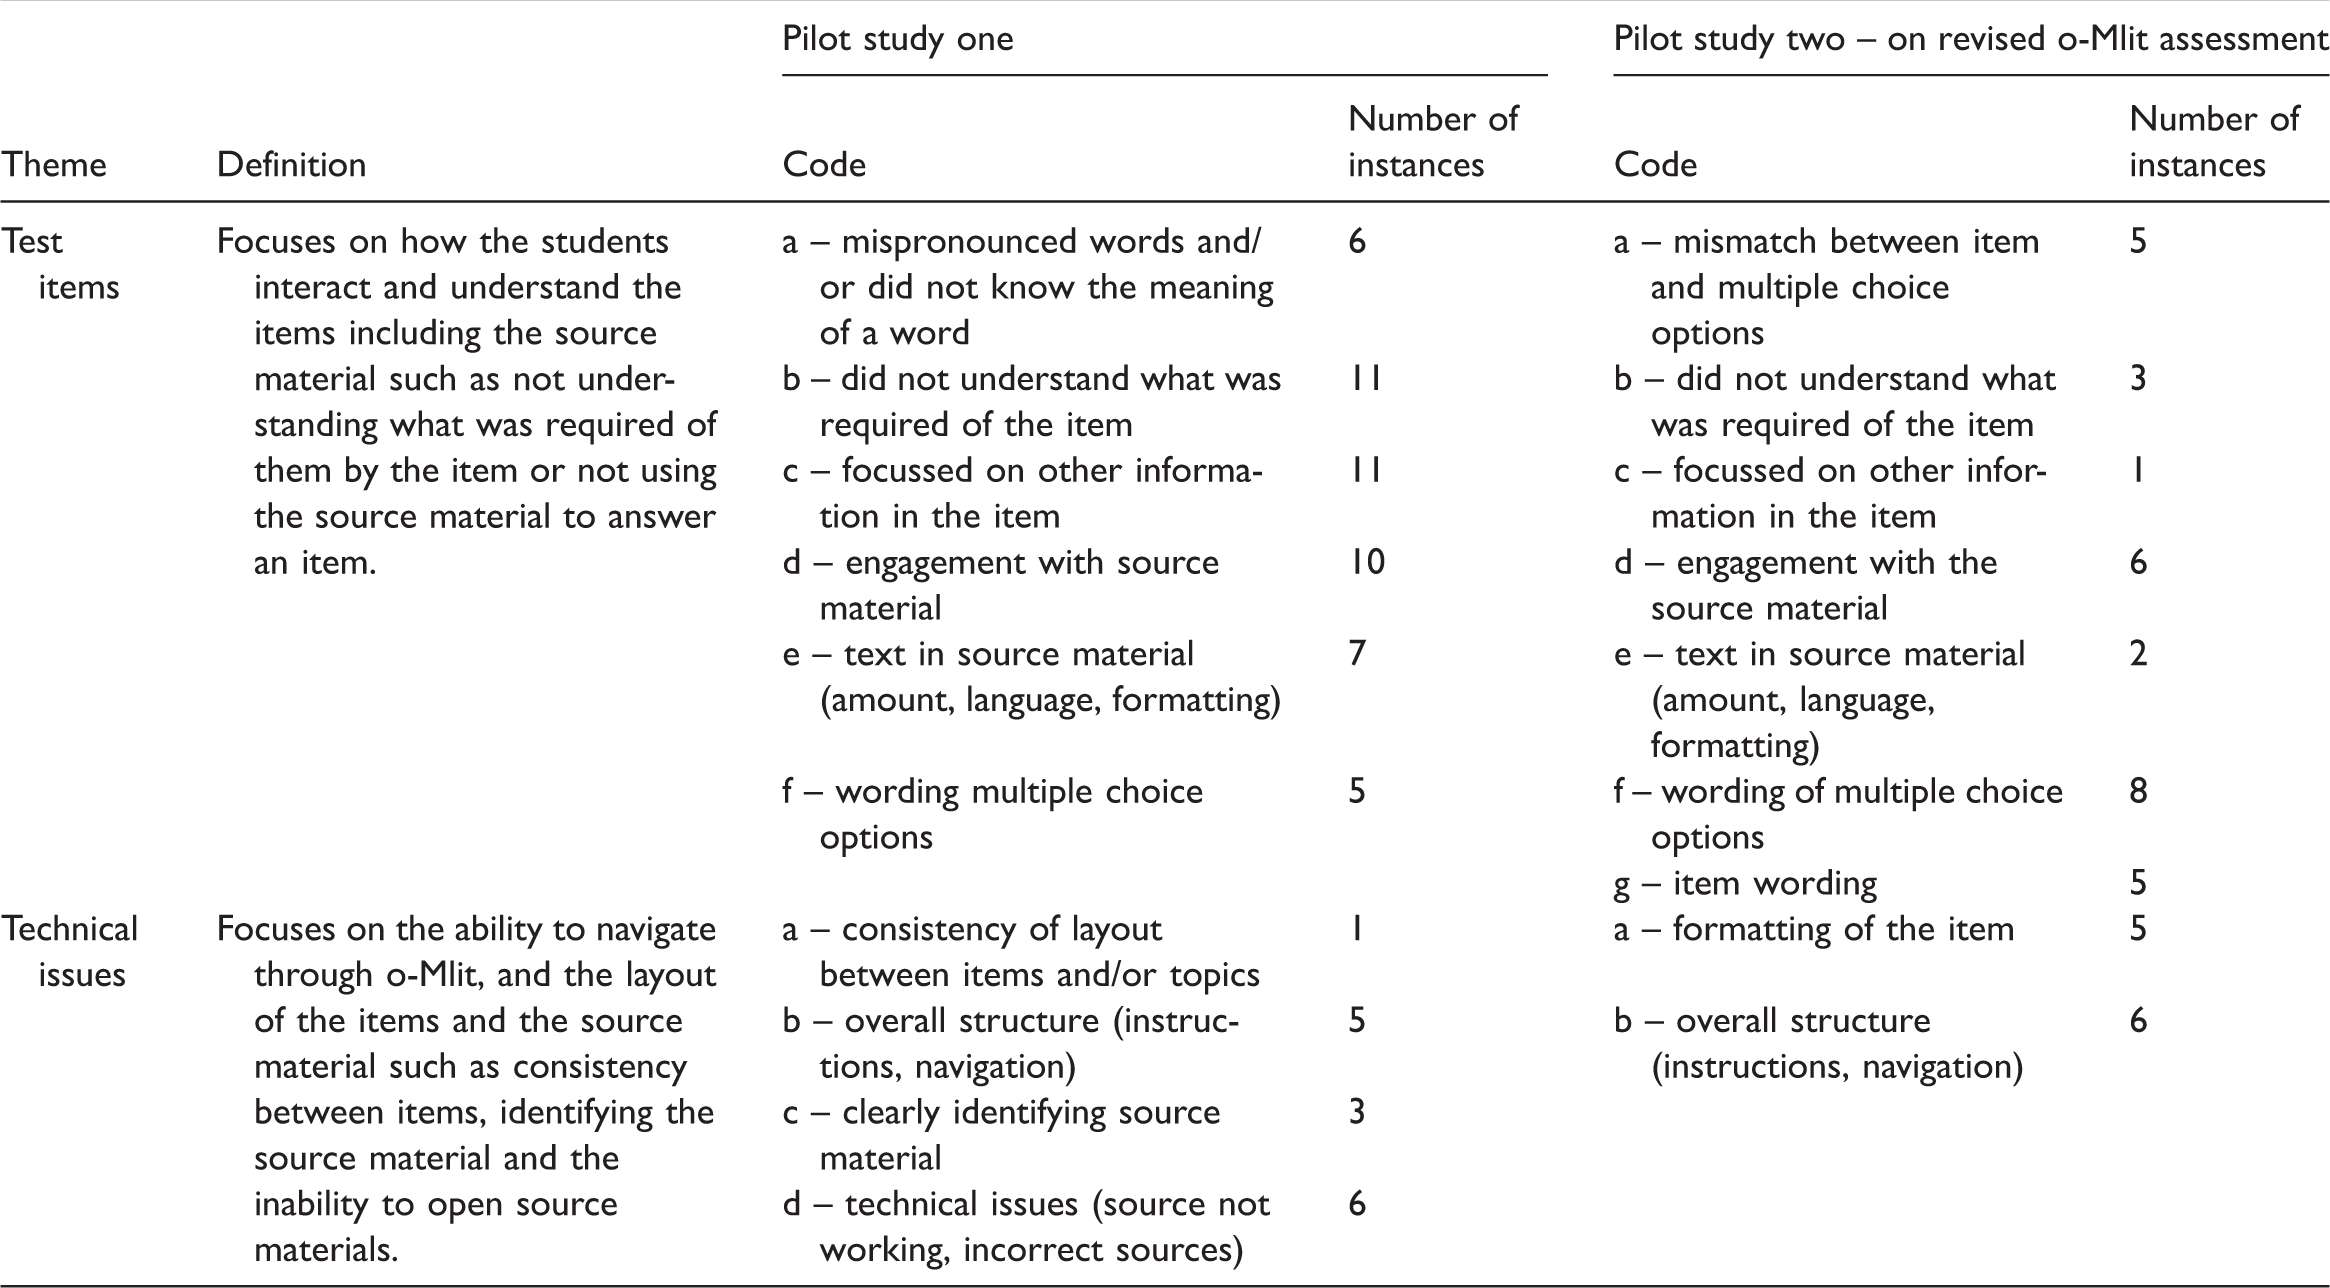
One major change that did occur as a consequence of the results of the first pilot study was to include an introduction page. The introduction page was designed to enable students to practice various item formats that would be used in the o-Mlit. A second major change was the inclusion of audio for each question. This gave the students an option of listening to the question rather than just reading it. The ability to listen to the question was of particular importance for those students with lower literacy attainment, as it enabled them to have an understanding of what the question was asking. Once these changes were made to the o-Mlit, further testing was carried out on the revised o-Mlit in pilot study 2.
Data from pilot study 2 were analysed as shown in Table 2. As a result of this analysis some minor modifications were made to the revised o-Mlit and involved moving the question audio button to the right of the question, adding an extra instructional phrase (e.g. ‘Using the information below’), highlighting (e.g. job) or removing a word (e.g. helmet) in a question, and decreasing the time to complete Section 1 from 45 to 30 minutes. These modifications led to the development of the final version of the o-Mlit which was used in the next step, the field trial.
Discussion
The purpose of the pilot studies was to investigate the response process of the o-Mlit. Evidence for the response process focused on what the students did and thought during an assessment and the extent to which this was in accord with the construct being assessed. This evidence was used to amend those items where the students were focussing on irrelevant material which distracted from the construct being assessed (Miller, Linn, & Gronlund, 2013) thus lowering the validity of the item.
In both pilot studies the theme of ‘test items’ identified the extent to which the item was assessing the targeted skill. For example, by the highlighting or removal of a word in either the question or instructional information made the item clearer to students and hence focussing on the skill being assessed which also added to the evidence for the content validity as mentioned previously (Miller et al., 2013).
The ‘technical issues’ identified the ability of the students to navigate through the o-Mlit as well as the consistency of the layout between items and sections. For example, during pilot study 1 some students did not know how to select an answer to the item (e.g. dropdown menus), move to the next item or play the audio. This was not surprising as many Year 5 and 6 students had not had previous experience with online assessment (ThinkLink Consultancy, 2014). Still, it detracted from the validity of the test because it was not related to the construct of multiliteracy. Therefore, these technical issues had to be addressed in order to improve the validity of the o-Mlit. This was done by adding an ‘Introduction’ page where student could practice interacting with the items. The introduction page also contained videos explaining the types of responses (e.g. multiple choice), the types of source material, the layout of the items. The inclusion of the introduction page enabled the students to focus on the items rather than what button to press or how to get the audio to start (Doorey, 2014).
The data gathered from pilot study 2 indicated that many of the technical issues identified in pilot study 1 had been resolved. The evidence gathered from the pilot studies also suggests that the relationship between the construct of multiliteracy and the thought processes and actions carried out by the students were highly related. This relationship was demonstrated by students’ expressing greater clarity in responding to the items. In other words, students had a better understanding of what the items required of them, did not focus on distracting information and clearly identified the source material. This increased alignment between the construct being assessed and students’ responses indicated readiness for the next phase of testing.
Field trial
Participants
Two hundred and ninety-nine students from 12 schools from rural and metropolitan NSW participated in the field trial. Each student received information sheets and consent forms for themselves and their parents which were returned to the school and collected and checked by the researcher for completeness. The students had an average age of 10.97 years (range = 9.58–12.50 years) with the majority being male (51.66%) and in Year 6 (53.73%).
The o-Mlit was administered on three occasions over six months in 2014. The average time between occasions was 2.6 months (range of 2.1–3.2 months). The number of participants decreased over each testing occasion (occasion 1: 291; occasion 2: 285; occasion 3: 275). The reasons for this decrease in participant numbers included student absences (7.69%), leaving the school (2.68%) and withdrawal from the study (1.34%). Seven students joined the study at occasion 2 which meant that the total decrease in participation from occasion 1 to occasion 3 was 6.7%. However, the number of complete data sets increased over the three testing occasions (occasion 1: 184; occasion 2: 224; occasion 3: 271). The low response rate of 63.23% of the total sample at occasion 1 was due to a technical issue that occurred when the participants uploaded their presentations, however, this was rectified for occasion 2. The ratio of participants to items was 7:1.
Method
The purpose of the field trial was to investigate the internal structure of the o-Mlit. Students were tested with the o-Mlit on three separate occasions, in order to determine the reliability of the o-Mlit. Testing was conducted over four days to reduce the amount of fatigue experienced by students which may have impacted the results and to provide more flexibility to participating schools in regards to the timing of the testing.
On the first day of the field trial, the researcher explained the purpose of the study, answered questions, helped the students log onto the o-Mlit site and assisted them to complete the demographic questionnaire. This process allowed any technical difficulties to be identified and addressed prior to the start of the test.
The testing procedures for the next four days are shown in Figure 2. The videos played on days one, three and four explained to students how they were to answer the items (e.g. multiple choice, dropdown boxes and moving images), play audio and video, listen to the questions and move between items. Each day of testing, students logged on to the o-Mlit site and click on the section to be completed on that day. For example, Day 1 students clicked on ‘section 1’ on Day 3 students clicked on ‘section 3 plan’. The research assistant timed how long the students had to complete the section. Once time was up the students logged off the o-Mlit site. These procedures were followed on the three testing occasions.
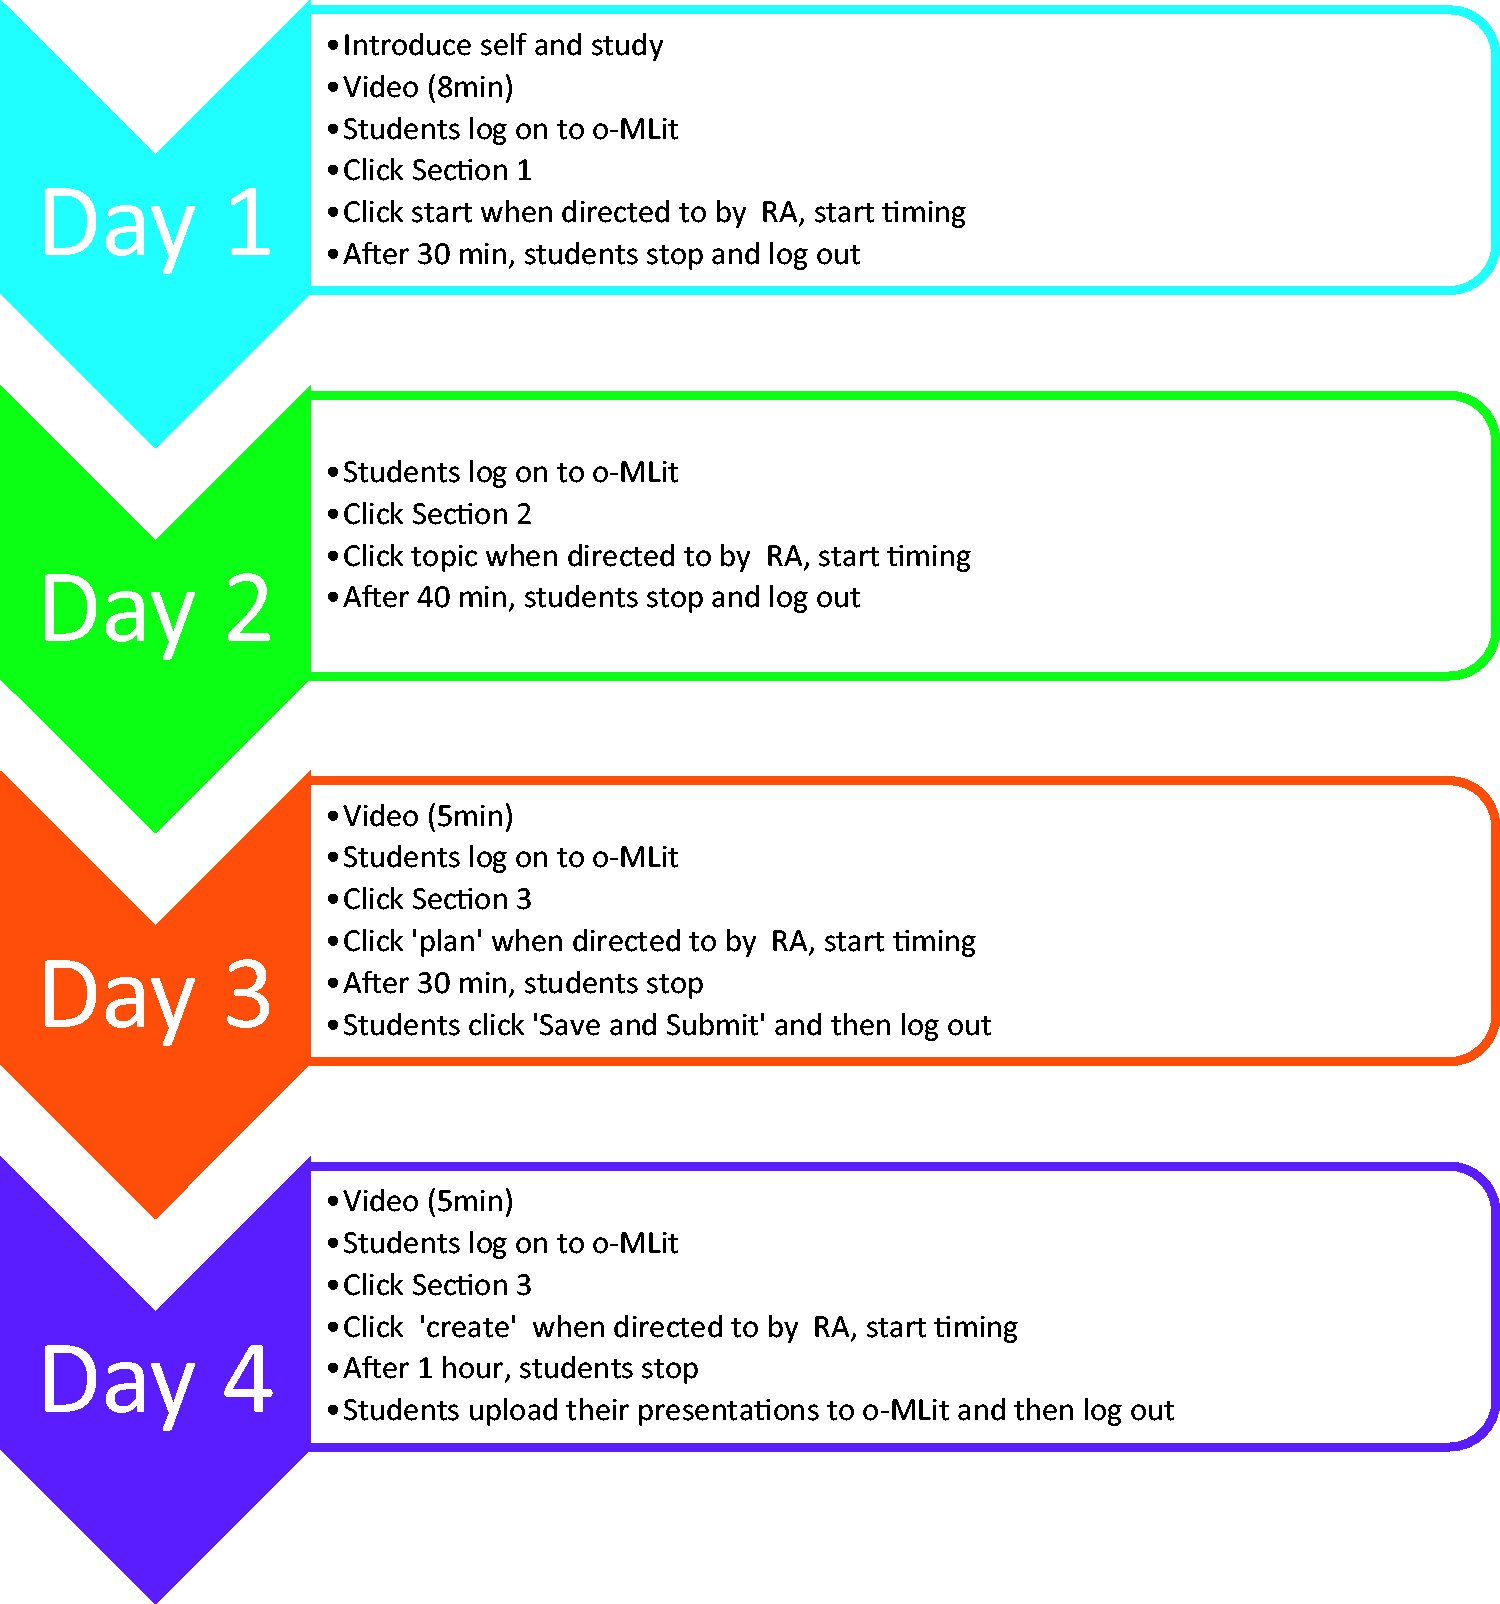
Procedures for o-Mlit testing.
Analysis
Rasch (1960/1980) theory was used to determine the extent to which the items of the o-Mlit comprised a single construct (unidimensionality); whether the items functioned in a manner that was consistent with the expectations of the Rasch Model; whether the items showed any form of differential item functioning (DIF) for gender and whether the marking rubrics had functioned appropriately. The Rasch Unidimensional Models for Measurement (RUMM2030) programme was used to analyse the data.
An analysis of variance (ANOVA) was conducted to identify any differences between the overall mean scores that students obtained on each of the three testing occasions (Field, 2009). To identify if the mean scores in each skill assessed and the overall scores were consistent over the three testing occasions Pearson correlation coefficients (test–retest correlations) were conducted (Field, 2009). Both the ANOVA and Pearson correlation coefficients were conducted using IMB SPSS Statistics 21 (IBM Corp, 2012), at an alpha level of .05.
On the basis of the results obtained from the field trial, a focus group comprised of classroom teachers was conducted. The purpose of this focus group was to identify possible reasons for the items not functioning as expected. The focus group participants were given information (e.g. graphs identifying bias) about the items and asked to suggest reasons as to why the nominated items may not have performed as expected. The field notes were analysed using grounded theory (Charmaz, 2006) to identify possible reasons for the items’ non-performance.
Results
The students could choose the topic on which they would focus at each testing occasion for sections 2 and 3. The most popular topic for occasion 1 was SM (n=125), then HN (n=85) and then JS (n=80). On occasions 2 and 3, HN was the most popular topic (n=125 and 112, respectively), followed by SM (n= 93 and 92, respectively) and finally JS (n= 63 and 67, respectively). The process for analysing the internal structure of the o-Mlit was a top-down approach by first investigating the o-Mlit as a task, then the skills and finally the individual items.
Overall task. The test–retest reliability of the o-Mlit over time was r(143) = .78, p < .00 between occasion 1 and occasion 2 while it was r(192) = .77, p < .00 between occasion 2 and occasion 3. These results indicated that the scores that the students achieved on the o-Mlit were relatively consistent for each testing occasion. The mean scores that the students obtained on each of the three testing occasions (occasion 1: 51.7%, SD: 11.6; occasion 2: 52.3%, SD: 14.0; occasion 3: 57.1%, SD: 14.3) did not vary significantly (F(2, 524) = 0.11, p = .99). Therefore, there was no significant difference between the student ability estimates across the three testing occasions. The chi-square goodness-of-fit index was statistically significant, χ2(509) = 1064, p < .000, indicating a poor fit to the Rasch model, suggesting that the o-Mlit was assessing more than one single underlying dimension. However, it may also have indicated that a high residual covariance among the items and skills which increased the likelihood of a significant result as well as the probability of a poor fit to the Rasch model.
Skills. The students varied in their performance on the skills assessed within the o-Mlit across the three testing occasions. The test–retest correlations ranged from r(271) = .08, for applying between occasion 1 to occasion 2 to r(269) = .65 for locating from occasion 2 to occasion 3 (see Table 3). The internal consistency of each of the skills ranged from relatively poor to relatively good over the three testing occasions, refer to Table 4. For example, applying skill at occasion 1 had a poor Cronbach’s α of 0.02 whereas the communicating skill at occasion 2 showed a good Cronbach’s α of 0.78. For all skills comprising three or more items, the reliability would increase if at least one item was deleted. These results may suggest that some of the items in each scale may be irrelevant, ambiguous or heterogeneous and will be investigated in the item analysis section.
Test/retest reliability for each skill.
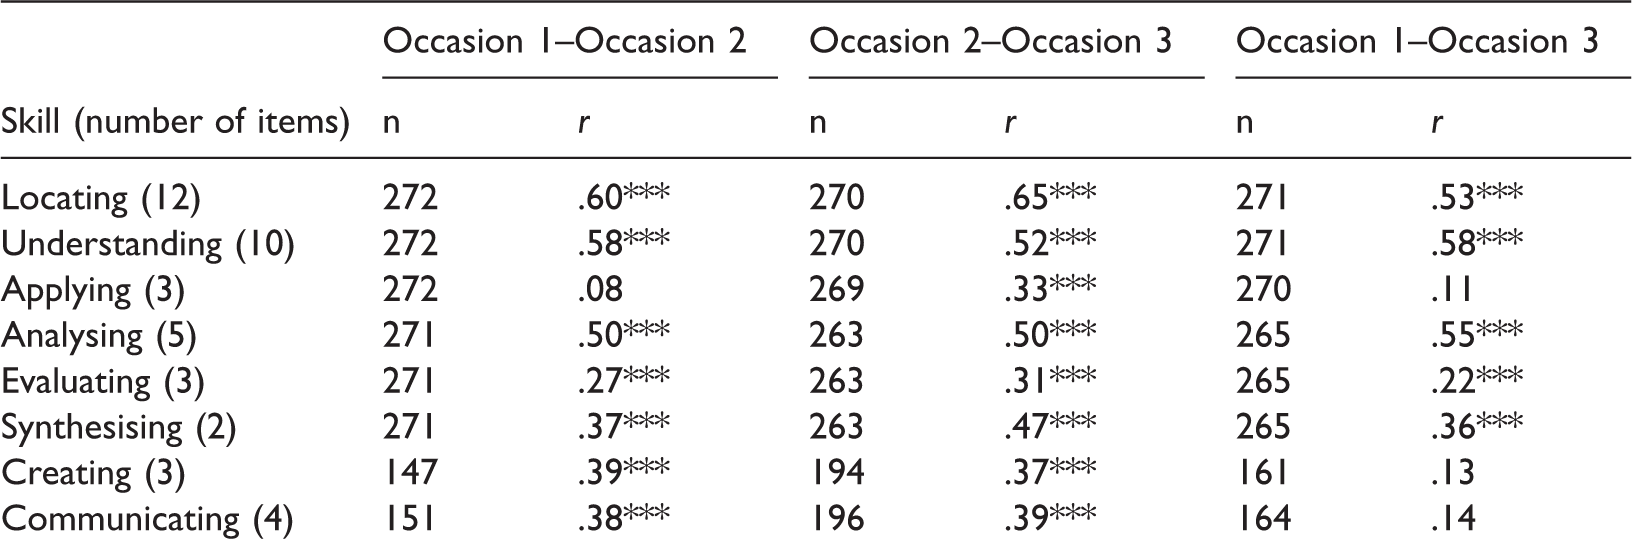
***p<.001.
Internal reliability (α).
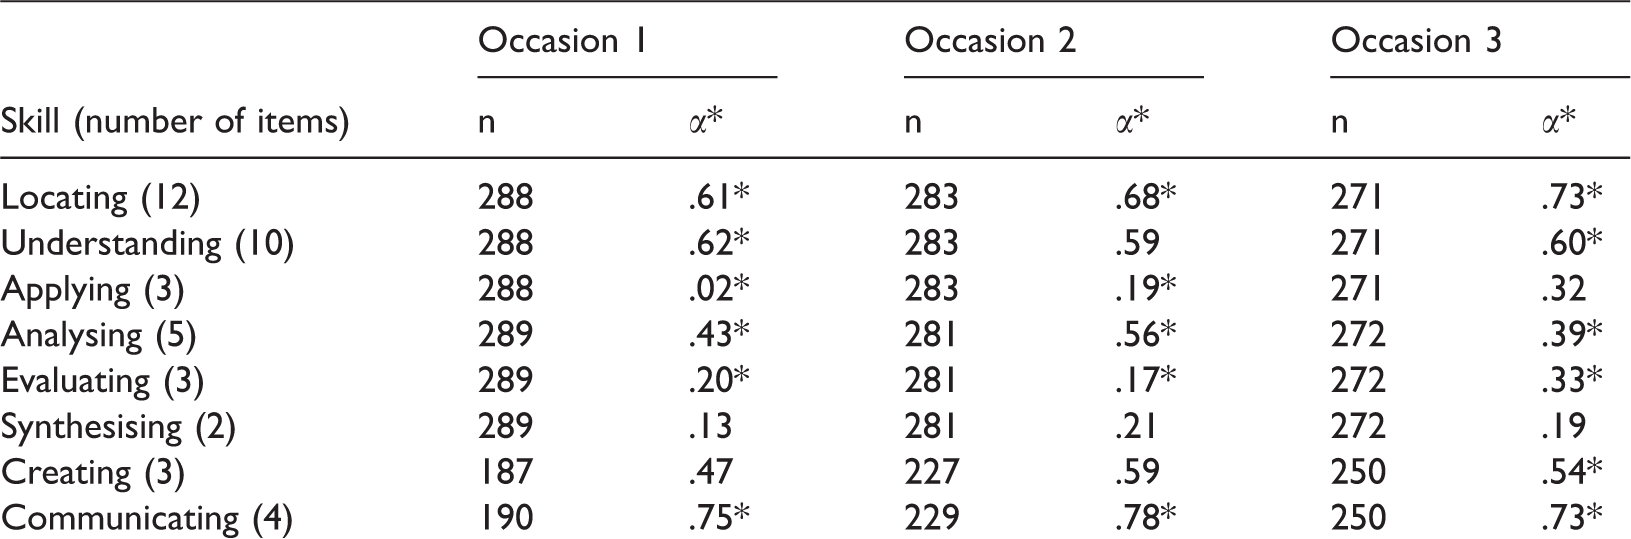
*Increases to α if item deleted.
It was expected that the items that were more cognitively demanding would be further to the right on the developmental continuum (relatively more difficult). Items which assessed the skill of locating would be the least cognitively demanding and, as such, would be to the left-hand end of the developmental continuum. The next most demanding items would be those which assessed understanding, applying, analysing, evaluating, synthesising, creating and communicating being the most difficult (Anderson & Krathwohl, 2001; Bloom, 1956; Churches, 2009; Turcsányi-Szabó, 2012). However, the data did not support this expected ordering of the skills.
Figure 3 shows the difficulty of each skill based on the mean of the item difficulties which assessed each of the skills over the three testing occasion. This figure shows that the order based on cognitive demand (difficulty) followed the expected order up until evaluating. The skills of synthesising, creating and communicating were not in the predicted order but instead were located between understanding and applying in terms of their relative difficulty. In other words, the students did not find these skills more cognitively demanding than those assessing the less cognitively demanding items. This finding suggests that (a) the skills may need to be clarified further in terms of their definition, (b) the items are not assessing these higher order skills and/or (c) the marking rubrics may not be functioning in the way that they were intended to do.
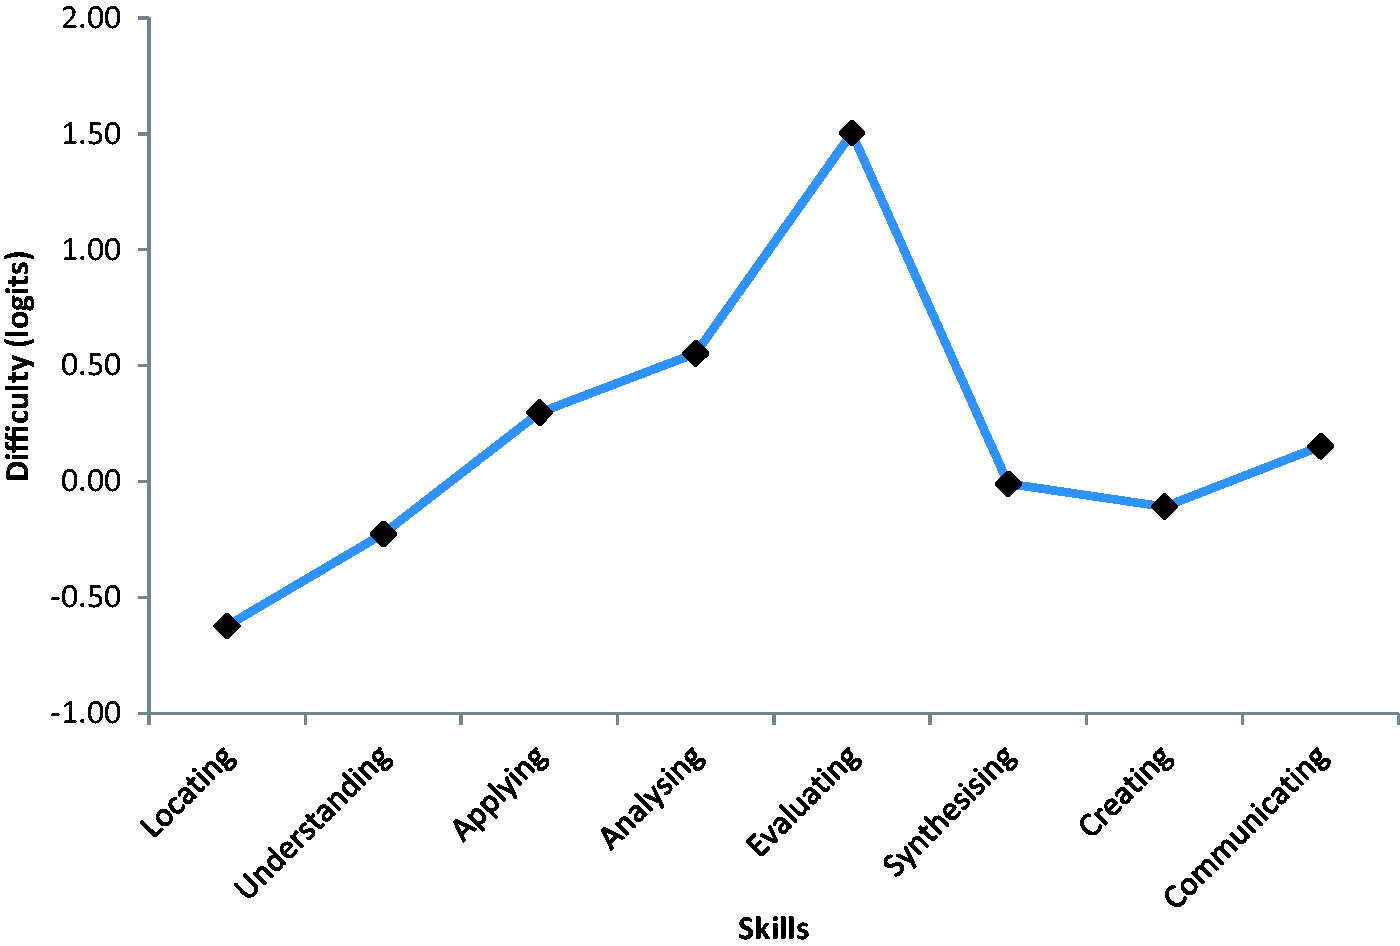
Average skill difficulty.
Items. Table 5 shows the items of the o-Mlit arranged in difficulty order based on their average difficulty across the three occasions. It can be seen that item ‘1a’ is the easiest and item ‘28’ is the most demanding (or hardest) item. Table 5 also shows a number of fit statistics for each of the items on each of the occasions. The Residual-fit Statistic and the Chi-square Statistic give an indication as to how well each item fits the Rasch theory which governs the construction of the scale underpinning the test.
Items in order of mean difficulty with fit statistics from each testing occasion.
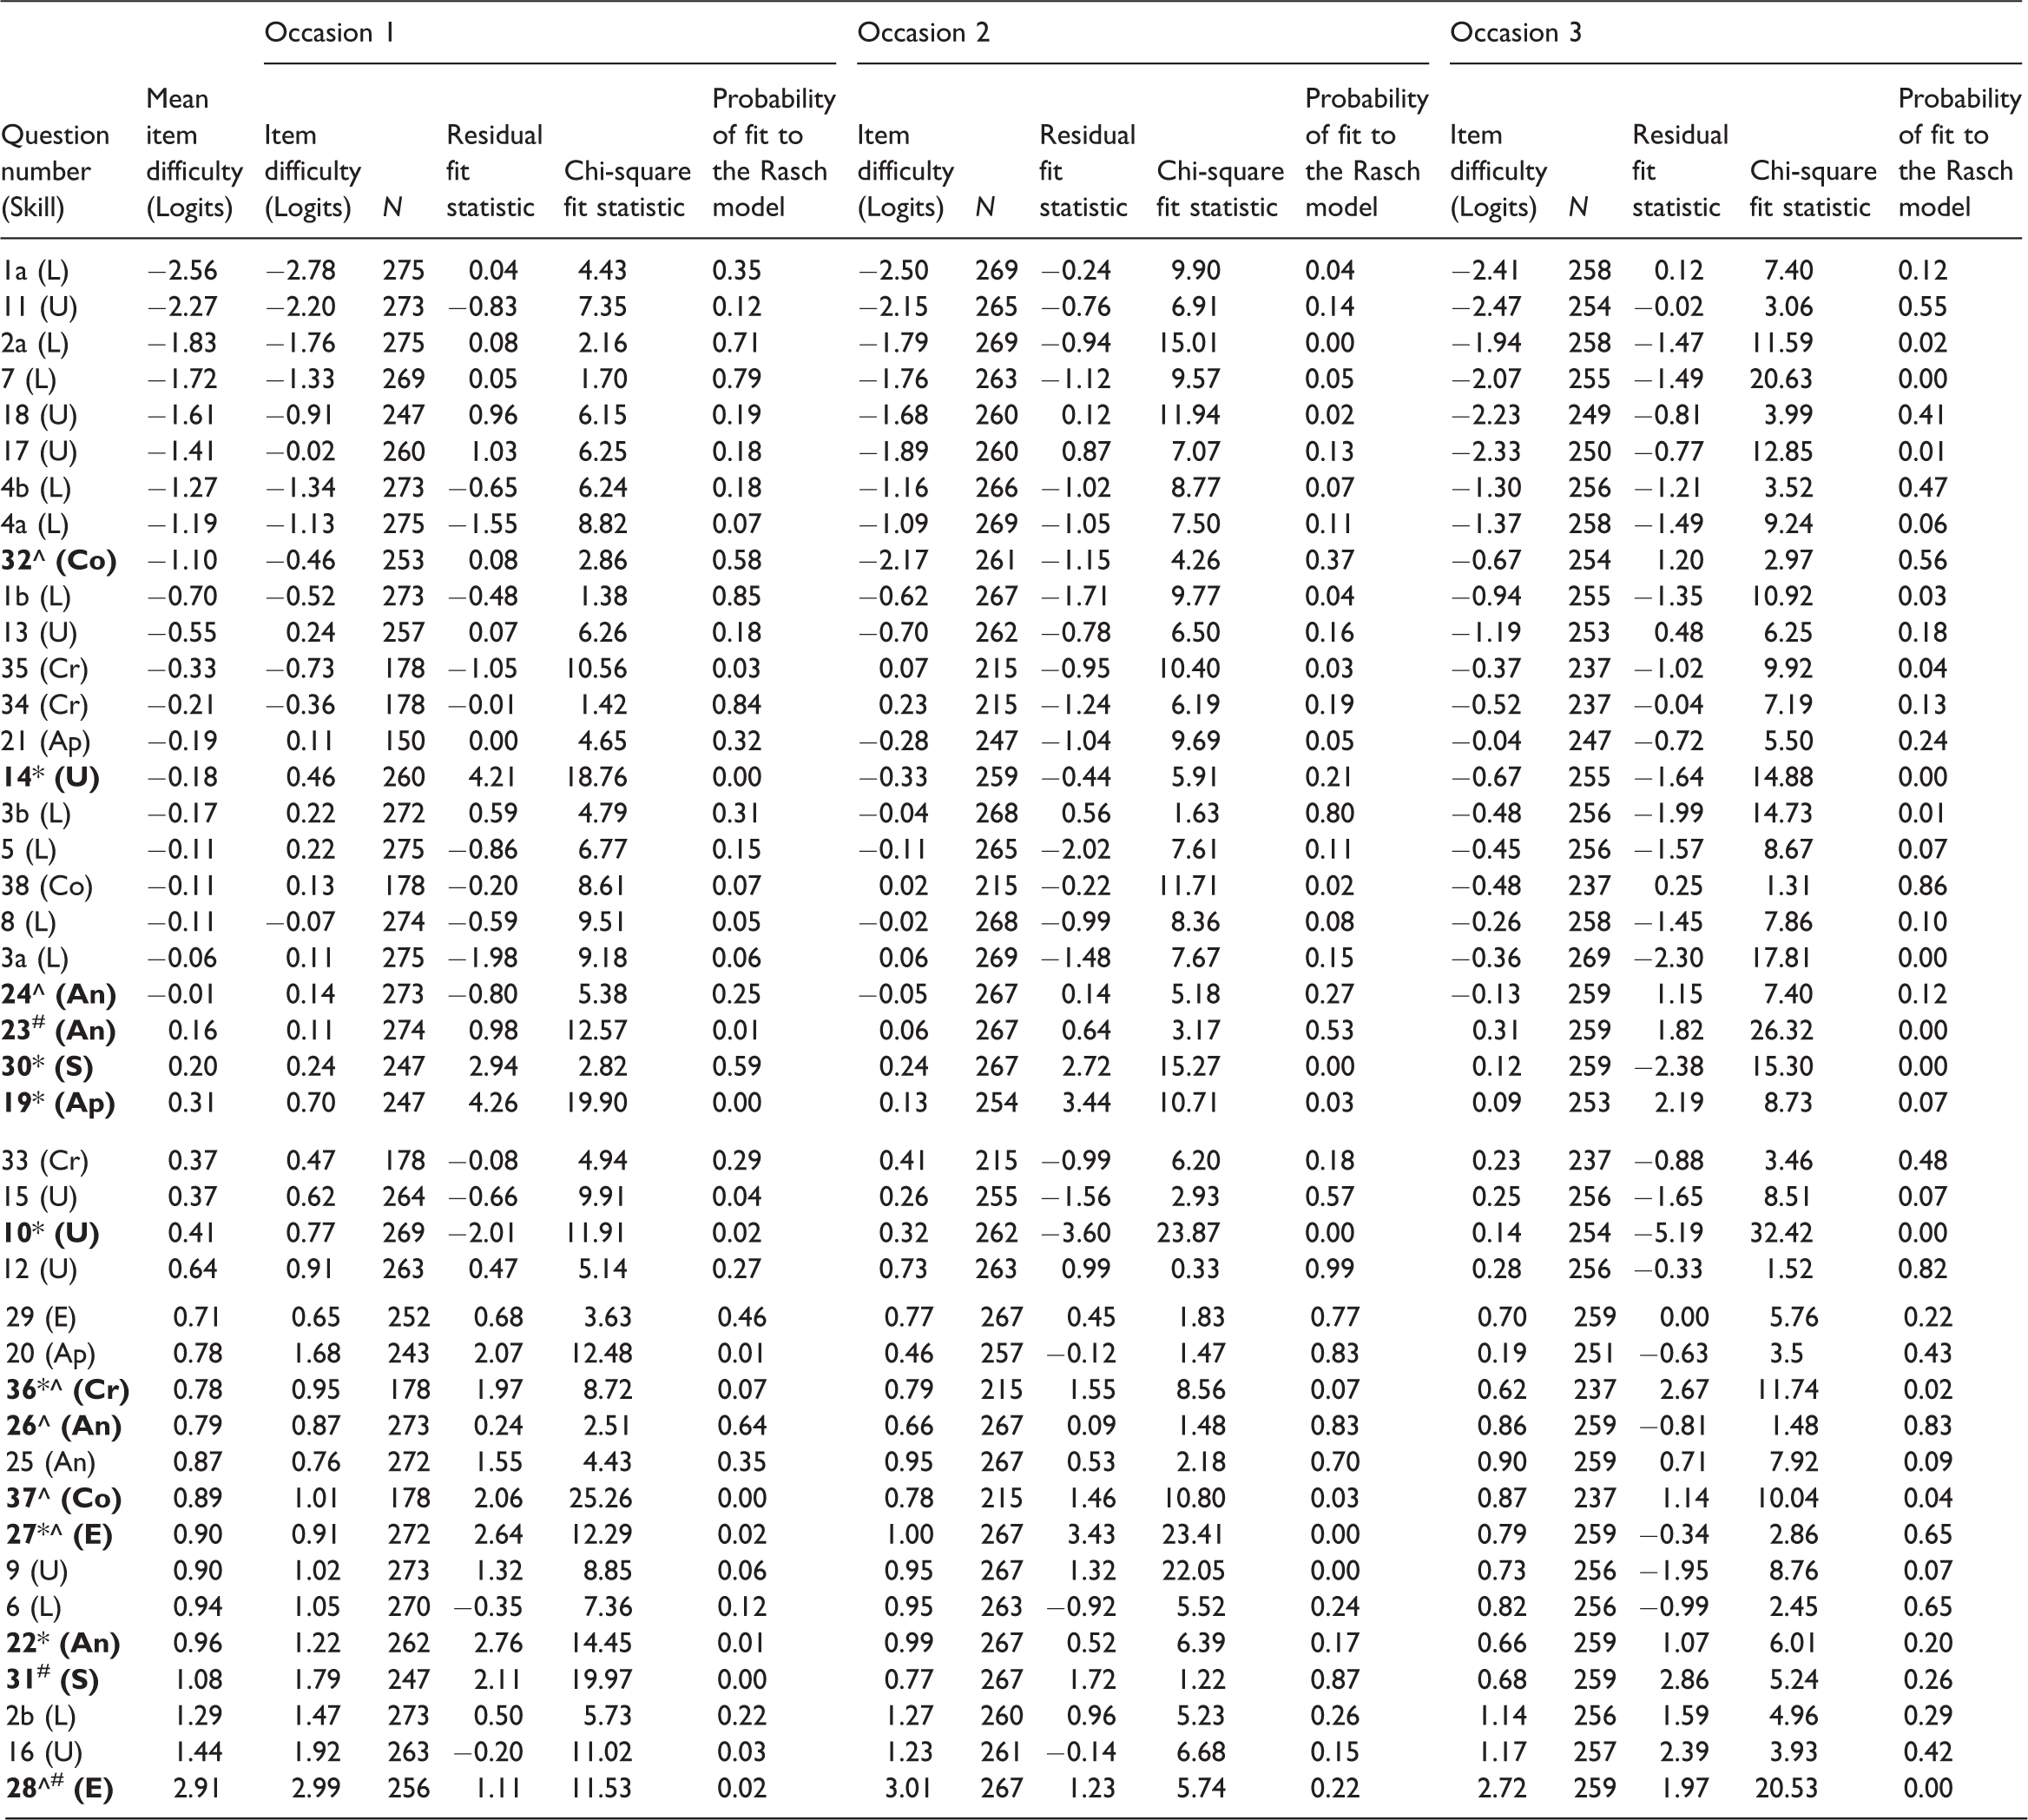
An: analysing; Ap: applying; Co: communicating; Cr: creating; E: evaluating; L: locating; S: synthesising; U: understanding.
*This item has been investigated further as it has violated the fit-residual (± 2.5) and Chi-square probability (<.05).
^This item has been investigated because it has violated both the category probability and threshold order.
#This item has been investigated because there was DIF for topics on all three occasions.
Items with residual-fit statistics greater than +2.5 have discriminated less than what the model would have predicted; those items with fit-residuals less than −2.5 have discriminated better than would have been predicted by the model (RUMM Laboratory Pty Ltd, 2009). From a validity point of view, the question is why are the items under or over discriminating? Chi-square statistics coupled with the probability of fit to the Rasch model gives an indication of how the item fits the Rasch Model. If the probability of fit to the model is less than 0.05, then the question is why is this item not functioning in accord with the model?
Table 5 shows that 14 items (in bold) have violated one or more of the fit criteria. For example, the table shows that item 19 on occasion 1 had the largest positive fit-residual (+4.3). The Item Characteristic Curve (ICC) for this item is shown in Figure 4(a). The ICC gives an indication of what a positive fit-residual looks like in terms of the theory, the solid line on the graph. What is actually occurring is indicated by the dots and shows that the less proficient students have done better on this item than would have been expected and the more proficient students have done a bit worse (i.e. the item under-discriminates). Similarly, the ICC for item 10 on occasion 3 (see Figure 4 (b)) shows an item with a relatively large negative fit-residual (−5.2). The ICC shows that the more proficient students have done better than predicted and the less proficient students have done worse (i.e. the item over-discriminates). The ICCs for item 14 (see Figure 5) on each of the three occasions show how this item has varied in terms of the fit to the model over the three occasions.
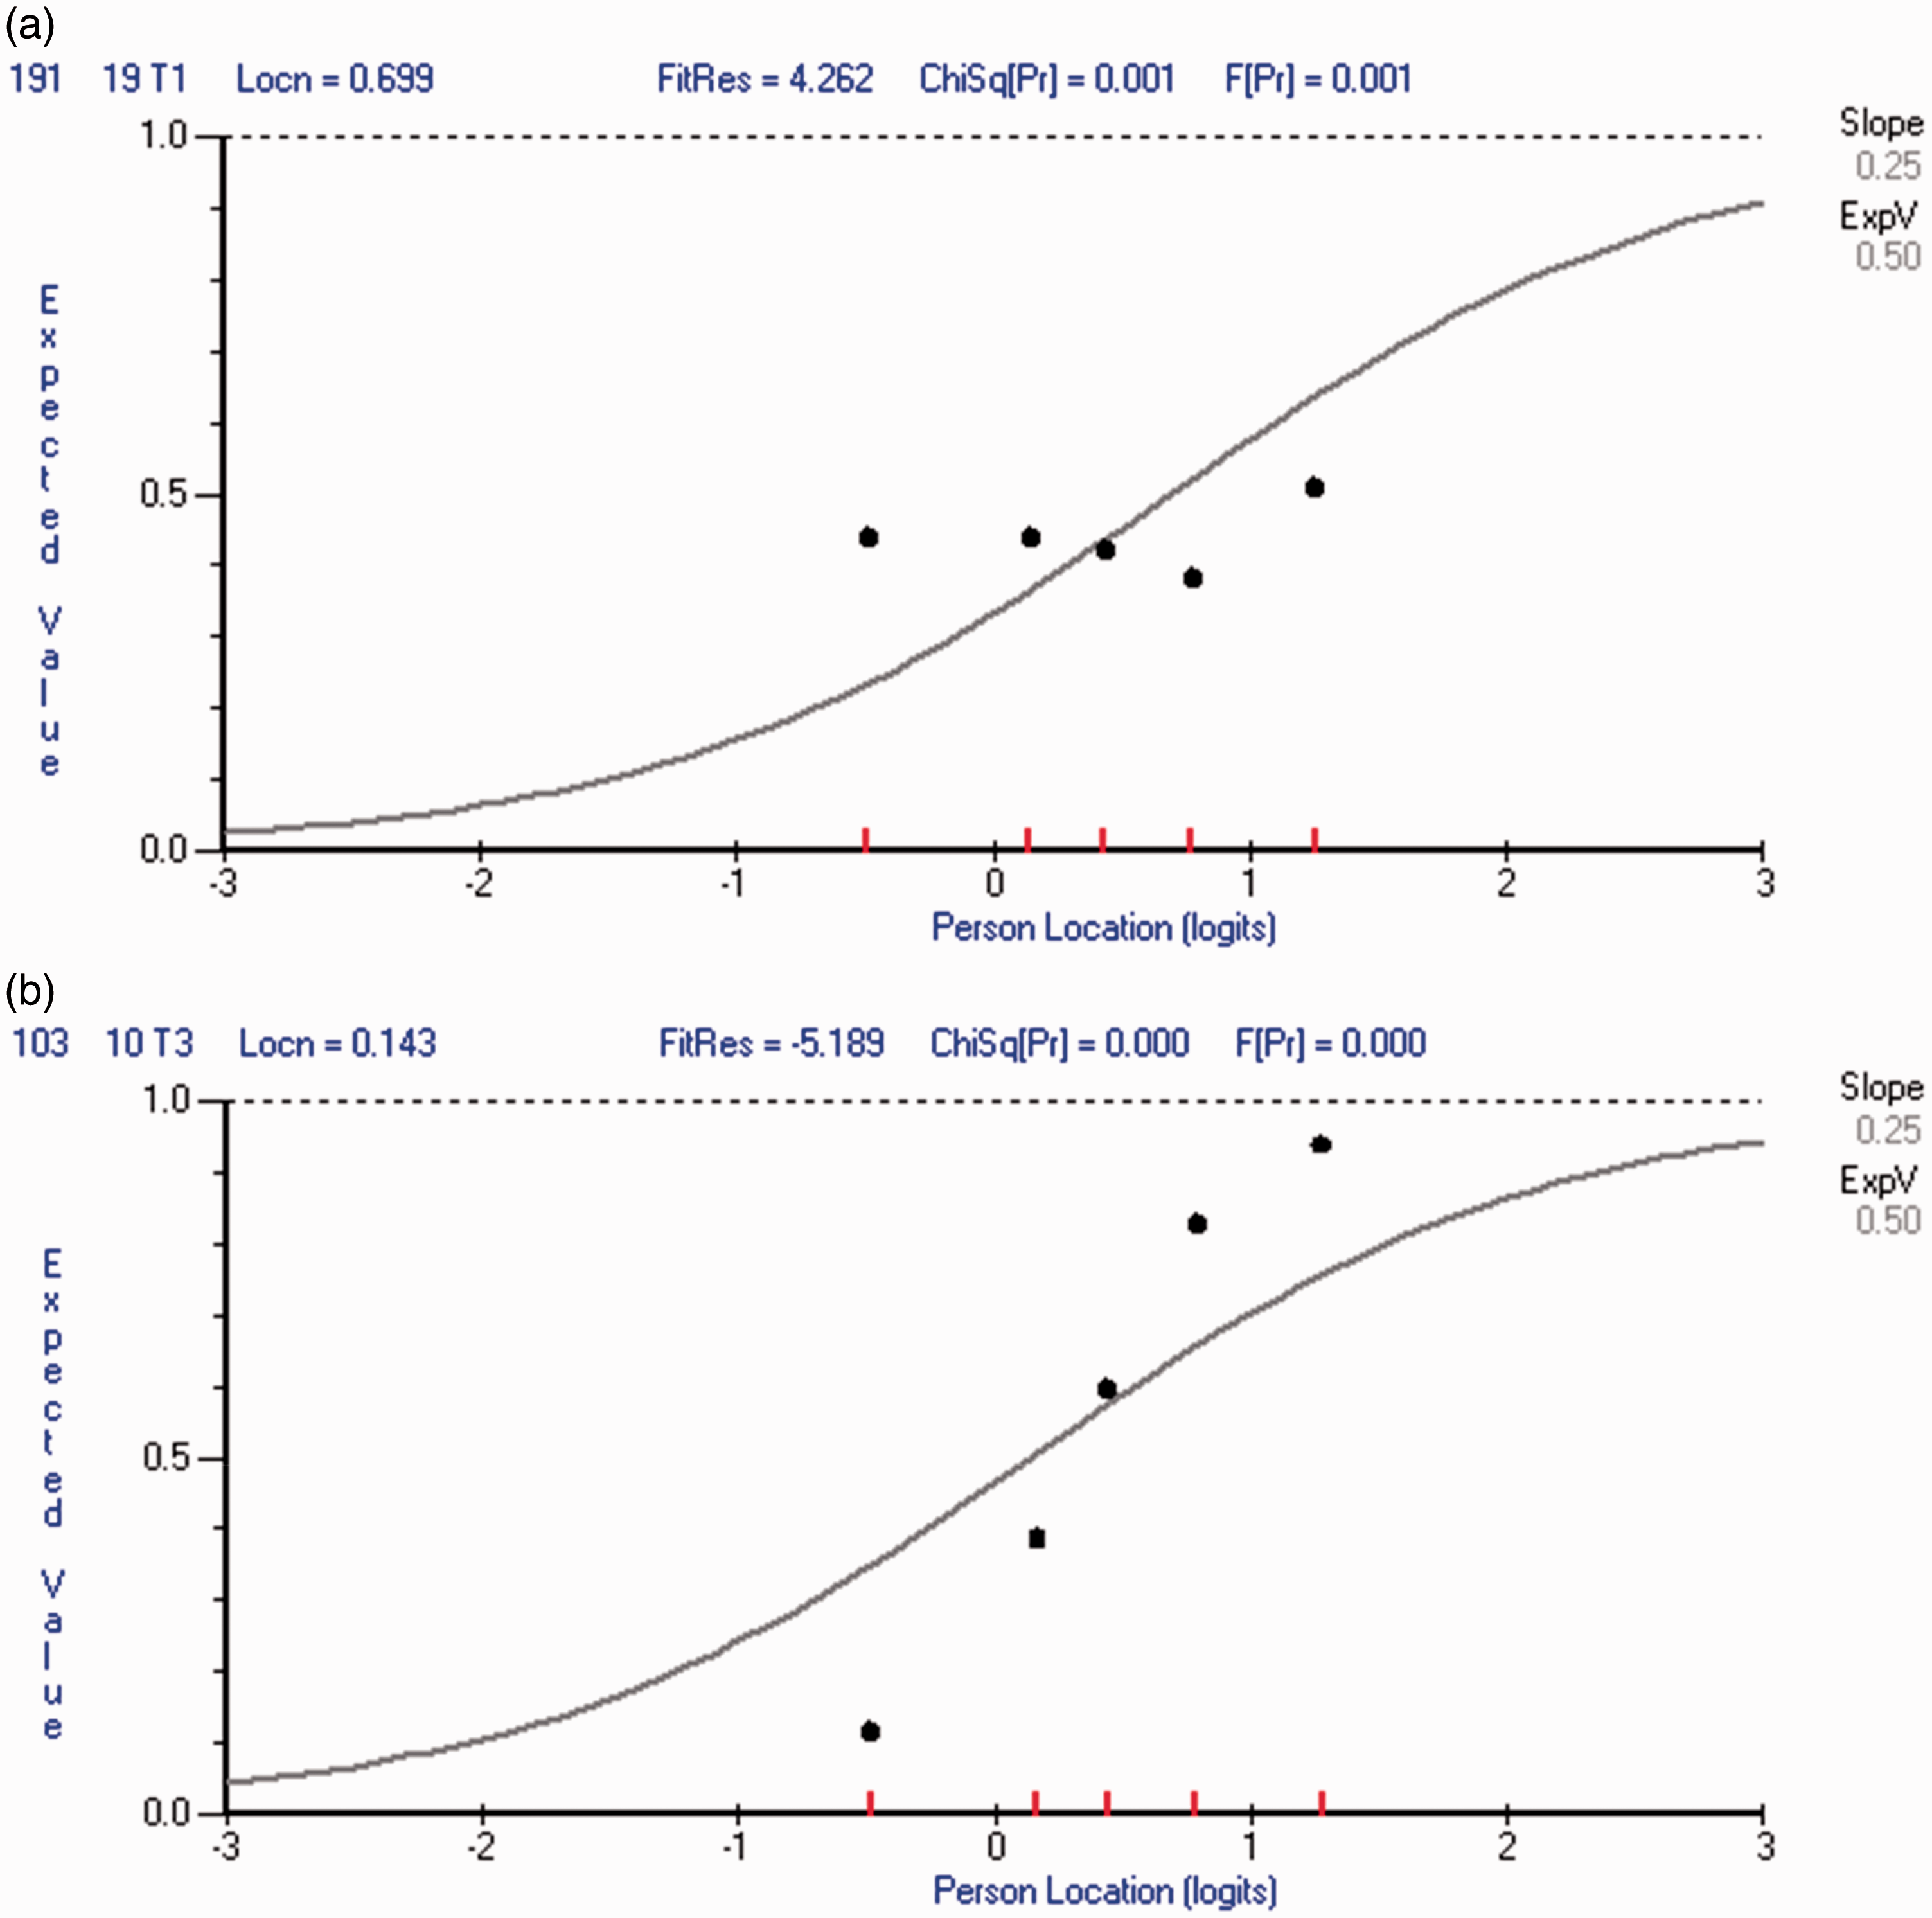
ICCs for Item 19 (a) and 10 (a). (a) ICC for Item 19 occasion 1 and (b) ICC for Item 10 occasion 3.
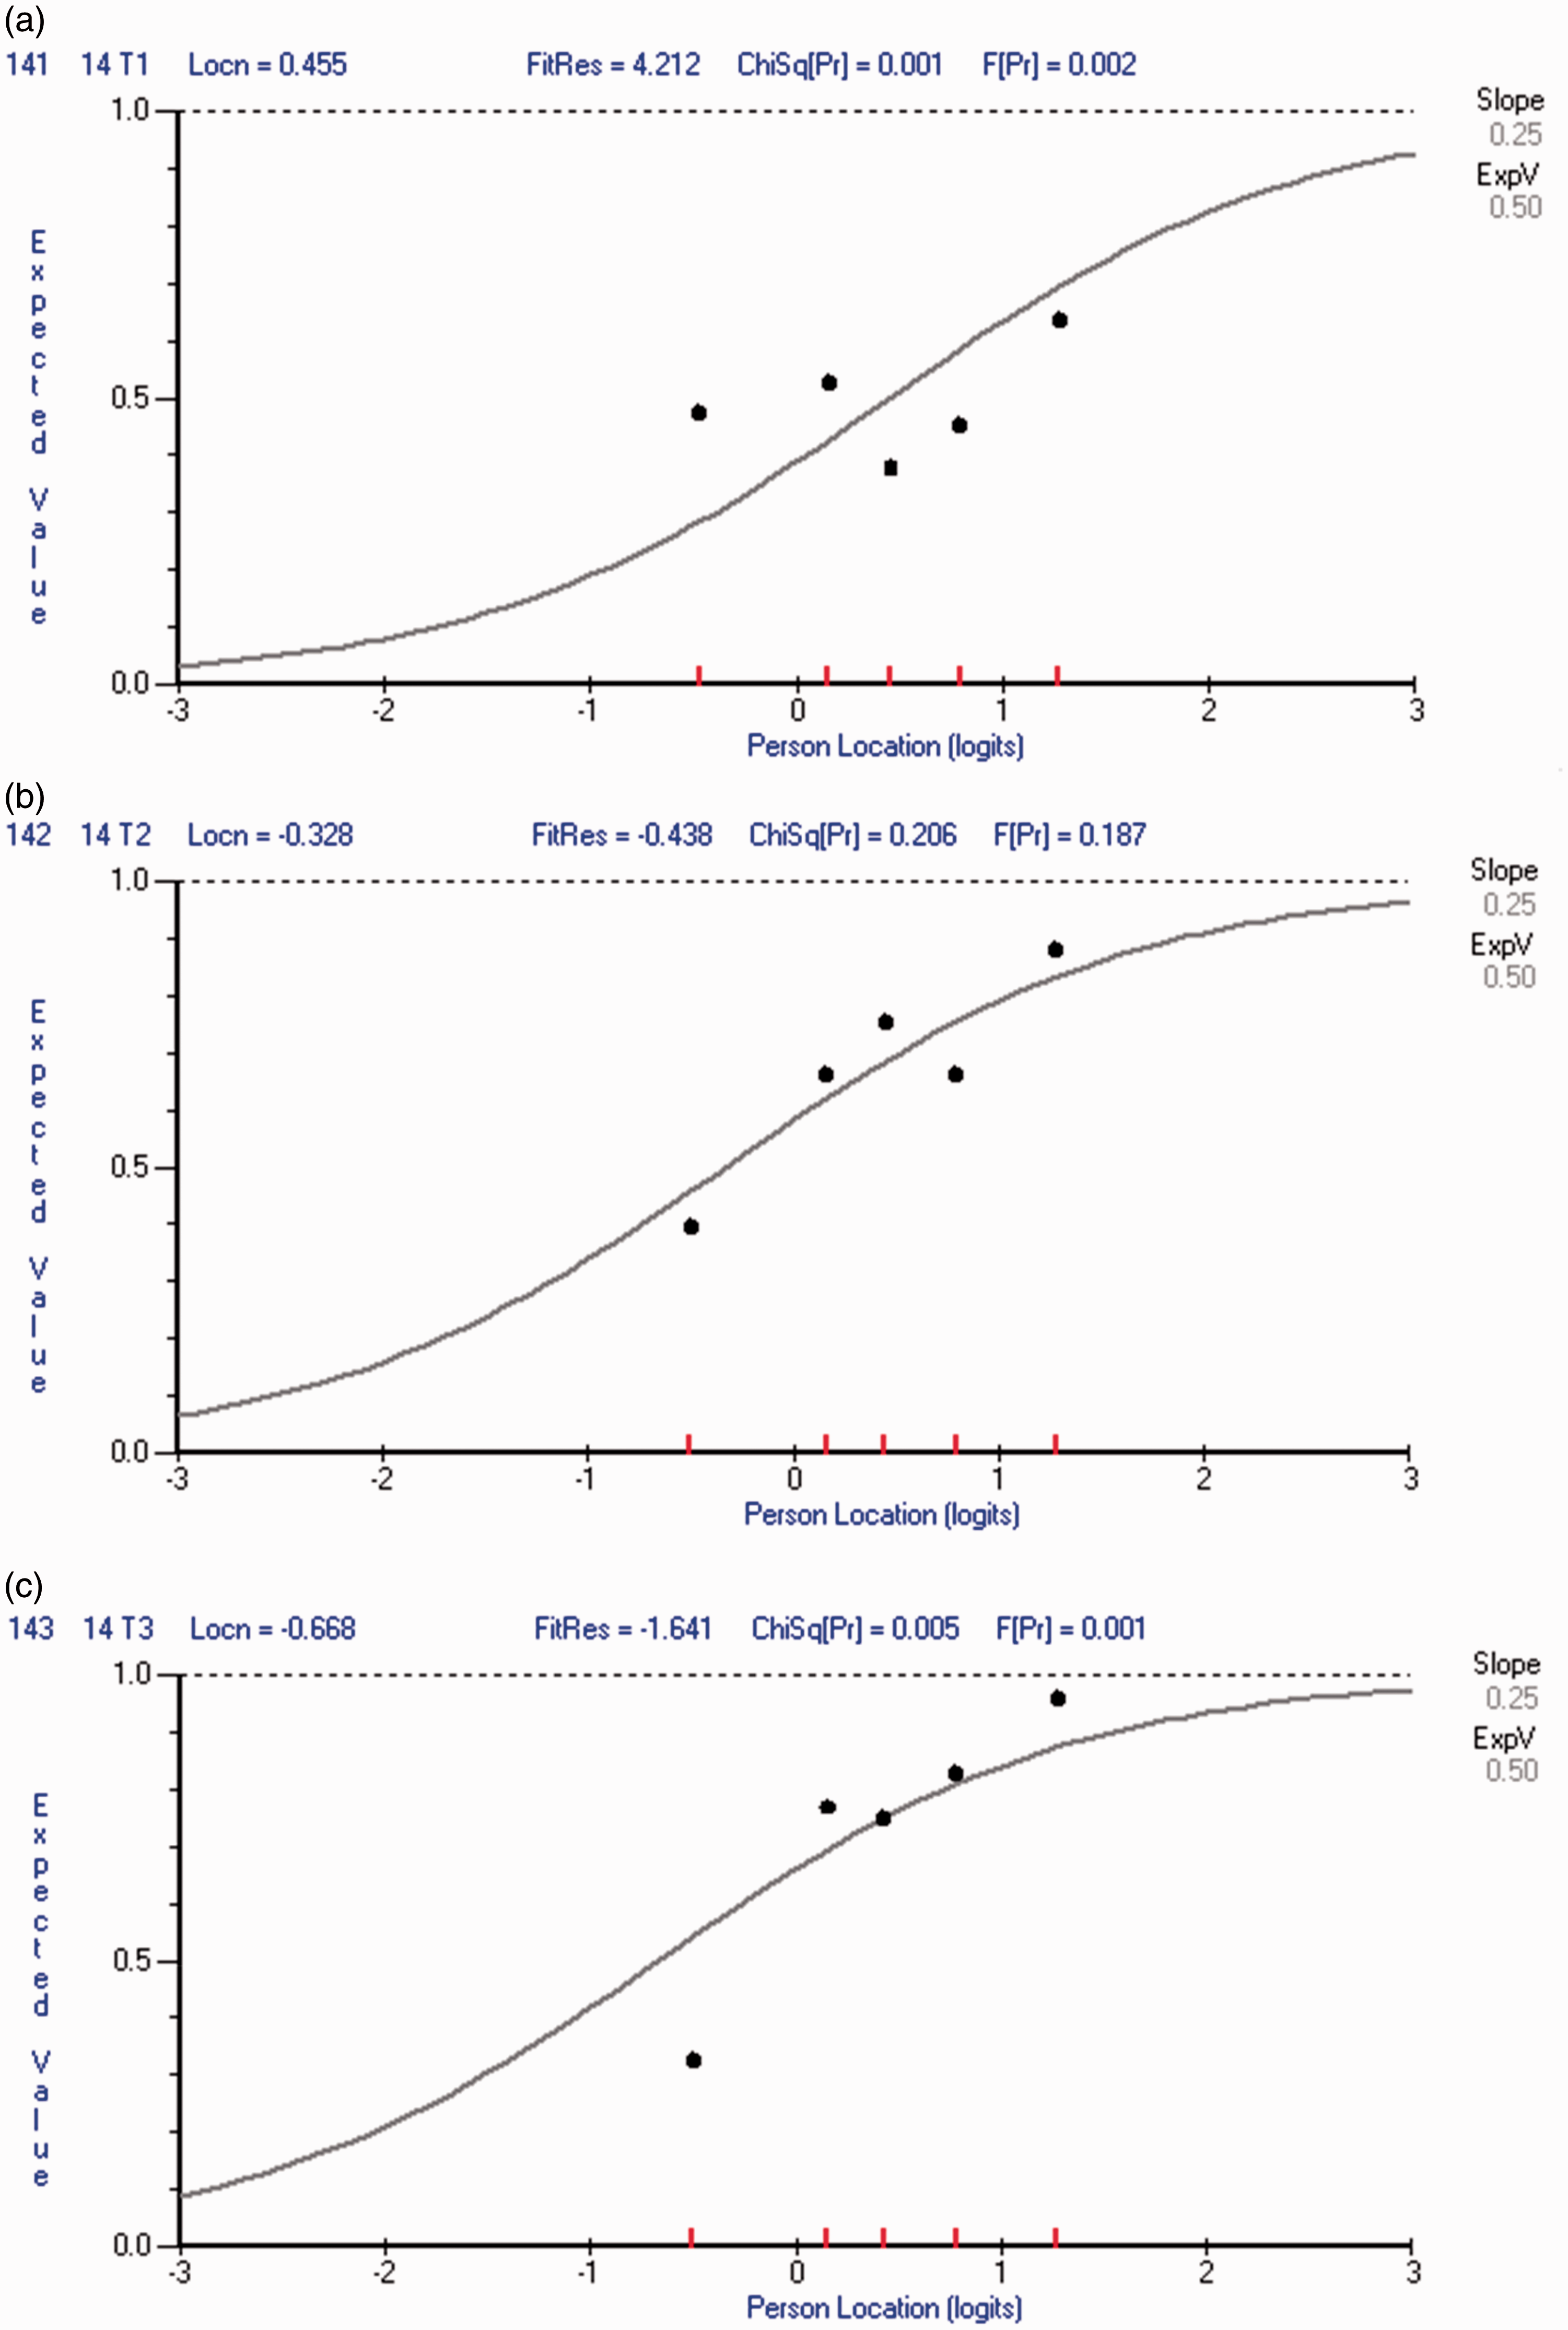
ICCs for Item 14 on occasion 1 (a), 2 (b) and 3 (c).
Six items (24, 26, 27, 28, 32 and 36; refer to Table 5) are not functioning correctly due to issues related to the category probability and threshold disorder. The category probability indicates that scoring categories are not behaving as intended as one or more scores (e.g. a score of 2 out of a possible 4) are not likely to occur. Threshold disorder again indicates that scoring categories are not behaving as intended, in that the probability of scoring a higher mark is easier than scoring a lower mark – for example, scoring 3 out of 4 is easier than scoring 2 out of 4.
In addition, Table 5 shows three items (23, 28 and 31) which are displaying DIF which occurs when the items are not functioning the same way for different groups such as gender, socio-economic status or ethnicity. In this case, DIF has occurred between students doing the different topics – JS, HN and SM. This suggests that these items are not functioning in the same way across topics, which contradicts the intentions of the items writers.
The focus group participants were asked to explore possible reasons where items did not perform as expected (those items in bold in Table 5). Possible reasons that were identified included source material (e.g. text in the source material to difficult), screen layout (e.g. scrolling through the item), differences between topics (e.g. image in one topic easier to interpret than the other two topics), marking guidelines (too many options in the marking criteria) and questions (e.g. not explicit enough to direct the students). Although, there were 14 items that did not perform as expected, some of these items may have had more than one reason for the performing different to expectations.
Discussion
Overall, the o-Mlit had good test–retest reliability. Further evidence of the consistency of performance on the o-Mlit was also provided by the non-significant results of the ANOVA for the mean student scores. The o-Mlit had a relatively poor fit to the Rasch model. This finding implies that the items of the o-Mlit are not functioning in the way that was expected when the test was being constructed. In order to investigate potential reasons for the misfit, the skills and items of the o-Mlit were investigated further using a focus group comprised of classroom teachers who interrogated the functioning of the items using the item analysis provided by the RUMM programme.
When constructing the test, the item writers predicted that the skills represented various levels of cognitive depth which were largely in accord with Bloom’s Taxonomy (e.g. Anderson & Krathwohl, 2001; refer to Figure 3). When the items were constructed, the expectation was that the mean difficulty of the items assessing locating would be lower than the mean difficulty of the items assessing applying. The results supported the original expectations, except for the higher order skills of synthesising, creating and communicating. This finding was unexpected because it has been suggested (Anderson & Krathwohl, 2001; Ash, Clayton, & Atkinson, 2005; Kimber & Wyatt-Smith, 2010) that the cognitive demand of the higher order skills (e.g. creating) is greater than that of the lower order skills (e.g. understanding).
One reason for the unexpected result could be that the items comprising these skills are not assessing the skills adequately and/or it could be that the marking rubrics may not be functioning in the way that they were intended to do, as developing items which assess higher order skills is difficult (Lemons & Lemons, 2013).
The focus group reviewed the higher order items to explore whether it was the construct itself that needed to change as a result of the data or whether the items and marking rubrics were not adequately assessing the higher order skills that they had been written to assess. A number of reasons were identified by the focus group for the differential performance of the non-fitting items, such as DIF between the topics. For example, students who completed the synthesising item using one topic stimulus (e.g. SM) did significantly better than students completing the same item in another topic (e.g. JS).
This contextual effect influences the validity of the test and as such needs to be addressed, particularly if the original item writers were of the opinion that the items difficulties should not vary with context. Therefore, the homogeneity between topics needs to be improved (Griffin & Care, 2014). Another synthesising item has issues related to the marking rubric. In this case there were too many options within one grade for the markers to be aware of when marking. This increase in complexity for the marker leads to a decrease in accuracy; therefore, influencing the validity of the decision made from the item (Griffin & Robertson, 2014).
The overall view of the focus group was that the test has assessed the lower order skills of multiliteracy quite well. However, the challenge is to construct items that are better assessing the higher order skills under test conditions in a multimodal environment. This challenge begins with how the higher order skills are defined, as a broad definition may increase the heterogeneity of the item.
There are a variety of terms used that are described as higher order skills such as transfer, critical thinking and problem solving (Brookhart, 2010); inventive thinking skills, which includes ‘higher order thinking and sound reasoning’ (Abdullah & Osman, 2010); higher order reading skills (Afflerbach, Cho, & Kim, 2015); articulated learnings (Ash et al., 2005); problem-solving taxonomy (Barak, 2013). However, these terms all include skills associated with each other and multiliteracy for example – critical thinking skills include applying, analysing, evaluating and communicating; higher order thinking skills involves locating or recalling, applying, analysing, evaluating and synthesising. What is required is a clear definition of the skills underlying these various higher order skills in order to develop sharper and more cognitively demanding items which tap into these constructs (Fitzpatrick & Schulz, 2015).
One of the limitations of this study is the desirability to assess students’ computer skills to investigate how that impacts their ability to navigate the online assessment. Having poorer computer skills will negatively impact the students’ ability to navigate and complete the online assessment, as observed in the pilot study; therefore, future studies will take students computer skills into account. Future studies will also increase the numbers of participating students to increase the generalisability of the findings. Through improvement of poor performing items, increasing the cognitive demand of the items assessing higher order skills (synthesising, communicating and creating) and further testing this will improve the overall functioning of the o-Mlit. Future studies will also focus on the relations to other variables (e.g. literacy skills) as well as the information in terms of diagnostics that the o-Mlit can provide.
Conclusion
The o-Mlit is based on a conceptual model of multiliteracy skills with the purpose of assessing each of these skills to provide teachers with knowledge about each student’s performance. As outlined in the introduction, where the purpose of assessment is to make inferences about student learning it is important that the assessment data on which these inferences are made are valid. The objective of this study was to examine the construct validity of the o-Mlit by obtaining evidence regarding response processed and the internal structure of the instrument.
In general, the evidence presented in this article indicates that the o-Mlit is assessing the lower order skills effectively. However, some evidence suggests that the items designed to assess the higher order skill, namely, synthesising, communicating and creating have not functioned as expected. This may be due to either the fact that items are not assessing the higher order skills or that a clearer definition of what these higher order skills mean in the context of multiliteracies in order to write items which better tap into these skills.
In addition, the analyses showed that some of the items did not function in accordance with the measurement model that has governed the construction of the assessment and would need to be rewritten. However, the analyses presented in this article indicate that a big step forward has been made with the development of the o-Mlit towards assessing multiliteracies which are an important element in mastering the multiple forms of media and communication in the 21st century.
Footnotes
Declaration of conflicting interests
The author(s) declared no potential conflicts of interest with respect to the research, authorship, and/or publication of this article.
Funding
The author(s) disclosed receipt of the following financial support for the research, authorship, and/or publication of this article: This research was supported in the form of an ARC Linkage Grant with Pearson Foundation (LP 110200537).