
Abstract
There is widespread concern about the reduction in the number of students in Australia studying calculus-based mathematics courses in the final year of secondary education. Over the last 20 years in New South Wales, we have seen a dramatic increase in the number of students studying general mathematics in place of calculus courses. The concern arises because students graduating from high school with no calculus are often not well equipped for many aspects of university-level study. This paper explores one potential reason for this in New South Wales, namely the scaling algorithm used to derive the Australian Tertiary Admission Rank. At a time when we are encouraging students to study higher mathematics, this paper contributes to the discussion by illustrating some empirical evidence, based on an analysis of published output from the application of the scaling algorithm used to derive Australian Tertiary Admission Ranks, as to why students may be opting for lower level mathematics at the Year 12 level in great numbers.
Keywords
Introduction
Concern has been expressed regarding the declining number of students who take advanced calculus-based mathematics courses at the senior secondary school level. One of the reasons suggested for this development is the possibility that current scaling algorithms used to determine rankings for university admission—such as the Australian Tertiary Admission Rank (ATAR)—might disadvantage students who take some of the advanced mathematics courses. In this article, this question is explored by using data from a cohort of students in New South Wales (NSW), Australia. Data available for the students in this cohort include performance on the School Certificate (SC) Test in mathematics in Year 10 as well as their Year 12 Higher School Certificate (HSC) performance in either the HSC general mathematics or the calculus-based HSC mathematics course.
In this article, the appropriateness of the current scaling algorithm for HSC general mathematics and HSC mathematics is reviewed by comparing the differences in results obtained by students in these two groups between their SC Test in Mathematics and their scaled score obtained for their chosen HSC course in mathematics. This article begins with a discussion of some background in terms of relevant literature and information regarding the pertinent examination and scaling processes in the NSW secondary school system. Then, the research question is presented followed by a description of the data analysed and a detailed discussion of the method of analysis and results.
Background
The main tenet of this article is that students may choose easier mathematics courses to optimise the scores that are used in the university admissions process to keep open as many options for tertiary study as possible. In order to provide a context for this exploration, some related issues are discussed in this Background section. They include the benefits of studying mathematics through to the completion of secondary education and the decline in students taking mathematics and in particular higher level mathematics courses through to the final year of secondary education. To provide some background to the data that have been analysed in this article, information is also provided in this section on the Year 10 SC Test in Mathematics, the ATAR, and the approach to scaling marks from the NSW HSC examinations and moderated assessments usually occurring in Year 12 and used to produce the ATAR.
The benefits of studying mathematics through to completion of secondary education
Chinnappan, Dinham, Herrington, and Scott (2008) described participation in mathematics, and in particular higher level mathematics, as essential background for people wanting to develop the skill set necessary to be scientifically literate in the workforce. Lemaire (2003) wrote that mathematics, as a key enabler for science, engineering, and technology is critical for ongoing advances in communications, bioinformatics as well as probabilistic and statistical analysis. Since 2003, when these comments were made, the importance of mathematics has grown in many ways. We have witnessed an explosion in the volume of big data now available to analysts and the possibilities this creates for advances in many areas of commerce including marketing. The economics and finance disciplines have become increasingly technical with mathematical and statistical theories and models now a fundamental part of much of the research in these fields. In a 2012 report to the Prime Minister by the Australian Chief Scientist (Office of the Chief Scientist, 2012), the importance of mathematical and scientific study by secondary students was raised. This has led to numerous articles in various newspapers about the importance of mathematical studies.
Barrington (2006) reports a significant decline in the participation in Year 12 mathematics across the period from 1995 to 2004 in Australia. Mack and Walsh (2013) produced a series of tables showing the proportion of the corresponding Year 8 cohort who completed various mathematics and science combinations for the HSC over the period 2001–2011. They split their analysis by gender. They observe a substantial decline in the proportion of students taking at least one mathematics course and at least one science course as part of their HSC examinations. In 2001, there were 19.7% of males and 16.8% of females from the corresponding Year 8 cohort taking at least one mathematics and one science course in the HSC. In 2011, these had dropped to 18.6% and 13.8%, respectively.
Johnston (1994) in an interesting contribution entitled Choosing Mathematics “You need it even if you don't want to do it,” reported on an interview study into the attitudes of senior female students toward mathematics attending six different schools across Queensland and Victoria. The students who were less enthusiastic about mathematics commented, quite uniformly, about the need to study mathematics regardless of what career they were planning to pursue. It was seen as a necessary elective for keeping their options open. In a time of HSC or equivalent school course university prerequisites, enrolment in courses in mathematics was seen as an indicator of a hardworking student with an ability to analyse complex situations with a clear thinking and logical mind. When this study from two decades ago is reflected upon alongside current university entrance requirements, which are predominantly ATAR based, we see evidence of a shift in the approach to course selection in the final years of high school.
Reduction in the number of students studying mathematics, and in particular higher level mathematics, for the NSW HSC
In addition to the need for mathematics as preparation for diverse areas of later study, there is also evidence that higher level study of mathematics at school leads to increased success in the early years of tertiary study in some disciplines. Many articles have reported on the reduction in the number of Australian students studying calculus as part of their Year 12 examinations (see e.g., Wright, 2007). Mallik and Varua (2008) demonstrated that prior study in calculus was a significant predictor of greater success in the study of first year level economics. Their study, based on results from students at the University of Western Sydney, also provided evidence of higher dropout rates among students who had not taken calculus-based courses as part of their HSC. They controlled for other variables such as ATAR, attendance, and gender using ordinary least squares (OLS) regression methodology. In recent years, some universities have decided to award bonus points, applied as a numerical addition to the ATAR, for students who have performed well in HSC courses that are relevant to particular university degree programs for which they have applied. For example, some universities offer bonus ATAR points for students who have performed in the top 30% (approximately) of a higher level calculus-based course. Despite the use of these bonus points, most NSW university programs do not include hard prerequisites on particular courses that must be studied for the HSC in order to gain entry to the relevant program.
Statistics are reported by the Board of Studies, Teaching and Educational Standards (BOSTES) in NSW on the courses taken by students as part of their HSC. In 1993, around 35,000 students studied calculus-based mathematics for their HSC. In 2013, this had dropped to just under 20,000 students. With a relatively stable total Year 12 cohort size over this period and the trend in enrolments in mathematics from year to year being broadly consistent, there is a clear and strong message from students and teachers that higher level mathematics study is not the preferred option for the HSC for as many students as it used to be some 20 years ago.
The SC Test in mathematics
The SC was a qualification awarded to NSW students on successful completion of a sequence of studies normally finished during Year 10. In order to be awarded this certificate, students needed to study courses that met the mandatory curriculum requirements, as well as sitting external tests in English, mathematics, science, Australian history, geography, civics, and citizenship and computing skills. The SC was awarded for the last time in NSW in 2011. The reasons for discontinuing the SC were many and included the belief that it did not adequately prepare students for Years 11 and 12, that it did not sufficiently challenge the more able students and that the external examination structure used was poorly timed, given the commitments of students during their Year 10 studies.
In this article, we will use the results from the external Year 10 SC Test in mathematics as a baseline in order to compare to the Year 12 scaled scores of the general mathematics HSC exam and to the more rigorous (2 Unit) HSC mathematics, calculus-based exam. It is therefore useful to review briefly the contents of the typical Year 10 SC Test in mathematics. The test gave students 5 min of reading time and 2 h of working time. It was divided into two sections. The first section was to be completed in 30 min without the use of a calculator. The second section was to be completed in 1 h and 30 min and a scientific calculator could be used. Section 1 contained 25 short answer questions. Section 2 contained 50 multiple choice questions, five questions, each with subparts, requiring students to indicate if statements were correct or incorrect and four short answer questions again each with subparts. The topics covered by the test included arithmetic, algebra, coordinate geometry, graphs, motion, number line, number patterns, plane and solid geometry, probability, ratios, statistics, and time (see http://www.boardofstudies.nsw.edu.au/rosa/sc/sc_mathematics.html for past tests). The test therefore gives an overall assessment of students' level of understanding of fundamental ideas from mathematics up to Stage 5 of the NSW syllabus (i.e. Years 9 and 10) without an emphasis on particular routines or methods studied in the courses.
HSC general mathematics and HSC mathematics
As stated previously, the current study compares the performance of students on the Year 10 SC Test in Mathematics with their estimated scaled score obtained for their Year 12 mathematics study in two different courses. The two Year 12 HSC mathematics courses to be compared are the HSC general mathematics and the HSC mathematics course. HSC general mathematics covers financial mathematics: earning and investing money, taxation, credit, loan repayments, and depreciation; data analysis: statistics and society, collecting data, displaying univariate and bivariate data, summary statistics, correlation, and the normal distribution; measurement: units of measure, area–volume, similar figures, right-angled triangles, trigonometry, and spherical geometry; probability: language of chance, relative frequency as a probability estimate, multistage events, and related applications of probability; algebraic modeling: basic skills and techniques and modeling both linear and nonlinear relationships. The HSC mathematics course covers arithmetic and algebra, plane geometry, probability, functions, trigonometry, series and their applications, differential and integral calculus involving polynomial, rational, exponential and logarithmic and trigonometric functions, applications of calculus to calculating areas and volumes, to locating maxima and minima of functions as well as the physical world. Syllabus documents are available for both courses at http://www.boardofstudies.nsw.edu.au/syllabus_hsc/. It is clear, even without studying the detailed syllabus information that the HSC mathematics course is at a significantly higher level in terms of mathematical rigor, reliance on an understanding of earlier studies, and degree of abstraction than the HSC general mathematics course.
The ATAR and the approach to scaling marks from the NSW HSC examinations used to produce the ATAR
Scaled course scores and overall HSC standardized scores for the maximum and various percentiles for HSC general mathematics and HSC mathematics from the Report on the Scaling of the 2013 NSW Higher School Certificate.
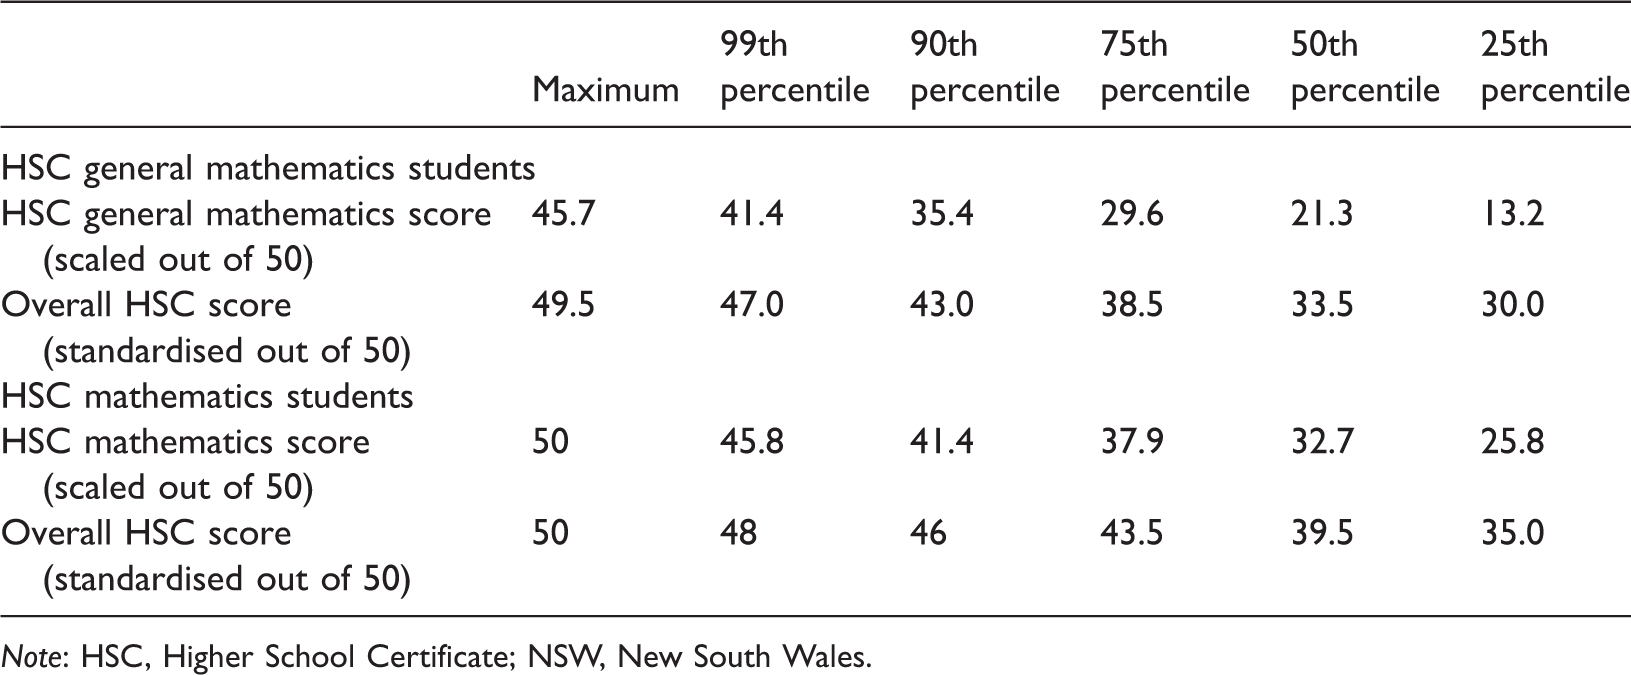
Note: HSC, Higher School Certificate; NSW, New South Wales.
Research question
Recently, a number of high school teachers, students, and academics across NSW have questioned the suitability of the scaling process used in the calculation of the ATAR which is the measure used in the admission process to Australian universities. The results of a recent survey of its members by the Mathematical Association of New South Wales (MANSW) illustrate this point. Details of the survey and a full report can be found at http://www.mansw.nsw.edu.au/resources/public-resources/2013-secondary-mathematics-teacher-survey-report. Of more than 1000 mathematics teachers surveyed, 51% believed that some students in their school were selecting senior mathematics courses below their capability. Of those surveyed, 565 teachers provided a total of 1187 reasons for students choosing a mathematics course below their capability. A desire to optimise HSC and ATAR results was the most common reason given and was cited over 200 times by these teachers.
By the way of background to the output from the scaling algorithm, we repeat some information provided in the Report on the Scaling of the 2013 NSW Higher School Certificate (see http://www.uac.edu.au/documents/atar/2013-ScalingReport.pdf) in Table 1. The information in Table 1 shows the scaled mark (out of 50) and underneath the HSC mark (also out of 50) obtained by students at the top, at the 99th percentile (P99), at the 90th percentile (P90), at the 75th percentile (P75), at the 50th percentile (P50), and at the 25th percentile (P25) in each of the two courses HSC general mathematics and HSC mathematics.
From Table 1, it can be observed that a student performing at the 90th percentile of HSC general mathematics is awarded a scaled score (of 35.4) approximately equal to a student in HSC mathematics performing at the 60th percentile (between 32.7 and 37.9) or perhaps slightly better than this. Given that teachers and students have historically regarded HSC general mathematics as the option for weaker students, this may appear to give those weaker students an unfair advantage relative to those who take the HSC mathematics course. Of course, it is possible that students who perform well at mathematics are opting to take the easier HSC general mathematics in order to free up time for other courses which interest them more and the above scaled marks may accurately reflect the relative performance of the two groups of students. We investigate this question in this article.
It is, therefore, of interest to compare the marks obtained by students in the Year 10 SC Test in Mathematics with their estimated scaled marks obtained at the completion of their Year 12 studies. We examine whether the relationship between these two numerical measures of performance is the same or different for students who choose HSC general mathematics compared to those who choose HSC mathematics.
Summary statistics for cohort data.
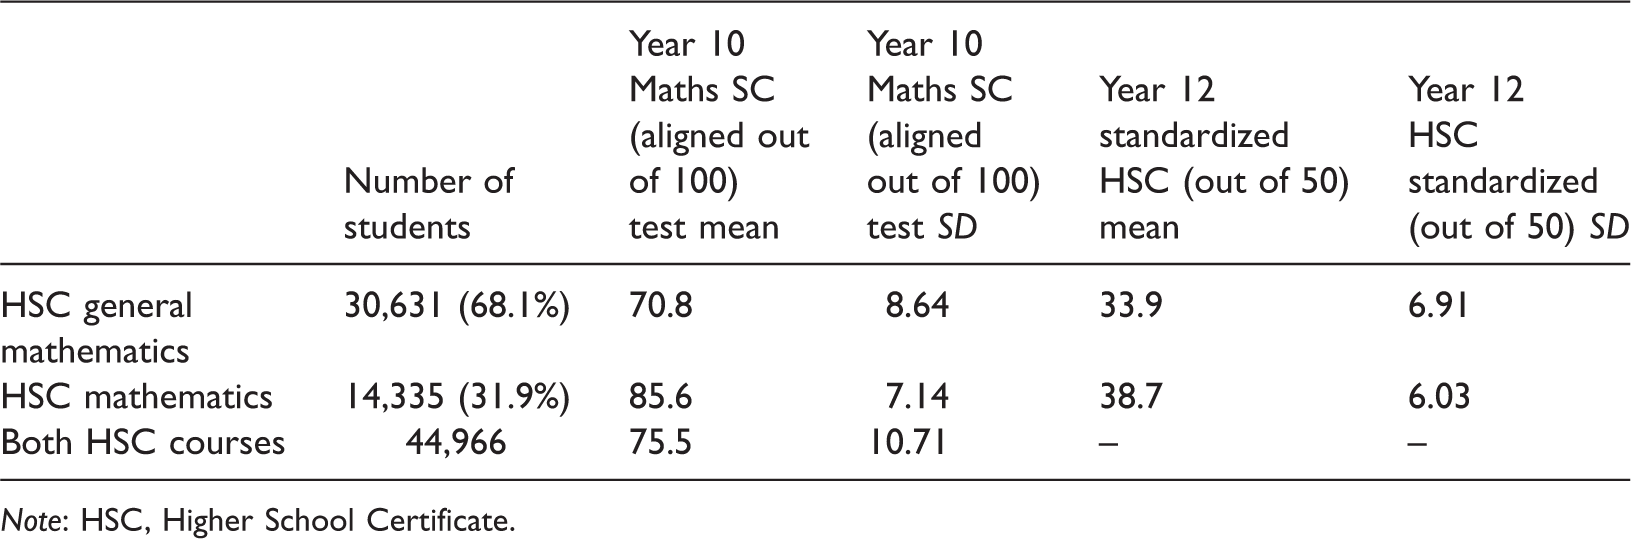
Note: HSC, Higher School Certificate.
Data
The data used in the study reported here were taken from the BOSTES. The data included the SC Mathematics test results, generally taken in Year 10, as an aligned mark out of 100, for every student who completed this test during the years 2009, 2010, and 2011. Raw marks on this test had been aligned to performance bands with a mean score of about 75. In addition to these data, for every student with a SC result over this period, and who subsequently was examined in either HSC general mathematics or HSC mathematics over the period up to and including 2013, the student's standardised HSC mark was obtained. The standardised HSC mark was derived as an equally weighted combination of the moderated school assessment mark and the final examination mark. Some students who completed the Year 10 SC test did not have a mark recorded for their HSC mathematics in these data, either because they did not complete any mathematics during Year 12, or because they completed a different mathematics course in Year 12 or did not complete Year 12 studies during the follow-up period.
The analysis that is described in the following section uses data from the SC in 2011 and from the HSC in 2013. The analysis has been repeated with other years of data and the results presented below, under Results and discussion are repeated without significant differences and are therefore not reported.
In total, 83,184 students sat the Year 10 SC Mathematics Test in 2011. These students were tracked through until the end of calendar year 2013. Of these students, 20,687 did not complete the HSC during the follow-up period and did not study either HSC mathematics or HSC general mathematics by the end of 2013. A further 11,518 of these students did complete the requirements for award of the HSC by the end of 2013 but did not include any mathematics in their HSC-level studies. Other mathematics courses (either mathematics extension 2, mathematics applied, or mathematics life skills) were completed by 5691 of these students by the end of 2013. Finally, 412 of these students completed an HSC course in mathematics during 2012 rather than 2013. Removing these students from the 83,184 students who sat the SC Test in Mathematics in 2011, left 44,966 students who also completed either HSC general mathematics or HSC mathematics in 2013. It is the marks from this group of students who form the data set used in the analysis reported in this article.
Table 2 provides summary information on the number of students from our Year 10 cohort taking HSC general mathematics and HSC mathematics during 2013. The mean and SD of the marks obtained by these students in both the SC Mathematics test (as an aligned mark) and their Year 12 mathematics course (as a standardised mark out of 50) are also given. Aligned marks and standardised marks are produced in similar ways by relating the performance on the relevant examination to a set of qualitative performance bands. The terminology used is consistent with what has been used in NSW over the period for which data have been collected. Information for the two groups of HSC students combined is also given where appropriate.
From the above summary statistics, we see that just over two thirds of our cohort studied HSC general mathematics. The performance of the students who studied HSC general mathematics was substantially lower than those who studied HSC mathematics on the SC Test in mathematics. The HSC summary statistics reported in Table 2 represent standardised marks.
In Figure 1, a histogram, shows the relative frequency (or “density”) of marks obtained by students who studied HSC general mathematics on their SC Mathematics Test. Overlaying this histogram are two estimated density functions. The solid line shows the estimated density function for marks obtained by HSC general mathematics students on the SC Mathematics Test. We observe that this estimated density function tracks close to the histogram. We also plot an estimated density function of marks obtained by students who studied HSC mathematics on their SC Mathematics Test using a broken line. It is clear from Figure 1 that, as we would expect, HSC mathematics was chosen by students who did much better overall on the SC Mathematics Test than students who chose HSC general mathematics. There is, of course, some overlap between the SC mathematics performance of the two groups of students. The top performing students who opted for general mathematics at HSC level outperformed those students who chose HSC mathematics and performed at the lower end of this group on the SC Mathematics Test.
Histogram of SC Mathematics Test result for HSC general mathematics students with overlaying density estimates for both HSC general mathematics and HSC mathematics students.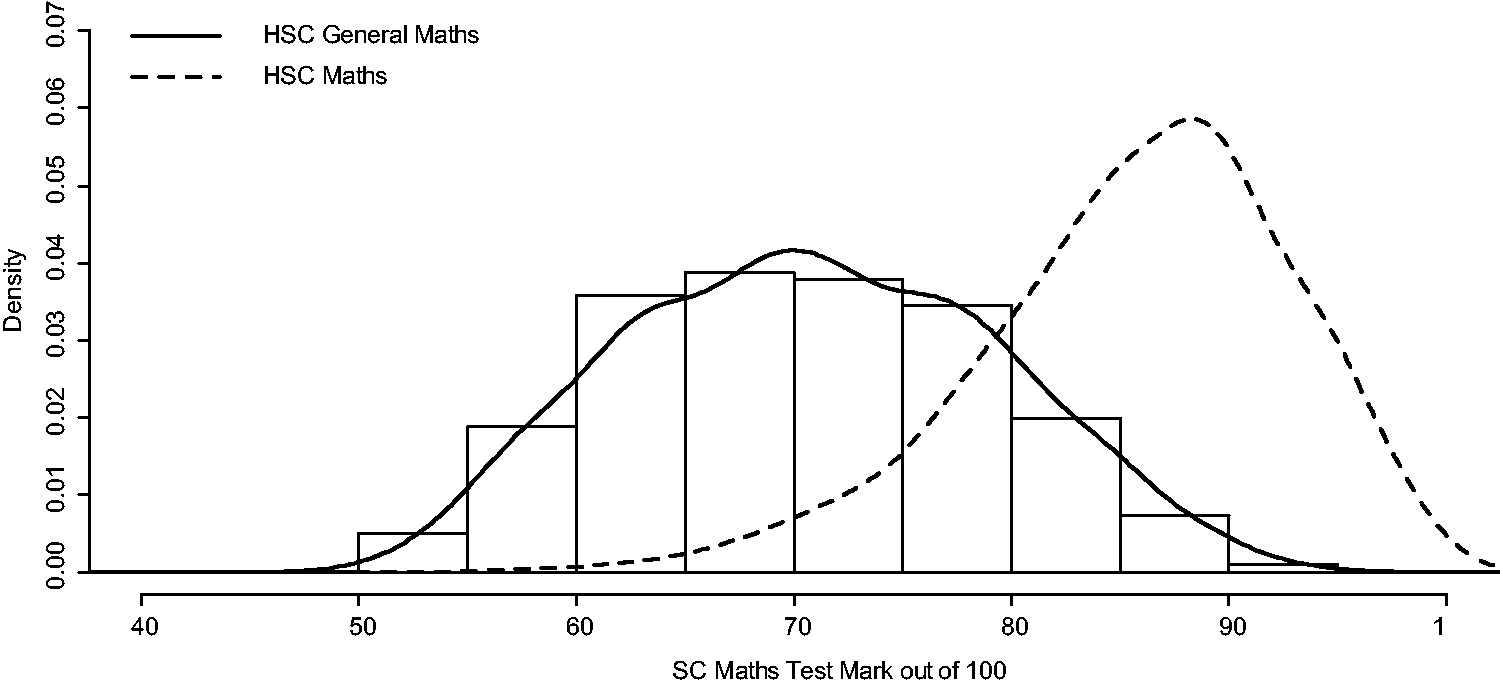
Figures 2 and 3 provide scatterplots of overall HSC results against SC Test results in HSC general mathematics and HSC mathematics. Areas on the scatterplots with a greater number of points are shown as darker than areas where fewer points are located. The positive correlation between SC performance and HSC results is clear for both the HSC general mathematics group and the HSC mathematics group of students.
Scatterplot of HSC and SC marks for students who studied HSC general mathematics. Scatterplot of HSC and SC marks for students who studied HSC mathematics.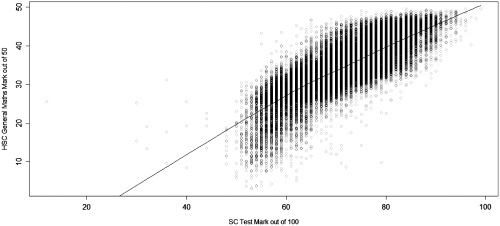
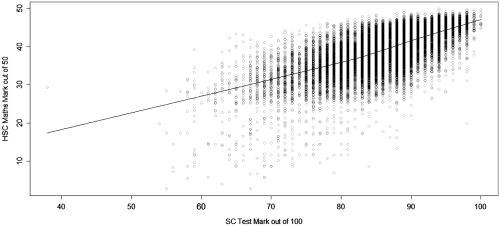
Figures 2 and 3 show a clear strong positive correlation between the score obtained by students on the Year 10 SC Mathematics Test and their subsequent HSC performance as measured by their standardised—but not scaled—score at Year 12. Some students clearly perform better at the SC level relative to their HSC score and some perform less well. The SC test can, therefore, be considered not a perfect but still a reliable predictor of performance at the HSC level. Variation in the points around the lines of best fit provided in Figures 2 and 3 occurred due to other factors that could have been included into our model such as, for example, students working harder in Years 11 and 12 than in earlier years of education or students developing and maturing earlier or later than other students. Of course, some of the variation about the lines is due to random variation and the imperfect nature of the SC test and HSC exams as measures of mathematical achievement.
Method
In order to compare the different relationships between the scaled HSC mark obtained in mathematics and the Year 10 SC test mark for students who study HSC general mathematics and those who study HSC mathematics, we first needed to produce estimated scaled scores for students in the two HSC mathematics courses.
The BOSTES data set provided the HSC mark obtained on the two courses but not the scaled mark used to derive the ATAR due to privacy reasons. Similarly, it was not possible to obtain a table converting HSC marks to scaled marks for each course—again because of privacy rules. In 1998, the NSW Government passed legislation that prevented the reporting of Universities Admission Indices—now ATARs—to schools, the Board of Studies, or the media. More recently, on application, students have been able to obtain the raw subject marks on HSC examinations. If students had both raw marks and a table converting these to scaled marks they could, theoretically, recreate aggregates of scaled scores that are used to derive ATARs. This would go against the legislation passed by the NSW Government in 1998, hence the need for privacy. Therefore, we estimated the scaled scores using publicly available information, specifically the information provided in Table 1.
In order to estimate scaled scores, we used linear interpolation to form a relationship between HSC standardised marks and scaled scores using the percentile information given in Table 1. Then, we calculated the mean and SD of the estimated scaled marks produced from the linear interpolation process. These were very close to the published mean and SD of the actual scaled marks used to determine the ATARs, which provided confidence in the estimation approach.
It should be noted that the estimation here did introduce some imperfection in the data used for the analysis—specifically since the actual scaling process worked directly with raw examination and moderated assessment scores to produce scaled marks instead of working from HSC marks produced by the BOSTES. Different—adjacent—raw marks may map to a single HSC mark, which means that these two approaches to scaling will differ. In courses with large enrolments and a wide spread of HSC marks, this will be less problematic than it may first appear. In order to determine the extent of imperfection introduced into the analysis by this approach, an email discussion with the Chair of the Technical Committee on Scaling for the NSW HSC was held (Weber, 2014). The communication concluded that the linear interpolation approach to producing scaled scores above the lower quartile should work very well for courses with large enrolments like HSC general mathematics and HSC mathematics. Further, it was concluded that scaled marks awarded in the lowest performance band for each course would deviate somewhat from the linear assumption used in this article. However, with so few marks in this region, the effect on summary statistics such as means obtained from scaled score estimates was considered to be negligible. It is also worth noting that what is most significant here is that the relationship between the true scaled scores and the estimated scaled scores is similar across the two HSC courses. Given the assurance that the approach used works very well and the close alignment of the mean and SDs of the estimated and actual scaled scores, we can be confident in the analysis presented in this article. Importantly, given the strong evidence for the conclusions that can be drawn from the analysis which follows, we are very confident that the key messages coming from this work would not change as we had used the actual scaled marks which were not available.
Results and discussion
Figure 4 shows a histogram of the estimated scaled marks for students taking HSC general mathematics along with an estimate of the probability density functions for the scaled marks for students in both HSC general mathematics and HSC mathematics. First note that the estimated density functions are positive at values where there are no values in the data. For example, we know that the maximum scaled score for HSC general mathematics is 45.7 and yet there is some positive density in the region to the right of 45.7. Similarly, we observe some positive estimated density for scaled scores less than zero. This is a function of the simple density estimation method used here. The purpose of the density estimation is to give a graphical view of the location and relative frequencies of scaled marks. More precise statistical tests are applied later in the analysis.
Histogram of HSC general mathematics estimated scaled score with overlaying density estimates for the scaled scores for both HSC general mathematics and HSC mathematics students.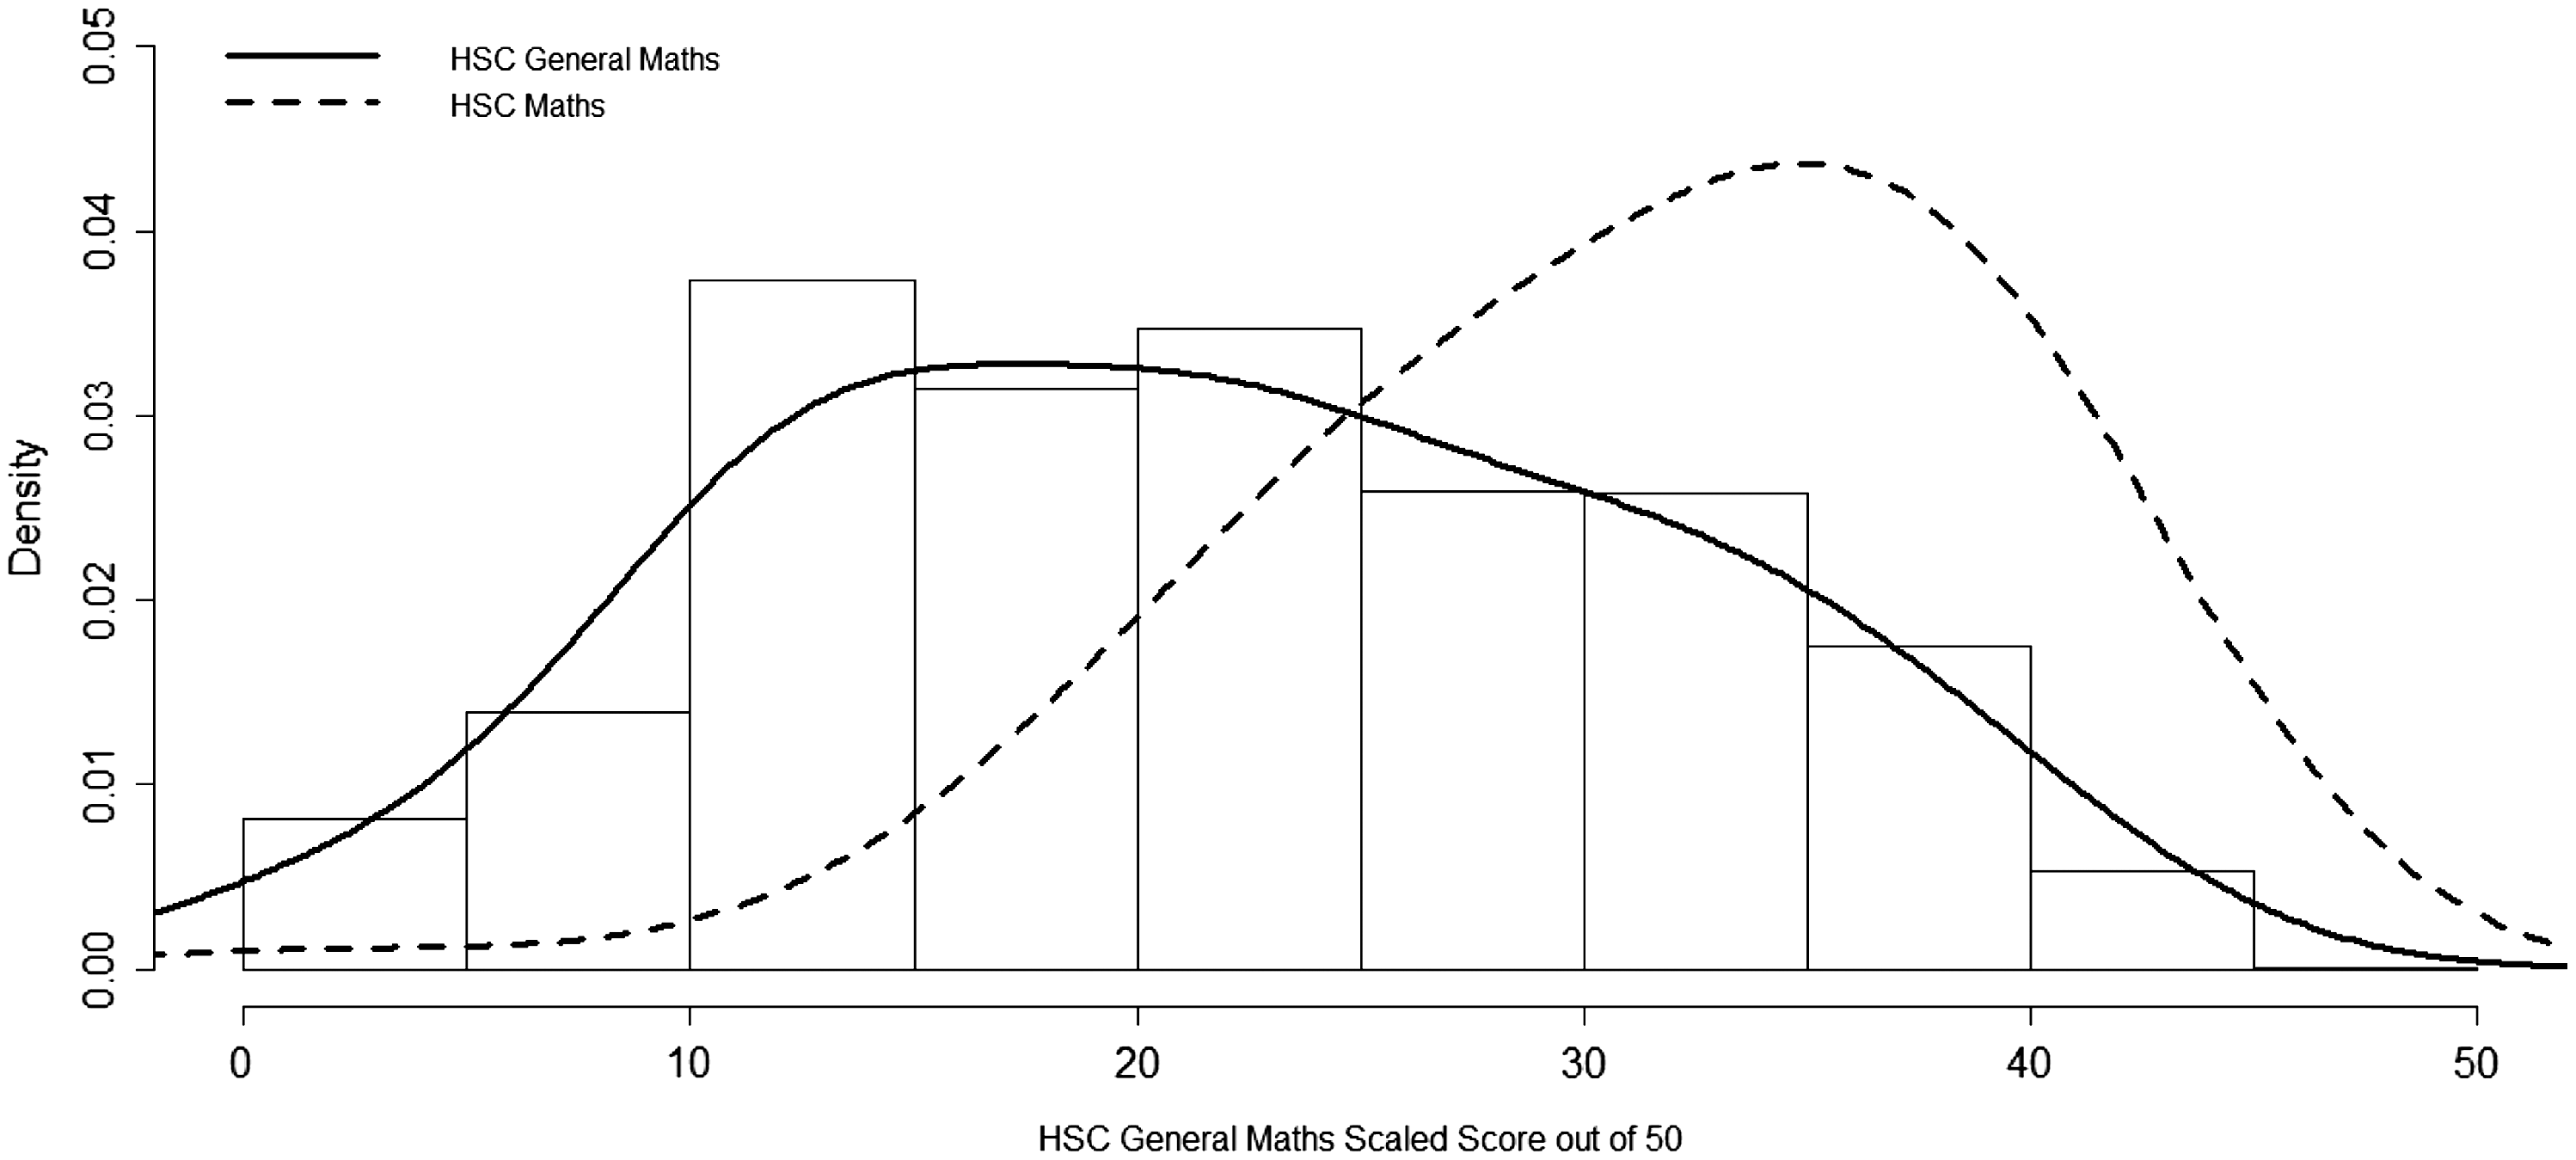
At first glance, Figure 4 looks similar to Figure 1. Upon closer inspection, however, an important difference emerges. In Figure 1, the mode of the estimated density function for the SC mathematics students' scaled scores for students who studied HSC mathematics occurs where the density estimate for the HSC general mathematics students is about 0.01. In Figure 4, the corresponding mode occurs where the density for HSC general mathematics students is about 0.02. There is considerably more overlap in the regions of relatively high density in Figure 4 than in Figure 1. This provides some graphical evidence that students in HSC mathematics are awarded scaled scores which are lower relative to their Year 10 SC test result than for students who take HSC general mathematics.
Given that the SC Mathematics Test results are reported out of 100 and that HSC marks are reported out of 50 and that each has different coefficients of variation, we standardised the scores on each test by subtracting the mean test result from each score and dividing the resulting difference by the SD of the test scores. This gives a standardised score or z-score whereby a score of “0” denotes a score equal to the average score obtained by all students who took that particular test or HSC course. A z-score of “1” indicates a score obtained which is exactly one SD above the mean. Similarly, a z-score of −2 indicates a very low score equal to the mean minus 2 SDs. For each student, two z-scores are produced. The first z-score relates to their Year 10 SC Mathematics test result and the second z-score relates to their Year 12 HSC estimated scaled score on the relevant mathematics course.
We examine the z-scores obtained as described in the previous paragraph in a number of ways. First the proportion of students in each HSC course who saw an improvement in their z-score from their SC test to their HSC scaled score is calculated. We calculate the proportion of students who have a substantial improvement (defined as an increase of greater than 0.5) in their z-score and similarly the proportion of students who have a substantial reduction in their z-score from the SC test to the HSC estimated scaled result for each completed HSC course. Second, we perform a chi-squared test to determine if the expected distribution of the z-scores obtained in the HSC—where expected values are obtained using the performance in the Year 10 SC Mathematics test—differ significantly from the distribution of z-scores actually obtained by students in each HSC course. Finally, we report a regression analysis with the z-score obtained on the HSC course regressed on the SC Mathematics Test z-score obtained and a separate indicator function for whether or not the student studied HSC general mathematics. This sort of regression analysis, with both a continuous dependent variable and an indicator variable as predictors is a form of analysis of covariance.
Analysis of change in standardized scores from the SC test to the HSC scaled results.
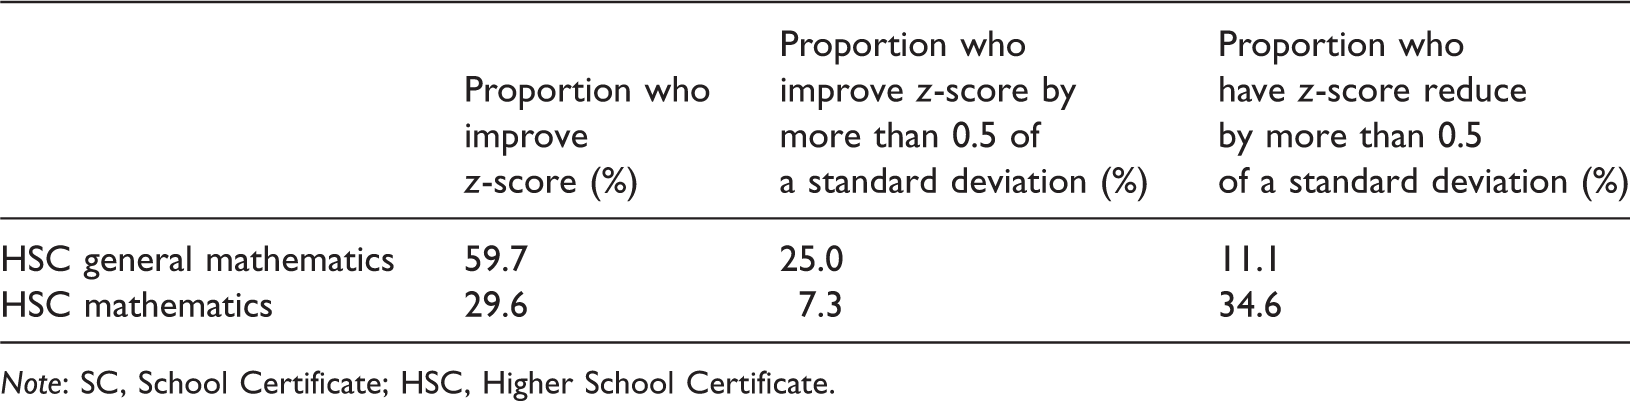
Note: SC, School Certificate; HSC, Higher School Certificate.
Frequencies of z-scores for HSC general mathematics and HSC mathematics and cumulative percentages.
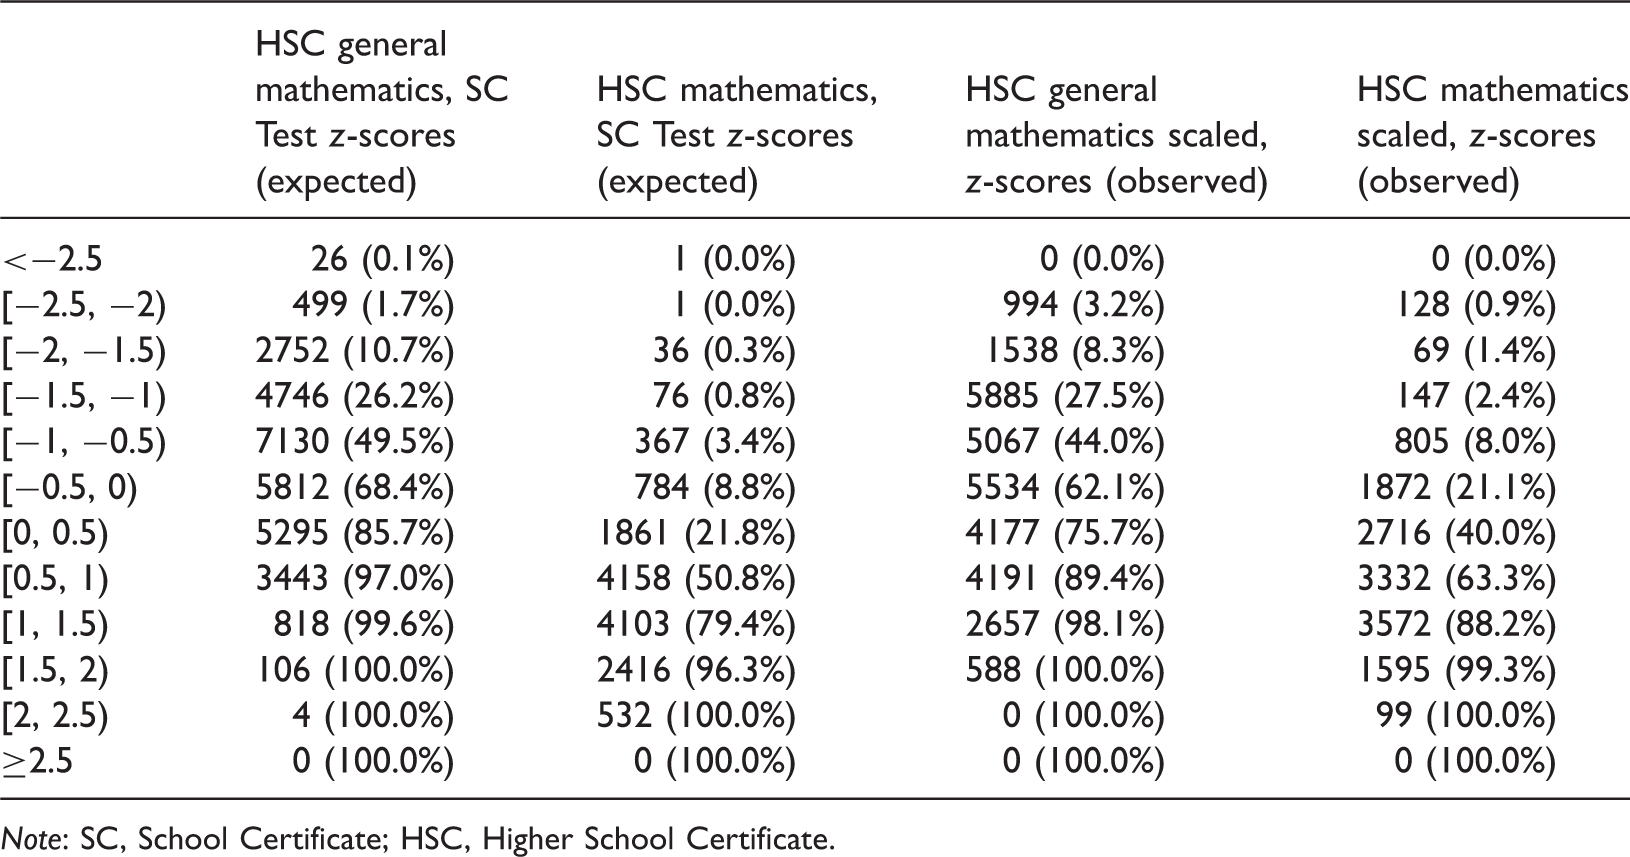
Note: SC, School Certificate; HSC, Higher School Certificate.
Table 4 shows the number of students with standardized z-scores in bands <−2.5, [−2.5, −2.0), …, [2.0, 2.5), and >=2.5. There are four groupings, shown as the four columns in the table, namely the results on the SC Mathematics test for each HSC course taken and the scaled results on each HSC course taken. The percentage figures, quoted in brackets, are the cumulative proportion of students with a z-score at the level shown or lower. Considering first the HSC general mathematics results, we see that 68.4% of students in this group scored below average—where the average is calculated across the students who took the HSC general mathematics or HSC mathematics examination two years later—on the SC Mathematics test. Only 62.1% of these students were awarded an estimated scaled score, which was below the average of the group. Looking to the HSC mathematics results, we see that only 8.8% of these students scored below average on the Year 10 SC Mathematics test, while 21.1% of them were awarded a scaled mark lower than the average of these students at the HSC level.
Suppose we assume that the performance on the Year 10 SC test can be used to predict the performance of students in the HSC Mathematics exams. If this applies, the expected number of students with scaled HSC z-scores in each of the 12 bands in Table 4 can be set as the observed numbers in each band based on the Year 10 SC test (see first two columns in Table 4). This expected distribution of the z-scores can then be compared with the observed estimated distribution of z-scores actually awarded to students after scaling at the HSC level using a chi-squared test. Results show a significant difference in the two distributions at the 0.1% significance level with a test statistic well in excess of 1000 for the two analyses considered. The test statistic is calculated as the usual sum of squared differences between observed and expected cell counts divided by the expected cell count in each cell. The test is applied with 11 degrees of freedom—the usual application of this test where degrees of freedom are equal to the number of groups, here 12—as can be seen in Table 4—minus 1. Those students who take HSC general mathematics have observed z-scores for their HSC performance significantly higher than we would expect. Those students who take HSC mathematics have observed z-scores for their HSC performance significantly lower than we would expect.
One of the criticisms of the chi-squared test, as applied above, is that the data are arbitrarily grouped prior to analysis—here into bands of width one half SD each—resulting in some loss of precision.
An alternative method of analysis, motivated by data provided in Figures 2 and 3, is to perform an analysis of covariance or regression analysis. We use the HSC scaled z-score as the dependent variable in the regression given in equation (1). As can be seen in equation (1), an intercept, denoted 
Analysis of covariance results.
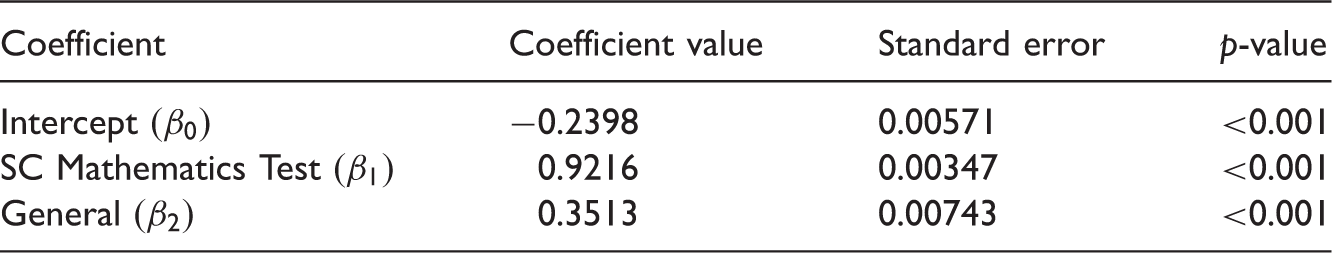
The results in Table 5 show that the estimated coefficient of the slope of the SC Mathematics Test is positive and statistically significant (0.9216). This is to be expected as a higher SC Mathematics Test result is associated with a higher HSC mathematics scaled z-score regardless of whether the student takes HSC general mathematics or HSC mathematics. In addition, the general indicator variable has a positive estimated coefficient of 0.3513. This result indicates a positive effect on the dependent variable purely from having studied the HSC general mathematics course, after taking into account the effect of the SC Mathematics Test z-score on the estimated HSC scaled z-score. This positive effect is statistically significant and also of great practical significance. An estimated increase of 0.3513 SDs is important from a practical perspective and has the potential to influence students' decisions regarding which mathematics course to choose, given that their decision to enrol in HSC mathematics or the HSC general mathematics course can be shown to have an impact on their Year 12 outcome.
One other way to illustrate the results graphically is to calculate the change in z-scores from the Year 10 SC test to the HSC scaled mark for students in both HSC courses. We compare these two sets of data on change in z-score using summary statistics in addition to estimated density functions for each set of data. While Table 6 shows the summary statistics, Figure 5 shows the estimated density functions for the change in z-scores.
Estimated density functions for change in z-score for each HSC course. Summary statistics for change in z-score by course. Note: HSC, Higher School Certificate.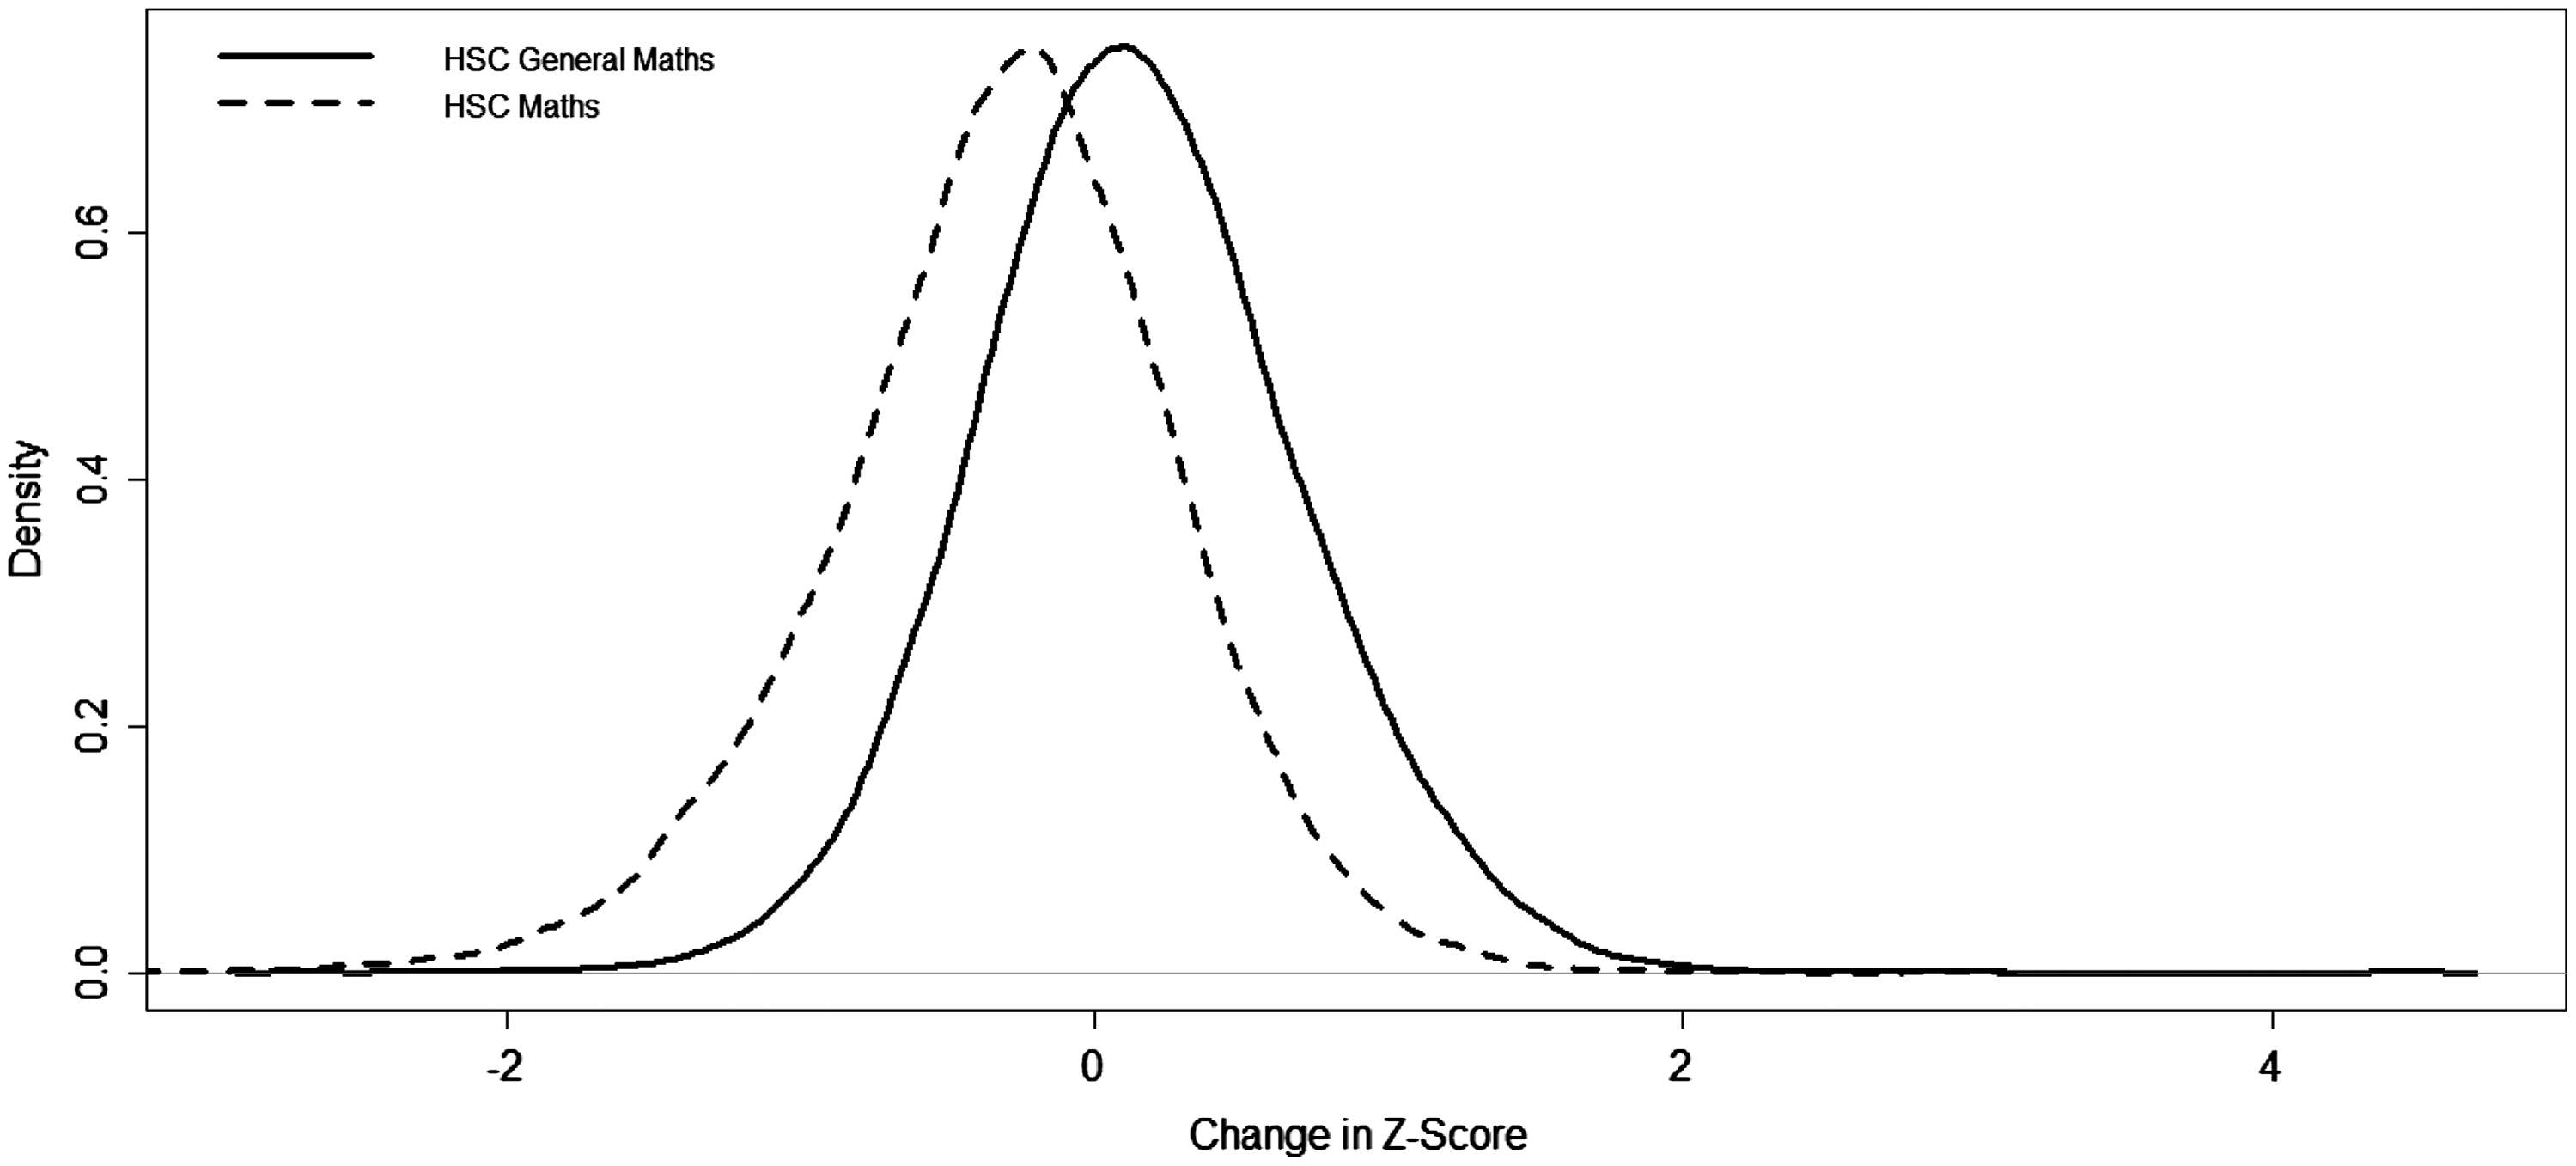
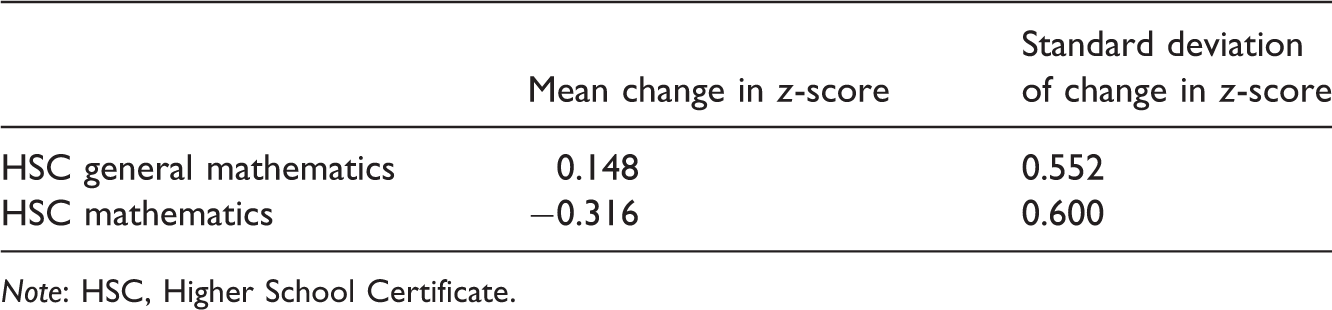
As can be seen in Table 6, the average change in z-score obtained when comparing the SC Mathematics test to the HSC scaled mark is positive for HSC general mathematics and quite large and negative for HSC mathematics. It is clear from Figure 5 that students who take HSC general mathematics are considerably more likely to receive a higher increase (or smaller decrease) in their z-score compared to students who take the HSC mathematics course.
The analysis presented here shows that the increase in performance—as measured by the change in standardised score from the SC Test to the HSC scaled mark—is considerably higher for students who opt to take HSC general mathematics than for those who take HSC mathematics. The results indicate that for many students, particularly the lower performers in the HSC mathematics examination, it may well be better, to take HSC general mathematics instead of HSC mathematics, if their aim was to maximise their scaled mark for mathematics, which contributes directly to their ATAR.
Conclusion
This article provides an analysis of the relative performance of students in the Year 10 SC Test in mathematics during 2011 and their estimated scaled score in their chosen HSC mathematics course for students who sat the HSC general mathematics examination or the HSC mathematics examination in 2013. The results indicate that, on average, the study of HSC general mathematics leads to materially higher scaled scores, relative to the performance on the SC Mathematics test, than does the study of HSC mathematics. While not all students stand to benefit from choosing HSC general mathematics over HSC mathematics, the current scaling mechanism provides a strong incentive to take HSC general mathematics for a very large group of students. At a time when many are deeply concerned about the reducing numbers of students studying higher level mathematics in the final year of secondary education, it is useful to consider the evidence presented here which supports one of the possible explanations for this drop in numbers. It is hoped that this article will contribute to the debate on the appropriateness of the current scaling algorithm in respect of HSC general mathematics and HSC mathematics. In addition, it seeks to contribute to the wider discussion around higher level mathematics courses at senior secondary school, both in terms of students' uptake and the potential need for universities to (re-)introduce prerequisites to prevent students from struggling with the demand of certain courses.
Footnotes
Funding
This research received no specific grant from any funding agency in the public, commercial, or not-for-profit sectors.
Declaration of conflicting interests
None declared.