
Abstract
This paper investigates changes in 15-year-old Australian students’ attitudes towards reading mathematics, and science, as well as their relationships with students’ performance in these respective domains over the period of 2000–2018. multigroup confirmatory factor analysis was used to examine the measurement invariance of the construct of attitudes over the cycles of the Programme for International Student Achievement. In addition, structural equation modelling was used to explore mediating effects of attitudes on performance in the three domains. The results indicated that there were significant declines in student performance for all three domains. The levels of enjoyment of the subject domains were relatively low for reading and mathematics but relatively high for science. There were upward trends in the levels of enjoyment of mathematics and science over time, while levels of enjoyment of reading did not change significantly. Levels of instrumental motivation were relatively high and had slight upward trends for both mathematics and science. There were positive and significant relationships between attitudes and student performances.
Keywords
Introduction
The Programme for International Student Achievement (PISA) is a triennial worldwide study by the Organisation for Economic Co-operation and Development (OECD) that was first performed in 2000. Over the last two decades, 43, 49, 57, 65, 66, 72 and 79 countries and regions participated in PISA 2000, 2003, 2006, 2009, 2012, 2015 and 2018, respectively (OECD, 1999, 2003, 2006, 2009, 2013, 2017, 2019). PISA provides comprehensive and reliable indicators of students’ capabilities. It assesses 15-year-old students’ skills and knowledge in reading, mathematics and science, as well as their attitudes and other background variables. PISA can be used by policymakers in the participating countries to refine their educational policies (Schleicher, 2019).
Educators have long argued the importance of a literate society for the development of a nation. The positive relationship between cognitive skills, measured by mathematics and science scores on available international studies including PISA, and economic growth was reported by Hanushek and Woessmann (2010). Their report indicated that relatively small improvements in the cognitive skills of a nation’s labour force lead to increased innovation and productivity and, subsequently, long-term economic viability. In addition, there are other social benefits resulting from a society with strong reading, mathematical and scientific literacies, including the capability to tackle personal, social, environmental, health and wellbeing issues (Jaremus et al., 2019; Sadler & Zeidler, 2009). However, while the benefits have been acknowledged, the general decline of student engagement in mathematics and science has also been recognised (Bennett & Hogarth, 2009; Bybee & McCrae, 2011; Kennedy et al., 2014; Sjaastad, 2012). In Australia, there is evidence of a downward trend in the achievement of students in international surveys, such as the Trends in Mathematics and Science Study (Thomson et al., 2016) and the PISA (Morsy et al., 2018; Thomson et al., 2017, 2019).
Hattie’s (2009, 2012, 2015) meta-analytical studies on performance reported that around half of the learning variance was related to students’ background factors, including previous knowledge, motivation, commitment and, more significantly, the student’s attitudes towards a subject, amongst others. The investigation of students’ attitudes towards reading, mathematics and science forms a substantive and significant feature of numerous studies by the education research community over the past five decades (Crouch et al., 2018; Di Martino & Zan, 2011; Dutton, 1954; Kolić-Vehovec et al., 2014; McConney et al., 2014; McConney & Perry, 2010; McLeod, 1992; Neale, 1969). Consequently, this paper focuses on students’ attitudes towards mathematics, science and reading over time. Further, it investigates changes in the levels of students’ attitudes over the past 20 years and the associations between attitudes and student performance.
Research questions
Do the measurement models of attitudes towards reading, mathematics and science hold across groups and time? Do attitudes towards reading, mathematics and science change over this period? Do the relationships between attitudes and performance change over time?
Literature review
Attitudes towards reading, mathematics and science
Attitude is one of the key concepts in social psychology. It is generally defined as the tendency of an individual’s reaction towards a stimulus, either positively or negatively (Fishbein & Ajzen, 1977). Attitudes are commonly developed during the early stages of childhood and are influenced by parents, siblings and peers (Petty et al., 2003). The importance of attitude and its positive development towards a subject has been highlighted in research (Farooq & Shah, 2008; Hattie, 2009, 2012, 2015; Tapia & Marsh, 2004). Attitudes have a strong effect on students’ emotional response and behaviour, which in turn plays a role in determining their interest in, enjoyment of, and engagement with the subject. Subject-related interest is an intrinsic motivational preference that affects continuity and intensity of engagement with learning. The level of engagement and the amount of effort exerted, which is also contingent upon the kind of attitude and behaviour adopted by students, can also influence students’ levels of performance in a subject.
Attitudes towards reading
The literature indicates that there is a significant positive association between attitudes towards reading and academic achievement (Netten et al., 2011; Ozonder, 2015; Petscher, 2010). Research in this field has been extended further to find out which aspects of attitudes towards reading are most significant in predicting reading performance (Smith et al., 2018). Some studies have found that intrinsic motivation is the aspect that has the strongest positive correlation with reading achievement. This intrinsic motivation can be reflected, for example, in the levels of enjoyment or interest in engaging in a task (Dhanapala & Hirakawa, 2016). However, other studies have also indicated that rather than the intrinsic aspect, the extrinsic or instrumental motivation aspect has a stronger positive correlation with reading ability (Kim, 2011; Lin et al., 2012).
Attitudes towards mathematics
The concept of attitudes towards mathematics can be traced back to a study by Neale (1969). He defined mathematical attitude as “a liking or disliking of mathematics, a tendency to engage in or avoid mathematical activity, a belief that one is good or bad at mathematics, and a belief that mathematics is useful or useless” (p. 632). This concept of attitudes towards mathematics was well received and widely recognised (Ma & Kishor, 1997; Zan & Di Martino, 2007). More recently, attitudes towards mathematics have been examined extensively (Haladyna et al., 1983; Hannula, 2002; Hart, 1989; Ma & Kishor, 1997). Hart (1989) considers attitudes towards mathematics as the complex emotions and beliefs that an individual has in relation to mathematics. These complex emotions are then followed by an individual’s behaviour towards mathematics, which may include anxiety about and fearfulness of the subject. Haladyna et al. (1983) define attitudes towards mathematics as “a general emotional disposition towards the school subject of mathematics” (p. 20). Ma and Kishor (1997) include students’ affective responses to the difficulty as well as the importance of mathematics. Hannula (2002) states that attitudes towards mathematics can also be seen as an emotional disposition towards the subject. Hemmings and Kay (2010), in their study using a sample of Australian Year 10 students, found that attitudes towards mathematics were significantly and positively associated with mathematics performance.
Attitudes towards science
Relationships between student attitudes towards science and science performance have been explored extensively, particularly in science education research over the past two decades (Fonseca et al., 2011; McConney et al., 2014; Tytler & Osborne, 2012). The results so far show that there is no consensus in this area. Some studies reported that there is a positive relationship between the two constructs (Singh et al., 2010; Tran, 2011). In contrast, many studies indicate that only a weak relationship exists between student attitudes towards science and science performance (Osborne et al., 2003). Analysis of PISA results has suggested that more positive attitudes towards science do not necessarily correspond to a higher science performance (Bybee & McCrae, 2011; McConney et al., 2014). Fonseca et al. (2011) in their cross-national study of PISA 2006 science performance found that, generally, students in countries with better performance were less positive in their attitudes towards science than students in lower performing countries. Despite these inconclusive results, the important role of attitudes towards science in science performance for Australian students is worth exploring.
Methodology
Sample
Sampling in PISA was carried out using a two-stage sampling framework in most countries, including Australia. In the first stage, schools were selected based on a probability that was proportional to the school’s enrolment of 15-year olds. During the second stage, students were sampled within sampled schools. The number of schools and students selected to participate in PISA 2000–2018 is presented in Table 1.
Australian sample: PISA 2000–2018.
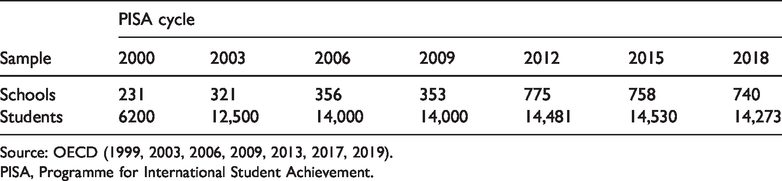
PISA, Programme for International Student Achievement.
Variables
In PISA studies, attitudes as a construct consist of several sub-constructs. In this study, longitudinal analyses were undertaken and only those sub-constructs used across multiple cycles, also referred to as the trend constructs, were included. In 2000, 2009 and 2018, the trend construct measured for reading is engagement in reading (also labelled as enjoyment of reading). For mathematics and science, two trend constructs related to attitudes towards each domain were investigated. For mathematics, this included interest in and enjoyment of mathematics, and instrumental motivation towards mathematics. For science, this included enjoyment of science, and instrumental motivation towards science. To simplify the names of these constructs, engagement in reading, interest in and enjoyment of mathematics and enjoyment of science are labelled as enjoyment of reading, enjoyment of mathematics and enjoyment of science for the remainder of this text, respectively. The names, description and codes of the variables included in this study are presented in Appendix 1. Only items that are common to all cycles under investigation were included in this study.
Hypothesised model
The hypothesised models investigated in this study are presented in Figures 1 and 2. In Model 1, it is hypothesised that the levels of students’ attitudes towards a particular subject domain, as measured by enjoyment of reading, as well as instrumental motivation for mathematics and science, will influence their respective literacy performance. A series of multigroup structural equation modelling (SEM) analyses was undertaken to investigate the changes in the magnitude and direction of the relationships amongst enjoyment, instrumental motivation and literacy performance for reading, mathematics and science over time. In Model 2, data from different cycles were combined into a single analysis, and PISA cycle as a variable was added to the model to investigate trends in the levels of enjoyment, instrumental motivation and literacy performances over time. For reading, PISA cycle is coded as 0 for PISA 2000, 1 for PISA 2009 and 2 for PISA 2018. For mathematics, PISA cycle is coded as 0 for PISA 2003 and 1 for PISA 2012. For science, PISA cycle is coded as 0 for PISA 2006 and 1 for PISA 2015.
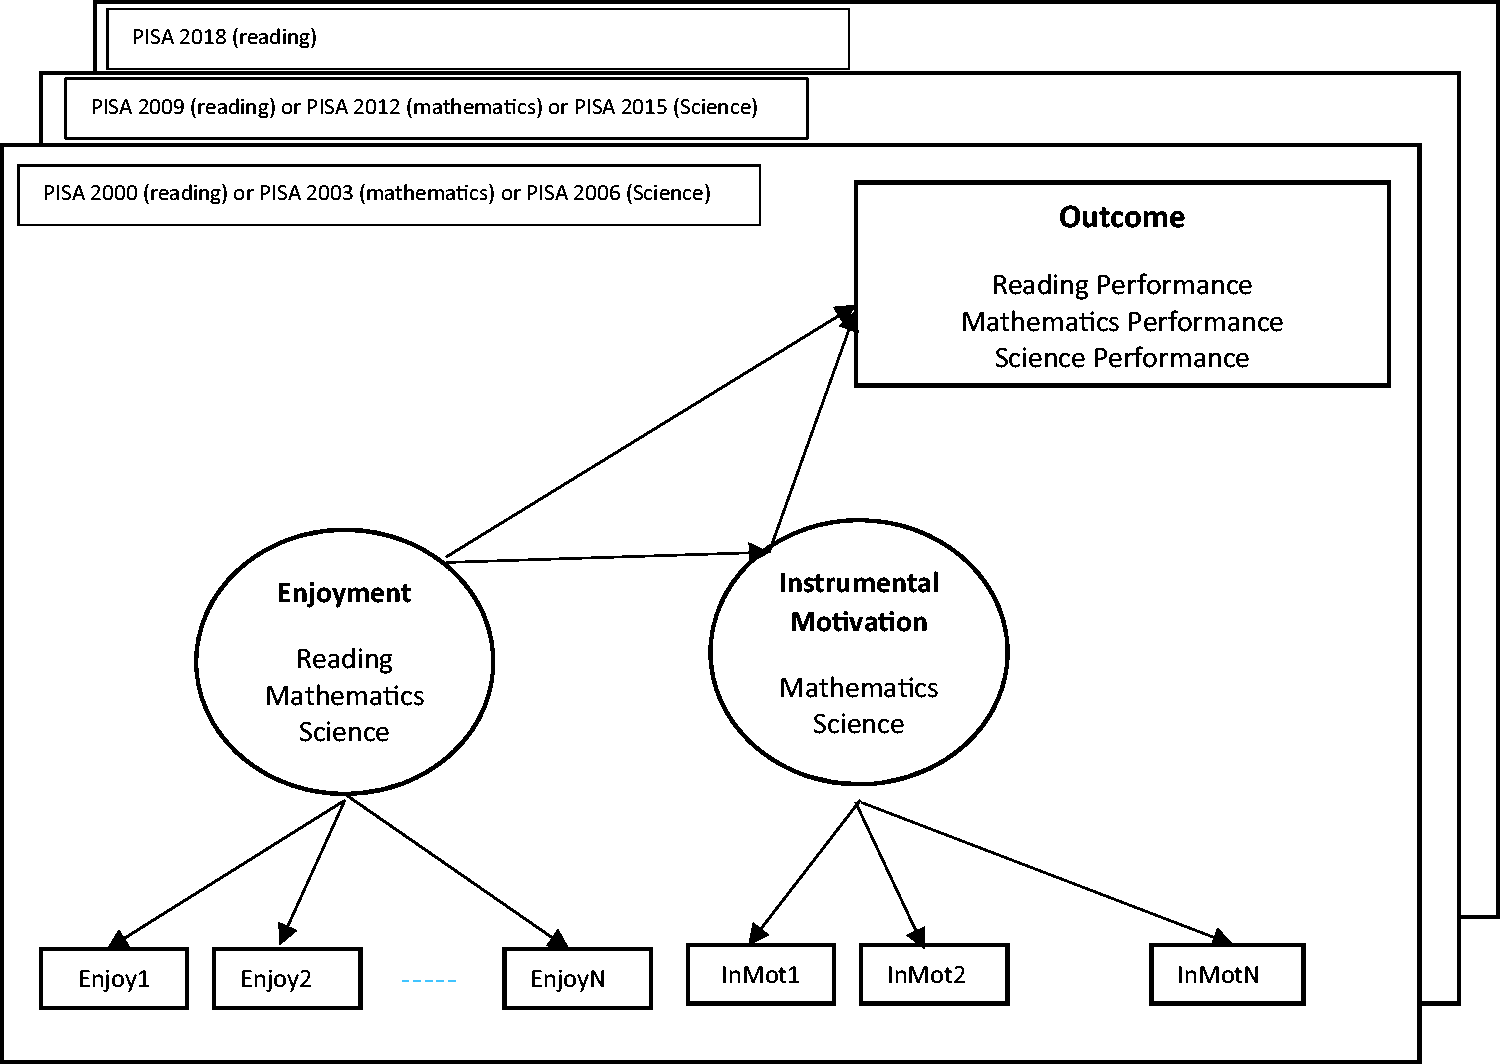
Hypothetical Model 1: trends in the relationships between attitudes and performance.
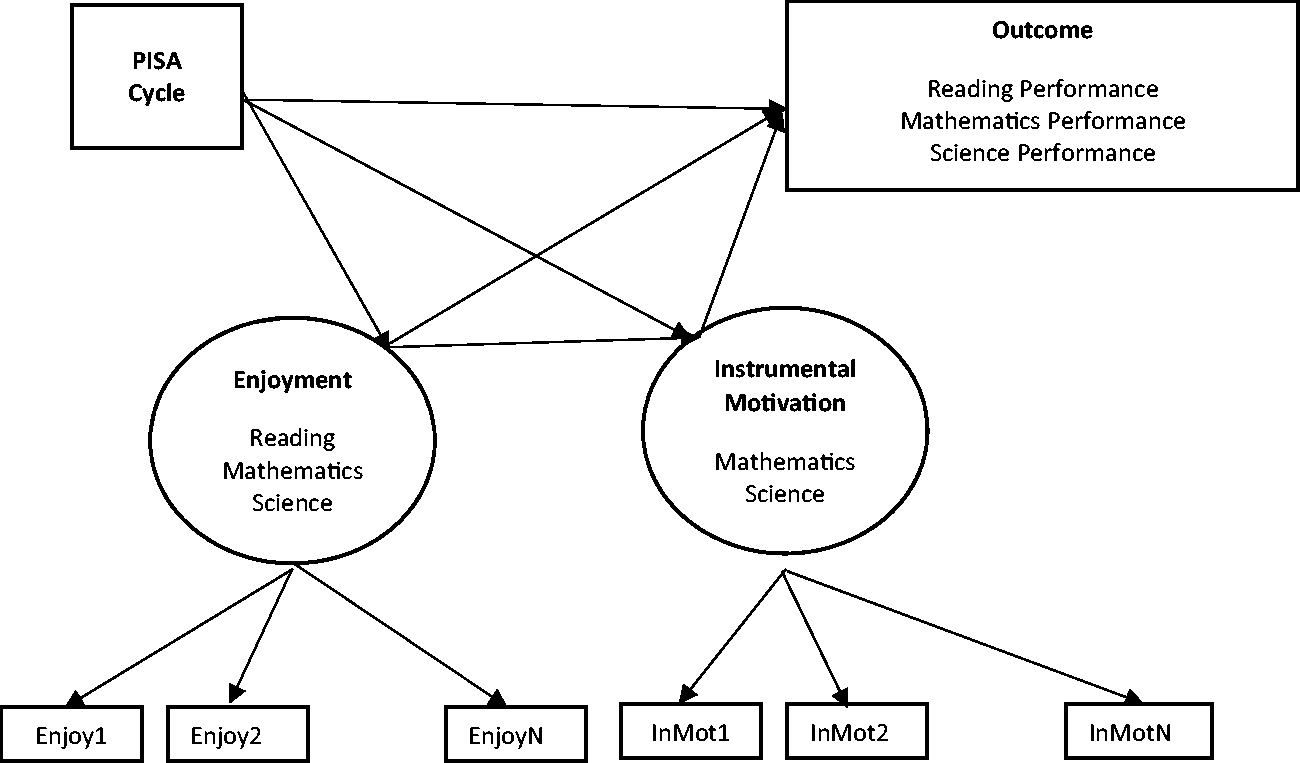
Hypothetical Model 2: trends in the levels of attitudes and performances.
Methods of analyses
There were three stages of data analyses in this study. In the first stage, a multigroup confirmatory factor analysis (M-CFA) was adopted to test the measurement invariance of the enjoyment and instrumental motivation constructs. The purpose of this M-CFA was to confirm that the same underlying constructs were being measured across groups and across time (Byrne, 2012; Milfont & Fischer, 2010). Based on Milfont and Fischer’s (2010) guidelines, a series of CFA analyses was first performed on each sample independently to confirm that the factor structure of enjoyment of reading, enjoyment and instrumental motivation of mathematics, as well as enjoyment and instrumental motivation of science fit their respective data sets well. Afterward, following the suggestion of Bialosiewicz et al. (2013), four levels of measurement invariance were tested. First, configural invariance was tested in which all factor loadings and item intercepts were freely estimated amongst multiple samples. This model can be considered as the baseline model. Second, metric invariance was tested by constraining all factor loadings to be equal between groups, while allowing the intercepts of the indicators to be freely estimated. This model is commonly referred to as weak invariance. Third, scalar invariance was tested by requiring that the intercepts for the indicators were also constrained to be equal across groups. This model is commonly referred to as strong invariance. Lastly, the final level of invariance, the strict invariance, was undertaken by constraining the factor variances to be equal.
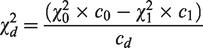
As for the chi-square comparison between models, following the Mplus manual (Muthén & Muthén, 2017), the following steps were used to compute a chi-square difference test using the MLM or MLR (Satorra–Bentler) chi-square:
Compute the difference test scaling correction cd
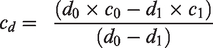
where d0 is the degrees of freedom in the nested model, c0 is the scaling correction factor for the nested model, d1 is the degrees of freedom in the comparison model and c1 is the scaling correction factor for the comparison model.
2. Compute the Satorra–Bentler scaled chi-square difference test
In the second stage, a multigroup SEM (M-SEM) approach, as presented in Figure 1, was used. A series of M-SEM analyses was undertaken to investigate the changes in the strength and the direction of the relationships between attitudes and performances. In the third stage, the differences of the estimates amongst the PISA cycles and the trends in the levels of enjoyment, instrumental motivation and performances for reading, mathematics and science across time were examined by analysing a series of SEM models as presented in Figure 2. In addition, overall estimations of the relationships between these attitude components and performance after controlling for the differences mentioned earlier were also sought.
The fit of the CFA and SEM models was assessed based on five goodness-of-fit statistics which include normed or relative chi-square (χ2/df), Comparative Fit Index (CFI), Tucker Lewis Index (TLI), Root Mean Square Error of Approximation (RMSEA) and Standardised Root Mean Square Residual (SRMR). There is no consensus for the normed or relative chi-square regarding the acceptable ratio for this statistic. However, current recommendations range from as high as 5.0 (Wheaton et al., 1977) to as low as 2.0 (Tabachnick & Fidell, 2007). The CFI and TLI values range between 0.0 and 1.0, with values closer to 1.0 indicating a good fit. A value greater than 0.90 is needed (Hu & Bentler, 1999). As for the RMSEA and SRMR, the consensus amongst authorities in this area is to use a cut-off value close to 0.06 (Hu & Bentler, 1999) or a strict upper limit of 0.07 (Steiger, 2007).
Mplus 8 statistical programme was used for both CFA and SEM analyses. In conducting the analyses, the cluster and the stratification options were employed to consider the two-stage sampling framework used in PISA studies instead of using the replicate weights. This approach was taken because chi-square estimate is not available when replicate weights are used. In this article, schools were regarded as clusters and the strata variable was used for the stratification option. The data imputation command in Mplus also makes it possible to use plausible values which provides appropriate standard errors and χ2 estimates (Muthén & Muthén, 2017). From 2000 until 2012, PISA provided five plausible values for students’ performances. However, since 2015, an additional five plausible values have been provided. Therefore, the analyses of SEM Model 1 and Model 2, which require a similar number of imputations for the cycles included in the analyses, only five plausible values could be used. The Mplus default option for dealing with missing values was adopted in the study. With this option, Mplus uses all data that are available to estimate the model using full information maximum likelihood (Muthén & Muthén, 2017).
Results
Measurement invariance
To answer the first research question, a series of CFA analyses was performed on each sample independently and fit indices of these separate CFA models are presented in Table 2. The results show that, in general, the model fit was acceptable for all samples. The CFI and TLI values were mostly above 0.9 and only the TLI values for reading in PISA 2000 and PISA 2015 were below 0.9, but still above 0.8. The RMSEA values were acceptable except for reading for all cycles in which the values were slightly above 0.1. The SRMR values were all below 0.05. The χ2 values are sensitive to sample size. Considering the sample sizes used in this study are relatively large, most of the time significant results were observed.
Model fit of the independent CFA models.
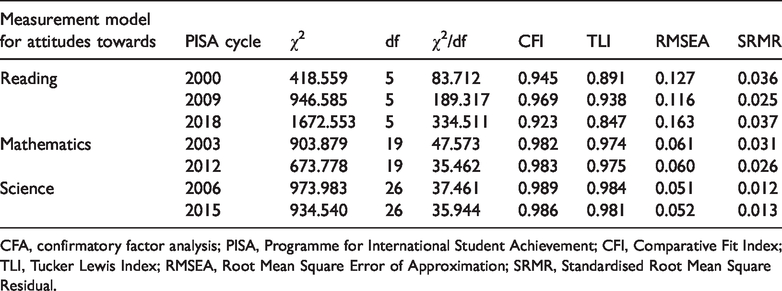
CFA, confirmatory factor analysis; PISA, Programme for International Student Achievement; CFI, Comparative Fit Index; TLI, Tucker Lewis Index; RMSEA, Root Mean Square Error of Approximation; SRMR, Standardised Root Mean Square Residual.
The next step was to assess the measurement invariance using M-CFA to confirm that the same underlying construct was being measured across groups and across time. As mentioned earlier, four levels of measurement invariance were tested and the fit indices along with their changes are presented in Table 3. The changes in the CFI and TLI values were all less than 0.01. Changes in the RMSEA and SRMR values were also less than 0.01, except for the strict models of reading and science, where the SRMR values increased by 0.026 and 0.029 for reading and science, respectively, when the models were compared to their scalar invariance models. As mentioned earlier, due to the large sample sizes, the changes in the adjusted χ2 values using the Satorra–Bentler method described above are still found to be significant. Despite this, considering the sample sizes, it can then be argued that all the constructs behave in the same way across time and groups. They all can be considered as having a strong measurement invariance. In other words, the measurement models of attitudes towards reading, mathematics and science hold across groups and time. Therefore, the comparisons between occasions can be made meaningfully.
Model comparisons for measurement invariance models.
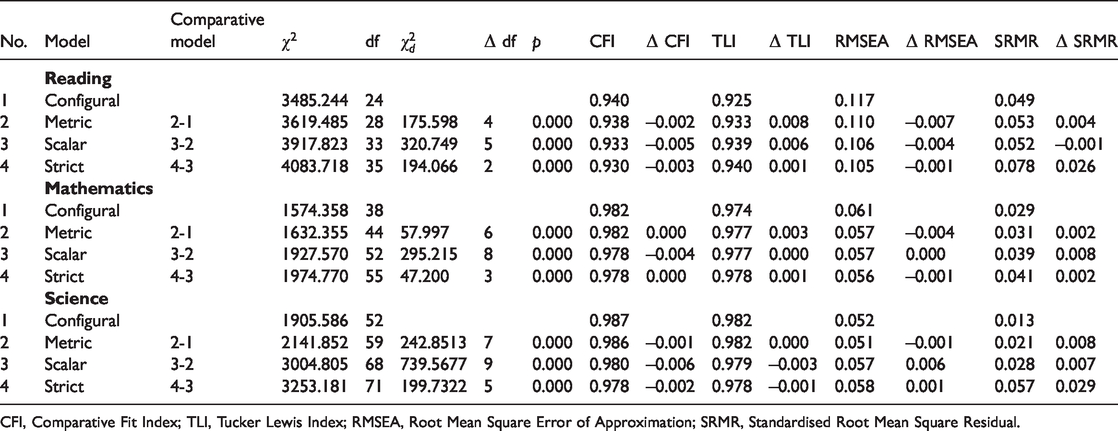
CFI, Comparative Fit Index; TLI, Tucker Lewis Index; RMSEA, Root Mean Square Error of Approximation; SRMR, Standardised Root Mean Square Residual.
Measurement model results: Model 1 and Model 2
Before the SEM models for hypothesised Models 1 and 2 were analysed, measurement models of each of hypothesised model for reading, mathematics and science were examined to estimate the Pearson product moment correlation coefficients. The correlation coefficients of the constructs are reported in Table 7. After this step, the SEM models were developed by adding the causal paths. The results for the measurement model as well as the structural model are discussed in the following sections. The descriptive statistics for each of the items and the factor loadings for the measurement models of Model 1 and Model 2 are recorded in Tables 4, 5 and 6 for reading, mathematics and science, respectively.
Attitudes towards reading: enjoyment of reading.
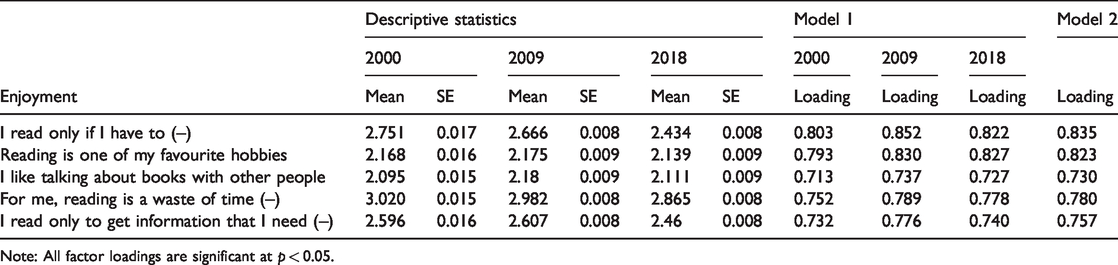
Note: All factor loadings are significant at p < 0.05.
Attitudes towards mathematics: enjoyment of mathematics and instrumental motivation.
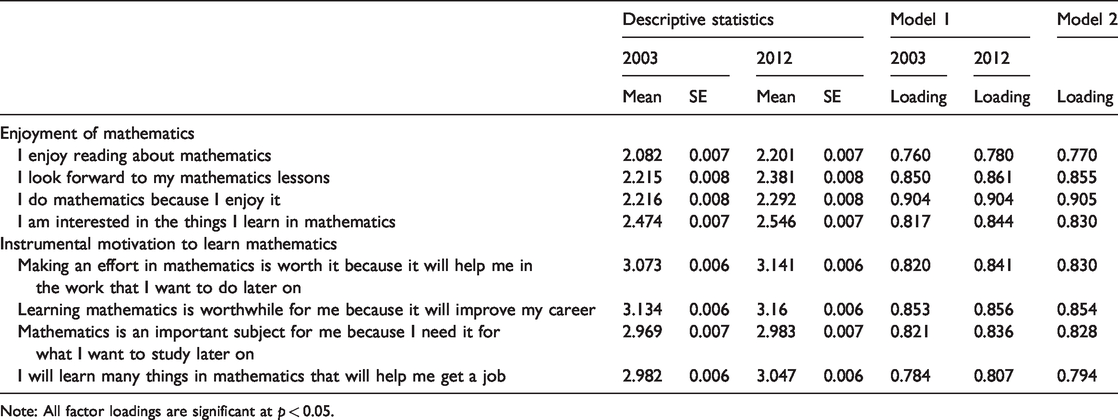
Note: All factor loadings are significant at p < 0.05.
Attitudes towards science: enjoyment and instrumental motivation.
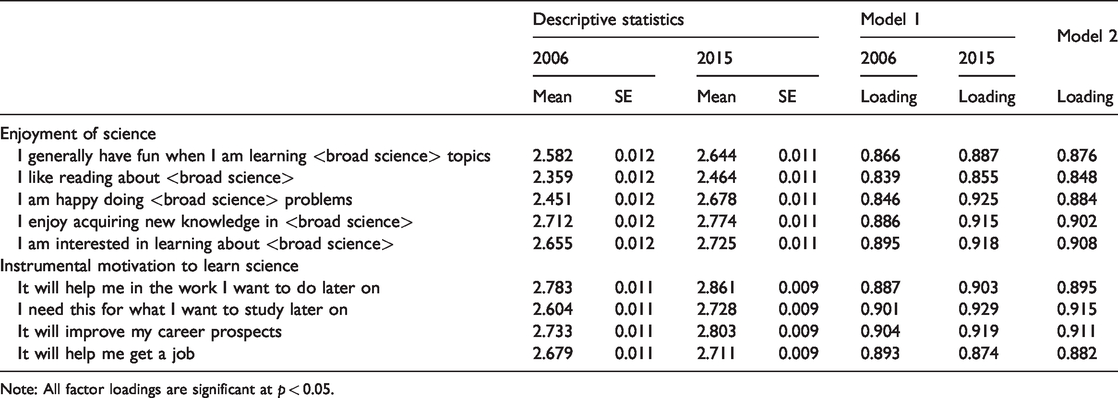
Note: All factor loadings are significant at p < 0.05.
Structural model results for Model 1.
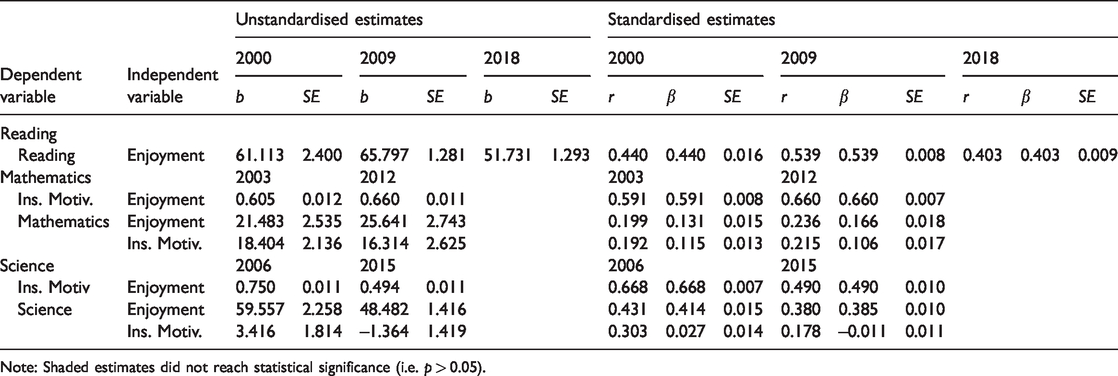
Note: Shaded estimates did not reach statistical significance (i.e. p > 0.05).
Reading
A large proportion of 15-year-old Australian students read only to get information they need (43% responding agree or strongly agree in 2000, 43% in 2009 and 53% in 2018) or only if they had to (38% in 2000, 42% in 2009 and 54% in 2018), and about 23% in 2000, 26% in 2009 and 32% in 2018 of the students reported that reading was a waste of time. Around one-third (33% in 2000, 35% in 2009 and 33% in 2018) of the students considered reading to be one of their favourite hobbies. After reversing the responses for the negative statements, the mean estimates along with the standard error of the mean for the five items included to measure the enjoyment of reading are presented in Table 4. The factor loadings are all above 0.7, indicating that the five items are very good reflectors of the enjoyment of reading construct.
Mathematics
All the items used to measure attitudes towards mathematics were positively worded. However, the initial coding scheme were 1 for strongly agree, 2 for agree, 3, for disagree and 4 for strongly disagree. For easy interpretation using a positive scale, these responses were reversed. The higher the values, the more positive the attitudes are. Less than half of 15-year-old Australian students enjoyed reading about mathematics (27% responding agree or strongly agree in 2003 and 33% in 2012) or did math because they enjoyed it (36% in 2003 and 45% in 2012). About 35% in 2003 and 38% in 2012 of the students reported that they looked forward to their mathematics lessons. Slightly more than half (50% in 2003 and 54% in 2012) of the students were interested in what they learnt in mathematics. However, Australian students reported a relatively high level of instrumental motivation. Their agreement (including strongly agree and agree responses) with all four items was around and above 75%. The estimated means along with the standard error of the mean for the eight items used to measure enjoyment of mathematics and instrumental motivation to learn mathematics are presented in Table 5. The factor loadings are all above 0.7 indicating that the items used to reflect both constructs are very good.
Science
The items used to measure attitudes towards science were positively worded and the initial coding scheme were similar to the items used to measure attitudes towards mathematics therefore these responses were reversed. More than half of 15-year-old Australian students had fun when they were learning science (58% in 2006 and 64% in 2015) or they were happy doing science problems (50% in 2006 and 66% in 2015). About 43% in 2006 and 51% in 2015 of the students reported that they liked reading about science. More than half (61% in 2006 and 66% in 2012) of the students were interested in learning about science. In addition, Australian students also reported a relatively high level of instrumental motivation. Their agreement towards all four items ranged from 55% to 70%. The means along with their standard errors for the nine items included to measure the enjoyment of science and instrumental motivation to learn science are presented in Table 6. The factor loadings are all above 0.7 indicating that the five items are good reflectors of the enjoyment of science construct.
Structural model results: Model 1
The structural model results of the multigroup SEM models, Model 1, are presented in Table 7. The results indicated that there were positive and significant correlations between attitudes and performance for all three domains of reading, mathematics and science. The path coefficient for enjoyment of reading and reading performance was 0.440 (SE = 0.016) in 2000. It became stronger in 2009 (β = 0.539, SE = 0.008) but became weaker again in 2018 (β = 0.403, SE = 0.009) explaining about 18%, 26% and 13% of the variances of reading performance in 2000, 2009 and 2018, respectively.
There were positive and significant correlations between enjoyment of mathematics as well as instrumental motivation and mathematics performance. SEM results indicate that for the effect of enjoyment on mathematics performance, the path coefficient increased from 0.131 (SE = 0.015) in 2006 to 0.166 (SE = 0018) in 2012, respectively. The path coefficients from enjoyment to instrumental motivation increased from 0.591 (SE = 0.008) to 0.660 (SE = 0.007). After controlling for the enjoyment, the path coefficients between instrumental motivation and mathematics performance decreased from 0.115 (SE = 0013) to 00.106 (SE = 0017). Both predictors explained around 4.8% and 6.0% of variances of the mathematics performances in 2003 and 2012, respectively.
There were positive and significant correlations between both enjoyment of mathematics and instrumental motivation with mathematics performance, but these correlations became weaker over time. The results presented in Table 7 indicated that the path coefficient between enjoyment and scientific literacy performance decreased from 0.414 (SE = 0.015) in 2006 to 0.385 (SE = 0.010) in 2015. The effect of enjoyment on instrumental motivation was strong but decreased over time from 0.668 (SE = 007) in 2006 to 0.490 (SE = 0.010) in 2015. After controlling for enjoyment, the path coefficients between instrumental motivation and scientific literacy performance were no longer significant in either cycle. The models explained about 17% and 15% of the variances of scientific performances in 2006 and 2015, respectively.
Structural model results: Model 2
In the last stage, hypothesised Model 2 was analysed to investigate the differences of the estimates amongst the PISA cycles and the trends in the levels of enjoyment, instrumental motivational and performance in reading, mathematics and science across time and groups. The results of these analyses are presented in Table 8 while the three SEM models of reading, mathematics and science along with their standardised results are presented in Figures 3, 4 and 5, respectively.
Structural model results for Model 2.
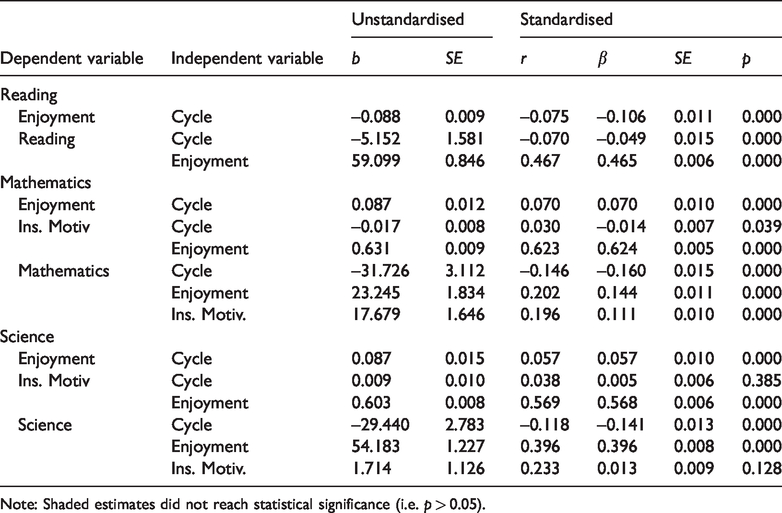
Note: Shaded estimates did not reach statistical significance (i.e. p > 0.05).
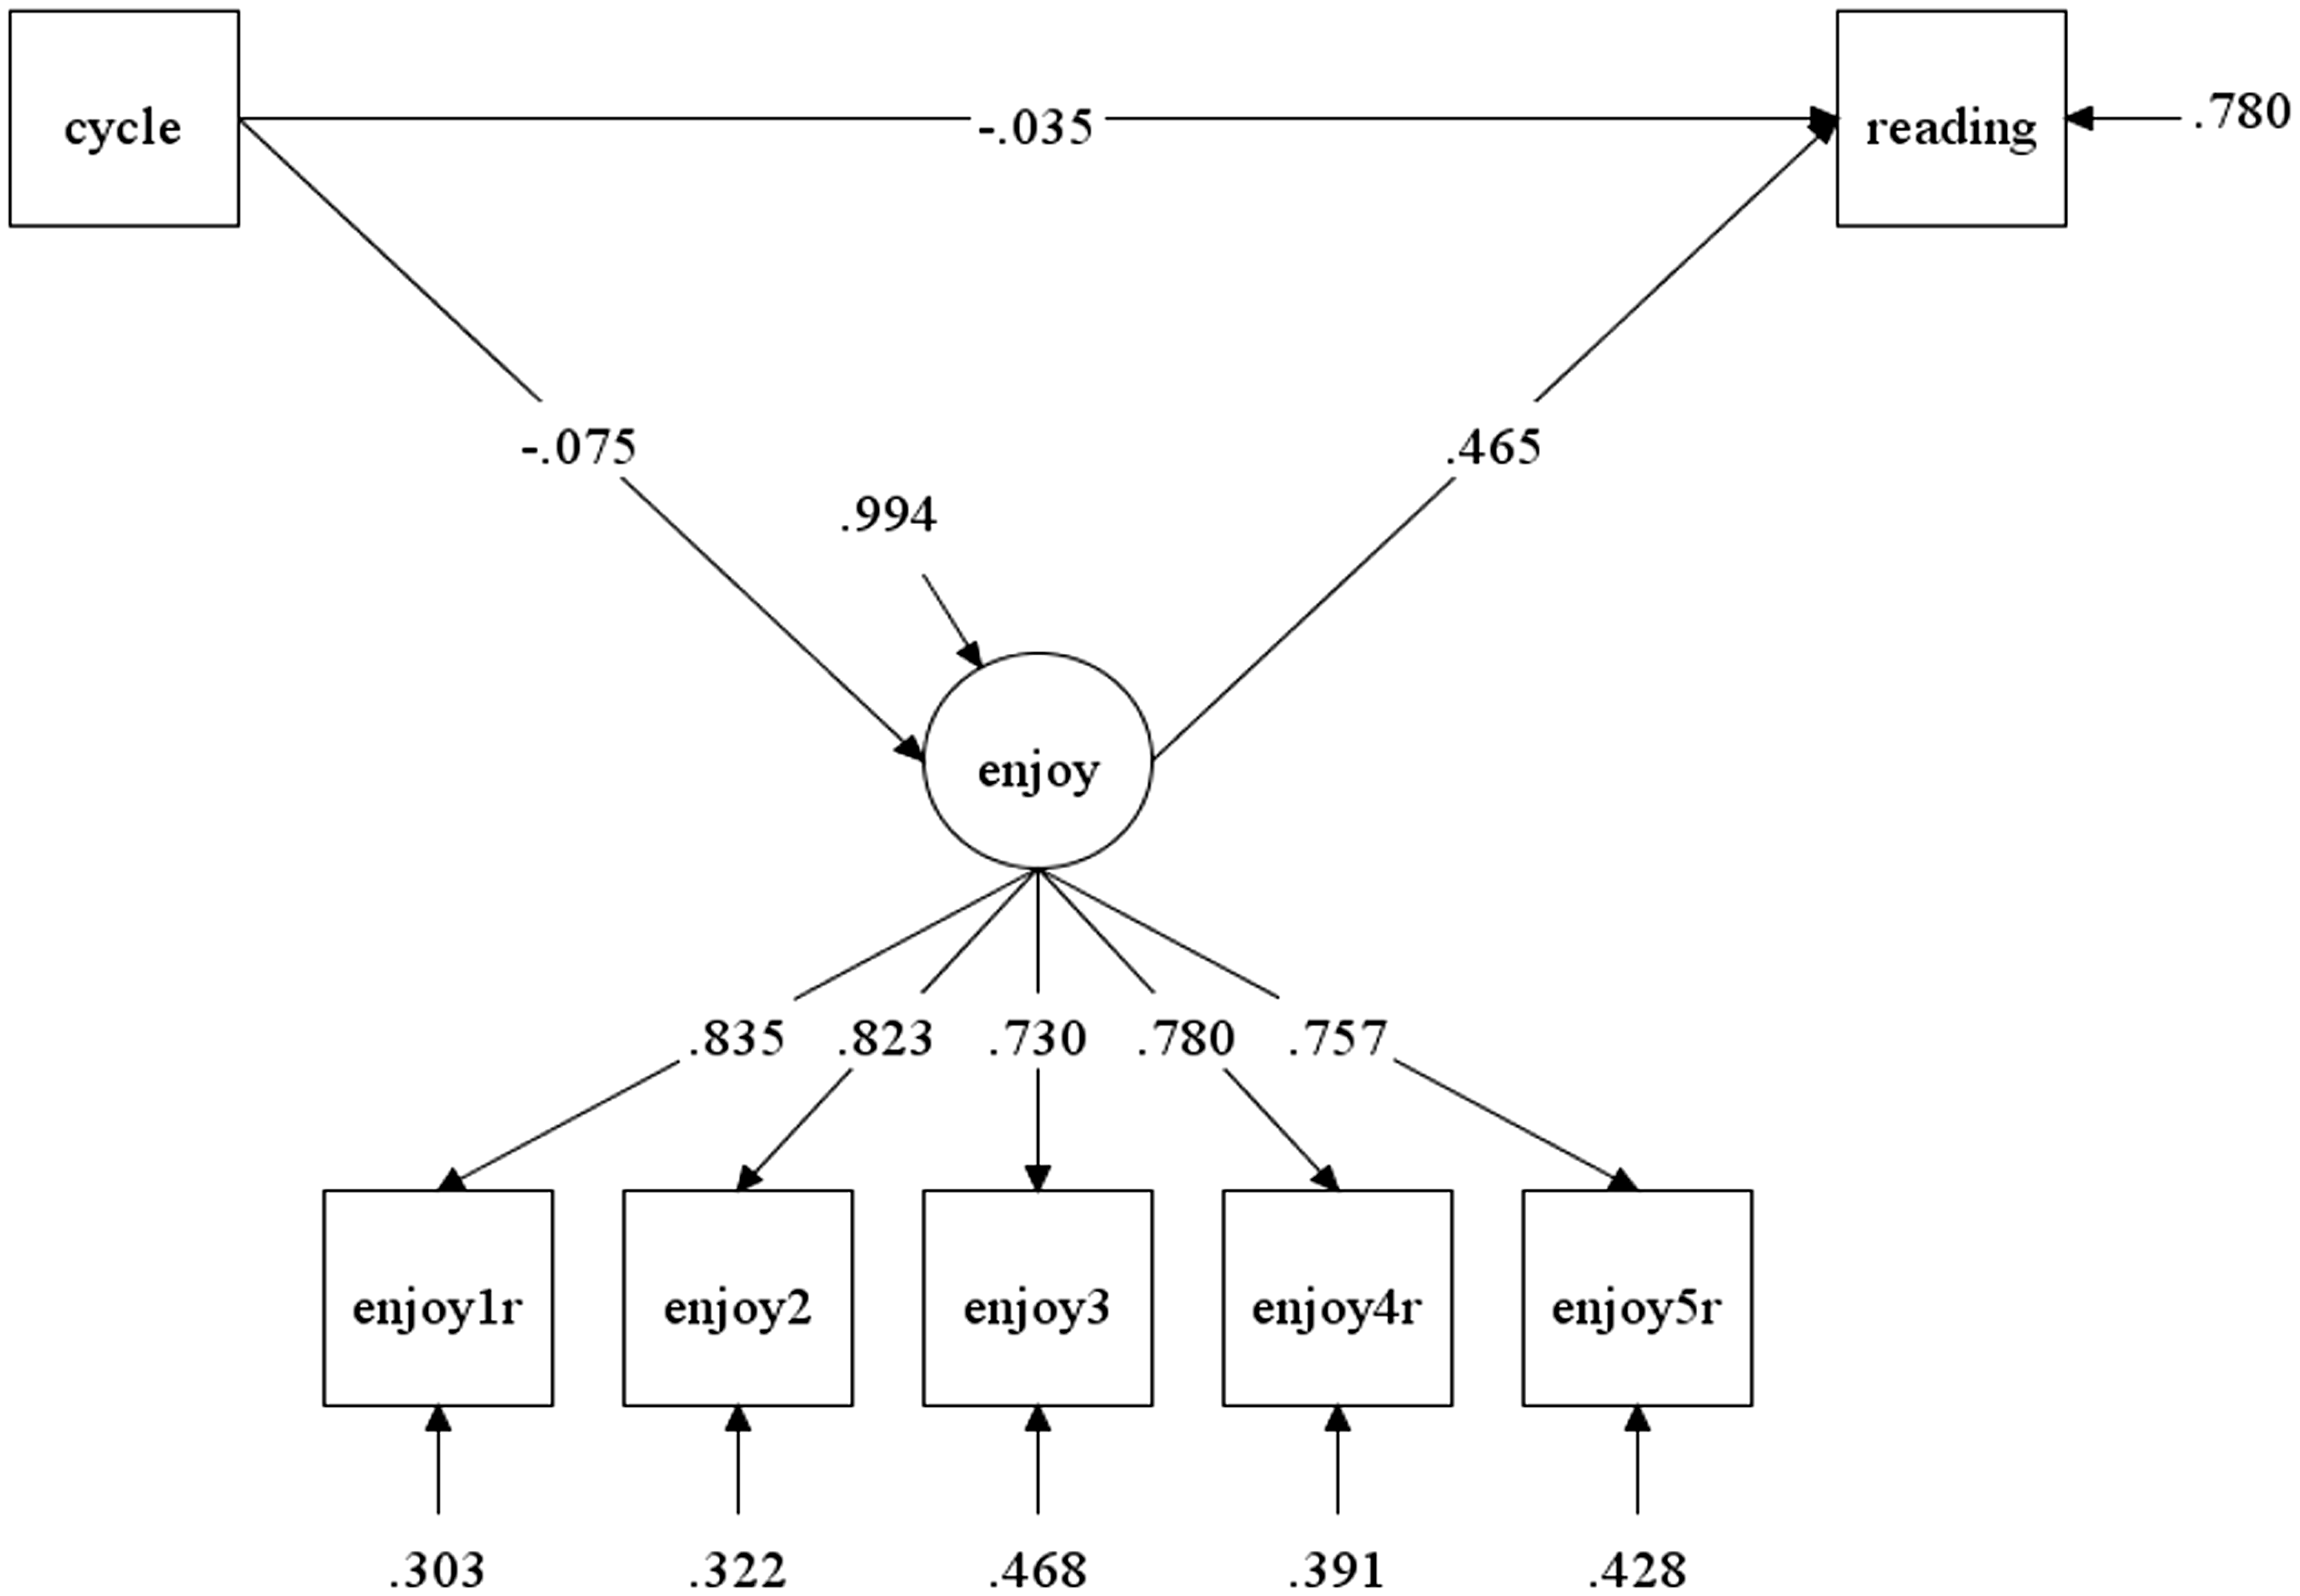
Standardised results for reading (Model 2).
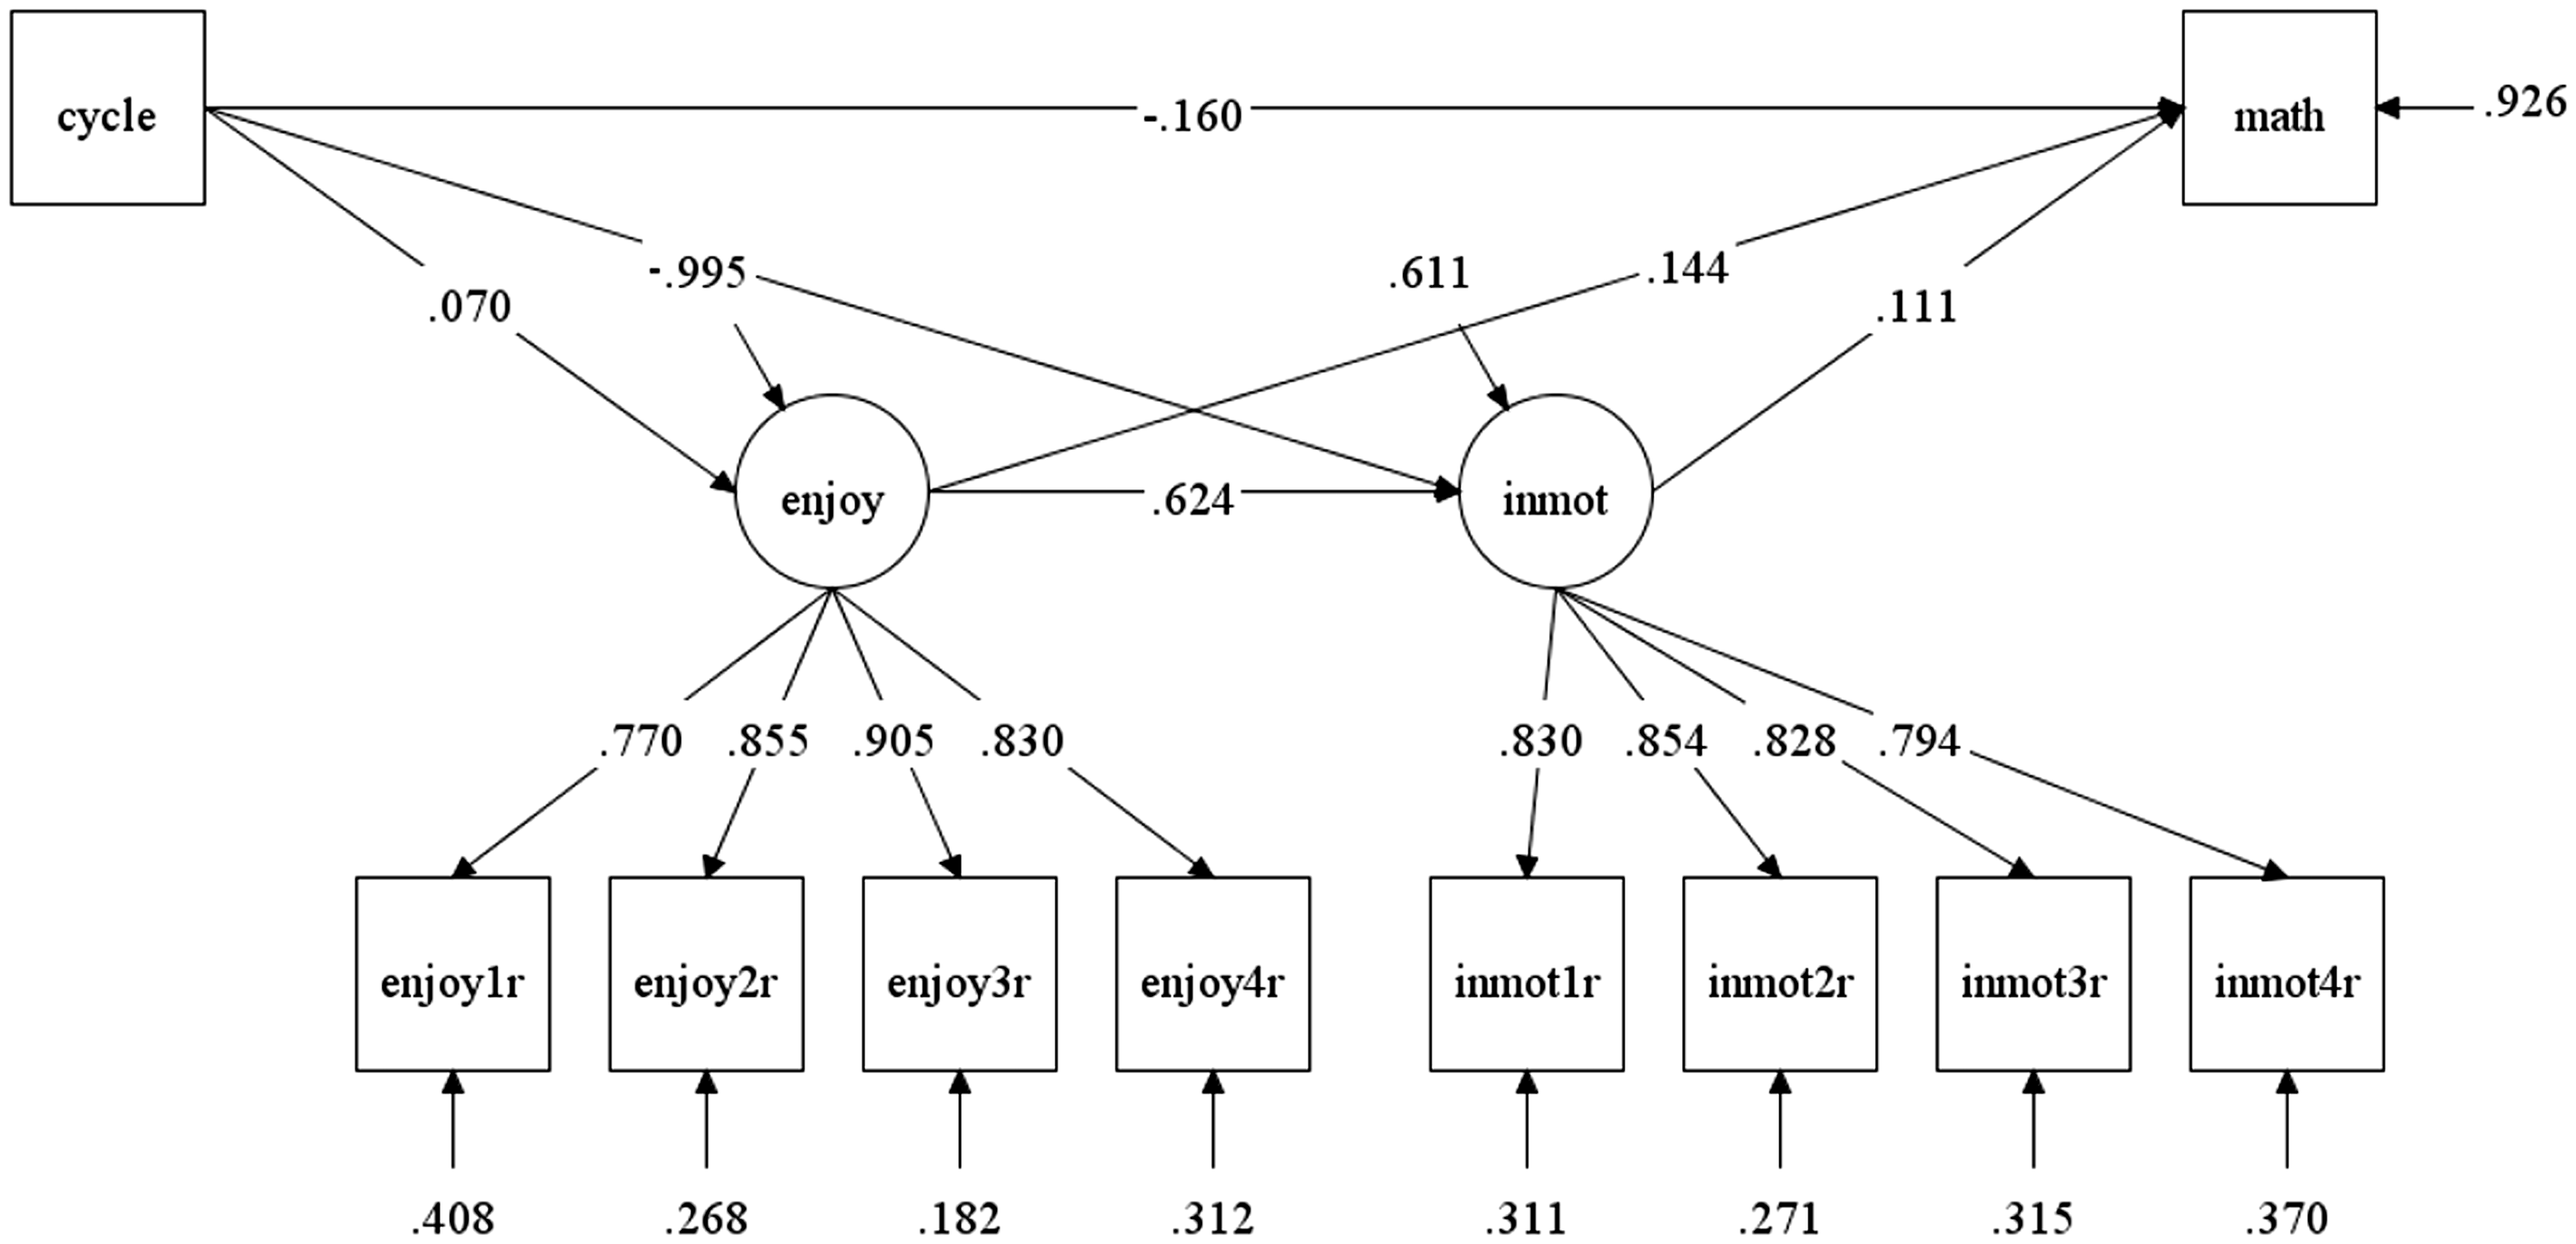
Standardised results for mathematics (Model 2).
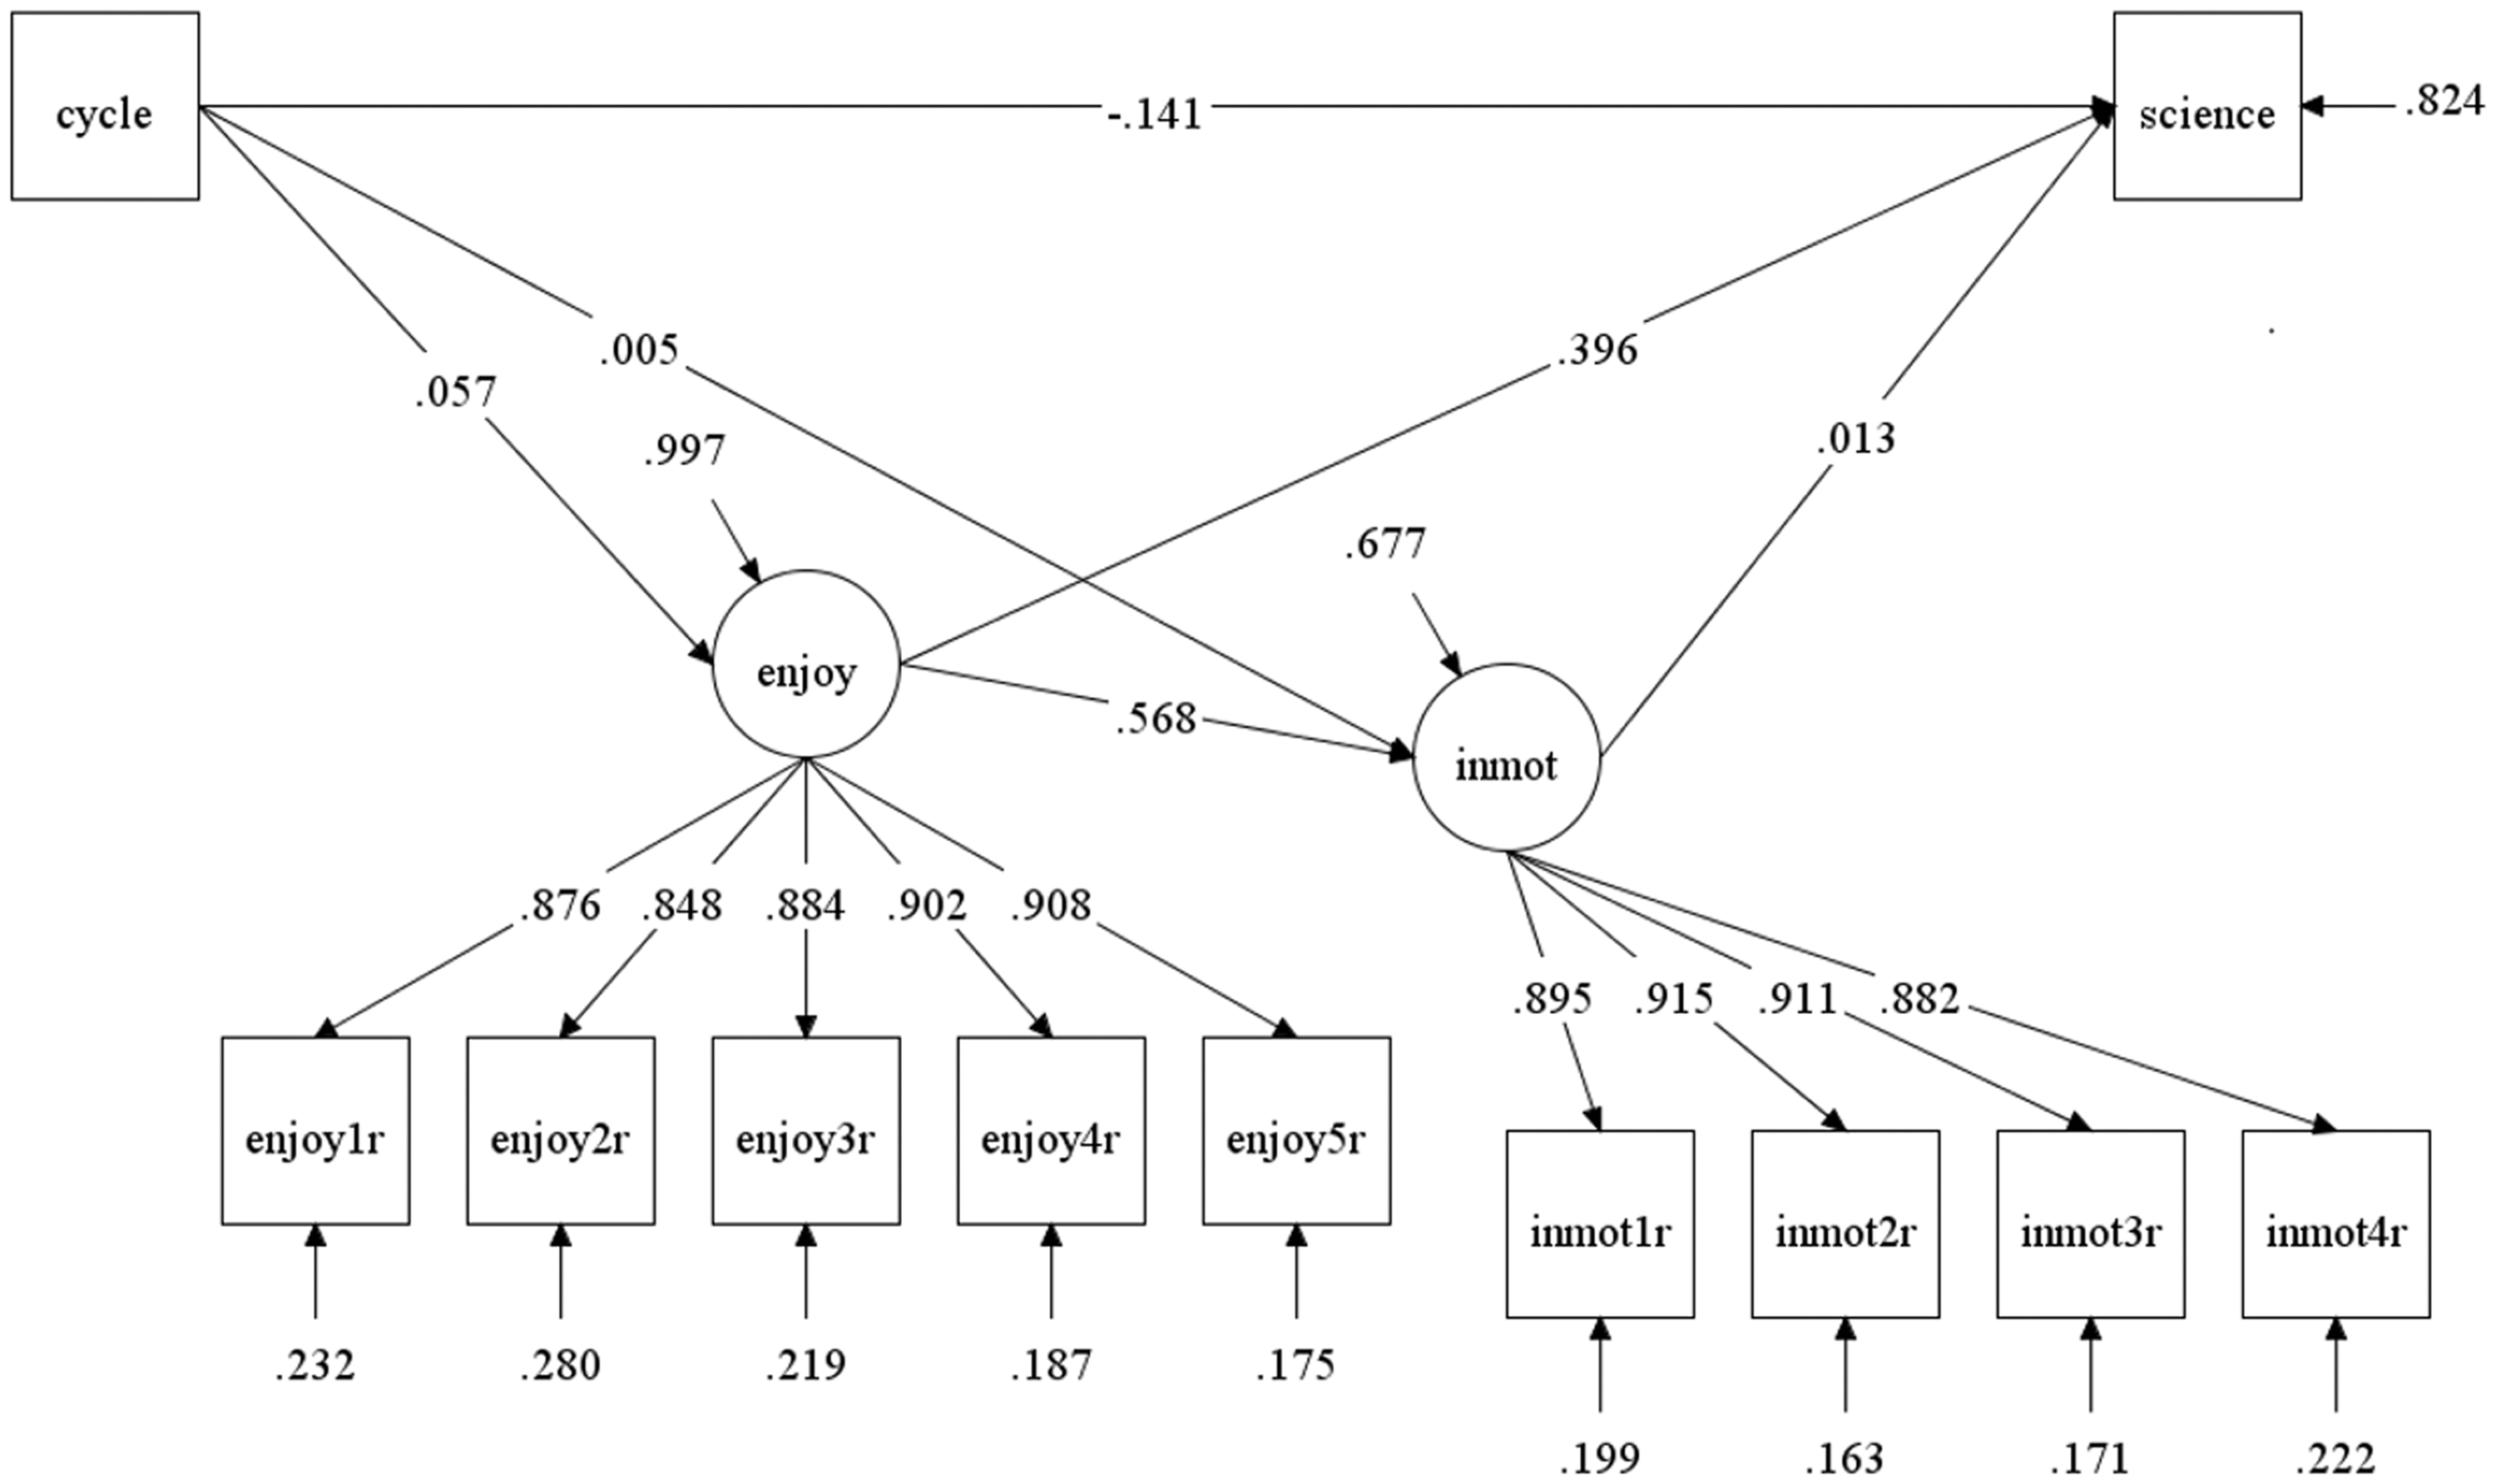
Standardised results for science (Model 2).
In general, using the combined data, the results indicated that enjoyment has positive effects on reading (β = 0.465, SE = 0.006), mathematics (β = 0.144, SE = 0.011) and science (β = 0.396, SE = 0.006) performances. The effect of instrumental motivation on mathematics performance was positive (β = 0.111, SE = 0.010). However, the effect of instrumental motivation on science performance was not significant. There were strong positive effects of enjoyment on instrumental motivation (β = 0.624, SE = 0.005) for mathematics and (β = 0.568, SE = 0.006) for science.
The trends in enjoyment, instrumental motivation and literacy performances can be inferred from the effects of cycle on these constructs. Results in Table 8 indicate that the level of enjoyment of reading declined slightly but significantly over time (β=-0.106, SE = 0.011). The level of enjoyment for both mathematics (β = 0.070, SE = 0.010) and science (β = 0.57, SE = 0.010) increased slightly but significantly over time. Instrumental motivation remained constant over time for both mathematics and science. It was also estimated that, taking into account the effect of attitudes, there were linear declines in a nine-year period by 5.152 score points (b = –5.151, β = –0.049, SE = 0.015) for reading, by 31.726 score points (b = –31.726, β = –0.160, SE = 0.015) for mathematics and by 29.440 score points (b = –29.440, β = –0.141, SE = 0.013) for science. Based on PISA 2018 results, these score point differences can be associated with years of schooling. Thomson et al. (2019) indicated that one year of schooling is equivalent to, on average, around 33, 28 and 27 score points for reading, mathematics and science, respectively. Therefore, accounting for effects of attitudes on performance and their trends over time, the linear declines for these nine-year periods for reading, mathematics and science are equivalent to 2, 13.5 and 13 months of schooling, respectively.
Model fit
The model fit indices for the measurement and SEM models for all domains are recorded in Appendix 2. The results showed that in general the model fit was acceptable for all models. The CFI and TLI values were mostly above 0.9. The RMSEA values were acceptable and SRMR values were all below 0.05.
Discussion and conclusion
The present study investigated the trends in student attitudes and literacy performances in reading, science and mathematics over the past 20 years using the data from the seven cycles of PISA studies. It has been reported in various studies that in general, there is a steady decline in reading, mathematics and science literacy performances of Australian 15-year-old students (Thomson et al., 2011, 2013, 2019). From the first assessment of reading as a major domain in 2000–2018, when reading was again a major domain, the average score has declined by 26 score points, equivalent to almost nine and a half months of schooling. Mathematical literacy was a major domain for the first time in 2003 when Australia achieved a mean score of 524. A consistent decline over the intervening cycles has resulted in an overall drop of 33 score points, equivalent to around 14 months of schooling. A downward trend was also observed in scientific literacy, from an average of 527 score points in 2006 to 503 score points in 2018, equivalent to almost 11 months of schooling. When the effects of attitudes on performance and their trend over time were taken into account, the adjusted linear declines for every nine-year period for reading, mathematics and science are estimated to be equivalent to 2, 13.5 and 13 months of schooling, respectively. To put this into perspective, according to Hanushek and Woessmann (2010), a change of 25 points in PISA has been estimated to be worth AUD3.6 trillion to Australia’s GDP. Morsy et al. (2018) reviewed various plausible explanations for these declining trends. These include, amongst others, the declining teacher quality where teachers are teaching out-of-field, the increase in privatisation of Australia’s education that causes a shift of students from government to Catholic and Independent schools and the decrease in time spent on a subject. However, they found no conclusive answer as to why, on average, students in Australia are performing worse over time. More research will be needed to investigate this further.
With regards to attitudes, the first research question centred on whether the same underlying constructs, in this case enjoyment and instrumental motivation, were being measured across groups and across time. From the results of the measurement invariance testing, it was found that these constructs behave in the same way over time. With this confirmation, the trends in attitudes and their effects on performances across PISA cycles can be made meaningfully.
In addressing the second and the third research questions regarding the changes in attitudes and their impacts on performance over time, two hypothetical SEM models were analysed. The results reveal that Australian 15-year-old students’ attitudes towards reading, which are expressed in terms of their enjoyment of reading, are relatively low. Around half of 15-year-old Australian students read only to get information they need or only if they had to, and one-third of the students reported that reading was a waste of time in 2000. The proportions of students that hold these negative attitudes appear to be growing over time. In terms of the impact of attitudes on performance, enjoyment of reading had a relatively strong effect on reading performance in 2000. This relationship became stronger in 2009. However, in 2018, it became slightly weaker than that of 2000, but still positive. This positive association between enjoyment of reading and reading performance is consistent with previous findings (Netten et al., 2011; Ozonder, 2015; Petscher, 2010).
For mathematics, the proportions of students agreeing and strongly agreeing to the majority of the items used to reflect the enjoyment of mathematics are below 50%, which indicates that the majority of students did not enjoy mathematics subject as such. In contrast, for most of the items related to instrumental motivation, around 75% of students indicated that they are aware of the importance of mathematics in their current and future life. As for science, the proportions of students agreeing or strongly agreeing to the items used to reflect the enjoyment of science are slightly better those for mathematics and are all above 50%. However, for items used to measure instrumental motivation towards science, the proportions of students agreeing or strongly agreeing are lower than those for mathematics, ranging from 55% to 70%. Despite declining students’ literacy performances in the domains of mathematics and science, students’ attitudes towards these two subject domains have become increasingly positive over time.
Attitudes towards mathematics, reflected by the two constructs of enjoyment of mathematics and instrumental motivation, are significantly and positively associated with students’ mathematics performance, consistent with the findings of Hemmings and Kay (2010). However, in general, these positive associations were getting weaker over time and are not as strong as the association between attitudes towards reading and reading performance. In terms of the impacts of attitudes towards science on science performance, it was found that enjoyment had a moderate positive effect on science performance. This association became weaker over time. However, after controlling for enjoyment, the effect of instrumental motivation on performance was not significant in either 2006 or 2015. Similar results have been reported by Bybee and McCrae (2011), McConney et al. (2014) and Osborne et al. (2003).
Having described the results above, it worth noting that conducting longitudinal analyses using PISA data is challenged by a range of issues. Each round of the survey focuses on a major domain, either reading, mathematical or scientific literacy. From its inception in 2000, definitions of reading, mathematical and scientific literacies have changed slightly to reflect changes in the contexts of our lives, so comparisons from one 9-year cycle to the next are not always straightforward. The instruments used and the constructs included to measure attitudes have also changed over time. Only a small number of trend constructs were included, which limits what aspect of attitudes can be included in this study. In interpreting the magnitude of the effects mentioned earlier, the exclusion of other important factors, such as cognitive ability or prior performance (Marks, 2017), economic, social, and cultural status (ESCS) (McConney & Perry, 2010; Perry & McConney, 2010), ethnicity (Song et al., 2014) and rurality (Sullivan et al., 2014, 2018), may inflate the real effect of attitudes on performance. Nonetheless, from the above findings, it can be argued that students can develop effective study habits if they find it enjoyable. Enjoyment is positively influenced by students’ interest and motivation to learn. It increases their desire to engage further with topics they are working on; to follow up the topic and acquire further knowledge and understanding. It impacts on how often and how willingly they engage with the subject. Positive emotions, such as enjoyment of learning, are also assumed to strengthen students’ instrumental or extrinsic motivation. Students’ enjoyment of learning develops out of their previous experiences in learning and function in new situations as expectations or predictions about further experiences. These attitudes, in turn, positively influence student performance. Therefore, these results point to the importance of both early experiences with learning processes and the maintenance of a sense of fun and excitement while learning the subject in supporting our attempt to lift student performance.
Footnotes
Declaration of Conflicting Interests
The author(s) declared no potential conflicts of interest with respect to the research, authorship, and/or publication of this article.
Funding
The author(s) received no financial support for the research, authorship, and/or publication of this article.