
Abstract
Objective:
To develop a Service Needs Index that measures a young person’s needs across domains relevant to care provision and to examine the index’s construction under different assumptions.
Methods:
A cohort of young people (n = 2193) aged 12–25 years who sought help at youth mental health services across Australia were invited to use a digital platform (Innowell) as part of their care and complete a multidimensional assessment. Using online assessment data from the eligible 1611 individuals (73.5%), a Service Needs Index comprising three sub-indices (Clinical, Psychosocial, and Comorbidity) was constructed under two weighting approaches, an equal weighted scheme and a weighting scheme constructed with expert input and correlation-optimisation. These approaches were examined and compared.
Results:
The Clinical, Psychosocial, and Comorbidity Indices were derived using standardised questionnaires to assess mental health symptoms and history, work and social functioning, and physical health and substance use, respectively. The expert input weighting scheme was favoured with less output uncertainty. Among those with the top 25% of Clinical Index scores, almost half also belonged in the group with the top 25% of Psychosocial Index scores, while 11.9% of the total sample were in the bottom 25% percentiles for both Clinical and Psychosocial Index scores.
Conclusion:
These indices should be assessed in real-world settings before recommendations are made about their feasibility and acceptability; however, the indices could differentiate between needs to guide individual-level decision-making about service pathways for young people. Furthermore, population-level analyses of these aggregated indices can inform strategic decisions related to service planning and design.
Introduction
In the last 20 years, the global landscape of mental health care has benefitted from a transformative shift towards early intervention provided by national access programmes and primary mental health services. These significant investments, exemplified by Australia’s headspace programme (McGorry et al., 2007), are committed to improving access to evidence-based care for those experiencing mental ill health. However, access and distribution of care to individuals remain key challenges for health services. Issues of inequity and disparities in appropriate care allocation have become apparent (Meadows et al., 2015).
Although these issues extend across the age span, they are most prominent in young people aged 12–25 years, wherein 75% of adult mental health disorders emerge (Kessler et al., 2005; McGrath et al., 2023; Merikangas et al., 2009). This period of biological, cognitive, and social development contributes to the difficulty in adequately assessing young people’s treatment needs. Many young people seeking care at early-intervention services have a mix of clinical symptoms, along with psychosocial and comorbid impairment, requiring a multidisciplinary treatment approach (Capon et al., 2023a). The lack of widely used multidimensional assessments, combined with the scarcity of specialist services required for treating complex cases, means that even when care is provided to a young person it can be unevenly distributed across areas of impairment or poorly suited to their needs. Therefore, the challenges faced by young people in accessing mental health services extend beyond availability, encompassing significant issues with the quality and appropriateness of care, as evidenced by their predominantly unclear or adverse clinical and social outcomes (Iorfino et al., 2022) and the disincentive to seek care due to rising cost (Rosenberg et al., 2022).
The adoption of clinical decision-support tools and prediction models to standardise and optimise individual decision-making continues to increase in research and real-world settings (Meehan et al., 2022). While many of these models aim to highlight prognosis or the risk of a certain outcome (e.g. onset/relapse of psychosis), no tool aims to quantify the extent and type of needs in youth who present with mental health concerns. The development of a tool for comprehensively measuring needs presents a significant opportunity for advancement in the field for three reasons. First, there is large variation in the needs of young people that present to mental health care (Capon et al., 2023b). Second, young people often do not receive appropriate care due to their needs not being properly assessed or understood. Third, many current clinical frameworks for youth mental health either require interview-based assessment (face-to-face or via telephone; necessitating an appointment and contributing to long wait-times) (Acri et al., 2016; Woody et al., 2019) or utilise single score distress measures, alongside clinical judgement, for deciding who should be elevated to specialist care (Mughal et al. 2025). Therefore, a mental health needs-based assessment tool that is digitally delivered can provide a solution that is scalable, accessible, and standardised.
The objective of this study is to design and examine a Service Needs Index that intends to measure the mental health of a young person across three major domains of need: clinical, psychosocial, and comorbidity. These three sub-indices were chosen because of their relevance to mental health and primary care pathways (see Figure 1).
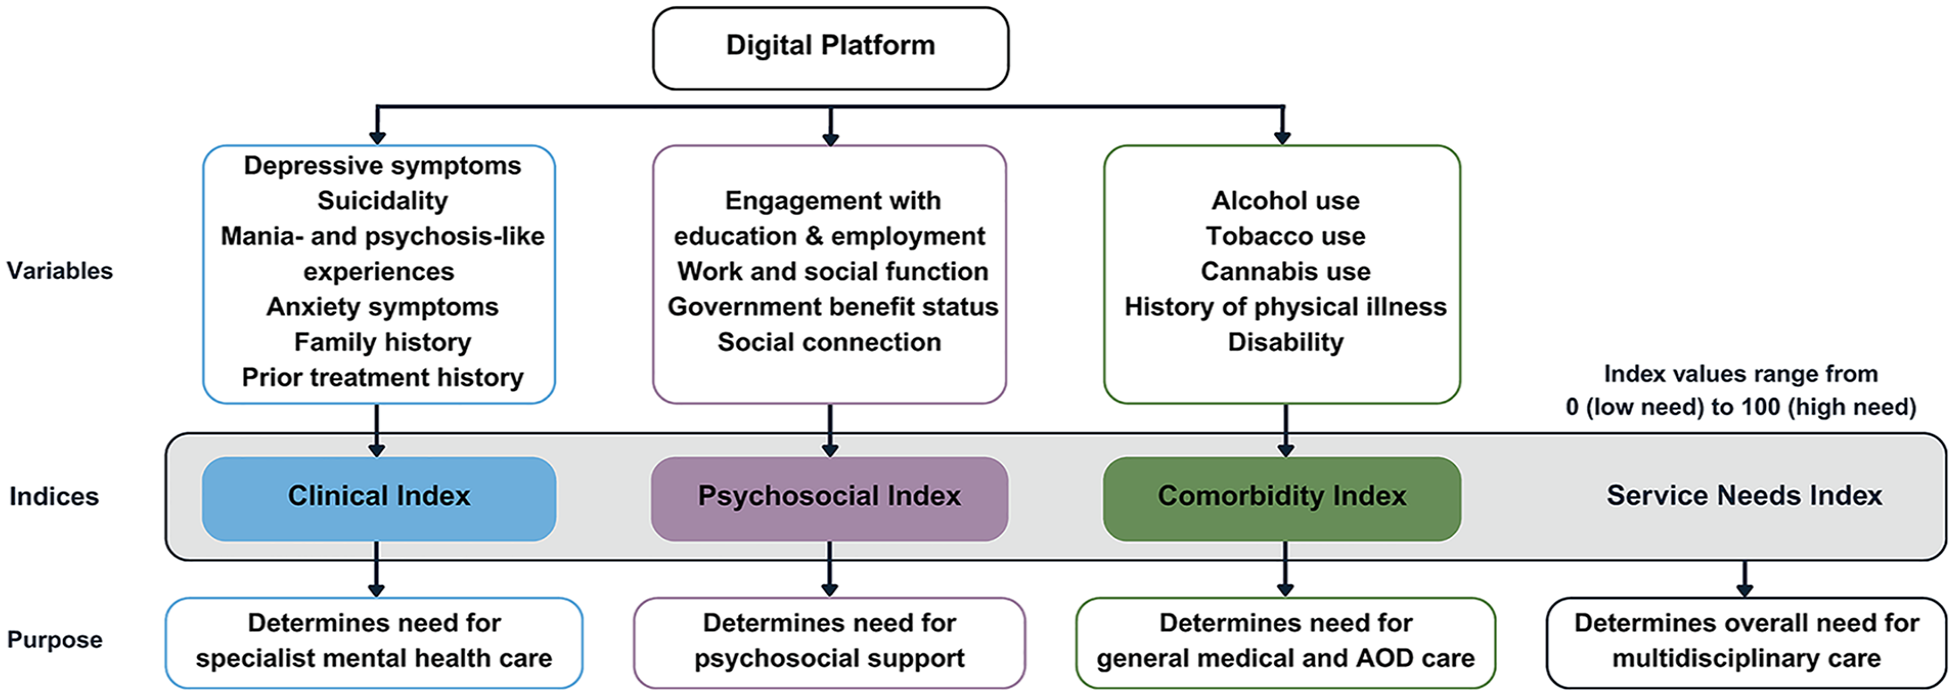
A schematic illustrating the different index levels. AOD, Alcohol and other Drugs.
Method
Ethics
The Northern Sydney Local Health District Human Research Ethics Committees approved this study (HREC/17/HAWKE/480), and all participants gave online informed consent (via an opt-out process). Parental consent was required for those aged under 14 years.
Participants
Participants were recruited from a group of young people aged between 12 and 25 years who presented to one of 12 primary care services (i.e. 11 headspace services (McGorry et al., 2007) from urban and regional areas of Australia, and one private, multidisciplinary mental health clinic in Sydney) between November 2018 and March 2023.
The Innowell platform
All participants used the Innowell platform for initial assessment and ongoing measurement-based care and routine outcome monitoring (Iorfino et al., 2019a). The Innowell platform is a digital technology (accessed via a smartphone or computer) that facilitates multidimensional assessment and management of mental health and well-being. Once users complete self-report questionnaires asking about a range of treatment needs (clinical symptoms, functioning, physical health, suicidality, alcohol/substance use), their results are displayed on a clinical dashboard, providing a transparent and comprehensive overview of their treatment needs. The young person’s dashboard can also be accessed by their clinician to support collaborative and personalised care planning.
Measures
All measures were self-report assessments conducted through the Innowell platform. A full description of the battery is provided in Supplementary Appendix 1. The initial assessment of the Innowell platform assesses demographics, social and occupational functioning, multiple dimensions of clinical mental health symptoms, and family and individual mental health and physical health history. For this study, only each eligible participant’s initial assessment (i.e. their baseline entry) was analysed.
Several standardised measures were utilised in this study, including the Altman Self-Rating Mania Scale (ASRM; Altman et al., 1997), the Suicide Ideation Attributes Scale (SIDAS; Posner et al., 2011), the Overall Anxiety Severity and Impairment Scale (OASIS; Norman et al., 2006), the Quick Inventory of Depressive Symptomatology (QIDS; Rush et al., 2003), the Prodromal Questionnaire to screen for psychosis risk (PQ-16; Ising et al., 2012), a modified version of the Eating Disorder Examination Questionnaire (EDE-Q; Hay et al., 2008), the Non-Suicidal Self-Injury Assessment Tool (NSSIAT; Whitlock et al., 2014), the Alcohol, Smoking and Substance Involvement Screening Test (ASSIST; Newcombe et al., 2005), the Alcohol Use Disorders Identification Test (AUDIT-C; Bush et al., 1998), the Work and Social Adjustment Scale (WSAS; Mundt et al., 2002) and Schuster’s Social Support Scale (SSSS; Schuster et al., 1990). A description of the measures included is presented in the Supplementary Appendix.
Inclusion criteria
Participants were included in this study based on the following criteria: (1) aged between 12 and 25 years at the time of assessment and (2) completed all questions assessing clinical symptoms and the WSAS questionnaire. A comparison of included and excluded individuals is presented in Table 1 of the Supplementary Appendix.
Statistical analyses
Statistical analyses were conducted using R (version 4.2.1). After inclusion criteria were applied, we imputed mode values to address data (n = 5; assumed to be missing at random). Missing data are reported in the footer of Table 1.
Demographic and clinical characteristics of the sample (N = 1611).
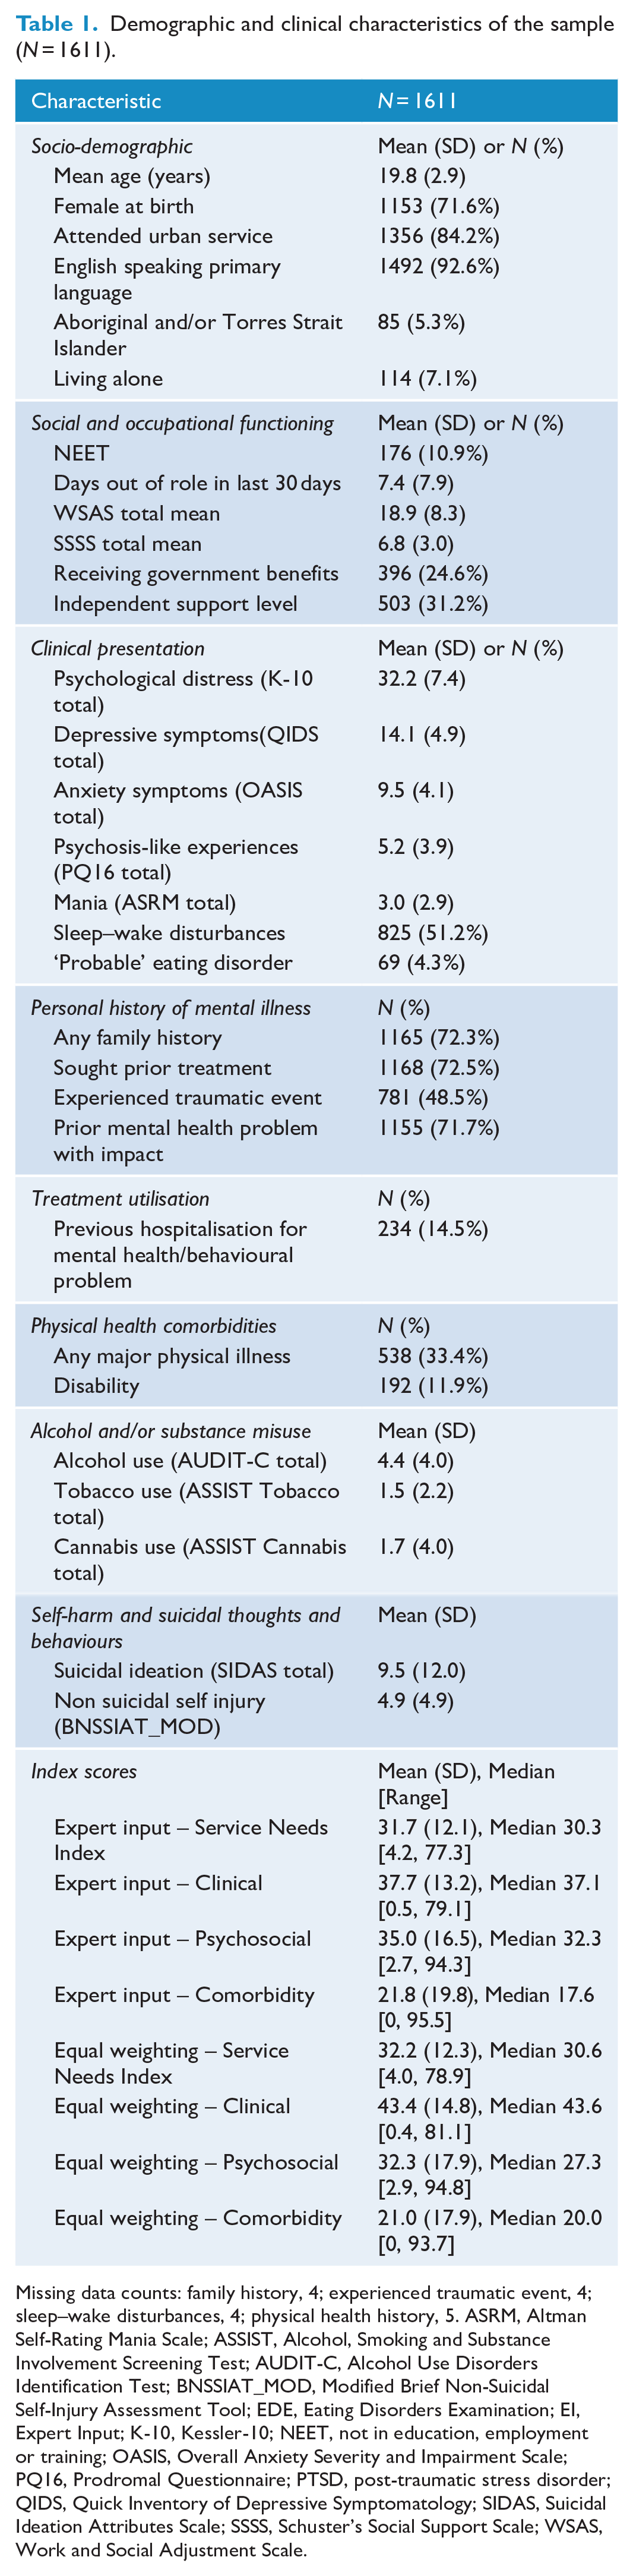
Missing data counts: family history, 4; experienced traumatic event, 4; sleep–wake disturbances, 4; physical health history, 5. ASRM, Altman Self-Rating Mania Scale; ASSIST, Alcohol, Smoking and Substance Involvement Screening Test; AUDIT-C, Alcohol Use Disorders Identification Test; BNSSIAT_MOD, Modified Brief Non-Suicidal Self-Injury Assessment Tool; EDE, Eating Disorders Examination; EI, Expert Input; K-10, Kessler-10; NEET, not in education, employment or training; OASIS, Overall Anxiety Severity and Impairment Scale; PQ16, Prodromal Questionnaire; PTSD, post-traumatic stress disorder; QIDS, Quick Inventory of Depressive Symptomatology; SIDAS, Suicidal Ideation Attributes Scale; SSSS, Schuster’s Social Support Scale; WSAS, Work and Social Adjustment Scale.
Variable categorisation and treatment
Variables were categorised into three pre-defined sub-indices: ‘Clinical’ (including psychosis-like and mania-like experiences, suicidality, anxiety, depression, eating disorder behaviours, family history of mental health disorders, mental health help-seeking history), ‘Psychosocial’ (including engagement with employment, education or training, government benefit status, social and occupational functioning, and social connection) and ‘Comorbidity’ (including disability, tobacco smoking and alcohol use, physical illness history).
Construction of the Service Needs Index
We constructed the Service Needs Index with the R Package ‘COINr’ (Becker et al., 2022). The index comprised three levels:
Questionnaire scores (e.g. ASRM, SIDAS).
Clinical Index, Psychosocial Index, and Comorbidity Index scores.
The Service Needs Index score.
Each index score (levels 2 and 3) was transformed such that the minimum (least severe) and maximum (most severe) scores were 0 and 100, respectively. We explored two weighting strategies (1) equal weighting and (2) expert weighting combined with correlation optimization) to create the Service Needs Index.
We first built the indices with an equal weighting scheme (OECD et al., 2008). All 19 questionnaire variables were standardized with min/max standardization, weighted equally, and the indices were aggregated with the arithmetic mean.
For the second index approach, we used a different weighting scheme comprising two methods. Level 1 variables (e.g. symptom total scores) were weighted using consensus expert input from two senior psychiatrists (I.B.H., E.M.S.), highly skilled in youth mental health care delivery. These weights also aligned with our longitudinal studies of youth in mental health care, with higher weightings for variables that have greater prospective association with poor outcomes (e.g. functional impairment and illness progression) (Iorfino et al., 2019b, 2022). Then, for the Level 2 weightings, we reverse-engineered the weights using an optimisation approach. This approach ensures equal correlation between each Level 2 indicator and the Service Needs Index score (Level 3).
Correlation analysis
To investigate the relationship between individual variables (e.g. questionnaire scores) and the sub-indices (Clinical, Psychosocial, and Comorbidity), we calculated non-parametric correlation analyses and report Spearman coefficients.
Uncertainty and sensitivity analyses
After constructing the indices using two separate methods (equal weighting and optimised weighting approach), we conducted two sets of uncertainty and sensitivity analyses for each of the two approaches. Both analyses utilise Monte Carlo methods that iterate 5000 calculations of the index scores with each calculation consisting of small, simultaneous variations to the input. The output is then a distribution of possible scores for each individual, given these variable manipulations, and is used to calculate the average mean rank change (i.e. individuals are ordered based on their nominal Service Needs Index score, and for each iteration their rank change is recorded).
The sensitivity analyses in COINr follow a variance-based approach (Saisana et al., 2005). We specified a distribution of values for each assumption, and then estimated the variance using a Monte Carlo simulation. We examined assumptions regarding findicator weights (with a noise factor of 50%), aggregation methods (arithmetic mean vs geometric mean), and normalisation methods (min-max scaling vs z-score standardisation). Outputs of these analyses are reported as sensitivity indices for each assumption, which are measures of how much each independent variable, alone and in combination with others, contributes to the variance of the dependent variable.
Results
Sample characteristics
A total of 2193 young people aged 12–25 years consented to this study and completed the initial Innowell questionnaire. Of this entire cohort, 1611 individuals (73.5%) were eligible for the analyses based on our inclusion criteria. Table 1 presents the demographic and clinical characteristics for this sample. The mean age was 19.8 years; 10.9% were not engaged in education, employment, or training (NEET); 71.6% were female at birth, and 5.3% identified as Aboriginal and/or Torres Strait Islander. Participants presented to one of 12 services, with 75.6% of the sample located in New South Wales, 16.4% in South Australia and 8.0% in Queensland. These participant counts by tenant and state are presented in Table 2 of the Supplementary Appendix.
Weightings
The weighting scheme is presented in Table 3 of the Supplementary Appendix. The weightings for the expert input approach placed value on specific variables prospectively associated with poor outcomes (Iorfino et al., 2019b, 2022). For example, suicidality and mania were rated three times higher than anxiety symptoms. The optimisation of weightings for the Clinical, Psychosocial, and Comorbidity indices were 1.12, 1 and 1.04, respectively. These weightings were calculated to balance all correlations between the three index scores as 0.73 with the Service Needs Index.
Sensitivity and uncertainty analyses of index scores
For the equal weighting approach, the median score (and range, within 0–100) for the Clinical Index was 43.6 (0.4–81.1), 27.3 (2.9–94.8) for the Psychosocial Index and 20.0 (0–93.7) for the Comorbidity Index. For the expert input approach, the median score (and range, with a possible range of 0–100) for the Clinical Index was 37.1 (0.5–79.1), 32.3 (2.7–94.3) for the Psychosocial Index and 17.6 (0–95.5) for the Comorbidity Index.
The output of the uncertainty analyses revealed an average rank difference (how much the ranks of individuals change under different methodological conditions) of 74.4 (4.6%; median 55.7, SD = 63.8) and 67.9, (4.2%; median 53.7, SD = 60.9) for the equal and expert input indices, respectively. Lower rank differences suggest more stable rankings.
We calculated the total effect sensitivity index which measures the effect of an input variable on the output and distinguishes between direct and indirect interactions with other input variables. For the equal weighting and expert input approaches, respectively, the normalisation sensitivity index was 0.63 (95% confidence interval [CI]: 0.58–0.68) and 0.61 (0.57–0.65), the aggregation sensitivity index was 0.38 (0.34–0.42) and 0.34 (0.31–0.38), and the weights sensitivity index was 0.18 (0.16–0.19) and 0.21 (0.19–0.22). The order of importance for the three assumptions were therefore as follows: normalisation, aggregation, and weighting scheme.
Correlation analyses
For the expert input weighting scheme, the Clinical Index had a very strong relationship (r ⩾.70) with depressive symptoms (QIDS; r = 0.71) and psychosis symptoms (PQ16; r = 0.73). The Clinical Index had strong correlations with external variables that were not used in its construction, including both psychological distress (K10; r = 0.60) and work and social functioning (WSAS; r = 0.54). The Psychosocial Index had strong correlations with external variables that were not used in its construction, including anxiety symptoms (OASIS; r = 0.44), depressive symptoms (QIDS; r = 0.52) and psychological distress (K10; r = 0.49). The Comorbidity Index had a very strong relationship with physical illnesses (r = 0.76) and a strong relationship with disability status (r = 0.55). Notably, it did not have a strong relationship with any external variables not used in its construction.
The highest correlation coefficient between the indices was among the Clinical Index and Psychosocial Index (r = 0.45). The Clinical Index and Comorbidity Index correlation was weaker (r = 0.27), as was the correlation among the Psychosocial Index and the Comorbidity Index (r = 0.24).
Distribution of index scores
Figure 2 illustrates both Clinical and Psychosocial Index scores for this cohort. Among those with the top 25% of Clinical Index scores, almost half (11.5% of sample) also belonged in the group with the top 25% of Psychosocial Index scores. Moreover, 11.9% of the total sample were in the bottom 25% percentiles for both Clinical and Psychosocial index scores.
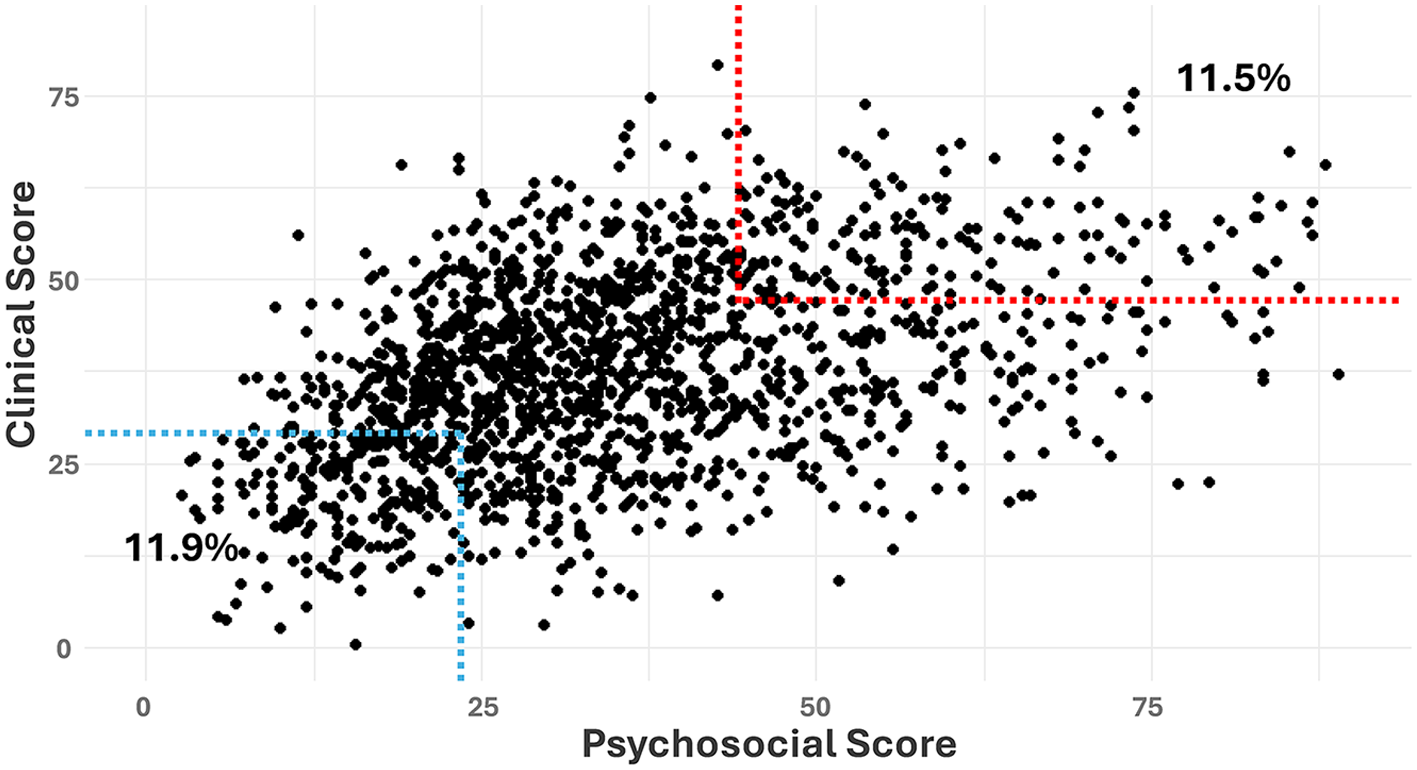
Scatter plot of the Clinical and Psychosocial Index scores.
Density curves and cumulative distribution functions for each Level 2 index are shown in Figure 3. Both the Clinical and Psychosocial Indices resemble a bell-shaped distribution, and the Comorbidity Index distribution resembles an asymmetric bimodal distribution.
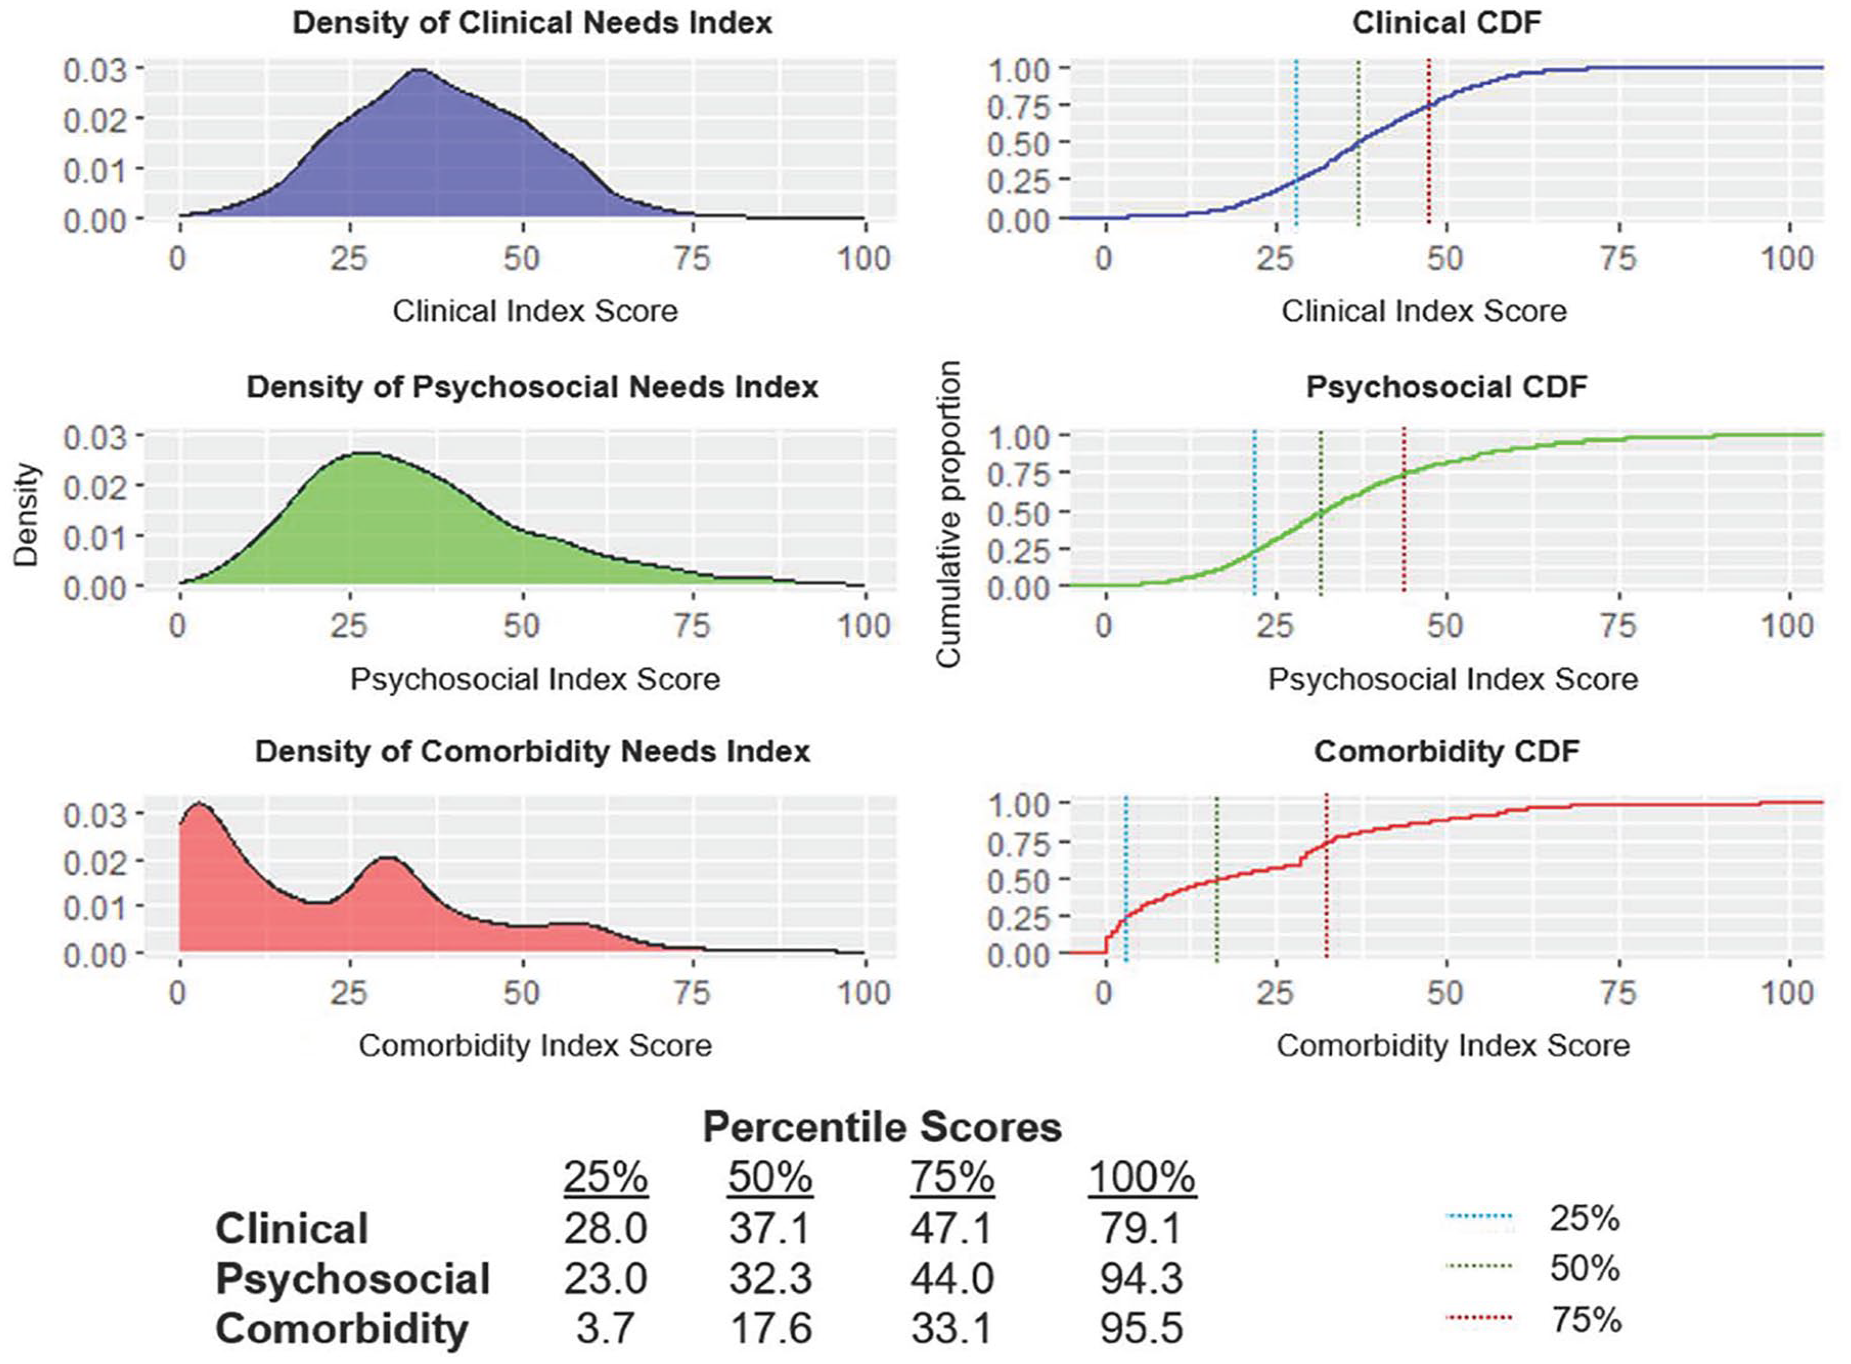
Density plots of Clinical, Psychosocial and Comorbidity Index scores for N = 1611 young people.
Discussion
This study presents a novel approach to measuring and differentiating the clinical, psychosocial, and comorbidity treatment needs of young people. Our proposed solution utilises digital technology to calculate three index scores which could translate into practical health service level and individual-level decision-making. These indices aim to quantify the need for specialist mental health care (clinical; e.g. treatment provided by a psychologist or psychiatrist), non-clinical psychosocial support (psychosocial; e.g. employment, housing, education support) and interventions for general allied health and medical concerns (comorbidity; e.g. substance misuse, physical health comorbidity). Future work is necessary to assess the validity and acceptability of this tool in real-world settings; however, its development illustrates a proof of principle for differentiating the treatment needs for young people presenting for mental health care.
By comparing two different weighting approaches, we found that the expert and optimised weightings were preferred to the equal weighting scheme because of its lower output uncertainty, higher correlation with Kessler-10 (K-10) scores, and accounting for known prospective predictors of poor functional and clinical outcomes. The likely advantage for using these indices to make care planning decisions, rather than the K-10, is that the indices more clearly differentiate the needs of a young person. For example, while the K-10 had a strong correlation with the Clinical Index (r = 0.60), its relationship with the Psychosocial Index was moderate (r = 0.49) and very weak with the Comorbidity Index (r = 0.10).
Moreover, the indices did not have a pairwise correlation coefficient above 0.45 and the Comorbidity Index did not have a strong relationship with any external variables. This suggests that separate indices, which measure the need for specific service pathways, may describe a young person’s treatment needs in greater detail than a single score. Despite the multidimensional needs among young people seeking mental health care (Capon et al., 2023b), most decision-support tools in youth mental health oversimplify a complex mix of factors into a single broad category of risk, limiting the potential for personalised treatment. For example, the Australia’s Initial Assessment and Referral Decision Support Tool (IAR-DST; Australian Government, 2021) poorly differentiates between clinical care needs that can be delivered by psychologists or psychiatrists and other psychosocial needs requiring social, welfare, employment, or housing support. Indeed, the IAR-DST positively shifts focus from categorising needs based on diagnoses, complementing clinical staging models in youth mental health (Hickie et al., 2013). However, its categorical structure hinders the effective components of measurement-based care (Iorfino et al., 2019a). We argue for a future focus on continuous scoring systems, like the indices we’ve presented, to better support personalised care pathways.
Our indices, alongside the comprehensive data collected by Innowell, support multidisciplinary care approaches in primary settings. On an individual level, the Clinical Index allows young people to possess high scores without receiving a formal diagnosis, and will therefore guide appropriate care-delivery despite not meeting the criteria for a full-threshold diagnosis. Figure 3 illustrates bell-shaped distributions of need for both Clinical and Psychosocial Indices, allowing services to consider care pathways tailored to their available resources so that those most in need of clinical care can receive targeted interventions (e.g. specialist psychological care for those with a Clinical Index score > 47.1). However, real-world cut-offs should be informed by local service capacity, and service frameworks should be flexibly designed so that resources can be scaled based on the changing distribution of needs. Notably, there are other methods to examine the impact of different decision thresholds such as decision curve analysis, and these should be explored in future work to explore individual health outcomes and system efficiency.
Furthermore, the Service Needs Index may be useful for population-level analyses of complexity across service sites. Despite the range of definitions for complexity in mental health (Gallant and Good, 2023), we refer to complexity as a combination of factors that predict poor outcomes and have assumed herein that complexity is additive. The different weighting scheme therefore allows the indices to be more sensitive to changes in critical variables. By examining index scores across a population (i.e. a service or Primary Health Network), our approach may guide the allocation of resources to meet the local demand of need. Indeed, among individuals with the top 25% of Clinical Index scores, almost half also belonged in the group with the top 25% of Psychosocial Index scores (Figure 2). In theory, this group could be directed to the most specialised and intense services available. Conversely, 11.9% of the total sample were in the bottom 25% percentiles for both Clinical and Psychosocial index scores, which could represent individuals that would benefit from immediate, low-intensity, digital interventions (e.g. self-directed therapy), allowing for timely and appropriate care across services.
Limitations
This work has limitations that provide a foundation for future refinement and research. First, the tool requires a young person to complete a full battery of questionnaires that could be considered a time burden. Second, the analyses lack wider validation of the extent to which index values reflect ‘real treatment needs’. Third, while digital technology enables standardised and scalable assessments, they should not overshadow the importance of comprehensive face-to-face care. Those with lower literacy skills or who have limited access to technology may face barriers to engaging with digital assessments, and there is a risk that relying on these tools could be perceived as depersonalising care. However, these assessments and index scores are designed to complement – not replace – clinical interactions. Unlike comprehensive in-person assessments, these indices do not allow for immediate adaptation of questions based on non-verbal cues and contextual information. Yet, they provide a standardised overview of key treatment needs, which can support clinicians in conducting more focused assessment. Future research should continue to explore young people’s preferences for digital and face-to-face assessment, and how these approaches affect engagement and treatment outcomes.
Finally, the feasibility and validity of this index is unknown. Future work should embed this tool in the existing Innowell platform in real-world mental health settings to identify any changes necessary to the Expert Input weighting scheme, as these can be tailored to measure needs more accurately as more longitudinal data of youth mental health outcomes becomes available. Importantly, the development of this index will be an iterative process, requiring both theoretical and empirical validation and subsequent modifications.
Conclusion
These indices, alongside the comprehensive data collected by Innowell, could be used in initial assessment to guide both individual-level treatment decision-making and broader population-level resource allocation. Before this occurs, acceptability and feasibility trials of the indices should be conducted to explore its practical utility. By using a comprehensive assessment of mental health history, demographics and clinical symptoms to generate three meaningful measures of need, these indices hold the potential to address the limitations of categorical-classification decision-support tools. The evolution of tools such as these can help maximise returns on recent significant investments in youth mental health. This would mean better outcomes for individuals and their families. It would also contribute to resolving the paradox of how these new services have to date struggled to demonstrate sustained, positive impacts (Allison et al., 2022).
Supplemental Material
sj-docx-1-anp-10.1177_00048674251336030 – Supplemental material for Matching needs to services: Development of a service needs index for determining care pathways in youth mental health
Supplemental material, sj-docx-1-anp-10.1177_00048674251336030 for Matching needs to services: Development of a service needs index for determining care pathways in youth mental health by William Capon, Mathew Varidel, Ian B Hickie, Jacob J Crouse, Sebastian Rosenberg, Gina Dimitroupoulos, Haley M LaMonica, Elizabeth M Scott and Frank Iorfino in Australian & New Zealand Journal of Psychiatry
Footnotes
Acknowledgements
Correction (May 2025):
This paper was updated to correct Figures 1 and ![]() .
.
Author Contributions
W.C., M.V., I.B.H. and F.I. conceptualised and designed the project. The analyses were conducted by W.C. and reviewed by M.V. W.C. wrote the draft of the manuscript, with input from M.V. and F.I. I.B.H. and F.I. acquired funding and supervised the project. All authors (W.C., M.V., I.B.H., J.J.C., S.R., G.D., H.M.L., E.M.S. and F.I.) interpreted results, discussed findings and critically reviewed and edited drafts of the manuscript. All authors read and approved the final manuscript.
Declaration of Conflicting Interests
The author(s) declared the following potential conflicts of interest with respect to the research, authorship and/or publication of this article: IBH is the Co-Director, Health and Policy at the Brain and Mind Centre (BMC) University of Sydney. The BMC operates an early-intervention youth services at Camperdown under contract to headspace. He is the Chief Scientific Advisor to, and a 3.2% equity shareholder in, InnoWell Pty Ltd which aims to transform mental health services through the use of innovative technologies. EMS is Principal Research Fellow at the Brain and Mind Centre, The University of Sydney. She is Discipline Leader of Adult Mental Health, School of Medicine, University of Notre Dame, and a Consultant Psychiatrist. She was the Medical Director, Young Adult Mental Health Unit, St Vincent’s Hospital Darlinghurst until January 2021. She has received honoraria for educational seminars related to the clinical management of depressive disorders supported by Servier, Janssen and Eli-Lilly pharmaceuticals. She has participated in a national advisory board for the antidepressant compound Pristiq, manufactured by Pfizer. She was the National Coordinator of an antidepressant trial sponsored by Servier. All other authors declare no conflicts of interest.
Funding
The author(s) disclosed receipt of the following financial support for the research, authorship and/or publication of this article: The funding sources of this study had no role in the design, data collection, data analysis and reporting of this study. This work was supported by the Medical Research Future Fund Applied Artificial Intelligence in Health Care grant [MRFAI000097]. W.C. was supported by the Australian Government Research Training Program (RTP) Scholarship. J.J.C. was supported by an NHMRC Emerging Leadership Fellowship (2008197). I.B.H. was supported by an NHMRC Research Fellowship (511921). F.I. was supported by the Bill and Patricia Richie Foundation and an NHMRC EL1 Investigator Grant (GNT2018157).
Ethical Approval and Informed Consent
The Northern Sydney Local Health District Human Research Ethics Committees approved this study (HREC/17/HAWKE/480), and all participants gave online informed consent (via an opt-out process). Parental consent was required for those aged under 14 years.
Data Availability Statement
The data presented in this manuscript is available upon request.
Supplemental Material
Supplemental material for this article is available online.
References
Supplementary Material
Please find the following supplemental material available below.
For Open Access articles published under a Creative Commons License, all supplemental material carries the same license as the article it is associated with.
For non-Open Access articles published, all supplemental material carries a non-exclusive license, and permission requests for re-use of supplemental material or any part of supplemental material shall be sent directly to the copyright owner as specified in the copyright notice associated with the article.