
Abstract
Objective:
Characteristics of difficult-to-treat depression (DTD), including infrequent symptom remission and poor durability of benefit, compel reconsideration of the outcome metrics historically used to gauge the effectiveness of antidepressant interventions.
Methods:
Self-report and clinician assessments of depression symptom severity were obtained regularly over a 2-year period in a difficult-to-treat depression registry sample receiving treatment as usual (TAU), with or without vagus nerve stimulation (VNS). Alternative outcome metrics for characterizing symptom change were compared in effect size and discriminating power in distinguishing the vagus nerve stimulation + treatment as usual and treatment as usual treatment groups. We expected metrics based on remission status to produce weaker between-group separation than those based on the classifications of partial response or response and metrics that integrate information over time to produce greater separation than those based on single endpoint assessment.
Results:
Metrics based on remission status had smaller effect size and poorer discrimination in separating the treatment groups than metrics based on partial response or response classifications. Metrics that integrated information over the 2-year observation period had stronger performance characteristics than those based on symptom scores at single endpoint assessment. For both the clinician-rated and self-report depression ratings, the metrics with the strongest performance characteristics were the median percentage change in symptom scores over the observation period and the proportion of the observation period in partial response or better.
Conclusion:
In difficult-to-treat depression, integrative symptom severity-based and time-based measures are sensitive and informative outcomes for assessing between-group treatment effects, while metrics based on remission status are not.
Introduction
Many depressed patients are well treated with currently available interventions. However, a substantial proportion, perhaps 25–35%, do not achieve or sustain remission after multiple treatment attempts (Jaffe et al., 2019; Rush et al., 2006c). Patients with difficult-to-treat depression (DTD) present diagnostic, clinical management and intervention research challenges (McAllister-Williams et al., 2020; Rush et al., 2019, 2022). Nonetheless, to provide optimal care for those who may improve but not achieve lasting remission, it is important to identify interventions that produce clinically meaningful symptom control and improvement in daily function and quality of life even when remission is elusive.
Patients with DTD often have general medical and psychiatric comorbidities, and substantial histories of prior failed treatment trials, which frequently disqualify them from acute phase trials of antidepressant treatments conducted for regulatory approval. These patients are unlikely to meet traditional thresholds that define positive clinical outcome at trial termination (e.g. remission). Alternative metrics that do not rely on single endpoint (SEP) assessment may be more sensitive to symptomatic improvement in these patients but have not been validated. Recently, new classes of pharmacological and neurostimulatory interventions are being developed as potential treatments of DTD (Aaronson et al., 2017; Cole et al., 2022; McIntyre et al., 2021; Roseman et al., 2017; Sackeim et al., 2020; Wu et al., 2021). Thus, clinical need and the possibility of novel interventions prompt consideration of a key clinical research challenge: how best to assess clinical outcomes in DTD, and, especially, how best to compare outcomes between two or more treatments (e.g. control vs intervention) when sustained remission is rare and symptom severity may fluctuate over time (McAllister-Williams et al., 2020; Rush et al., 2022).
In the previous paper in this series (Sackeim et al., 2023), we computed traditional and novel metrics for characterizing symptomatic improvement over a 2-year observation period in a registry sample of patients with DTD receiving treatment as usual (TAU) with and without adjunctive vagus nerve stimulation (VNS + TAU) (Aaronson et al., 2017). Using the clinician-rated Montgomery Åsberg Depression Rating Scale (MADRS) (Montgomery and Åsberg, 1979) and the 16-item Quick Inventory of Depressive Symptoms-Self Report (QIDS-SR) (Rush et al., 2003, 2006a), we calculated traditional SEP metrics based on symptom scores at the end of the observation period and integrative (INT) metrics that averaged or aggregated scores over the entire observation period. In this first study, the metrics were compared in their sensitivity to change in endpoint self-report ratings of quality-of-life (QoL).
This second study compares the same outcome metrics in their sensitivity to treatment group effects, a distinct issue of key importance for intervention research. We contrasted the metrics in their sensitivity to treatment conditions administered over a 2-year period, specifically whether patients received VNS + TAU vs TAU. Differential sensitivity to treatment effects may inform the selection of primary and secondary outcome measures in future trials in DTD. This study was predicated on the previously reported finding from this registry that the VNS + TAU group had superior symptomatic improvement compared with the TAU group across multiple outcome measures (Aaronson et al., 2017). The objective in this study was to compare the sensitivity of the varying metrics for quantifying symptomatic improvement in revealing this treatment condition effect. Specifically, we anticipated that, among dichotomous outcome classifications, remission status would have the weakest performance characteristics in separating the treatment conditions because remission would be uncommon in these patients. We anticipated that integrating multiple assessments obtained over time would be more reliable indicators of improvement with stronger performance characteristics in distinguishing the treatment groups than the comparable traditional SEP metrics.
Methods
Sample
The registry (ClinicalTrials.gov Identifier: NCT00320372) participants were 18 years and older and in a current major depressive episode (MDE) by Mini International Neuropsychiatric Interview (Sheehan et al., 1998) and DSM-IV-TR criteria (First and Pincus, 2002). The current MDE (unipolar or bipolar) was at least 2 years in duration, or the participant had a history of least 3 MDEs, including the current episode. Participants also demonstrated lack of response to 4 or more adequately delivered antidepressant pharmacological treatments, or nonresponse to a course of electroconvulsive therapy (ECT) or evidence-based psychotherapy. Treatments could be administered as monotherapies or concurrently. Inclusion also required a baseline Clinical Global Impression Severity (Guy, 1976) score of at least 4 and no past or current psychotic disorder, rapid cycling bipolar disorder or previous use of VNS.
Registry study participation was approved by an institutional review board (Western IRB, Olympia, WA; Approval Number: 20051737) and written informed consent was obtained from all participants. Details regarding the treatment of registry participants are provided elsewhere (Aaronson et al., 2017). The intent was to follow the natural course of DTD in the TAU group, and any psychopharmacologic, neurostimulation or psychotherapeutic intervention could be administered over the 5-year study period to any patient in either treatment group. VNS was administered only to the VNS + TAU group and throughout the observation period.
This report employed the same sample previously used to compare the metrics in their sensitivity to QoL outcomes (Sackeim et al., 2023) where a CONSORT diagram is presented. We excluded 200 of the 606 patients who enrolled in the registry. Participants were excluded who dropped out of the study before the 12-month follow-up (n = 5), who had insufficient symptom severity at baseline on the MADRS and/or QIDS-SR (n = 54) or who did not complete study assessments on or after the 12-month follow-up visit (n = 141). The final sample of 406 participants included 234 participants treated with VNS + TAU and 172 participants who received TAU.
Symptom assessments
The MADRS and QIDS-SR were administered at baseline (visit prior to surgical implantation of VNS), at 3, 6, 9, 12, 18 and 24 months post-baseline, and every 6 months thereafter until study termination at 60 months. The observation period used here was limited to the first 24 months post-baseline, since there was considerable missing data after 24 months and starting at 12 months post-baseline, assessments were conducted at only 6-month intervals. The QIDS-SR was completed on-site at each visit. After each on-site visit, the site notified central raters to initiate a patient telephone follow-up. The central raters were trained clinicians who conducted the MADRS assessments (Aaronson et al., 2017).
Outcome metrics
The SEP metrics were based on the last observed MADRS or QIDS-SR total score. These metrics, computed for both instruments, included: (1) the total symptom severity score at the end of the observation period; (2) the percentage change in this score relative to baseline ([pre-post]/pre) × 100; (3) partial response status, defined as a percentage change ⩾ 35%; (4) response status, defined as a percentage change ⩾ 50% and (5) remission status, defined as an endpoint score ⩽ 9 for the MADRS and ⩽ 5 for the QIDS-SR.
The integrated (INT) metrics incorporated all available scores during the observation period (post-baseline 3-, 6-, 9-, 12-, 18-, and 24-month visits). These metrics were divided into severity-based and time-based measures. Each INT metric corresponded to a specific SEP metric, but now averaging (severity-based) or aggregating (time-based) scores over time. For each patient, the INT severity-based metrics were (1) the median of total scores (either the MADRS or the QIDS-SR) over the six possible assessments during the post-baseline observation period and (2) the median percentage change from baseline in total MADRS or QIDS-SR scores as computed at each post-baseline visit. The INT time-based metrics were the proportion of the observation period that the participant met the threshold for (3) partial response, (4) response and (5) remission for each scale.
Statistical analyses
A pre-specified statistical plan detailed the statistical analyses performed in this and the previous study (Sackeim et al., 2023). The Shapiro–Wilk test was used to screen for departures from normality in continuous demographic and clinical measures and metric scores. The distributions of number of previous MDEs, hospitalizations in the last 5 years, and lifetime suicide attempts were skewed due to high outlying values. These variables were capped with a maximal score of 10. The treatment groups (VNS + TAU vs TAU) were compared in demographic and clinical characteristics using the Wilcoxon rank-sum test for continuous measures and Fisher’s exact test for categorical variables.
Effect size (ES) was calculated for each metric, reflecting the magnitude of the standardized difference between the treatment conditions in mean metric scores. For all metrics other than the SEP binary classifications (partial response, response and remission), ES was calculated as the difference between the means of the two groups relative to a pooled standard deviation, Cohen’s
ES provided a standardized measure to contrast the metrics in the magnitude of the difference between the two treatment groups in mean scores. However, ES values can be influenced by unrepresentative extreme scores that distort between-group differences. A related question concerns the extent to which metrics were useful in identifying whether participants were treated with VNS + TAU vs TAU, i.e. their accuracy in making this discrimination, which is less influenced by extreme scores. Receiver operating characteristic curves were generated for each metric in detecting the treatment conditions and standard signal detection methods applied to quantify overall performance (area under the curve, AUC), sensitivity (accuracy in detecting treatment with VNS + TAU) and specificity (accuracy in detecting treatment with TAU) (Green and Swets, 1966; McNicol, 2004; Stanislaw and Todorov, 1999). AUC provides an index of the overall performance in distinguishing the groups, where values of 0.5 indicate chance performance and values of 1.0 correspond to errorless detection. AUC values of 0.556, 0.639 and 0.714 correspond to small (d = 0.2), medium (d = 0.5) and large (d = 0.8) ES (Rice and Harris, 2005).
The Wilcoxon non-parametric matched-paired signed rank tests were used to test whether specific metric groupings differed in ES and AUC values. In this study, the 10 metrics based on the MADRS were compared in ES and AUC values to the 10 respective QIDS-SR metrics, and the 10 metrics based on SEP assessment were compared with their respective INT metrics.
Assignment to treatment group was not random, and the treatment groups differed in several clinical features at baseline. The propensity score method (Rosenbaum and Rubin, 1983) was used to determine whether the differences observed among the metrics in distinguishing the treatment groups were due to associations with imbalanced baseline prognostic features. Propensity scores, derived for each participant, reflected the probability of receiving VNS + TAU or TAU as a function of the baseline variables that distinguished the groups (Aaronson et al., 2017). These scores were divided into quintiles. A simultaneous regression analysis was performed on each metric score with treatment group (VNS + TAU vs TAU) and propensity score quintile as independent variables (Cohen et al., 2003). The extent of each metric’s separation of the treatment groups after propensity score adjustment was assessed with the standardized regression coefficient (ß) which quantified the strength of the relationship between treatment condition and the metric score after each variable has been standardized. This coefficient is ‘unitless’ and allows comparison across metrics with different scaling (Newman and Browner, 1991). The metrics were also compared in the amount of variance in the outcome metric accounted for by treatment condition (R2). This use of regression methods to control for propensity scores provides standardized estimates of treatment effects robust across outcome models (Vansteelandt and Daniel, 2014).
Results
Sample characteristics
The VNS + TAU and TAU treatment groups included a large proportion of patients with severe, chronic and highly treatment-resistant major depression that did not differ in the age or gender (Table 1). The treatment groups differed in several ways. Baseline MADRS and QIDS-SR total scores, and number of lifetime MDEs, psychiatric hospitalizations in the last 5 years, and failed courses of MDE treatment were greater in the VNS + TAU group. This group also included more patients with a diagnosis of bipolar disorder and a history of treatment with ECT. These differences were observed prior to propensity adjustment. After covariate adjustment for the propensity score quintiles, the treatment groups did not differ in any demographic or baseline clinical features listed in Table 1 (data not shown).
Baseline demographics and clinical characteristics of the total sample and the VNS + TAU and TAU treatment groups.
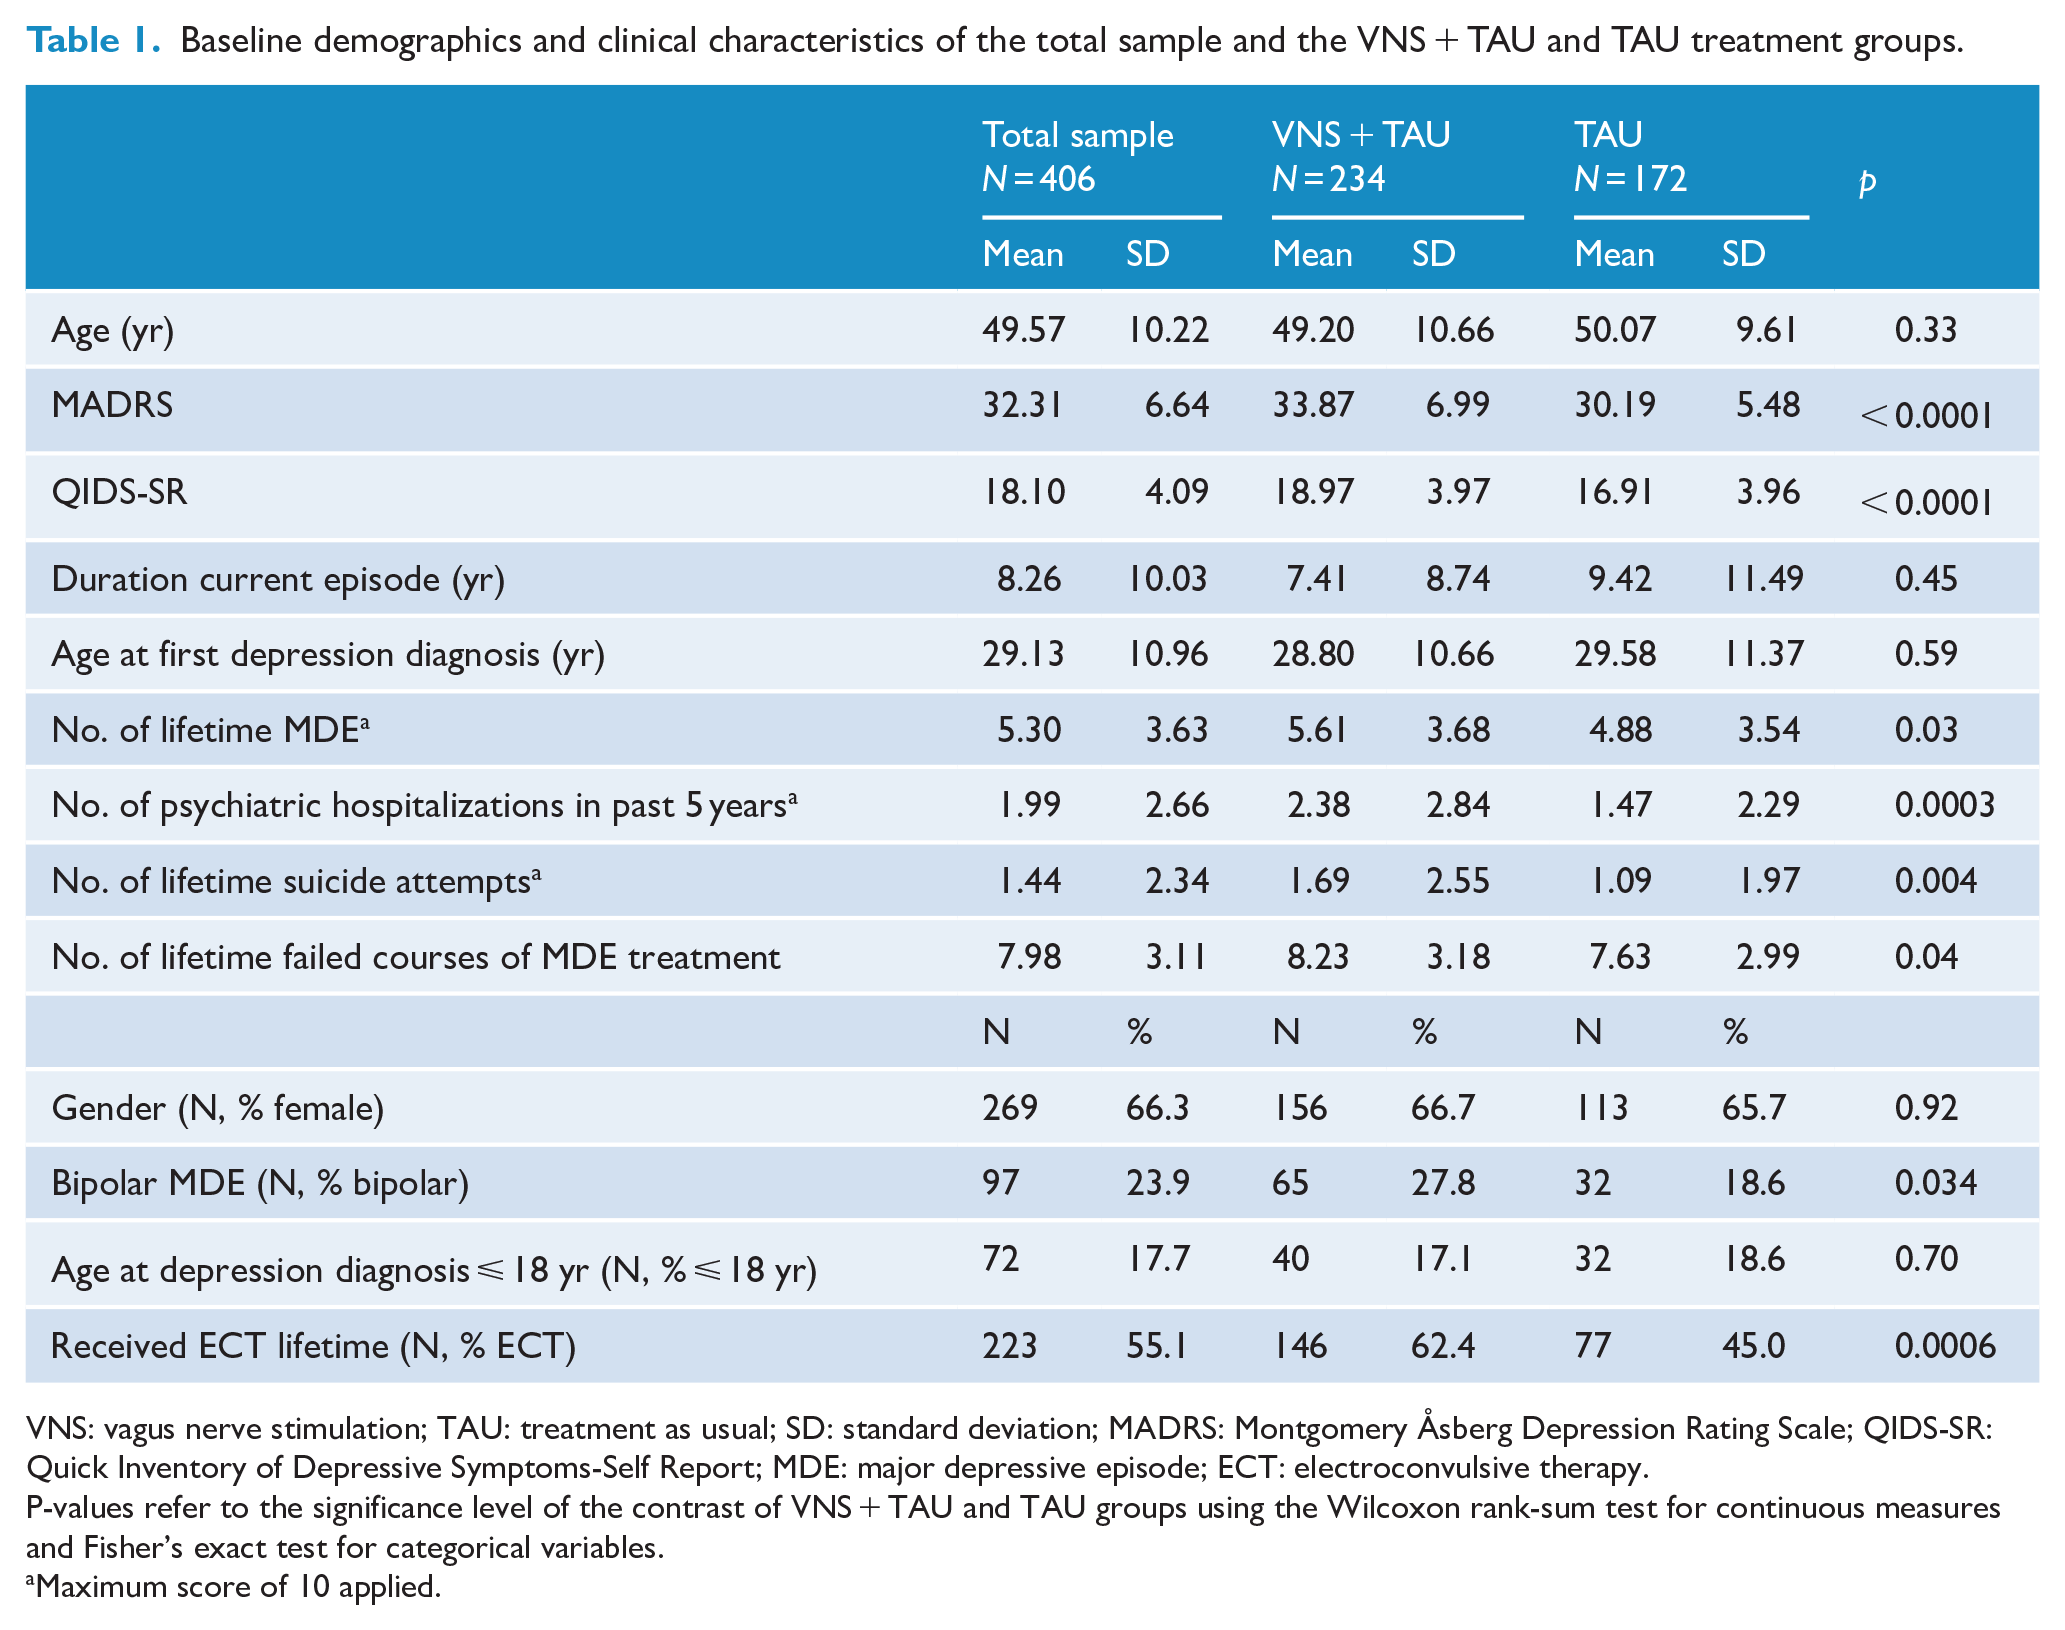
VNS: vagus nerve stimulation; TAU: treatment as usual; SD: standard deviation; MADRS: Montgomery Åsberg Depression Rating Scale; QIDS-SR: Quick Inventory of Depressive Symptoms-Self Report; MDE: major depressive episode; ECT: electroconvulsive therapy.
P-values refer to the significance level of the contrast of VNS + TAU and TAU groups using the Wilcoxon rank-sum test for continuous measures and Fisher’s exact test for categorical variables.
Maximum score of 10 applied.
The MADRS and QIDS-SR were completed on average more than five out of six possible assessment occasions and the sample averaged more than 22 months of follow-up. The treatment groups did not differ in the number of post-baseline assessments with either the MADRS or QIDS-SR (Supplementary Table 1).
Metric performance: ES and discrimination between treatment groups
The results were consistent across the ES and AUC measures. These findings are discussed together. Figure 1 displays ES and AUC values in separating the treatment groups for all metrics. There was a nearly six-fold range among the metrics in ES (range = 0.11–0.63, median = 0.43) (Supplementary Table 2). AUC ranged from 0.53 to 0.68 (median = 0.60) (Supplementary Table 3).
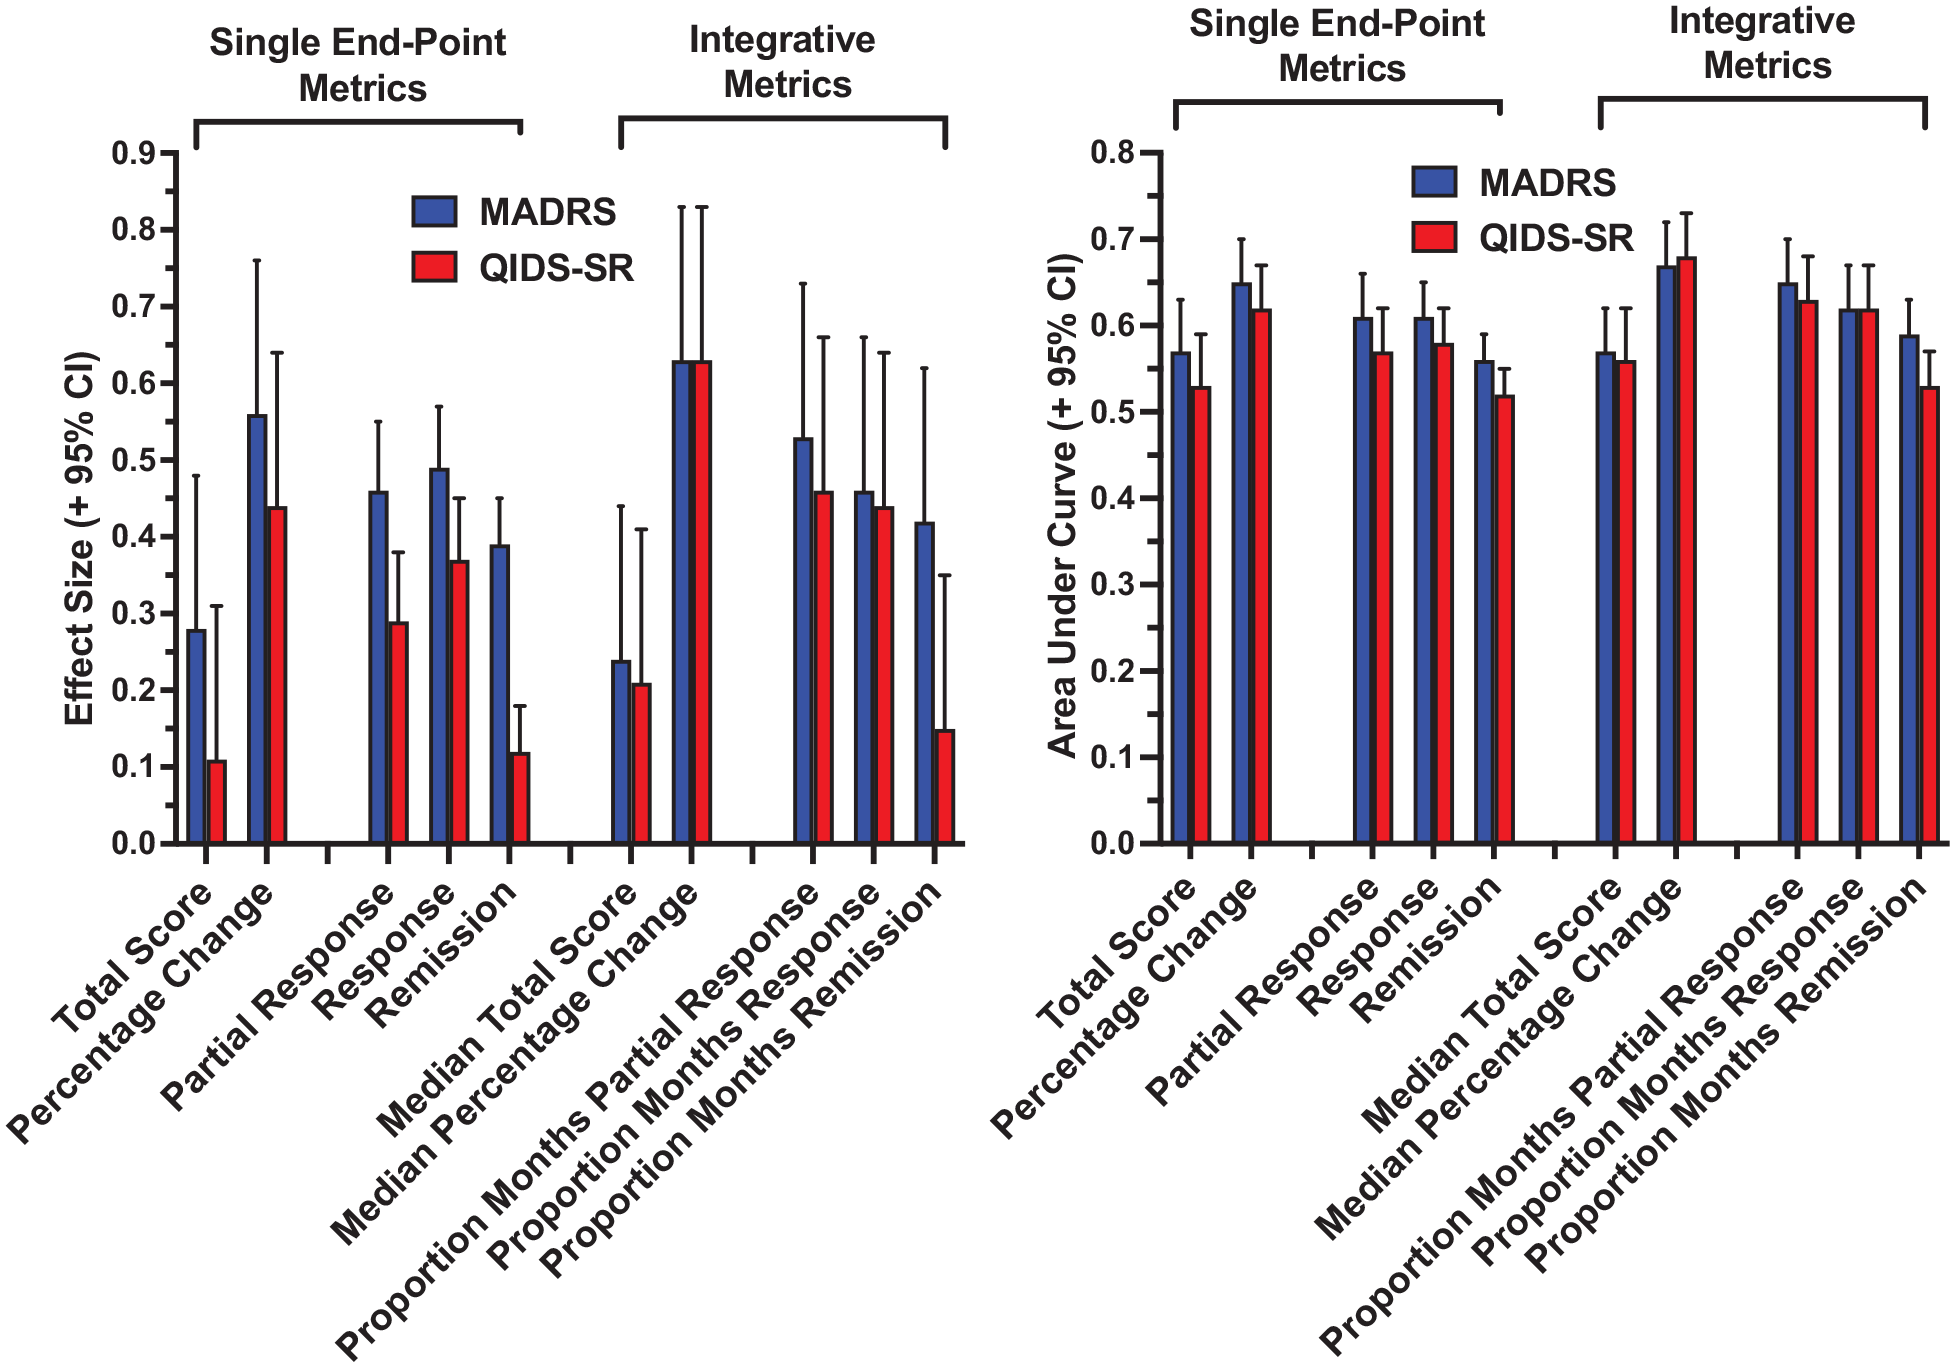
Effect size and area under the curve for each metric in separating the treatment groups, as a function of use of MADRS or QIDS-SR scores.
ES and AUC values were higher for metrics based on MADRS than QIDS-SR scores (Figure 1). The ES for the 10 MADRS metrics ranged from 0.24 to 0.63 (median = 0.46) and AUC ranged from 0.56 to 0.67 (median = 0.61). For the QIDS-SR, ES ranged from 0.11 to 0.63 (median = 0.33) and AUC ranged from 0.52 to 0.68 (median = 0.58). The paired comparisons of MADRS and QIDS-SR metrics yielded significant differences in ES (p < 0.004) and AUC (p = 0.01) favoring the clinician rating.
The nearly six-fold range in ES across the 20 metrics indicated that the metrics differed markedly in the degree to which they distinguished the treatment groups (Supplementary Table 2 and Figure 1). Metrics based on remission status had lower ES and AUC than metrics based on the classification of partial response or response. As shown in Figure 2, this difference was consistent across all relevant SEP and INT metrics. While observed with both depression scales, this effect was especially marked for metrics based on the QIDS-SR.
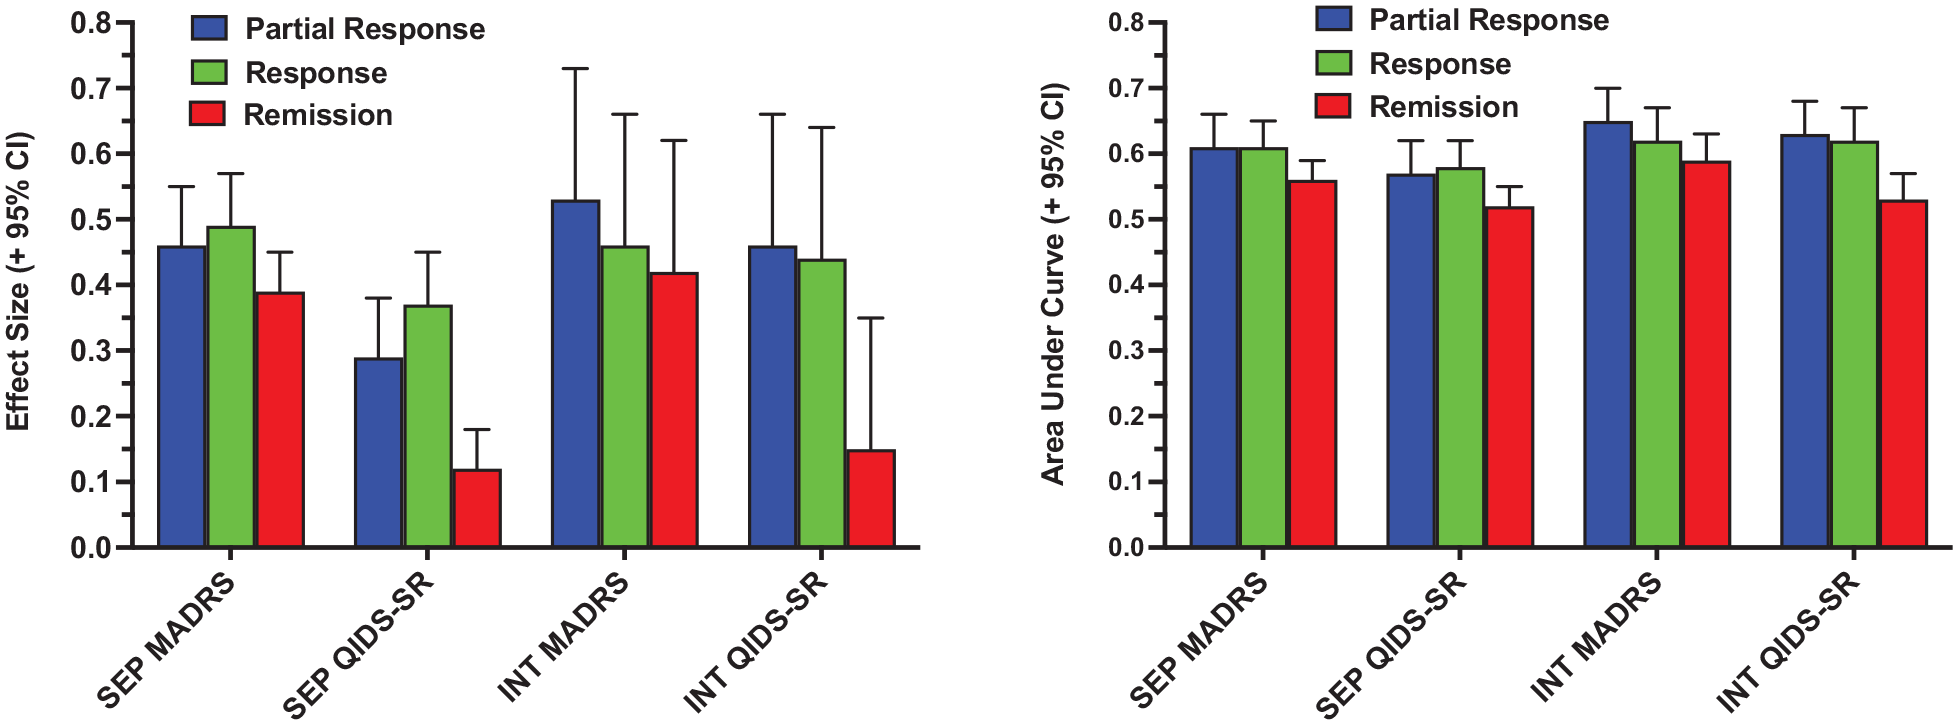
Effect size and area under the curve in separating the treatment groups for metrics based on the classifications of partial response, response and remission. Single endpoint (SEP) metrics classified patients based on symptom scores at last observation, while integrative (INT) metrics reflected the proportion of the observation period that met criteria for the binary classifications.
Metrics based on total symptom severity scores, either the final total score (SEP) or the median of total scores (INT), had substantially lower ES and AUC values than SEP and INT metrics that quantified change from baseline in symptom severity, i.e. percentage change in total score at endpoint (SEP) or median percentage change in total symptom scores (INT). Taking baseline symptom severity into account increased ES by two- to four-fold across the relevant metric comparisons (Supplementary Table 2 and Figure 1).
Critically, with few exceptions, INT metrics produced greater separation of the treatment groups than the corresponding SEP metrics (Figure 3). Paired comparison of the 10 corresponding SEP and INT metrics yielded significant effects for both ES (p < 0.03) and AUC (p < 0.004). The severity-based measures with the largest ES and AUC were the median percentage improvement in MADRS (d = 0.63, AUC = 0.67) and QIDS-SR (d = 0.63. AUC = 0.68) scores. Among metrics using binary outcome classification, the proportion of the observation period in MADRS partial response (d = 0.53, AUC = 0.65) and QIDS-SR partial response (d = 0.46, AUC = 0.63) had the largest ES and AUC.
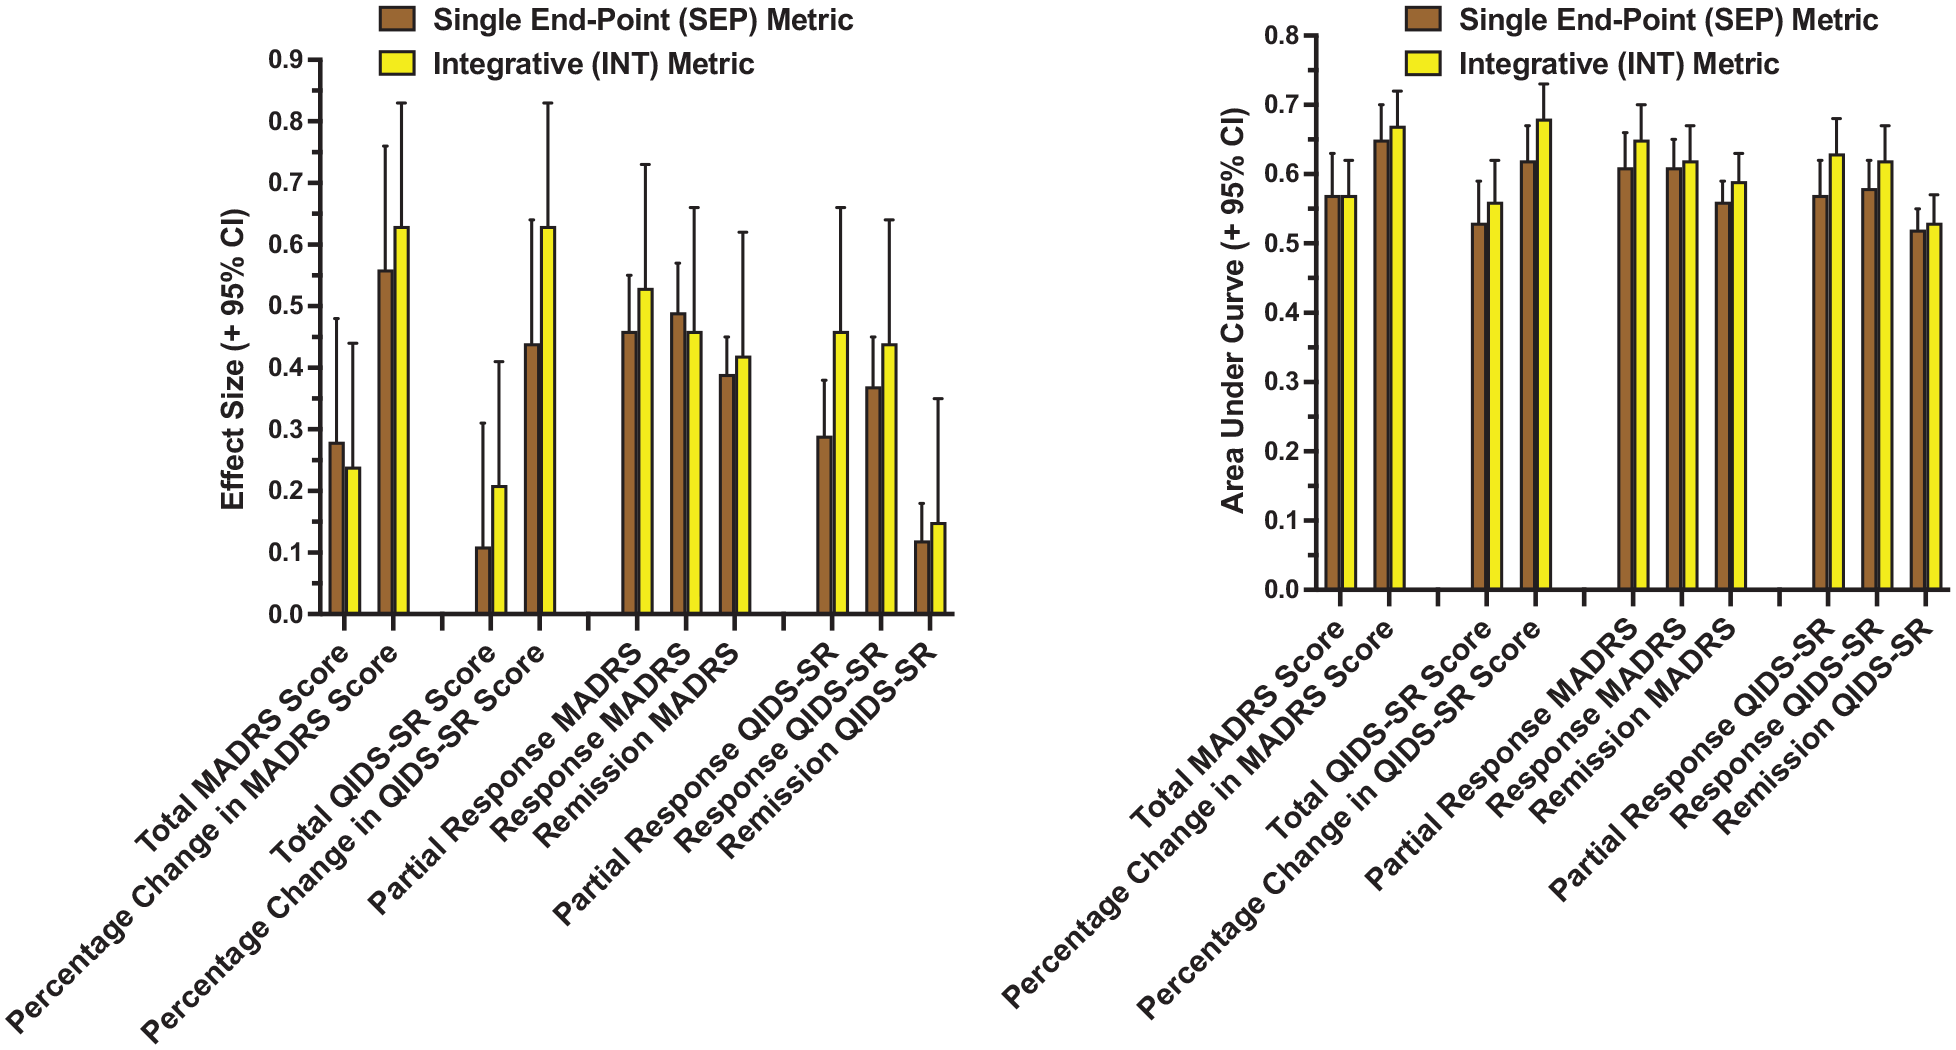
Effect size and area under the curve (AUC) in separating the treatment groups for paired single endpoint (SEP) and integrative (INT) metrics. SEP metrics were based on symptom scores at last observation, while INT metrics averaged or aggregated scores over the entire observation period.
Propensity score adjustment
The pattern of differences among the metrics in distinguishing the treatment conditions was preserved after controlling for the propensity score quintiles (Supplementary Table 4). The percentage of variance accounted for by treatment condition for each of the 20 outcome metrics ranged from 0.4% to 8.7%.
Discussion
Current strategies for evaluating the efficacy of antidepressant interventions are largely based on short-term outcomes and focus on rates of remission (Rush et al., 2022; Sackeim et al., 2023). Given that DTD is best conceptualized as a chronic condition, traditional outcome measures are insensitive to the meaningful clinical improvement associated with more modest symptomatic change that persists for months or years. Researchers and clinicians need to develop outcome measures in DTD that reflect meaningful symptom change over time, with a similar need in other chronic medical conditions (Francis et al., 2016; Nolte and Osborne, 2013).
This study compared a range of potential outcome metrics in their ability to distinguish treatment conditions already known to differ in clinical outcome, i.e. VNS coupled with TAU vs TAU alone (Aaronson et al., 2017). Over a 24-month observation period, INT metrics based on the median percentage change in the clinician-rated MADRS and the patient rated QIDS-SR had the strongest overall performance in separating the treatment groups; INT metrics based on the proportion of months in MADRS or QIDS-SR partial response had the strongest performance of outcome measures based on binary classification. As they do not capture the state of the patient over time (McAllister-Williams et al., 2020; Rush et al., 2022), perhaps not surprisingly, SEP metrics uniformly produced weaker separation of the treatment groups than their respective INT metrics. Given the infrequent and short-lasting nature of remission typically observed with DTD, as expected, SEP and INT metrics based on remission had the weakest performance characteristics.
Across the metrics, ES and AUC for separating the treatment groups were highly variable, with the six-fold range in ES extending from ‘no effect’ to a ‘moderate effect size’. Thus, even though all the metrics characterized symptomatic improvement, they differed markedly in their capacity to detect a treatment group effect, with SEP metrics and those based on remission status fairing the poorest.
The similarities and differences in the findings of this and the previous study (Sackeim et al., 2023) are instructive. Using the same methods and dataset, the earlier study compared the metrics in separating groups that did and did not improve in endpoint QoL scores regardless of treatment condition, while this study focused on separation of the VNS + TAU vs TAU treatment groups. Change in symptom severity and QoL are related phenomena, and across metrics, ES and AUC values were markedly higher in the first study. In the first study, ES and AUC values were also substantially higher across metrics based on the self-report QIDS-SR than the clinician-rated MADRS, while in this study, a smaller but significant effect in the opposite direction obtained. We have suggested that the shared method variance due to the use of self-report for both the QIDS-SR and the QoL measures accounted for this specification in the first study (Podsakoff et al., 2003; Spector et al., 2019). In contrast, in depression treatment trials ES for efficacy outcomes are often smaller for self-report than clinician-rated scales (Lin et al., 2014; Prusoff et al., 1972; Sayer et al., 1993), and this was the pattern obtained in this study.
Of note, in the first study metrics reflecting SEP symptom severity had the strongest relations with self-reported change in QoL, and this held especially for metrics based on the self-report QIDS-SR. In contrast, in this second study, the INT version of the same symptom severity metrics produced the strongest separation of the treatment groups. Thus, the choice of an optimal metric to detect an association is likely contingent on the context and what is being predicted. Symptom severity at study endpoint may strongly influence concurrent self-reported QoL. In contrast, INT metrics, by integrating information from multiple assessments, may provide a more reliable and sensitive measure of sustained treatment effects. In addition, symptomatic remission is widely considered the goal of antidepressant treatment (Gelenberg, 2010; Möller, 2008; Rush et al., 2006b) and commonly is the primary efficacy outcome measure.(Dean et al., 2021; O’Reardon et al., 2007; Rush et al., 2006c; Sackeim et al., 2009), Both studies found, however, that metrics based on remission status, whether SEP or INT, had the weakest performance characteristics, while INT metrics based on partial response were especially useful in separating both the QoL and treatment groups.
Taken together, these two studies suggest revision of outcome assessment in DTD. It seems that metrics that integrate information over time about clinical state are especially powerful in detecting treatment effects and QoL improvement. Perhaps an analogous approach should be evaluated in other psychiatric disorders (e. g. schizophrenia, OCD, PTSD or substance use disorders) where sustained response or remission is elusive and yet clinically meaningful effects on symptoms, function and/or QoL can be achieved.
The metrics compared in this study were designed to be mathematically simple and to convey meaningful information to patients and clinicians about the magnitude and consistency of change in symptom severity. The metrics were also designed to test key issues when selecting potential outcome measures in a DTD sample: are absolute symptom scores or scores adjusted for baseline values more sensitive in detecting treatment group effects; do metrics that integrate information over time differ from SEP metrics in separating treatment conditions? It is important to note, however, that this study has limited implications for selecting the inferential statistical procedures with the greatest power to detect treatment effects. For example, in this study, percentage change metrics, whether SEP or INT, produced superior treatment group separation than metrics based on post-baseline absolute scores. This does not entail that inferential statistics to establish a treatment effect in continuous measures should rely on percentage change as the primary dependent measure. There are multiple ways of adjusting post-treatment scores for baseline values, and it is established for SEP outcomes that, under some conditions, analysis of covariance (ANCOVA) can have greater power to detect treatment group differences than comparisons based on percentage change, especially when there are baseline imbalances between randomized groups or when the correlation between baseline and endpoint scores is weak (Vickers, 2001). Under other circumstances, ANCOVA on raw scores may have less power or greater bias than analyses based on percentage change measures (Van Breukelen, 2006, 2013). Rather, regardless of the statistical procedures used to detect a treatment effect, the magnitude and consistency of this effect needs to be conveyed to patients and clinicians. The findings of this study help guide selecting which metrics are likely to be most sensitive to treatment group differences in a DTD sample. When coupled with description of ES (small, medium or large), the magnitude and consistency of the therapeutic effects can be readily communicated.
In line with long-standing recommendations that incorporating longitudinal clinical data in statistical analyses enhances power to detect treatment effects relative to endpoint analysis (Gibbons et al., 1993; Gueorguieva and Krystal, 2004), there has been increased use in the psychiatric literature of repeated measures analysis of variance and random effects or mixed models (Gueorguieva and Krystal, 2004; Nierenberg et al., 2016). Similarly, we found that INT metrics were consistently more sensitive to treatment group effects than SEP metrics. As in the discussion above on the use of ANCOVA vs percentage change measures, the choice of which inferential statistical model to apply to longitudinal data is distinct from the metrics selected to characterize the meaning of the obtained effect. Indeed, as statistical models become more complex, they are less likely to yield metrics informative of the extent of clinical benefit associated with interventions.
In oncology, the 5-year survival rate, whether absolute or relative, is a single metric that reflects the likelihood of a binary outcome over a substantial time period (Welch et al., 2000). This metric is simple in its construction, highly informative to patients about prognosis, and fundamental in empirically gauging the effectiveness of interventions (Lu et al., 2019). It is not clear whether any single metric can have such a role in DTD and other chronic, difficult-to-treat mental disorders. Nonetheless, the two studies in this series demonstrate that metrics that have a lower threshold for declaring positive therapeutic outcome and which integrate information over time improve the detection of therapeutic benefit in DTD.
Limitations
The major limitations of this study are reliance on a sample of severely treatment-resistant patients treated with an implanted device. Whether similar findings would obtain in less resistant samples treated with psychotherapy or medication is unknown. Each metric ES provided only a single datapoint, regardless of the size of the sample contributing to its computation. We conducted statistical tests contrasting pre-defined metric groupings (e.g. SEP vs INT, MADRS vs QIDS-SR) in ES and AUC values. While these statistical tests were supportive of the descriptive claims made about the differences among metrics, they should not be taken as confirming or rejecting hypotheses. The metrics within a grouping were not independent of each other, and the likelihood of observing a statistically significant effect was contingent on the number of metrics in each grouping. Multiple studies of this type, coupled with meta-analytic techniques to contrast metric performance across studies, are needed to establish generalizability.
Conclusion
In this long-term study of DTD, metrics that integrated information about symptom status repeatedly over time (INT metrics) were more powerful than SEP metrics in differentiating treatment groups. Metrics based on remission status were the least sensitive to treatment condition.
Supplemental Material
sj-docx-1-anp-10.1177_00048674231209837 – Supplemental material for Alternative metrics for characterizing longer-term clinical outcomes in difficult-to-treat depression: II. Sensitivity to treatment effects
Supplemental material, sj-docx-1-anp-10.1177_00048674231209837 for Alternative metrics for characterizing longer-term clinical outcomes in difficult-to-treat depression: II. Sensitivity to treatment effects by Scott T Aaronson, Harold A Sackeim, Mei Jiang, Sarah Badejo, Teresa Greco, Mark T Bunker, Charles R Conway, Koen Demyttenaere, Allan H Young, R Hamish McAllister-Williams and A John Rush in Australian & New Zealand Journal of Psychiatry
Footnotes
Declaration of Conflicting Interests
The author(s) declared the following potential conflicts of interest with respect to the research, authorship and/or publication of this article: Dr STA is a consultant to Genomind, LivaNova, Janssen, Neuronetics and Sage Therapeutics. He also receives research support from Compass Pathways and Neuronetics.
Dr HAS serves as a scientific adviser and receives consulting fees from Cerebral Therapeutics Inc., Holmusk Technologies Inc., LivaNova PLC, MECTA Corporation, Neurolief Ltd, Neuronetics Inc., Parow Entheobiosciences LLC and SigmaStim LLC. He receives honoraria and royalties from Elsevier Inc. and Oxford University Press. He is the inventor on non-remunerative US patents for Focal Electrically-Administered Seizure Therapy (FEAST), titration in the current domain in ECT and the adjustment of current in ECT devices, each held by Balance Point LLC. He is also the originator of magnetic seizure therapy (MST).
Dr MJ and Ms SB are employees of LivaNova USA PLC.
Dr TG was an employee of LivaNova PLC when she helped draft the plan for the statistical analyses conducted in this study. She is currently an employee at Jazz Pharmaceuticals PLC.
Dr MTB is a former employee and a current consultant of LivaNova USA PLC.
Dr CRC has received research support from the American Foundation for Suicide Prevention, Assurex Health Inc., August Busch IV Foundation, Barnes-Jewish Hospital Foundation, Bristol-Myers Squibb, LivaNova PLC, National Institute of Mental Health, NeoSync, Stanley Medical Research Institute and the Taylor Family Institute for Innovative Psychiatric Research. He is a part-time employee at the John Cochran VA Medical Center in St. Louis.
Dr KD has received honoraria for attending advisory boards, acting as a consultant or being a member of the speaker bureau for: Boehringer-Ingelheim, Gedeon-Richter, Johnson and Johnson, LivaNova, Lundbeck, Pfizer and Recordati.
Dr AHY has received payment for lectures and advisory boards for the following companies: Allegan, AstraZeneca, Bionomics, COMPASS, Eli Lilly, Janssen, LivaNova, Lundbeck, Neurocentrx, Novartis, Sage, Servier, Sumitomo Dainippon Pharma and Sunovion, He is a consultant to Johnson & Johnson and LivaNova. He has received honoraria for attending advisory boards and presenting talks at meetings organized by LivaNova. He is a Principal Investigator on studies funded by COMPASS, LivaNova and Janssen, and Chief Investigator on a study funded by Novartis. He does not hold shares in pharmaceutical companies. Dr. McAllister-Williams has received fees from American Center for Psychiatry & Neurology United Arab Emirates, British Association for Psychopharmacology, European College of Neuropsychopharmacology, International Society for Affective Disorders, Janssen, LivaNova, Lundbeck, My Tomorrows, OCM Comunicaziona s.n.c., Pfizer, Qatar International Mental Health Conference, Sunovion, Syntropharma, UK Medical Research Council and Wiley; grant support from the National Institute for Health Research Efficacy and Mechanism Evaluation Panel and Health Technology Assessment Panel and non-financial support from COMPASS Pathways and Magstim.
Dr AJR has received consulting fees from Compass Inc., Curbstone Consultant LLC, Emmes Corp., Evecxia Therapeutics, Inc., Holmusk Technologies, Inc., Johnson and Johnson (Janssen), LivaNova, MindStreet, Inc., Neurocrine Biosciences Inc., Otsuka-US; speaking fees from LivaNova, Johnson and Johnson (Janssen) and royalties from Wolters Kluwer Health, Guilford Press and the University of Texas Southwestern Medical Center, Dallas, TX (for the Inventory of Depressive Symptoms and its derivatives). He is also named co-inventor on two patents: U.S. Patent No. 7,795,033: Methods to Predict the Outcome of Treatment with Antidepressant Medication, Inventors: McMahon FJ, Laje G, Manji H, Rush AJ, Paddock S, Wilson AS; and U.S. Patent No. 7,906,283: Methods to Identify Patients at Risk of Developing Adverse Events During Treatment with Antidepressant Medication, Inventors: McMahon FJ, Laje G, Manji H, Rush AJ, Paddock S.
Funding
The author(s) disclosed receipt of the following financial support for the research, authorship and/or publication of this article: The Vagus Nerve Stimulation (VNS) Depression Registry, analysis of the registry data and the drafting of this manuscript were supported by LivaNova PLC (Houston, TX, USA). Final approval of the content of this manuscript and the decision to submit were solely determined by the authors.
Supplemental Material
Supplemental material for this article is available online.
References
Supplementary Material
Please find the following supplemental material available below.
For Open Access articles published under a Creative Commons License, all supplemental material carries the same license as the article it is associated with.
For non-Open Access articles published, all supplemental material carries a non-exclusive license, and permission requests for re-use of supplemental material or any part of supplemental material shall be sent directly to the copyright owner as specified in the copyright notice associated with the article.