
Abstract
Objectives:
The vulnerability paradox refers to the observation that greater vulnerability is associated with higher prevalence of mental disorder at the individual level, but lower prevalence at the country level. The paradox is supported by studies estimating prevalence using the Composite International Diagnostic Interview and by suicide mortality data. However, cross-national studies using single-item measures of subjective well-being find no evidence of a paradox, with vulnerability being associated with lower well-being at both the individual and country levels. These findings suggest the potential usefulness of simple indicators for studying cross-national differences. In this study, we investigated the vulnerability paradox using cross-national data on the prevalence of three symptoms that indicate depression or anxiety: unhappiness, sadness and worry.
Methods:
The data on prevalence of unhappiness were taken from 77 countries in the World Values Survey 2017–2020 and data on prevalence of sadness and worry from 142 countries in the Gallup World Poll in 2018. Country vulnerability was measured by the Vulnerability Index and gross domestic product per capita. The data were analyzed using random-effects meta-analysis, with vulnerability measures as moderator variables.
Results:
For all three symptoms, prevalence was associated with higher Vulnerability Index and lower gross domestic product per capita. When both moderators were entered in meta-regressions, there were significant associations for the Vulnerability Index, but not for gross domestic product per capita.
Conclusion:
These findings are inconsistent with the vulnerability paradox. They underscore that reducing mental disorders should be a priority in poorer nations and that further economic and social development may be an important contributor to achieving this.
Background
The so-called ‘vulnerability paradox’ has been increasingly discussed in cross-national studies over the past decade. Put simply, the term refers to the counter-intuitive finding that mental disorders appear to be less prevalent in low- and middle-income countries than high-income ones (Scott et al., 2018). Low- and middle-income countries have high vulnerability measures as well as lower gross domestic product (GDP) per capita, hence the paradox. The vulnerability paradox is highlighted because within individual countries, higher vulnerability measures are associated with higher rates of mental disorders. The vulnerability paradox has been shown to occur with lifetime prevalence of anxiety disorders and depression as diagnosed by the Composite International Diagnostic Interview (CIDI; Bromet et al., 2011; Dückers and Brewin, 2016; Dückers et al., 2016; Dückers and Olff, 2017; Ruscio et al., 2017), as well as with national suicide rates (Dückers et al., 2019).
The vulnerability paradox is not found in cross-national data on subjective well-being (SWB). SWB is not precisely defined but includes a cognitive component evaluating satisfaction with life and an affective component involving positive affect. Here, the data are as expected; the SWB of nations increases with GDP per capita, although gains are smaller in high-income countries (Jorm and Ryan, 2014). Although SWB is negatively associated with mental illness, it is a different construct with somewhat different determinants, so the cross-national associations are not necessarily the same. However, the difference in findings suggests the need for further investigation of the paradox.
The apparently contradictory findings inherent in the paradox are troublesome for health practitioners and service planners. If the prevalence of mental illness is lower in more vulnerable countries, then it could lead to a belief that mental disorders are a ‘rich-country problem’ that is not a priority for low- and middle-income countries. Clearly, more research is needed to help determine what these apparently contradictory findings mean (Mulder et al., 2020).
One obvious place to start is to examine the methodology used in the fields of research. SWB measures are brief self-reports. The construct of SWB has only partial overlap with constructs in mental ill health. In psychiatric epidemiology, the emphasis has been on diagnostic instruments with complex interviews and scoring algorithms. The cross-cultural portability of such methods has been questioned (Jorm, 2006; Patten, 2003).
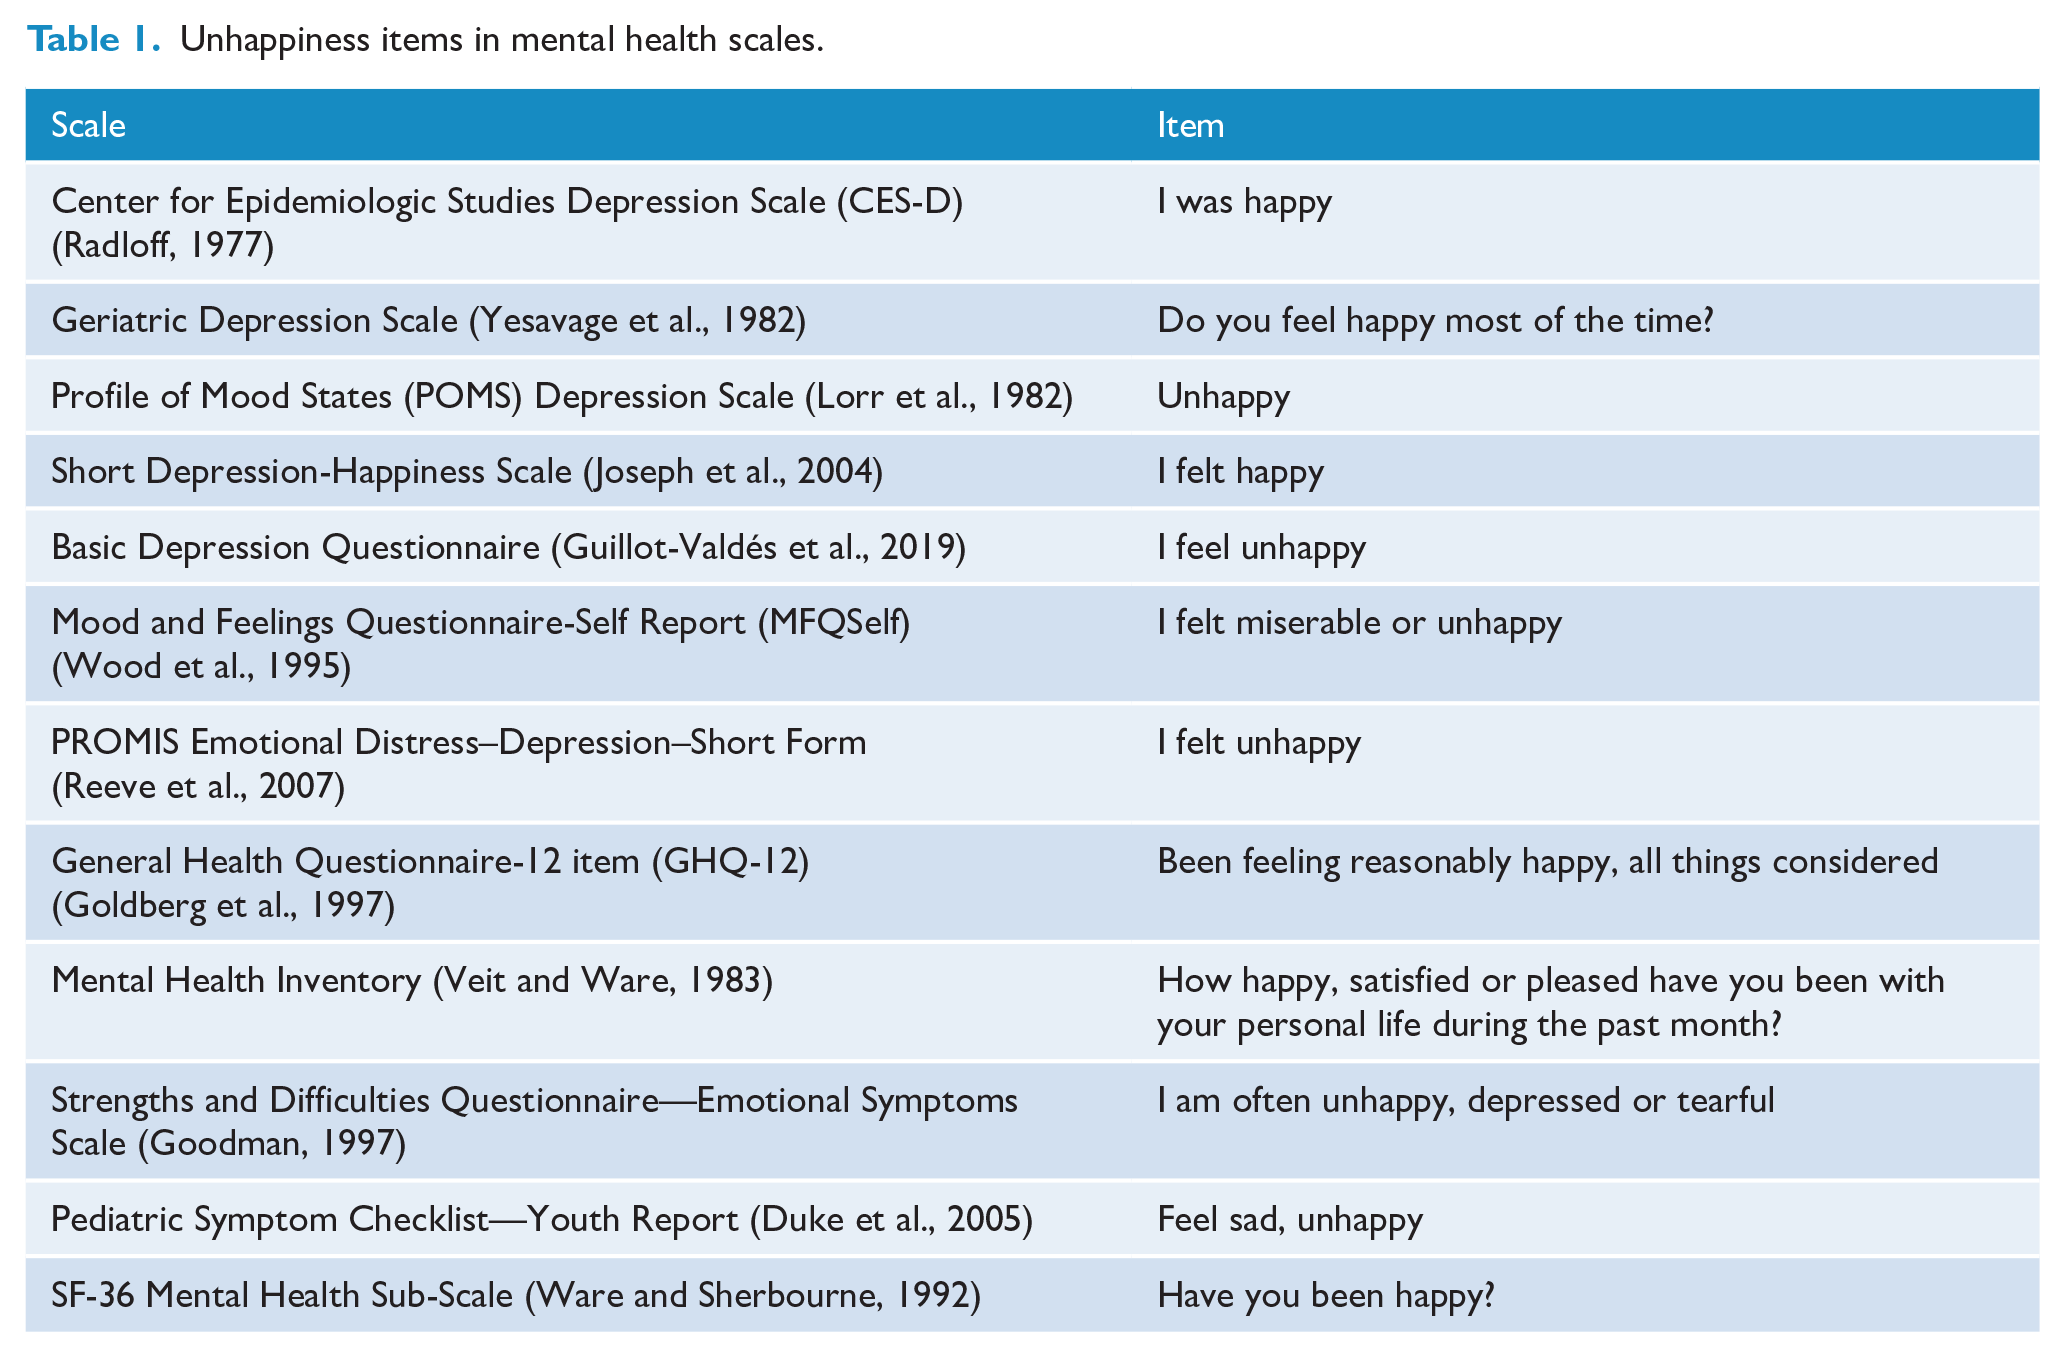
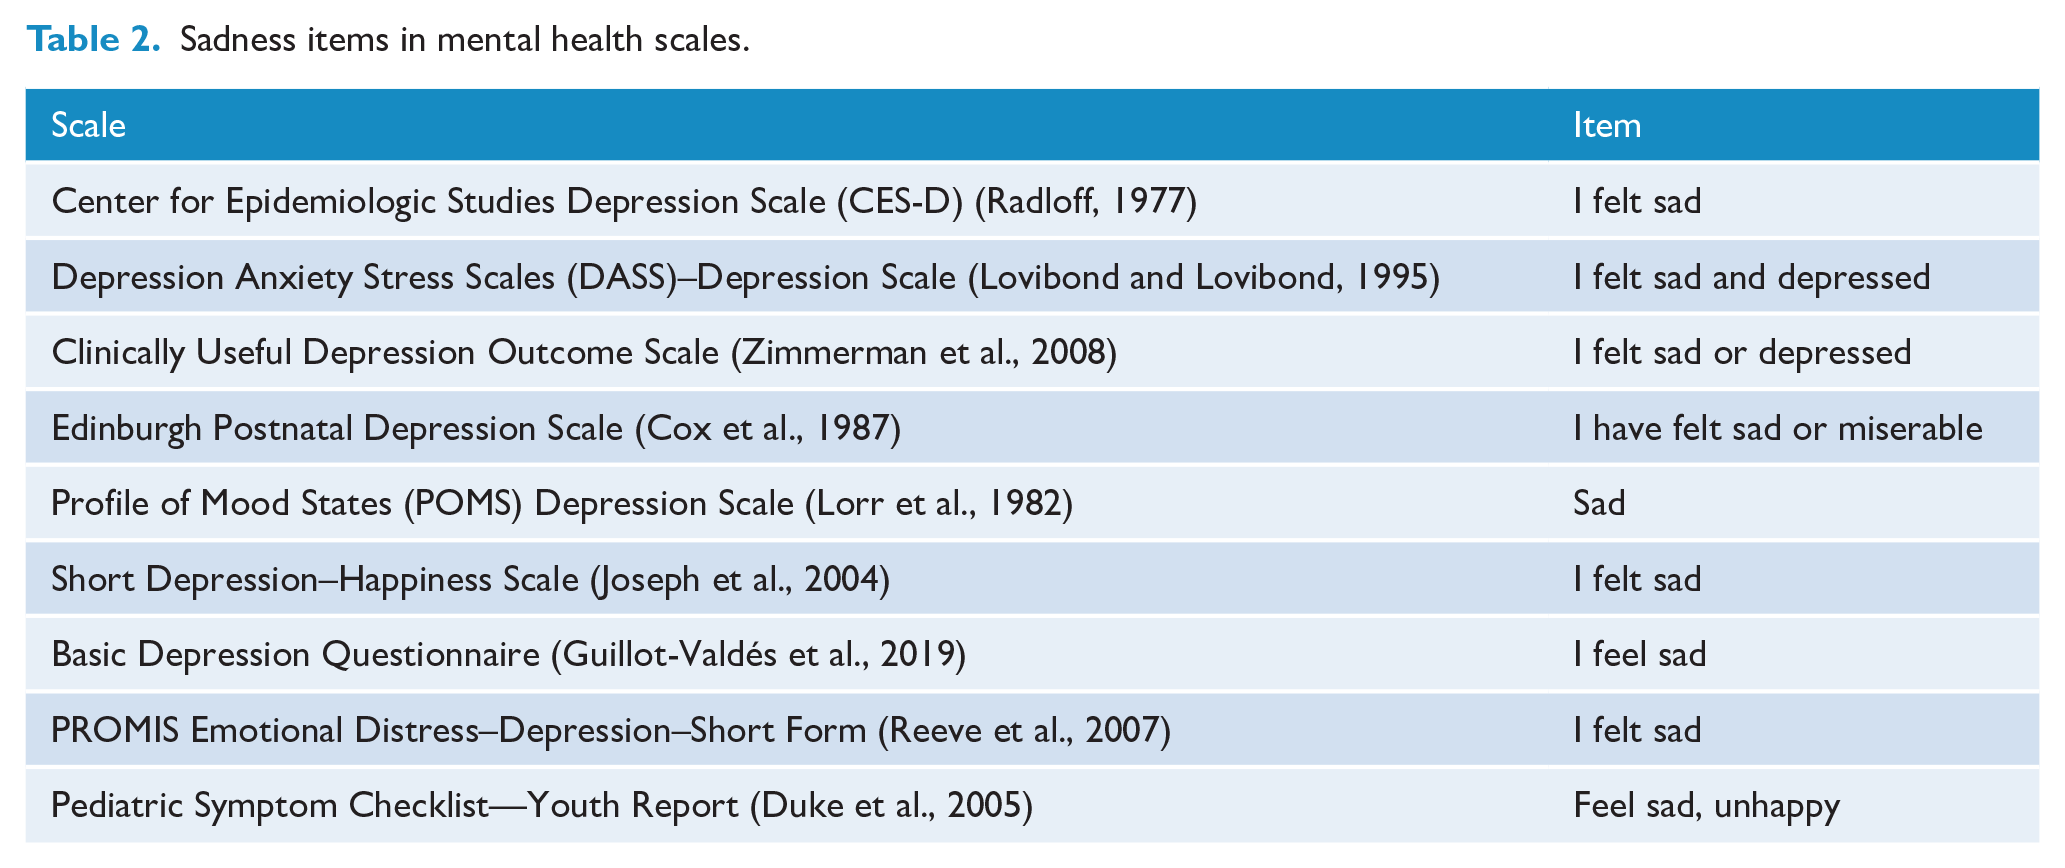
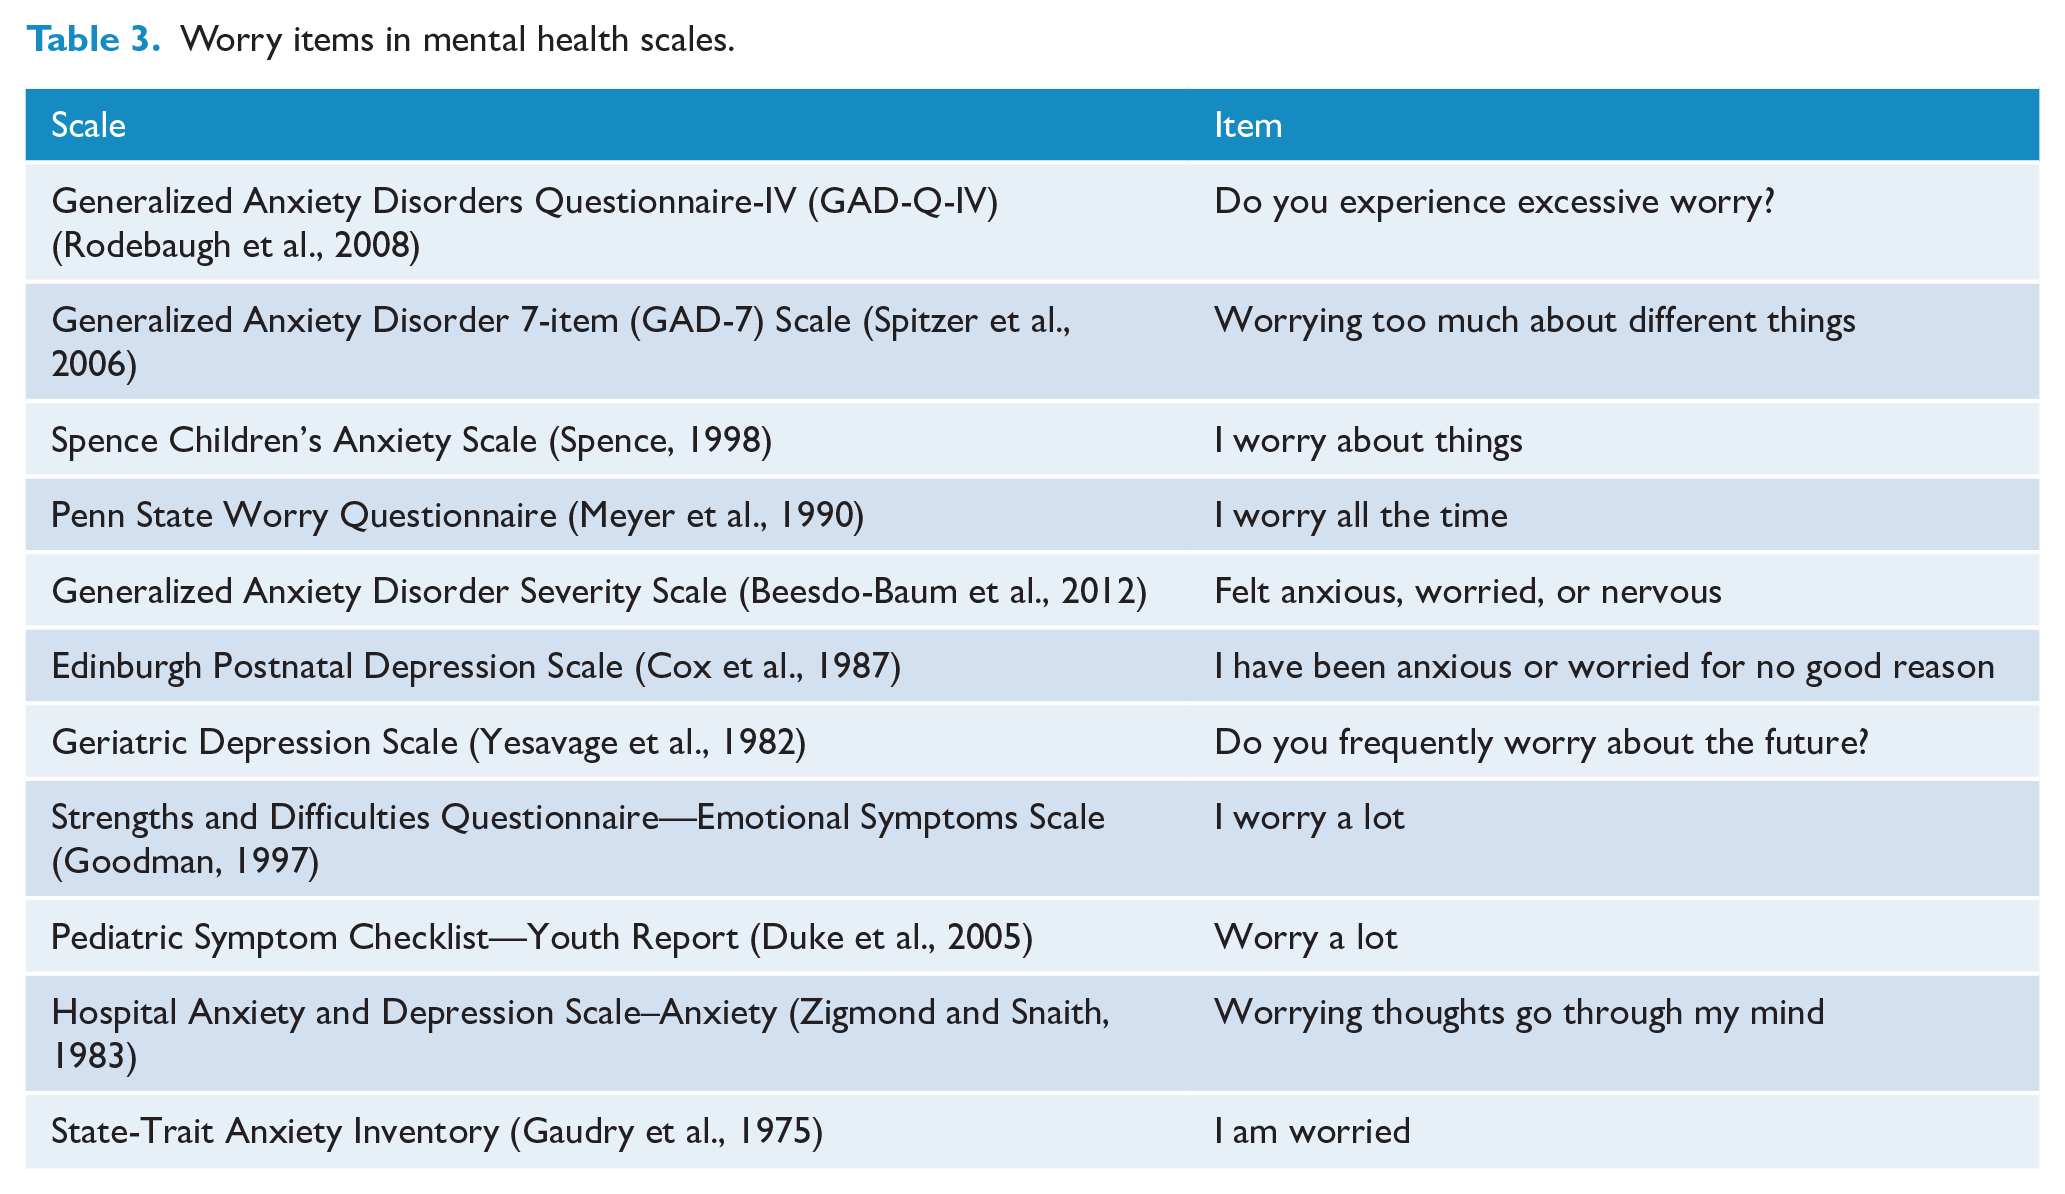
This paper will address the contradictory findings by analyzing cross-national studies of three common mental illness symptoms—unhappiness, sadness and worry. Items asking about these symptoms are commonly included in scales measuring depression, anxiety or general mental health (see Tables 1–3). The consistent inclusion of such items shows that they are indicators of mental ill health. While individual symptoms do not provide an adequate assessment of an individual, their prevalence can be used as an indicator to compare mental ill health across countries.
Unhappiness items in mental health scales.
Sadness items in mental health scales.
Worry items in mental health scales.
Data on unhappiness is available from many countries in the World Values Survey (2020), while data on sadness and worry is available from the Gallup World Poll (Gallup, 2020). We used these data to examine how prevalence of symptoms is associated with country vulnerability, GDP per capita and inequality measures across a large range of countries.
Methods
Prevalence of unhappiness
Data on prevalence of unhappiness were taken from Wave 7 of the World Values Survey, which covered surveys carried out in 2017–2020. Wave 7 is planned to involve 80 countries, but at the time the data were accessed, it was available in the World Values Survey (2020) online database for 77 countries. To be included in the World Values Survey, a country’s data had to involve a face-to-face survey of a representative sample of at least 1000 covering all residents of a country aged 18 years and over. The question on happiness (English version) was: ‘Taking all things together, would you say you are; 1. Very happy 2. Rather happy 3. Not very happy 4. Not at all happy’. The prevalence used here was the proportion of the sample responding ‘Not at all happy’.
Prevalence of sadness and worry
Data on prevalence of sadness and worry were taken from the 2019 Gallup Global Emotions Report (Gallup, 2019), which surveyed adults aged 15 and older from 143 countries in 2018, with nationally representative samples of around 1000 for most countries. Participants were surveyed by telephone in countries where telephone coverage represents at least 80% of the population or where this is the customary survey method. In other countries, they were surveyed face-to-face. This survey asked questions about 10 positive emotions (in 143 countries) and 10 negative emotions (from 142 countries) experienced in the day before the survey. The two questions analyzed here as indicators of mental ill health are: ‘Did you experience the following feelings during a lot of the day yesterday? How about worry’ and ‘Did you experience the following feelings during a lot of the day yesterday? How about sadness?’. The participants responded ‘yes’ or ‘no’ to these questions.
Vulnerability Index
The Vulnerability Index was taken from the World Risk Report 2019 (Day et al., 2019). It is
composed of the components susceptibility, lack of coping capacity and lack of adaptation capacity and refers to social, physical, economic and environmental factors that make people or systems vulnerable to the effects of natural hazards, the negative impacts of climate change or other processes of change. (Day et al., 2019)
The index is calculated from measures of Susceptibility (public infrastructure, nutrition, poverty and dependences, economic capacity and income distribution), Coping (government and authorities, medical services, material insurance coverage) and Adaptation (education and research, gender equality, environmental status/ecosystem protection, health investment). This index was available for 72 of the 77 countries in the World Values Survey and for 138 of the 142 countries in the Gallup Global Emotions Report.
GDP per capita
GDP per capita was taken from the Central Intelligence Agency (CIA, n.d.) World Factbook. These estimates compare the GDP on a purchasing power parity basis divided by population. A reason for using the CIA estimates in the current analysis was that they cover Taiwan, which is excluded from the alternative World Bank estimates. However, in order to assess the robustness of any association, the World Bank (2020) estimates were also examined. These give GDP per capita in current US$. The CIA estimates were available for all 77 countries in the World Values Survey and for 141 of the 142 countries in the Gallup Global Emotions Report.
Gini Index
The Gini Index from the CIA World Factbook was used to measure inequality in the distribution of family income in a country (Central Intelligence Agency, n.d.). The Gini Index can theoretically range from 0 (perfect equality) to 100 (perfect inequality). The index was available for 72 of the 77 countries in the World Values Survey and 134 of the 142 countries in the Gallup Global Emotions Report.
Statistical analysis
The data were analyzed using Comprehensive Meta-analysis V3, with country as the unit of analysis. The prevalence proportion of unhappiness, sadness or worry and the sample size were used to produce the logit of the prevalence proportion and standard error for each country. The random-effects model was used. Meta-regressions were run using the following as moderator variables: Vulnerability Index, GDP per capita and Gini Index. Scatterplots were used to visualize the associations, with each country survey represented by a circle, with the size of the circle proportionate to the weight of the survey.
Results
Unhappiness
Meta-regressions were run with each of the moderator variables individually. The Vulnerability Index was significantly associated with logit of prevalence (Z = 3.61, two-sided p = 0.0003, R2 analog = 0.27, 72 countries). Figure 1 (Supplementary material) gives the scatterplot, which shows that the prevalence of unhappiness increases with vulnerability.
When CIA GDP per capita was examined, there was also a significant association (Z = –2.53, two-sided p = 0.0113, R2 analog = 0.20, 77 countries). Figure 2 (Supplementary material) shows the scatterplot. Prevalence reduces with increasing GDP per capita. Because there was an outlier with a very high GDP per capita, this variable was also examined after a log10 transformation. The results were very similar (Z = –2.50, two-sided p = 0.0123, R2 analog = 0.21, 77 countries). To explore whether this association was robust, the World Bank values for GDP per capita were also analyzed. Again, the results were similar (Z = –2.90, two-sided p = 0.0038, R2 analog = 0.21, 76 countries).
The meta-regression for the Gini Index showed no significant association (Z = 1.59, two-sided p = 0.1116, R2 analog = 0.09, 72 countries). The association with Gini Index was also non-significant when it was entered as a moderator together with GDP per capita (Z = 1.11, two-sided p = 0.2666, R2 analog = 0.22, 72 countries).
When both the Vulnerability Index and CIA GDP per capita were entered in a meta-regression, there was a significant association for the Vulnerability Index (Z = 2.08, two-sided p = 0.0374), but not for GDP per capita (Z = 0.41, two-sided p = 0.6842). The R2 analog for this model was 0.25 (72 countries).
Given that the Vulnerability Index was the major predictor in the regressions, an exploration was undertaken of the robustness of this association when the samples were divided by gender and by age group. It was found that the association was present for both males and females, and for the age groups 18–29, 30–49 and 50+ years.
Sadness
In a meta-regression, the Vulnerability Index was significantly associated with logit of prevalence (Z = 10.12, two-sided p < 0.0001, R2 analog = 0.42, 138 countries). The scatterplot in Figure 3 (Supplementary material) shows that the prevalence of sadness increases with vulnerability.
There was also a significant association with CIA GDP per capita (Z = –7.64, two-sided p < 0.0001, R2 analog = 0.25, 141 countries), with wealthier countries having a lower prevalence. Figure 4 (Supplementary material) shows the scatterplot. The results were similar when World Bank values for GDP per capita were analyzed (Z = –6.05, two-sided p < 0.0001, R2 analog = 0.19, 140 countries).
There was also an association with the Gini Index, with more unequal countries having higher prevalence (Z = 3.72, two-sided p = 0.0002, R2 analog = 0.05, 134 countries). However, the association with Gini Index was non-significant when it was entered as a moderator together with GDP per capita (Z = 1.53, two-sided p = 0.1262, R2 analog = 0.28, 134 countries).
When both the Vulnerability Index and CIA GDP per capita were entered in a meta-regression, there was a significant association for the Vulnerability Index (Z = 5.68, two-sided p < 0.0001), but not for GDP per capita (Z = –0.30, two-sided p = 0.7611). The R2 analog for this model was 0.42 (138 countries). It was not possible to explore the robustness of this association by gender and age, as a breakdown of country prevalence data by these variables was not available.
Worry
In a meta-regression, the Vulnerability Index was significantly associated with logit of prevalence (Z = 5.50, two-sided p < 0.0001, R2 analog = 0.17, 138 countries). The scatterplot in Figure 5 (Supplementary material) shows that the prevalence of sadness increases with vulnerability.
There was also a significant association with CIA GDP per capita (Z = –4.74, two-sided p < 0.0001, R2 analog = 0.11, 141 countries), with wealthier countries having a lower prevalence. Figure 6 (Supplementary material) shows the scatterplot. The results were similar when World Bank values for GDP per capita were analyzed (Z = –3.57, two-sided p = 0.0004, R2 analog = 0.07, 140 countries).
There was also an association with the Gini Index, with more unequal countries having higher prevalence (Z = 2.54, two-sided p = 0.0111, R2 analog = 0.02, 134 countries). However, the association with Gini Index was non-significant when it was entered as a moderator together with GDP per capita (Z = 1.07, two-sided p = 0.2859, R2 analog = 0.11, 134 countries).
When both the Vulnerability Index and CIA GDP per capita were entered in a meta-regression, there was a significant association for the Vulnerability Index (Z = 2.63, two-sided p = 0.0086), but not for GDP per capita (Z = –0.40, two-sided p = 0.6903). The R2 analog for this model was 0.15 (131 countries).
Associations between prevalence proportions
In order to see whether the prevalence proportions for the three symptoms were associated across countries, Pearson correlations were calculated after logit transformations. The correlation between worry and sadness was 0.75 (142 countries, p < 0.001), between sadness and unhappiness 0.31 (71 countries, p = 0.009) and between worry and unhappiness 0.27 (71 countries, p = 0.022).
Discussion
The prevalence of unhappiness, sadness and worry is significantly related to measures of vulnerability and GDP per capita, but not family income inequality, across all countries where data is available. As expected, higher vulnerability and lower GDP are associated with a greater prevalence of symptoms. Vulnerability measures are the major predictor, with GDP measures dropping out as a predictor when both the Vulnerability Index and GDP per capita are entered into a meta-regression. The robustness of vulnerability as a predictor of unhappiness is supported by the relationship remaining significant in all age groups and both genders.
There is no evidence of a vulnerability paradox. The association between vulnerability and prevalence of symptoms is seen across countries, consistent with what has been found within countries, where higher vulnerability is associated with unhappiness and higher rates of mental disorder (Foulds et al., 2014).
Previous attempts to explain why the vulnerability paradox reported in epidemiological studies is not reported in SWB studies is that the construct of SWB has only partial overlap with constructs of mental ill health (Mulder et al., 2020). However, unhappiness, sadness and worry, it can be argued, are better general measures of mental distress than SWB. The fact that these items are on so many scales suggests that they are symptoms of broader psychological distress as well as symptoms of depression and anxiety.
The finding that unhappiness, sadness and worry follow the expected relationship with vulnerability, and that this relationship is consistent with individual country data on vulnerability and mental disorders, suggests that the cross-national psychiatric epidemiology vulnerability paradox might, at least partially, reflect methodological flaws. The psychiatric epidemiological studies generally use the CIDI. However, evidence for the validity of the CIDI in surveys of the general population remains lacking. Remarkably, for an interview endorsed by the World Health Organization (WHO), little is known about its validity for making cross-national comparisons (Jorm, 2006). If mental disorders manifest differently in various countries, it may not be appropriate to use the same measure for all. Some published results are decidedly odd; a 0.0% prevalence of post-traumatic stress disorder (PTSD) in Nigeria, for example (Dückers et al., 2016). One cross-country comparison using a latent transition analysis of CIDI data found that the order of depression prevalence across countries was reversed when measurement factors were taken into account (Scorza et al., 2018).
However, the vulnerability paradox has also been reported using suicide mortality data. It is conceivable that the paradox does apply to suicide but not to symptoms of mental illness, as suicide has somewhat different risk factors to mental illness.
These analyses have a number of limitations. While the prevalence of sadness and worry from the Gallup World Poll are very highly correlated, as would be expected if they are measuring the same construct, the correlations of these with prevalence of unhappiness in the World Values Survey is much lower (around 0.30). This difference may be due, in part, to the different time frame of the questions (life in general vs previous day), but also to the more restricted range of country vulnerability in the World Values Survey (mean = 38.30, SD = 11.31) compared to Gallup World Poll (mean = 45.19, SD = 14.56). Another limitation is that the three symptoms examined are all related to internalizing problems and do not cover other domains of mental health like externalizing problems and thought disorder. Finally, the assessment of these symptoms did not evaluate their impact on functioning, which is an important requirement of any health indicator.
In summary, the rich country-level data on unhappiness, sadness and worry consistently show that they are associated with measures of vulnerability and GDP per capita. The data are congruent with what is reported in individual countries and clinical observations. This finding underscores that reducing mental disorders should be a priority in poorer nations and that further economic and social development may be an important contributor to achieving this.
Supplemental Material
sj-pdf-1-anp-10.1177_0004867421998780 – Supplemental material for Cross-national differences in the prevalence of mental illness symptoms: Evidence against the vulnerability paradox
Supplemental material, sj-pdf-1-anp-10.1177_0004867421998780 for Cross-national differences in the prevalence of mental illness symptoms: Evidence against the vulnerability paradox by Anthony F Jorm and Roger T Mulder in Australian & New Zealand Journal of Psychiatry
Footnotes
Declaration of Conflicting Interests
The author(s) declared no potential conflicts of interest with respect to the research, authorship and/or publication of this article.
Funding
The author(s) disclosed receipt of the following financial support for the research, authorship and/or publication of this article: A.F.J. is supported by an NHMRC Leadership Fellowship.
Supplemental Material
Supplemental material for this article is available online.
References
Supplementary Material
Please find the following supplemental material available below.
For Open Access articles published under a Creative Commons License, all supplemental material carries the same license as the article it is associated with.
For non-Open Access articles published, all supplemental material carries a non-exclusive license, and permission requests for re-use of supplemental material or any part of supplemental material shall be sent directly to the copyright owner as specified in the copyright notice associated with the article.