
Abstract
Objective:
The volumes of various brain regions can be rapidly quantified using automated magnetic resonance imaging tools. While these appear to be useful at face value, their formal clinical utility is not yet understood, particularly for non-neuroradiologists and in patients presenting with suspected dementia. This study investigated the utility of an automated normative morphometry tool on determinations of brain atrophy by psychiatrists and radiologists in a tertiary hospital.
Methods:
Consecutive magnetic resonance scans (n = 110) of patients referred with suspected neurodegenerative disorders were obtained retrospectively and rated by two neuroradiologists, two general radiologists and four psychiatrists over two sessions. First, conventional magnetic resonance sequences were shown. Then, morphometry colour-coded maps, which segmented T1-weighted magnetisation prepared rapid gradient echo images into brain regions and visualised these regions in colour according to their volumetric standard deviation from a normative population, were added to the second reading which occurred ⩾6 weeks later. Presence and laterality of atrophy in frontal, parietal and temporal lobes and hippocampal regions were measured using a digital checklist. The primary outcome of inter-rater agreement on atrophy was measured with Fleiss’ Kappa (κ). We also evaluated the accuracy of the atrophy ratings for differentiating post hoc diagnosis of subjective cognitive impairment, mild cognitive impairment and dementia.
Results:
Agreement among all raters was fair in frontal lobe and moderate in other regions with conventional method (κ = 0.362–0.555). With morphometry, higher agreement was seen in all regions (κ = 0.551–0.654), reaching significant improvement in the frontal and temporal lobes. No significant improvement was seen within the various disciplines, except in frontal lobes rated by psychiatrists. Accuracy of atrophy ratings on determining post hoc diagnosis was significantly improved for distinguishing subjective cognitive impairment versus dementia.
Conclusion:
In routine clinical assessment, automated normative morphometry complements the determination of regional atrophy and improves inter-rater agreement regardless of neuroradiology experience.
Introduction
Dementia most commonly results from a range of neurodegenerative disorders, characterised by a progressive cognitive and functional decline that leads to permanent inability to maintain activities of daily living and premature death. Psychiatrists are not uncommonly faced with a presentation of suspected dementia in both medical and psychiatric settings. Making the diagnosis of dementia can incorporate history taking, physical and cognitive examinations, neuroimaging, cerebrospinal fluid and genetic investigations. In many instances, there is no single biochemical, genetic or pathological biomarker which acts as a gold standard. In the screening stages, non-contrast computed tomography (CT) is most prevalently used for excluding organic causes in suspected dementia. For further work-up, especially in a tertiary setting, magnetic resonance imaging (MRI) offers greater advantage than CT for assessing brain structure, where the presence of regional brain atrophy can be useful in substantiating a particular dementia diagnosis.
The determination of atrophy on MRI, however, can be prone to inconsistencies. Although structured radiology reports by neuroradiologists are considered the clinical gold standard, they are nonetheless often confounded by the level of experience of the reader and external factors such as pre-existing image and report comparisons and collateral information (Borghesani et al., 2010). Subjective elements and reporting errors, such as failing to appreciate the presence of regional atrophy, have been associated with low sensitivity and precision of around 33% among radiologists (Akazawa et al., 2019). Incorporation of visual rating (VR) scales can be useful, but there are several choices, and their suitability is limited by the study population and pre-rating training (Harper et al., 2015). Furthermore, outside of specialist tertiary hospitals, most MRI reviews and reports are not conducted by specialist neuroradiologists, and access to such expertise is not always readily accessible, if at all (McCarron et al., 2014). Meanwhile, our anecdotal experience also suggests psychiatrists are not confident at assessing MR images. Tools that can assist non-experts in interpreting images themselves, or at least prompt the need for further expert review, could therefore improve the often challenging diagnostic process in suspected dementia.
Numerous automated tools are increasingly available for quantifying regional brain volumes. These can be applied to routinely obtained MRI sequences with minimal computational burden and negligible training requirements. This morphometry method typically processes MR data in a series of algorithms consisting of image quality processing, atlas or probabilistic registration and segmentation, and comparison with normative data. The resultant relative regional volumes, which are readily visualised within a matter of a few minutes, have been shown to have diagnostic utility in some dementia subtypes. In Alzheimer’s disease (AD), for example, automated quantification of the hippocampi is associated with increased diagnostic confidence (Bosco et al., 2017). In other dementia and cognitive disorders, greater diagnostic accuracy has also been reported (Cajanus et al., 2018; Klöppel et al., 2015; Persson et al., 2016; Vernooij et al., 2018). The translation of these findings into a clinical setting, however, is not yet optimal as most studies focus on a subset of dementia and exclude the atypical presentations (e.g. frontal variant AD and comorbid schizophrenia in frontotemporal dementia [FTD] and the possibility of non-dementia diagnoses; Akazawa et al., 2019; Engedal et al., 2012; Vernooij et al., 2018), some of which will spuriously influence the computed regional volumes. Moreover, the use of automated morphometry without supervision by a radiologist remains unfeasible due to its poor diagnostic sensitivity (Akazawa et al., 2019). Therefore, automated morphometry is likely to aid in a complementary rather than a substitute role in the determination of regional atrophy, and we hypothesise that it will allow both general radiologists and clinicians that are not neuroradiology experts, such as psychiatrists, to interpret regional volume loss more accurately, and consistently.
Our study incorporated MorphoBox, an automated morphometry algorithm, for the determination of clinically significant atrophy in the setting of patients presenting with suspected dementia to a tertiary hospital. The algorithm, which segments T1 brain structure, has demonstrated comparable accuracy to FreeSurfer and voxel-based morphometry (Roche et al., 2017; Schmitter et al., 2014). Our primary aim was to evaluate the inter-rater agreement among radiologists and psychiatrists on determining hippocampal, frontal, parietal and temporal lobe atrophy. For each atrophy rating, we also explored the association with regional volume and post hoc clinical diagnosis.
Methods
Study population
Referrals for investigation of a possible neurodegenerative disorder to the Department of Radiology at the Royal Melbourne Hospital (a tertiary centre) are allocated a standardised MR protocol which includes automated morphometry. Consecutive MR studies between December 2015 and July 2017 were obtained retrospectively with an inclusion criterion of age over 18 years old. We included 110 cases to reach a cohort of ⩾50 cases in each ‘atrophy’ and ‘no atrophy’ group as determined by the existing clinical radiology report. Cases with tumour, acute stroke or cerebral haemorrhage and studies that were incomplete, severely degraded by artefact or unprocessed by MorphoBox (n = 16) were excluded. Age, sex and source of referral were also recorded. This study was approved by the Melbourne Health Human Research Ethics Committee.
MR acquisition
All cases had three-dimensional (3D) T1-weighted magnetisation prepared rapid gradient echo (MPRAGE) performed on a Siemens MAGNETOM Skyra 3 Tesla scanner with 64-channels coils. The acquisition parameters were 2300 ms repetition time, 2.91 ms echo time, 9° flip angle, 1 × 1 × 1 mm3 voxel size, 1 mm contiguous sagittal slices and 256 mm field-of-view. The parameters for other sequences are detailed in Supplemental material A.
MorphoBox algorithm and standard deviation colour maps
Description of the MorphoBox algorithm had been previously outlined (Chen et al., 2018; Roche et al., 2017; Schmitter et al., 2014). In brief, the freely available algorithm analysed T1 MPRAGE image in the following automated steps: (1) once quality checked for gradient distortion, artefact and inhomogeneity, the image input was registered to a single template in a non-rigid spatial transformation; (2) bias field correction was then applied using Gaussian mixture intensity model and constrained by template-based tissue prior probability maps, based on 136 healthy subjects; (3) skull stripping was performed by resampling total intracranial volume (TIV) template mask to the input image space; (4) to classify the brain tissue, the TIV restricted image was entered to template-free tissue classifier by incorporating stationary Markov-Potts prior model and fitted via variation expectation-maximisation algorithm, which generated probability tissue maps that corresponded to ventricular, grey and white matter structures; (5) these tissue maps were resampled with registered template masks to produce volume estimates of lobar grey and white matter, hippocampus, basal ganglia, brainstem and cerebellum; (6) using a log-linear model and accounting for age and sex as confounding covariates, normative ranges were calibrated based on a 306 healthy subjects (age 66.4 ± 19 years; range, 19–90 years; 49% female; average number of subjects in every half-decade 30.6 ± 39) using T1 MPRAGE 3 Tesla Alzheimer’s Disease Neuroimaging Initiative study parameters (Chen et al., 2018; Jack et al., 2008). Volumetric deviations from normative ranges were estimated by Z-scores and were projected in sagittal orientation with the corresponding continuous colour gradient (see Figure 1). The average computational duration for each case, using a single 3 GHz processor with 8 GB RAM computer, was 2 minutes.
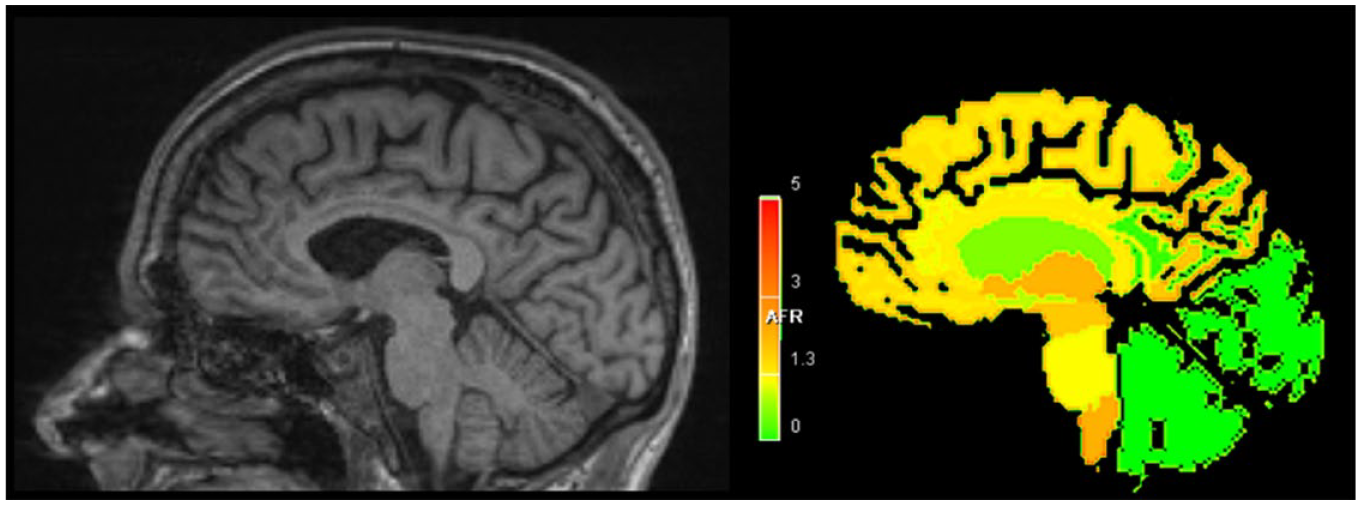
T1 MPRAGE and MorphoBox standard deviation colour map.
Atrophy rating procedure
All identifying MR data were anonymised, except for age and sex. Two neuroradiologists (12 and 29 years of subspecialist experience), two general radiologists (1 and 10 years of general radiology experience) and four psychiatrists (1, 2, 4 and 25 years of psychiatry experience) individually rated each of 110 randomised cases in 2 reading periods. In the first reading, the clinicians were shown the conventional MR sequences consisting of T1 MPRAGE (sagittal, coronal and axial) and axially orientated T2, fluid-attenuated inversion recovery, susceptibility- and diffusion-weighted imaging.
A second reading was performed after an interval of ⩾6 weeks, wherein the cases were re-randomised and re-rated using exactly the same imaging as in the first reading with the only addition being the MorphoBox SD colour map. The raters had the freedom to choose whether to visualise the colour map first, later or simultaneously.
Atrophy checklist
Using an electronic checklist, the raters were prompted to determine the region (frontal, parietal, temporal lobes and hippocampus) and laterality (right, left or bilateral) of atrophy, see Supplemental material B. These four brain structures have been implicated in various VR studies and a diagnostic algorithm in dementia (Harper et al., 2014, 2015). The checklist showed only the following clinical prompt: ‘Which of the following regions have age-inappropriate volume loss? That is, a degree of volume loss which you would describe as significant and likely pathological in the context of an MRI obtained in the setting of suspected neurodegenerative diseases’. Rating duration to complete each case was also recorded digitally and excluded if idled >400 seconds. Based on the post hoc clinical diagnosis, 20 cases with dementia and subjective cognitive impairment (SCI) were selected randomly and re-rated without MorphoBox by a neuroradiologist and a junior psychiatrist for intra-observer analysis.
Post hoc clinical diagnosis
Three months after MR scanning, post hoc clinical diagnosis made by the referrer was attained from the medical records and verified according to established criteria for probable AD, FTD, dementia with Lewy bodies (DLB), vascular dementia, Huntington disease (HD) and other unspecified dementia (American Psychiatric Association, 2013; McKeith et al., 2017; McKhann et al., 2011; Rascovsky et al., 2011; van Straaten et al., 2003). Non-dementia cases were classified as either mild cognitive impairment (MCI) as per Winblad’s criteria or SCI that was characterised as having deficit < 1 SD in ⩾2 more cognitive domains and Clinical Dementia Rating < 0.5 (Molinuevo et al., 2017; Winblad et al., 2004).
Statistical analyses
Data were analysed using statistical package R (R Core Team, 2013) and IBM SPSS Statistics, version 24.0. Gender, age of the post hoc diagnostic groups and duration of rating were analysed using chi-square, Kruskal–Wallis and Mann–Whitney U tests, respectively, according to their respective data distribution. Alpha for statistical significance was set at 0.05.
The primary outcome of inter-rater agreement on atrophy ratings across various brain regions was analysed with Fleiss’ Kappa (κ) (Fleiss, 1971). To evaluate the validity of the atrophy checklist, we also estimated the internal consistency using Cronbach’s alpha (α) to measure the average intra-observer absolute agreement by a neuroradiologist and a junior psychiatrist.
Level of α and κ agreement ranged from poor (<0), slight (0.0–0.20), fair (0.21–0.40), moderate (0.41–0.60), substantial (0.61–0.80) to near perfect (0.81–1.0). We also applied the same agreement analysis on cases with ‘any atrophy’ (⩾1 regional atrophy), which marked a possible neurodegenerative disorder.
The intrinsic effect of MorphoBox was assessed by compiling all the atrophy ratings and analysing these against the individual raw regional volume using partial correlations. This raw volume, which was blinded to the raters and independent of the normative data, was then adjusted to TIV (regional volume divided by TIV × 100%) for correcting different head sizes. The atrophy ratings were then plotted with the regional volume: TIV ratio (%) on the y-axis and age (years) on the x-axis, and their partial correlation (i.e. precision of ratings by an average rater against the raw volume) were further detailed and analysed in Supplemental material C.
Receiver operating characteristic (ROC) analysis was used to assess the diagnostic accuracy of ‘any atrophy’ ratings (⩾1 atrophy vs no atrophy) relative to post hoc diagnoses of dementia (AD, FTD, DLB, vascular dementia, HD and other unspecified dementia), MCI and SCI dichotomously. In this pairwise diagnostic comparison, accuracy indicated the presence of atrophy in the more severe group (i.e. dementia > MCI > SCI). For each of these diagnostic comparisons, DeLong’s non-parametric test was applied to the area under ROC curve (AUC) to show the 95% confidence interval (CI) and p-value (DeLong et al., 1988). Logistic regression was used to adjust for age and sex after examination of its variable effect on the atrophy ratings, and Youden’s index was used to estimate optimal cut-off point where true disease prevalence was unknown (Youden, 1950). Calculation for the ROC performance measures, including sensitivity, AUC and specificity, were also outlined and plotted in Supplemental material D.
Results
Demographics, source of referral and post hoc clinical diagnosis
Median age of the 110 cases was 67.5 years with significantly more female (63.6%, p = 0.004) than male cases. Median age for SCI, MCI and dementia were 60.5 (95% CI = [50.6, 68.9]), 66.5 (95% CI = [59.6, 71.3]) and 72.0 (95% CI = [65.7, 75.3], p < 0.001), respectively. The proportions of the source of referrals, referring speciality and post hoc clinical diagnosis are shown in Table 1.
Clinical characteristics of the patients referred with suspected dementia.
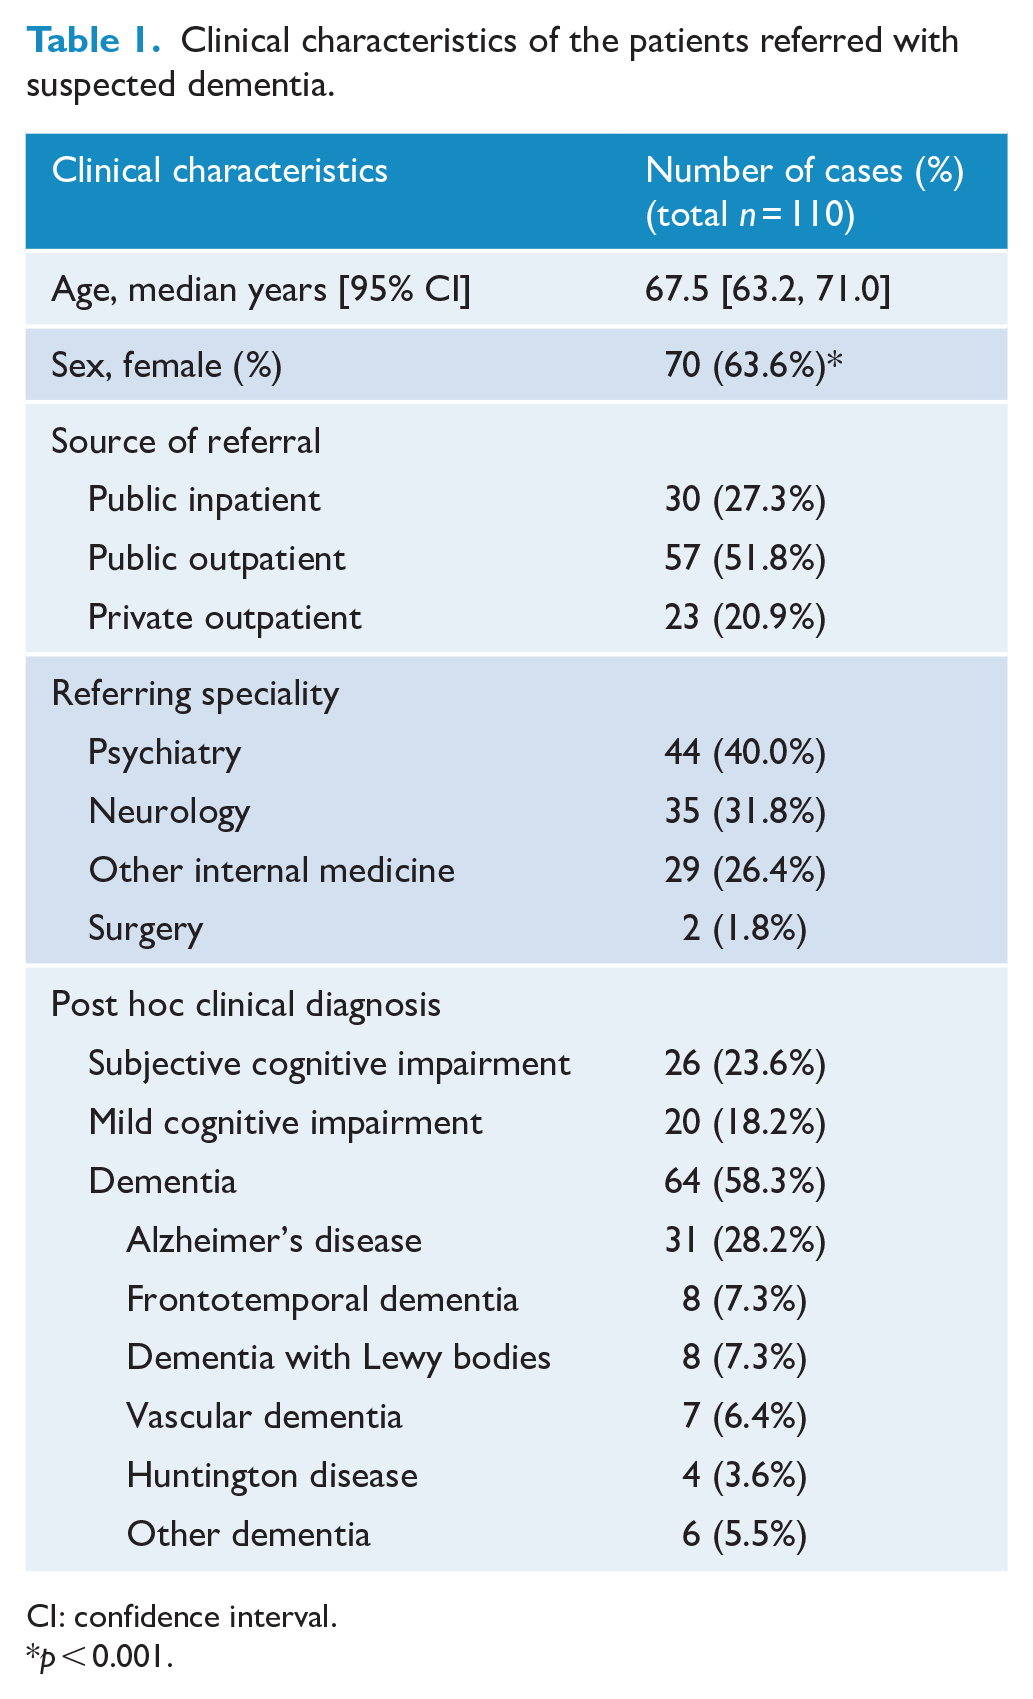
CI: confidence interval.
p < 0.001.
Internal consistency of atrophy checklist
Levels of absolute intra-observer agreement on atrophy by a neuroradiologist and a junior psychiatrist were near perfect (frontal α = 0.842, parietal = 0.925, temporal = 0.921, hippocampus = 0.956 and any atrophy = 0.960).
Inter-rater agreement
Agreement κ (95% CI) for all regions is illustrated in Figure 2 and shown according to the speciality in Table 2. Among all raters, agreement in the first reading was fair in the frontal lobe and moderate in other regions. The strongest agreement was shown in the hippocampus (κ = 0.555). With MorphoBox, a statistically significant increase in agreement among all raters was seen in the frontal and temporal lobes. The improved agreement in parietal lobe and hippocampus ratings was not significant.
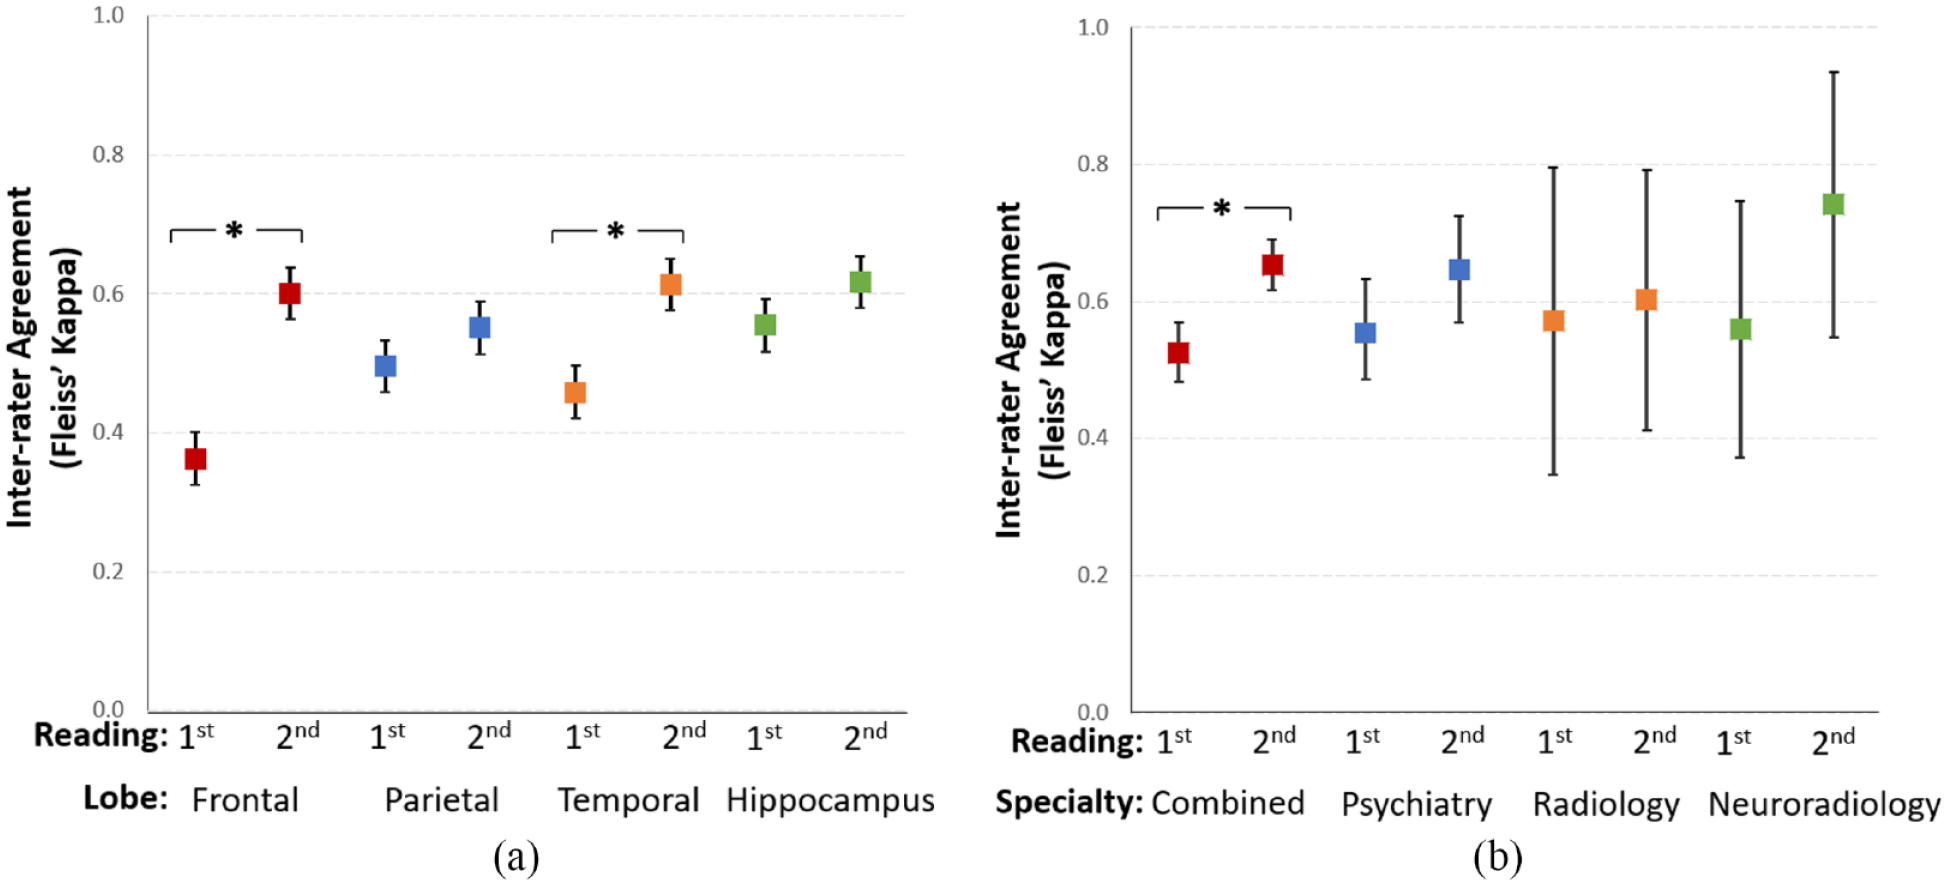
(a) Interval plot of combined inter-rater agreement according to the brain region. Conventional MRI rating protocol corresponds to first reading and the addition of MorphoBox corresponds to second reading. Mean Fleiss’ Kappa and 95% confidence interval are shown. ‘*’ denotes significant improved inter-rater agreement between the readings. (b) Interval plot of intra-speciality agreement on ‘any atrophy’ in each case.
Inter-speciality agreement between first (conventional rating) and second reading (addition of MorphoBox) among different brain lobes.
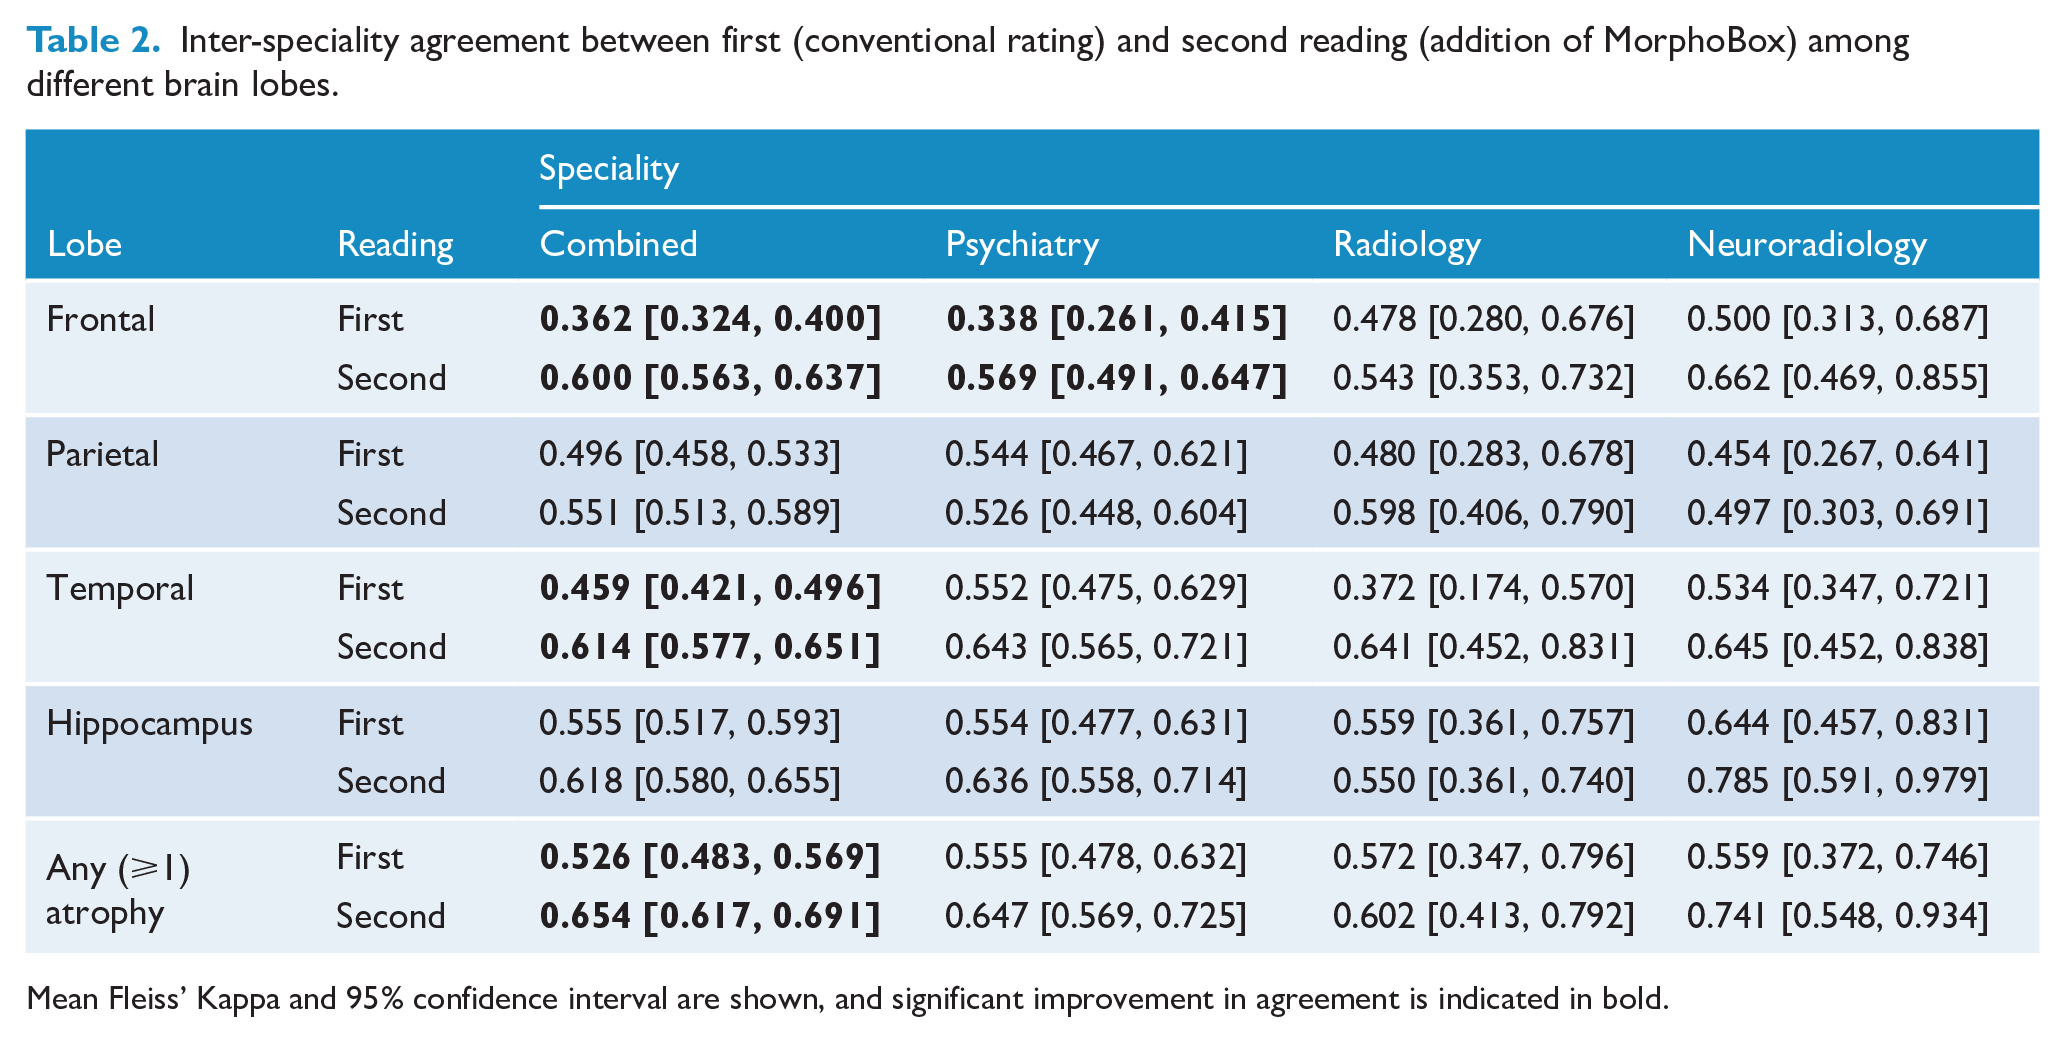
Mean Fleiss’ Kappa and 95% confidence interval are shown, and significant improvement in agreement is indicated in bold.
Patterns of improved agreement in the second reading were variable across different specialities. All regions showed trends of higher intra-speciality agreement in the second reading, except for parietal lobe among psychiatrists and hippocampus among general radiologists. However, a significant improved intra-speciality agreement was only seen in the frontal lobes that were rated by psychiatrists. A substantial level of intra-speciality agreement was seen only in the first reading of hippocampus among neuroradiologists (κ = 0.644). In the second reading, substantial intra-speciality agreement was observed in temporal lobe by all specialists, hippocampus by psychiatrists and neuroradiologists, and frontal lobe by neuroradiologists. Hippocampus also showed the highest level of agreement in both readings among neuroradiologists (first and second reading κ = 0.644 and 0.785).
Agreement on any atrophy was moderate in the first reading, and improved for all disciplines in the second reading, reaching statistical significance in the multi-speciality combined group.
Rating times
After exclusion of 2.3% (40/1760 ratings) of idle case rating, median rating times for each case were significantly reduced in the second reading as the use of MorphoBox seemed to promptly assure or disprove the raters’ initial impression of atrophy and minimise the time to re-think (first vs second reading, 107 vs 84 seconds, p < 0.001). The outlier exclusion analysis is further detailed in Supplemental material E.
Correlations of atrophy rating with age and regional: TIV ratio
Relative to age and regional: TIV ratio, the collective atrophy ratings by all raters showed stronger correlations (precision) in the second reading, except in parietal lobes and hippocampus of female cases with no atrophy, hippocampus of male cases with no atrophy, and left parietal lobe and hippocampus of male cases with atrophy (see Figure 3 and Supplemental material C). Strongest correlations of collective atrophy ratings were observed with the MorphoBox-assisted reading in the frontal lobes. For each specialist group, the graphs in Supplemental material C also did not show visible differences in the correlation of the atrophy ratings with the MorphoBox-derived volumes.
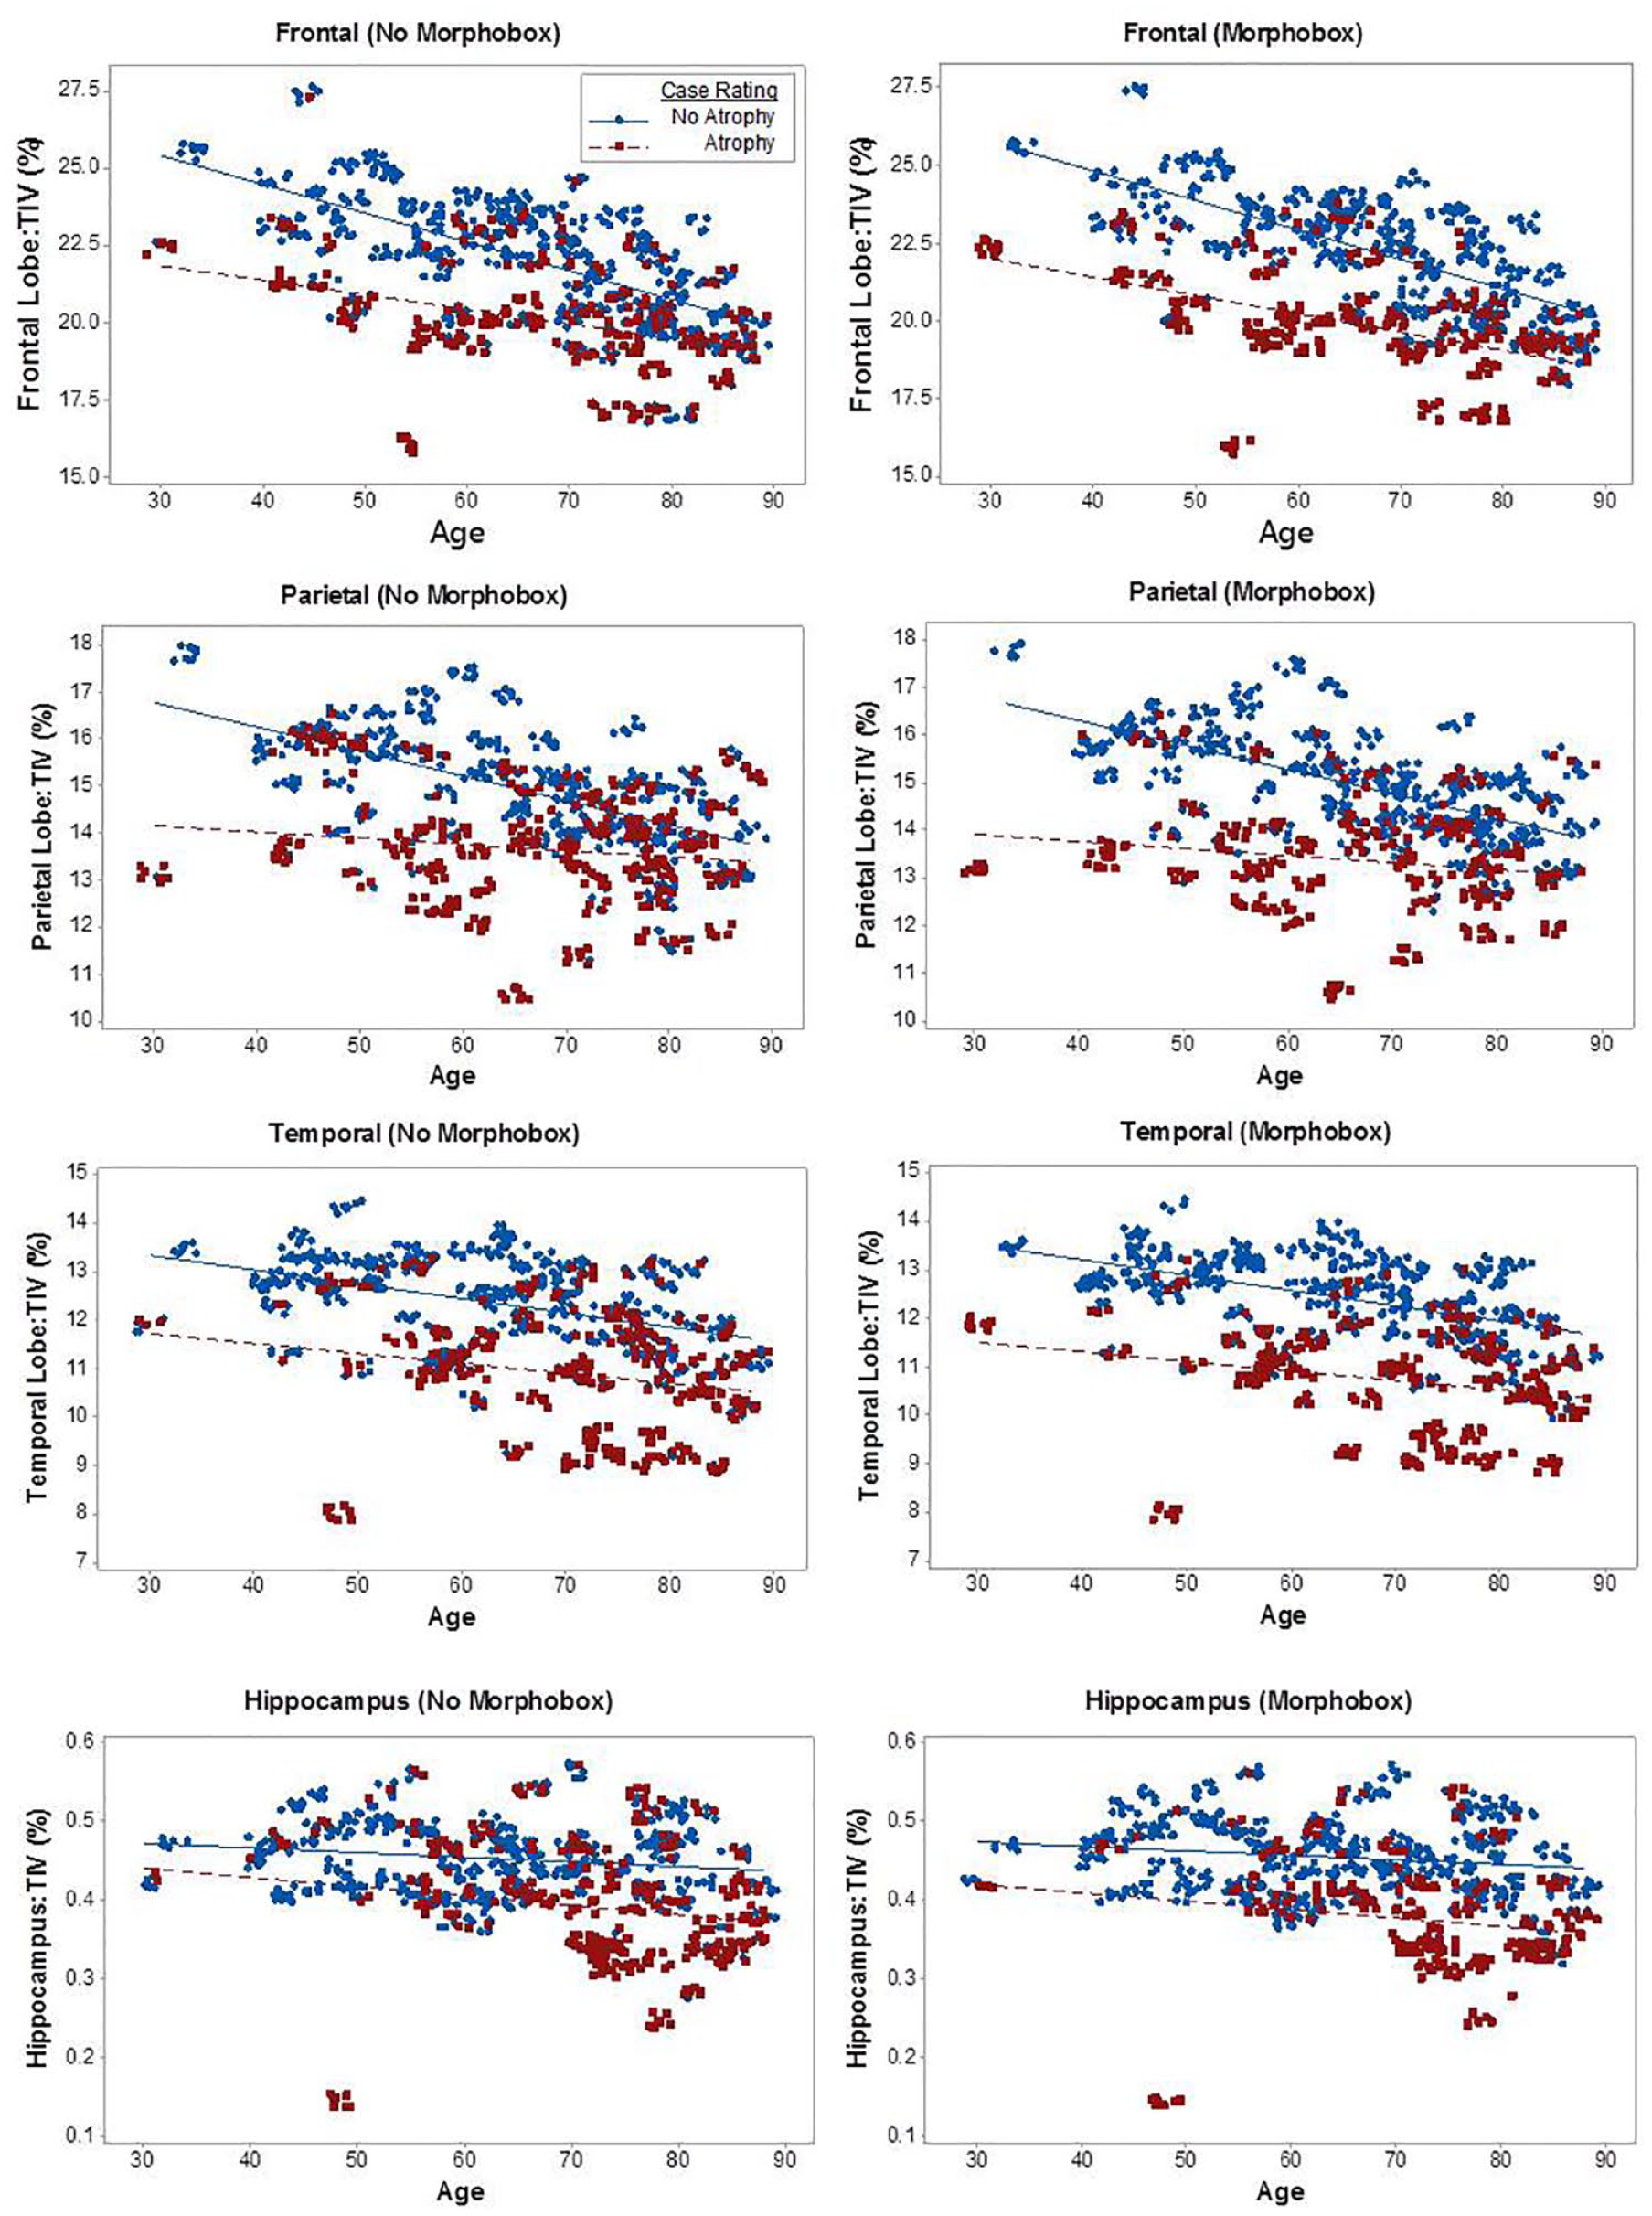
Scatterplot showing correlations of atrophy ratings relative to age and regional: total intracranial volume (TIV) ratio.
‘Any atrophy’ classification as a determinant of post hoc clinical diagnosis
As shown in Table 3, compared to the conventional reading, any atrophy rating by all raters was significantly more accurate with MorphoBox in the SCI versus dementia comparison (p = 0.002), while trends of improved accuracy in SCI versus MCI (p = 0.06) and MCI versus dementia (p = 0.615) comparisons were not significant. The overall diagnostic distinction was highest between SCI versus dementia, followed by MCI versus dementia, in the second reading.
Binary diagnostic classification rating of ‘any atrophy’ by all raters among SCI, MCI and dementia.
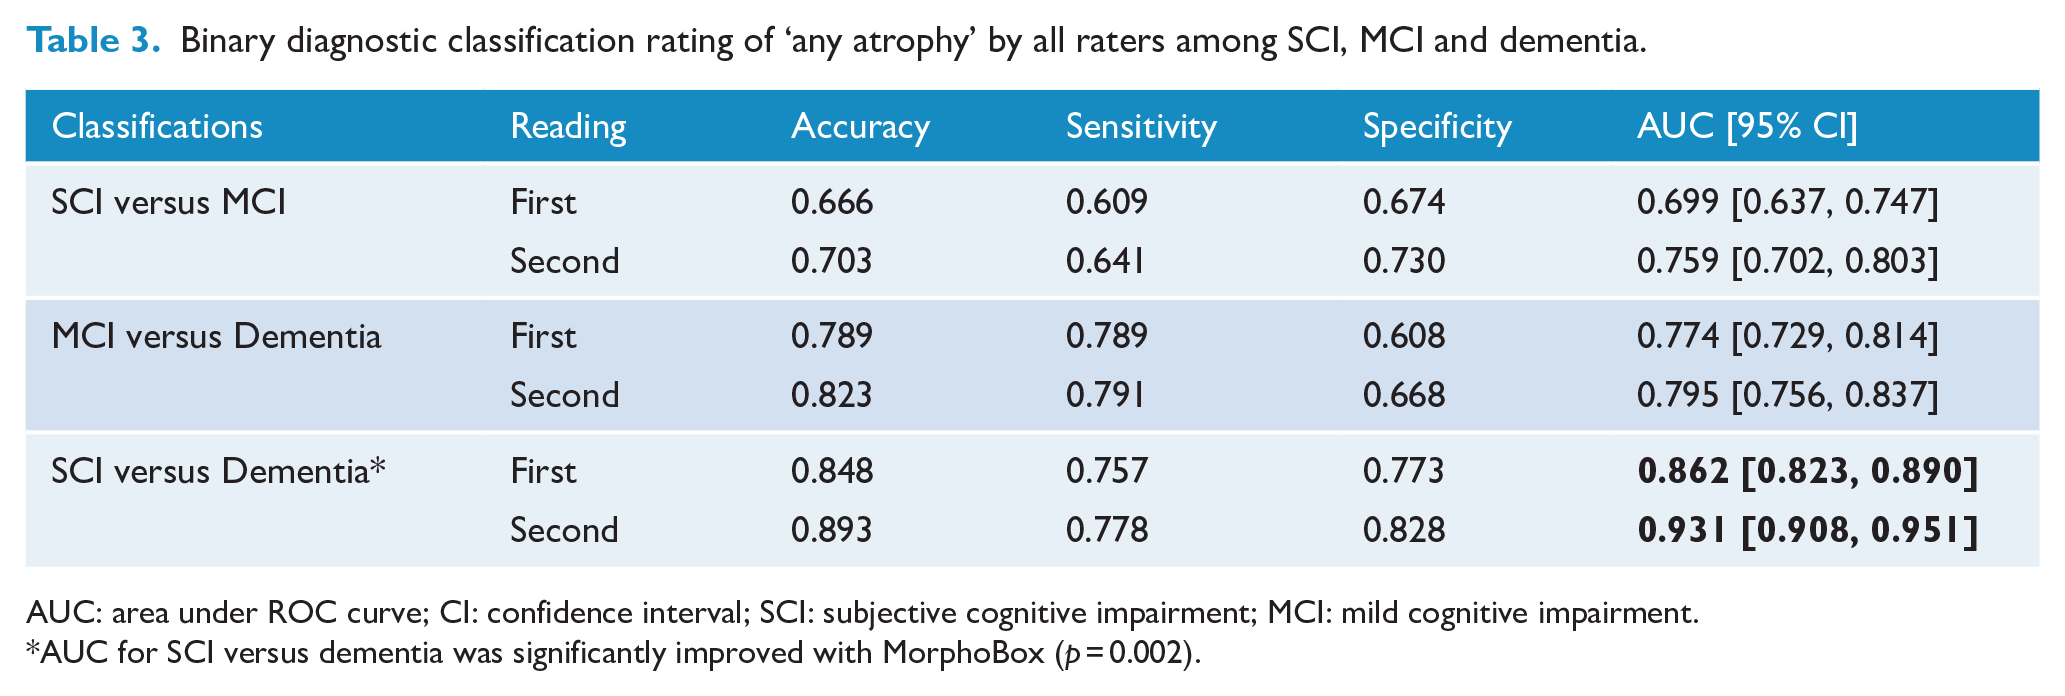
AUC: area under ROC curve; CI: confidence interval; SCI: subjective cognitive impairment; MCI: mild cognitive impairment.
AUC for SCI versus dementia was significantly improved with MorphoBox (p = 0.002).
Discussion
We hypothesised that the introduction of automated segmentation tools such as MorphoBox potentially improves accuracy and inter-reader agreement, in particular among non-neuroradiologists. With the use of MorphoBox volumetric SD colour map, we found a significant improvement in the inter-rater determination of frontal and temporal atrophy by all raters, and frontal atrophy among psychiatrists. In most lobes, the MorphoBox-assisted atrophy ratings were also complemented by greater correlations with MorphoBox’s volumetric algorithm (see Supplemental material C), as well as showing greater accuracy at distinguishing overall clinical diagnoses 3 months post-scanning, particularly between SCI and dementia.
Rating agreements by all raters and correlations with MorphoBox-derived volume were most improved in the frontal lobe, followed by the temporal lobe. Among different specialities, trends of improved agreement with MorphoBox were consistent in frontal and temporal lobe but failed to reach statistical significance (except for frontal lobe determined by psychiatrists), particularly in speciality with an insufficient number of raters. Clinical determination of frontal atrophy is often complicated by imprecise anatomical landmarks and variable pathophysiology and patterns of atrophy (Bang et al., 2015). Accordingly, unassisted reading of this lobe seemed to be associated with the poorest inter-rater agreement and internal consistency in this study. With psychiatric cases accounting for 40% of referrals in our cohort, the significant improvement of determining frontal lobe atrophy by psychiatrists may potentially benefit in psychiatric presentations with overlapping clinical and radiological features, such as personality changes in schizophrenia and FTD (Velakoulis et al., 2009). Likewise, significant improvements in rating agreements by all raters were also observed in the temporal lobe. This may be attributed to the greater segmentation accuracy of large brain structures, as a previous study has found greater accuracy in temporal lobe than hippocampus (Schmitter et al., 2014).
Prior clinical experience may have biased and subsequently limited the improvement in the second reading of parietal lobe and hippocampus. In the first reading, a higher agreement is observed in the hippocampus than in other regions. Without MorphoBox, a near-perfect internal consistency was also seen in this region. These levels of agreement seem comparable to the medial temporal atrophy (MTA) scale (Scheltens et al., 1995), which is widely used for measuring the hippocampus in the radiological assessment of suspected dementia. Comparably, inter-rater agreement of MTA has been shown to be greater than scales that rate parietal, occipital and whole-brain regions (Koedam et al., 2011). The scale also has equivalent accuracy to an automated segmentation of hippocampus (Shen et al., 2011), which may explain the limited supplemental effect of morphometry in this study. Automated hippocampal segmentation is also lower in accuracy, particularly with the use of single-atlas template, and more vulnerable to MR artefact than other examined regions (Cash et al., 2015; Schmitter et al., 2014; Zandifar et al., 2017). For instance, the correlations between atrophy ratings and hippocampal volume appeared stronger in cases rated as having atrophy than no atrophy in this study, which is paradoxical to the use of healthy individual scans in the MorphoBox algorithm (Roche et al., 2017). Nonetheless, a general trend of improving agreement was shown in the assisted reading of hippocampus, including the highest level of agreement between the neuroradiologists. The use of hippocampal normative values (e.g. SD colour map) across multiple morphometry tools, including MorphoBox, have also been shown to improve diagnostic confidence beyond radionucleotide imaging, neuropsychological test and MTA scores (Bosco et al., 2017).
Regular clinical exposure among our psychiatrist group to younger-onset AD, characterised by precuneus atrophy, may have nullified the addition of MorphoBox in the parietal lobe. Moreover, poor volumetric correlations in parietal lobes of male cases suggest an association between sex and variability of neurodegeneration. In the general setting, however, trends of improvement in the second reading of parietal lobe were observed in both groups of radiologists.
‘Any atrophy’ classification was associated with an improved inter-rater agreement in the second reading (first and second reading κ = 0.526 and 0.654), as well as an improved accuracy in distinguishing SCI versus dementia. Despite lacking in anatomical specificity, this classification seemed to identify cases in the expected direction of diagnostic severities, that is, dementia > MCI > SCI. However, the distinction between SCI versus MCI, and MCI versus dementia, which often is clinically ambiguous, did not show a statistically significant improvement with MorphoBox. The diagnosis of MCI may indicate a transition between SCI and dementia, where the clinicians were less consistent and confident of their atrophy ratings. This transition could be visualised in Figure 3, where, compared to age and volume, the ratings of atrophy and no atrophy overlapped and persisted in both reading methods. Nevertheless, the atrophy ratings during the MorphoBox-assisted reading showed greater correlation or precision among all raters (see Supplemental material C), which subsequently could account for the improved distinction of the post hoc diagnoses. Beyond SCI, MCI and dementia, the potential for morphometry to automatically differentiate subtypes of dementia is desirable, but studies with consecutive clinical sampling have not supported this (Akazawa et al., 2019; Engedal et al., 2012), and our sample number does not justify such further analysis.
Our overall levels of inter-rater agreement, which were relatively moderate, might not be directly comparable to other VR scale studies without the consideration of the sampling method. Moderate levels of inter-rater agreement are typically observed in studies that employ a consecutive sampling method (Harper et al., 2015; Pasquier et al., 1996; Scheltens et al., 1995). With such sampling, a source of disagreement often lies in the transition between early dementia and extremes of normal ageing, such as the MCI population in this study. This observation is intrinsic in a cross-sectional sample with the varying features and severity of neurocognitive disorder. However, consecutive sampling is essential to establish the external validity and generalisability of our methods in the clinical setting. Conversely, in our internal consistency analysis, the selected sampling of extremes in diagnoses (SCI vs dementia) has yielded near-perfect agreement that is comparable to other studies with few and readily discernible clinical groups (e.g. pathologically confirmed AD vs healthy control), and without consecutive sampling (Harper et al., 2015). In addition, our consecutive sampling has been evaluated by a diverse group of specialists. In such condition, the comparable levels of inter-rater agreement with MorphoBox would appeal to non-expert clinicians, such as psychiatrists, to partake in MRI assessment incipiently.
In clinical practice, attempting to delineate the benefit of morphometry is challenging, as the relationship between degree and pattern of volume loss and clinical diagnosis is not perfect, and is further confounded by the fact that imaging forms part of the clinical formulation. Our classification of ‘any atrophy’, which improves the determination of SCI versus dementia, may support the role of automated morphometry in screening. This role is complemented by the rapid processing of brain images (2 minutes) with MorphoBox and the straightforward atrophy rating checklist. The use of MorphoBox was also associated with a reduction in rating duration, by around 20%, and amelioration of rating errors in obvious cases, as shown in Figure 3. However, the broader use beyond screening for obvious cases, particularly when considering MCI, should be informed by the broader clinical information and grounded in probabilistic (i.e. Bayesian) principles. Future directions for clinical morphometry studies may also benefit from incorporating longitudinal scans, disease-specific population MR image references, and other neurodegenerative biomarkers such as plasma, cerebrospinal fluid and positron emission tomography (Bosco et al., 2017; Eratne et al., 2020; Karikari et al., 2020; Klöppel et al., 2015; Pellegrini et al., 2018; Zheng et al., 2016).
Conclusion
The use of an automated quantification tool, MorphoBox, complements and improved the determination of brain atrophy for a variety of regions and for readers with differing levels of experience and expertise. While most improvements in agreement are modest, their practical and measurable benefits favour brain regions that seem more challenging to discern (i.e. frontal and temporal lobes), extend from neuroradiologists to psychiatrists, and yield greater diagnostic accuracy. These advantages support the implementation and complementary use of MorphoBox in screening and diagnosis of suspected dementia, for non-neuroradiologists such as psychiatrists, in real-world clinical settings.
Supplemental Material
sj-pdf-1-anp-10.1177_0004867421998444 – Supplemental material for Bringing psychiatrists into the picture: Automated measurement of regional MRI brain volume in patients with suspected dementia
Supplemental material, sj-pdf-1-anp-10.1177_0004867421998444 for Bringing psychiatrists into the picture: Automated measurement of regional MRI brain volume in patients with suspected dementia by Pierre Wibawa, Gabrielle Matta, Sourav Das, Dhamidhu Eratne, Sarah Farrand, Patricia Desmond, Dennis Velakoulis and Frank Gaillard in Australian & New Zealand Journal of Psychiatry
Footnotes
Acknowledgements
We would like to thank Siemens Healthineers for provision of the prototype morphometry package, MorphoBox, for use in this study. We also thank Dr Elaine Lui, Dr Ernest Lekgabe and Dr Mark Schoenwaelder for their participation in the clinical ratings.
Declaration of Conflicting Interests
The author(s) declared no potential conflicts of interest with respect to the research, authorship and/or publication of this article.
Funding
The author(s) received no financial support for the research, authorship and/or publication of this article.
Supplemental Material
Supplemental material for this article is available online.
References
Supplementary Material
Please find the following supplemental material available below.
For Open Access articles published under a Creative Commons License, all supplemental material carries the same license as the article it is associated with.
For non-Open Access articles published, all supplemental material carries a non-exclusive license, and permission requests for re-use of supplemental material or any part of supplemental material shall be sent directly to the copyright owner as specified in the copyright notice associated with the article.