
Abstract
Objective:
Schizophrenia, a complex psychiatric disorder, is often associated with cognitive, neurological and neuroimaging abnormalities. The processes underlying these abnormalities, and whether a subset of people with schizophrenia have a neuroprogressive or neurodegenerative component to schizophrenia, remain largely unknown. Examining fluid biomarkers of diverse types of neuronal damage could increase our understanding of these processes, as well as potentially provide clinically useful biomarkers, for example with assisting with differentiation from progressive neurodegenerative disorders such as Alzheimer and frontotemporal dementias.
Methods:
This study measured plasma neurofilament light chain protein (NfL) using ultrasensitive Simoa technology, to investigate the degree of neuronal injury in a well-characterised cohort of people with treatment-resistant schizophrenia on clozapine (n = 82), compared to first-degree relatives (an at-risk group, n = 37), people with schizophrenia not treated with clozapine (n = 13), and age- and sex-matched controls (n = 59).
Results:
We found no differences in NfL levels between treatment-resistant schizophrenia (mean NfL, M = 6.3 pg/mL, 95% confidence interval: [5.5, 7.2]), first-degree relatives (siblings, M = 6.7 pg/mL, 95% confidence interval: [5.2, 8.2]; parents, M after adjusting for age = 6.7 pg/mL, 95% confidence interval: [4.7, 8.8]), controls (M = 5.8 pg/mL, 95% confidence interval: [5.3, 6.3]) and not treated with clozapine (M = 4.9 pg/mL, 95% confidence interval: [4.0, 5.8]). Exploratory, hypothesis-generating analyses found weak correlations in treatment-resistant schizophrenia, between NfL and clozapine levels (Spearman’s r = 0.258, 95% confidence interval: [0.034, 0.457]), dyslipidaemia (r = 0.280, 95% confidence interval: [0.064, 0.470]) and a negative correlation with weight (r = −0.305, 95% confidence interval: [−0.504, −0.076]).
Conclusion:
Treatment-resistant schizophrenia does not appear to be associated with neuronal, particularly axonal degeneration. Further studies are warranted to investigate the utility of NfL to differentiate treatment-resistant schizophrenia from neurodegenerative disorders such as behavioural variant frontotemporal dementia, and to explore NfL in other stages of schizophrenia such as the prodome and first episode.
Introduction
Schizophrenia is a severe, complex psychiatric disorder, with a lifetime prevalence of approximately 1%, which causes significant functional and occupational impairment, and reduced life expectancy of approximately 20 years (Kahn et al., 2015). Symptoms are traditionally grouped into ‘positive symptoms’ (such as delusions and hallucinations) and ‘negative symptoms’ (such as apathy and social withdrawal). A proportion of patients have chronic, residual symptoms and impairment, including cognitive symptoms, despite current best available pharmacological and non-pharmacological interventions (Kahn et al., 2015; McCutcheon et al., 2020). While current models of schizophrenia posit it as a neurodevelopmental disorder (Forsyth and Lewis, 2017), there is evidence that some people with schizophrenia may have a progressive neurodegenerative disorder (Blennow et al., 1996; Pantelis et al., 2005; Rund, 2009).
Early descriptions of cognitive and functional decline in some people with schizophrenia, such as Kraepelin’s concept of dementia praecox, have been followed by more recent studies which have raised the possibility of a neuroprogressive or neurodegenerative component to schizophrenia, at least in a subset of patients (Kochunov and Hong, 2014; Velakoulis et al., 2009), consistent with evidence of progressive deterioration in some cognitive domains including associative memory (Wannan et al., 2018) and attentional set-shifting (Pantelis et al., 2009a).
In addition to cognitive impairments, schizophrenia is associated with neurological ‘soft signs’ and neuroimaging abnormalities (Chan et al., 2010; Kahn et al., 2015). There is evidence of abnormalities at first episode and in chronic schizophrenia, with evidence of progressive reductions in whole brain, grey and white matter volume and structure, and enlarged ventricles, with grey matter changes being most apparent during the earliest stages of illness (Berger et al., 2017; Cropley et al., 2017; Kelly et al., 2018; Pantelis et al., 2003; Van Erp et al., 2018; Velakoulis et al., 2006; Vita et al., 2019). Understanding these changes is complicated by potential confounders, such as general medical and substance use co-morbid disorders, the effects of pharmacological treatments of schizophrenia, the findings of ‘accelerating ageing’ (Cropley et al., 2017), and the interaction between dynamic changes seen at different stages of the illness and normal brain development (Pantelis et al., 2005, 2009b). There remains some debate whether neuronal injury or neurodegeneration occurs in schizophrenia to explain some of the above abnormalities (Rund, 2009), and the processes underlying the neurological and neuroimaging findings are largely unknown. Thus, examining fluid biomarkers of diverse types of neuronal damage could increase our understanding of these processes as well as possibly provide clinically useful biomarkers, for example with assisting in the often challenging clinical distinction of schizophrenia and other psychiatric disorders, from neurodegenerative disorders such as behavioural variant frontotemporal dementia (Chan et al., 2014; Ducharme et al., 2020; Eratne et al., 2020b).
Neurofilament light chain protein (NfL) is an essential component of the neuronal cytoskeleton, critical for growth and stability of axons in particular (Yuan et al., 2017). Elevated levels in cerebrospinal fluid (CSF) and blood have been demonstrated in a wide range of neurological and neurodegenerative conditions, with NfL functioning as a biomarker to identify and grade neuroaxonal injury, as well as for staging, prognosis and treatment response in many conditions (Ashton et al., 2021; Bridel et al., 2019; Gaetani et al., 2019; Khalil et al., 2018). A recent study explored plasma NfL in 42 people with schizophrenia (including 9 on clozapine) and reported slightly higher NfL levels in schizophrenia compared to controls and higher levels in clozapine-treated patients compared to controls (Rodrigues-Amorim et al., 2020). This study did not use ultrasensitive technology however, unlike more recent plasma NfL studies. Another recent study assessed serum NfL in 44 people with schizophrenia (including 9 on clozapine), finding no differences in levels when compared to a reference (not matched) normal population, but observed a greater proportion of people with levels above the 95th and 99th percentiles (Bavato et al., 2021). Regarding other severe psychiatric disorders, Bavato et al found higher serum NfL levels in people with major depressive disorder (MDD) compared to reference values from a healthy norm population, and another study found elevated levels in older women with MDDs (Bavato et al., 2021; Gudmundsson et al., 2010). Ashton et al. (2021) found no difference between MDD and controls. Studies have found no change in NfL levels during electroconvulsive therapy (ECT; Besse et al., 2020; Zachrisson et al., 2000). One study found elevated CSF NfL levels in people with bipolar disorder, and levels were associated with antipsychotic medication (Jakobsson et al., 2014). In our previous study, we found mildly elevated CSF NfL levels in about two-thirds of people with primary psychiatric disorders (including a group of individuals with schizophrenia spectrum disorders), when compared to suggested age-specific cut-offs (Eratne et al., 2020b). This finding provided preliminary support for us to explore plasma NfL in severe, chronic psychiatric disorders, such as treatment-resistant schizophrenia (TRS), which, although controversial, could be conceptualised as a progressive disorder (Vita et al., 2019). To our knowledge, no studies have used ultrasensitive technology to specifically examine plasma NfL concentrations in a large group of well-characterised participants with schizophrenia, and, in particular, in people with TRS.
The primary aim of this study was to compare plasma NfL levels in a large group of people with TRS (defined as failing to respond to two or more adequate trials of antipsychotics; Howes et al., 2017), to healthy controls. Secondary aims were to compare levels in TRS, unaffected siblings and parents, and a cohort of people with schizophrenia who were not on clozapine. We hypothesised that people with TRS would demonstrate elevated levels of NfL compared to controls. In addition, we performed exploratory, hypothesis-generating analyses for associations between NfL levels and key demographic and clinical variables in the TRS group. We broadly hypothesised that higher NfL levels would be associated with age, as well as greater illness severity and cognitive impairment.
Methods
Participant recruitment and data
Samples and data were obtained from the Cooperative Research Centre (CRC) Psychosis Study, which has been described previously (Bousman et al., 2019; Mostaid et al., 2017). Briefly, the CRC Psychosis Study was a cross-sectional study that recruited people aged 18–65 from inpatient and outpatient services in Melbourne, Australia, who were on clozapine and had a diagnosis of TRS, between 2012 and 2017. In addition, a group of first-degree relatives of the TRS group (siblings and parents) were recruited. Also included were a group of people with schizophrenia who were not treated with clozapine (NON-CLOZ) and a comparison group of unrelated, age, sex and sociodemographic matched healthy controls recruited from the general community. All participants were administered the Mini International Neuropsychiatric Interview to confirm the diagnosis of schizophrenia and to rule out current or past psychiatric illness in controls. The Positive and Negative Syndrome Scale (PANSS) was also administered, and functioning was evaluated using the Social and Occupational Functioning Assessment Scale (SOFAS). In addition, current IQ was measured using the two-subtest short forms (vocabulary and matrix reasoning) of the Weschler Abbreviated Scale of Intelligence. Detailed demographic, medical and other information was collected, as demonstrated in Table 1.
Demographics.
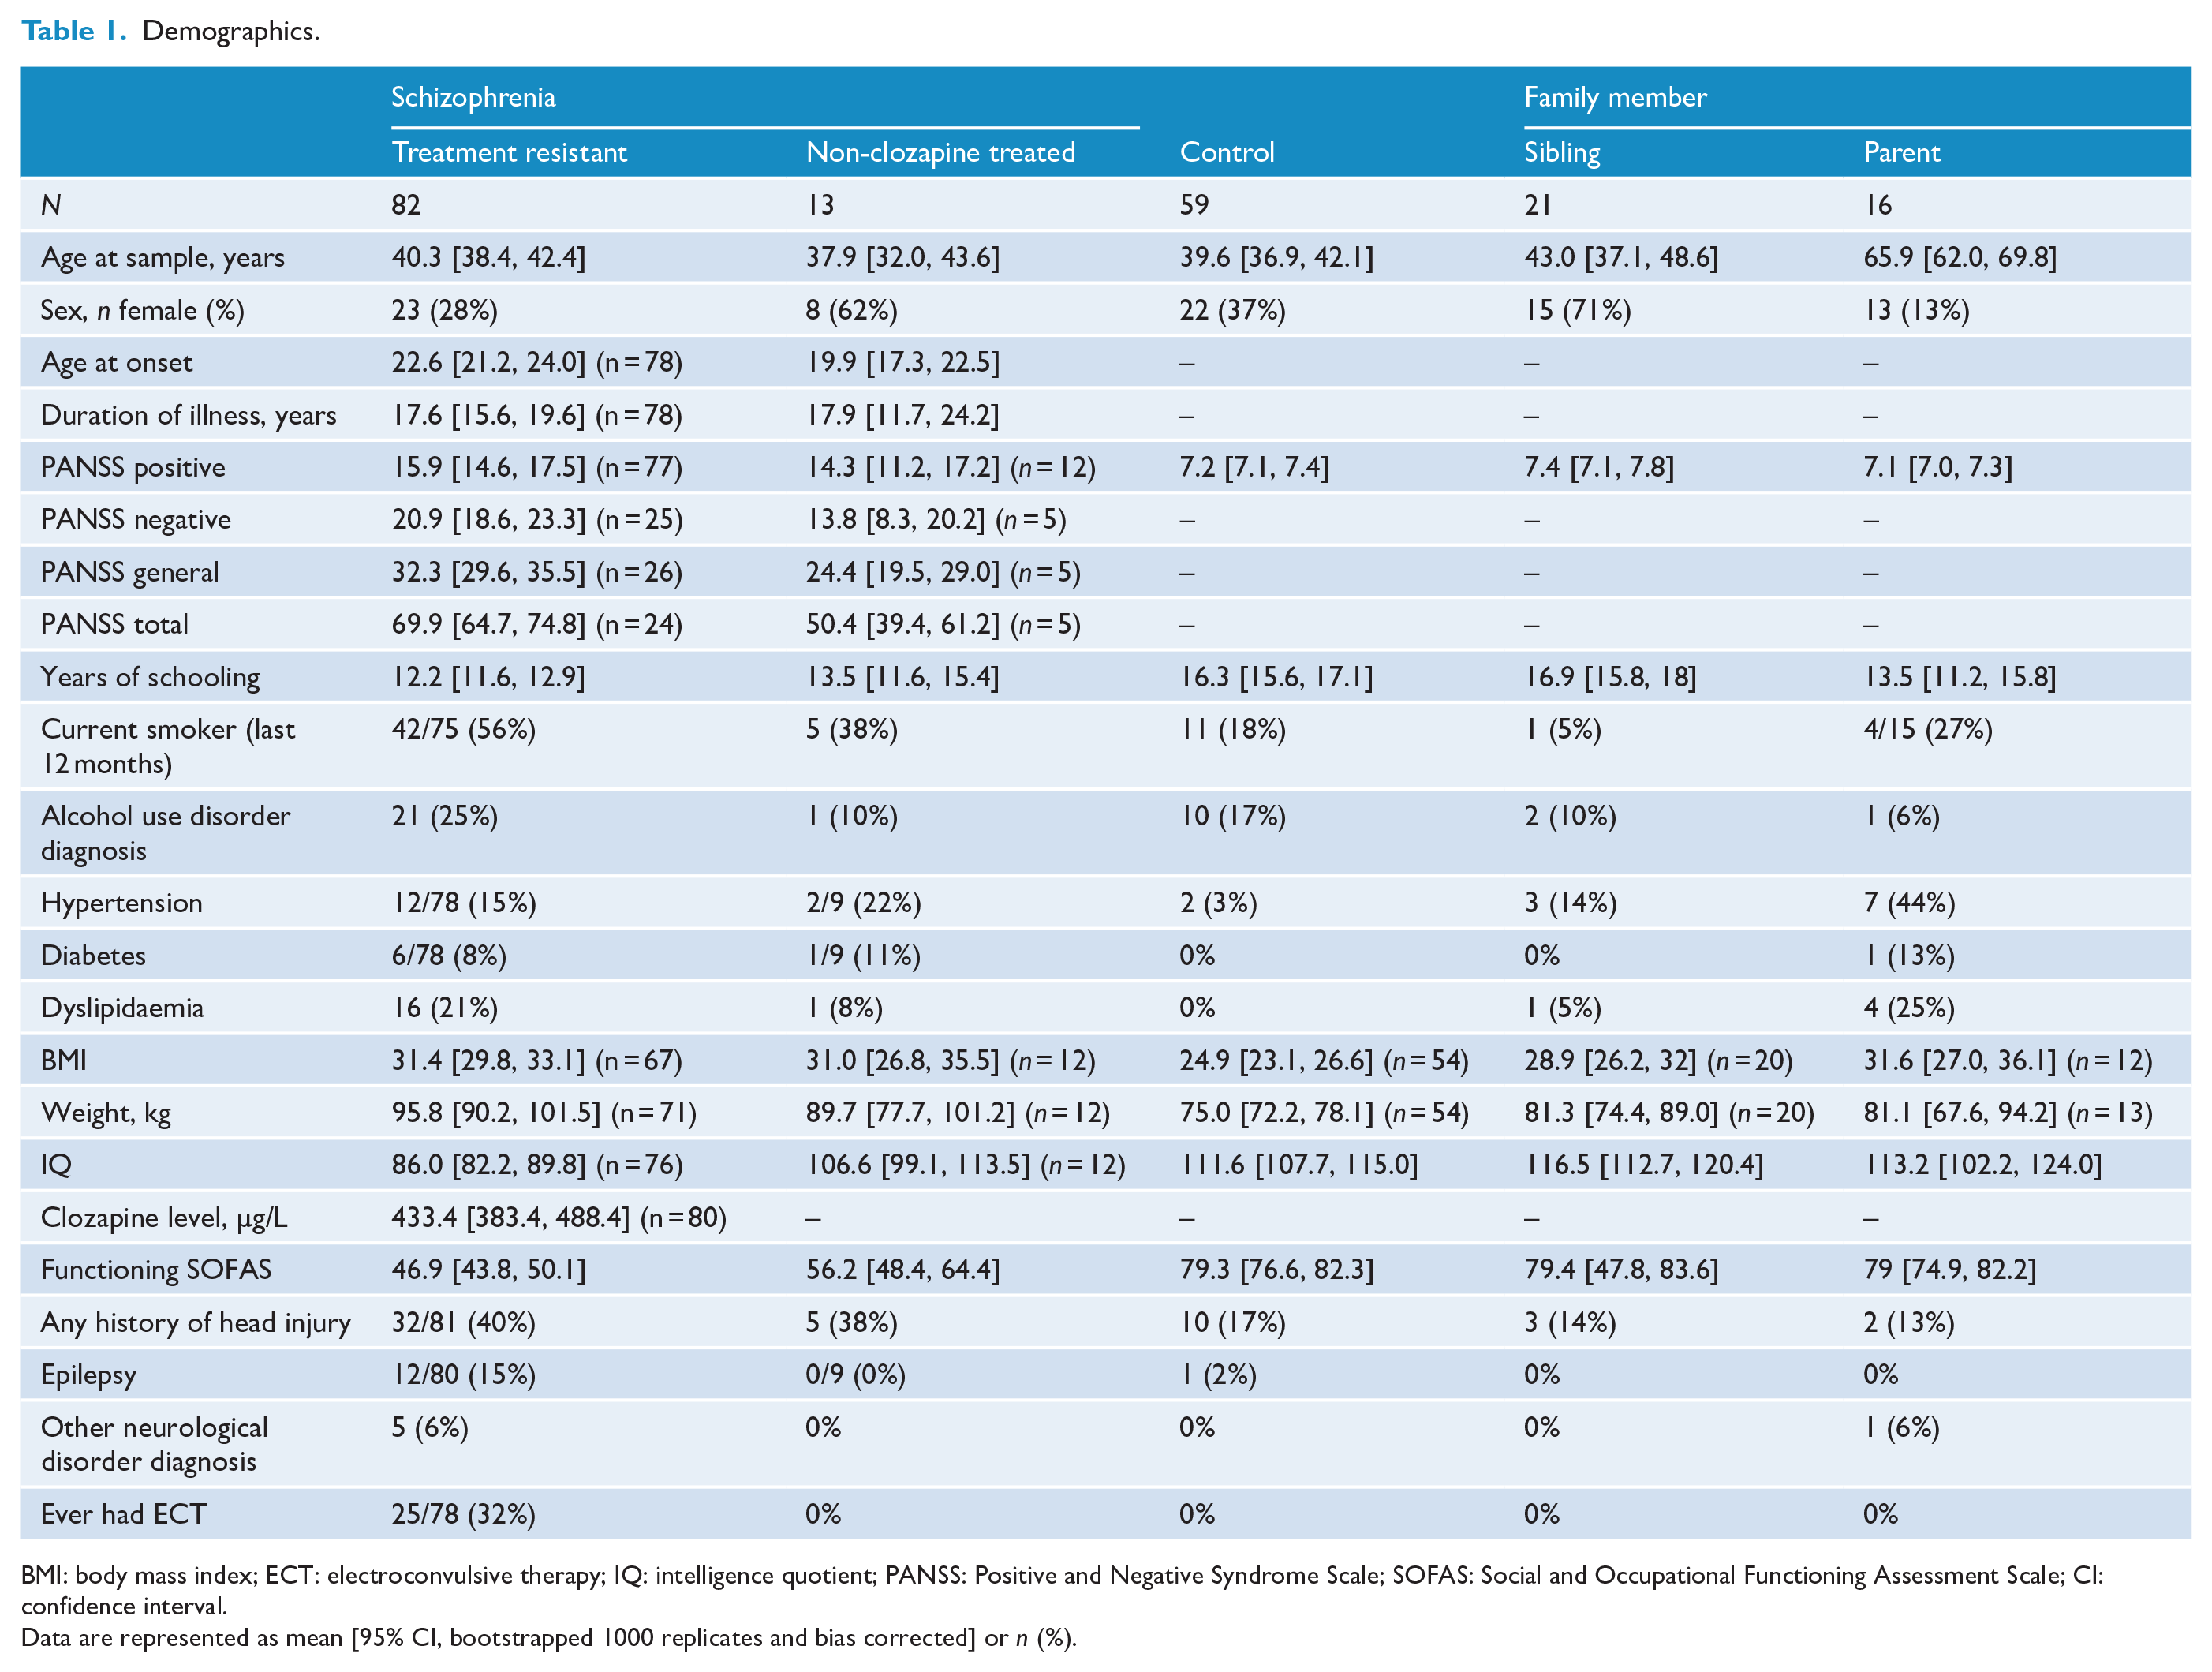
BMI: body mass index; ECT: electroconvulsive therapy; IQ: intelligence quotient; PANSS: Positive and Negative Syndrome Scale; SOFAS: Social and Occupational Functioning Assessment Scale; CI: confidence interval.
Data are represented as mean [95% CI, bootstrapped 1000 replicates and bias corrected] or n (%).
Sample analysis
Fasting blood samples were collected and plasma aliquots stored at −80°C. Plasma NfL levels were measured using a Simoa NF-Light Advantage Kit (SR-X), a digital immunoassay (mean limit of detection = 0.0552 pg/mL), according to the manufacturer’s recommendations (Quanterix Corporation, Billerica, MA, USA). All samples were diluted 1:4 in a sample diluent and analysed in duplicates. The average intra-plate coefficient of variability (CV) was 4.97%. Four quality control (QC) samples were included in every plate. The average inter-plate CV of the QC samples was 6.59%. NfL measurements were performed by a technician blinded to the clinical data.
All the participants provided written informed consent, after oral and written information was provided. The CRC psychosis study protocol and this study were approved by the Melbourne Health Human Research Ethics Committee (MHREC IDs 2012.069 and 2020.142).
Statistical analysis
All statistical analyses were performed using IBM SPSS 27 and R. General linear models (GLMs) were estimated to examine the relationships between NfL, groups and clinical variables. Given the established relationship between age and NfL levels (Gaetani et al., 2019; Khalil et al., 2018), age at blood sample was included as a covariate where appropriate. A number of variables displayed non-Gaussian distributions. As such, robust inference methods were used for all analyses. These robust statistical methods were selected because they mitigate the effects of distributional violations, including the presence of outliers. Bias-corrected and accelerated (BCa) confidence intervals (CIs) were computed for all GLMs via nonparametric bootstrapping, with 1000 replicates used. Statistical significance was defined as any CI not capturing the null-hypothesis value (at the 95% level). Spearman correlation coefficients were computed for exploratory, hypothesis-generating analyses. Sensitivity analyses were performed, including and excluding outliers, and analyses were performed with both log10 transformed NfL levels and untransformed levels, and any impacts of these sensitivity analyses reported.
Follow-up Bayesian t-tests were used to investigate whether negative group differences for the primary aim could be explained by low statistical power (Rouder et al., 2009). Hypothesis testing was performed by computation of the Bayes factor for the alternative hypothesis (BF10), which represents the ratio of evidence for the alternative hypothesis over the null hypothesis. Following Kass and Raftery (1995), we considered BF10 > 3.2 as an approximate lower bound of evidence for the alternative hypothesis. Conversely, BF10 < 1/3.2 was taken as a convenient boundary for evidence supporting the null hypothesis. BF10 values between approximately 1/3.2 and 3.2 were considered insensitive to either hypothesis given the evidence (Kass and Raftery, 1995).
In addition, further sensitivity analyses using Welch’s t-test, Levene’s test of homogeneity of variances, and generalised additive models for location, scale, and shape (GAMLSS) were performed to explore the presence in groups and impact of heterogeneity of variance and unequal sample sizes on the results.
Results
Study cohort details
A total of 191 participants from the CRC Psychosis Study Treatment Resistant Schizophrenia biobank had plasma samples available for NfL analysis and were included. Eighty-two participants had TRS. Thirty-seven participants were first-degree family members (compromising 21 siblings and 16 parents), related to 33 TRS participants. A group of 13 people with schizophrenia not treated with clozapine was available for comparison (NON-CLOZ), as well as 59 control participants, who were age and sex matched to the TRS group. TRS, NON-CLOZ, siblings and controls did not differ in age (Table 1). As expected, the TRS group had higher frequencies of cardiovascular and general medical comorbidities, and poorer performance on the Wechsler Abbreviated Scale of Intelligence, compared to controls and siblings. Both the TRS and NON-CLOZ groups had long duration of illness of 17.6 and 17.9 years, respectively. 29% in the TRS group had had ECT previously, compared to 0% in the NON-CLOZ group. Both patient groups demonstrated deficits on the SOFAS measure of functioning, which are scored out of 100, with higher scores indicating better functioning. TRS and NON-CLOZ were not different with regard to age at onset, duration of illness and PANSS positive scores. Full demographic and illness variables are detailed in Table 1.
NfL levels in TRS, controls and other groups
NfL levels are described in Table 2 and Figure 1. Two outliers were noted, one in the control group (45-year-old male, NfL 46.2 pg/mL, z-score = 6.96) and another in the parent group (67-year-old father, NfL 119.8 pg/mL, z-score = 3.71). Neither of these outliers had any known pre-analytical factors that would have falsely elevated levels, and both were healthy with no clinical symptoms. These outlier samples were analysed three times, and levels did not differ by more than 10%. These outliers, more than 5 to 10 times the mean in their respective groups, although not impacting the final statistical significance, did influence the unadjusted and adjusted means. Therefore, results with these extreme outliers included and excluded are presented.
Neurofilament light in treatment-resistant and non-clozapine-treated schizophrenia, siblings, parents, and control groups.
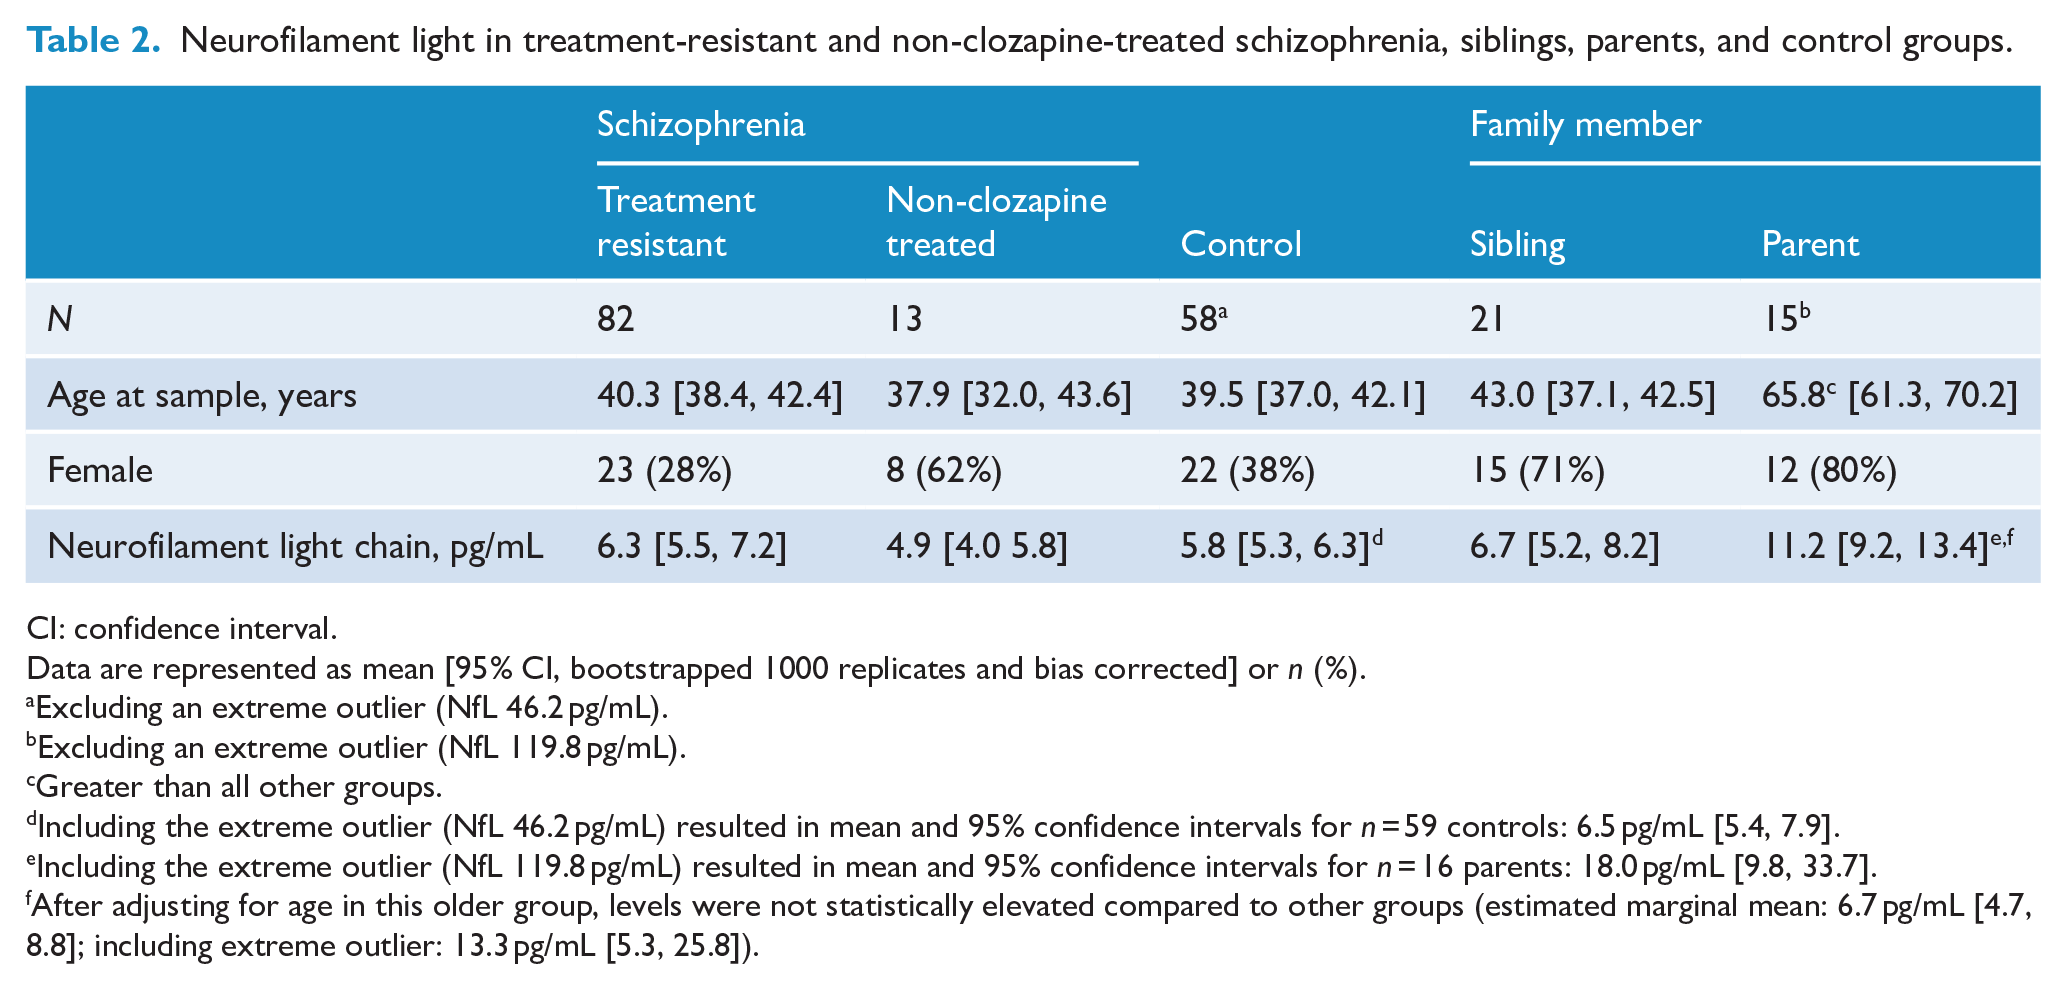
CI: confidence interval.
Data are represented as mean [95% CI, bootstrapped 1000 replicates and bias corrected] or n (%).
Excluding an extreme outlier (NfL 46.2 pg/mL).
Excluding an extreme outlier (NfL 119.8 pg/mL).
Greater than all other groups.
Including the extreme outlier (NfL 46.2 pg/mL) resulted in mean and 95% confidence intervals for n = 59 controls: 6.5 pg/mL [5.4, 7.9].
Including the extreme outlier (NfL 119.8 pg/mL) resulted in mean and 95% confidence intervals for n = 16 parents: 18.0 pg/mL [9.8, 33.7].
After adjusting for age in this older group, levels were not statistically elevated compared to other groups (estimated marginal mean: 6.7 pg/mL [4.7, 8.8]; including extreme outlier: 13.3 pg/mL [5.3, 25.8]).
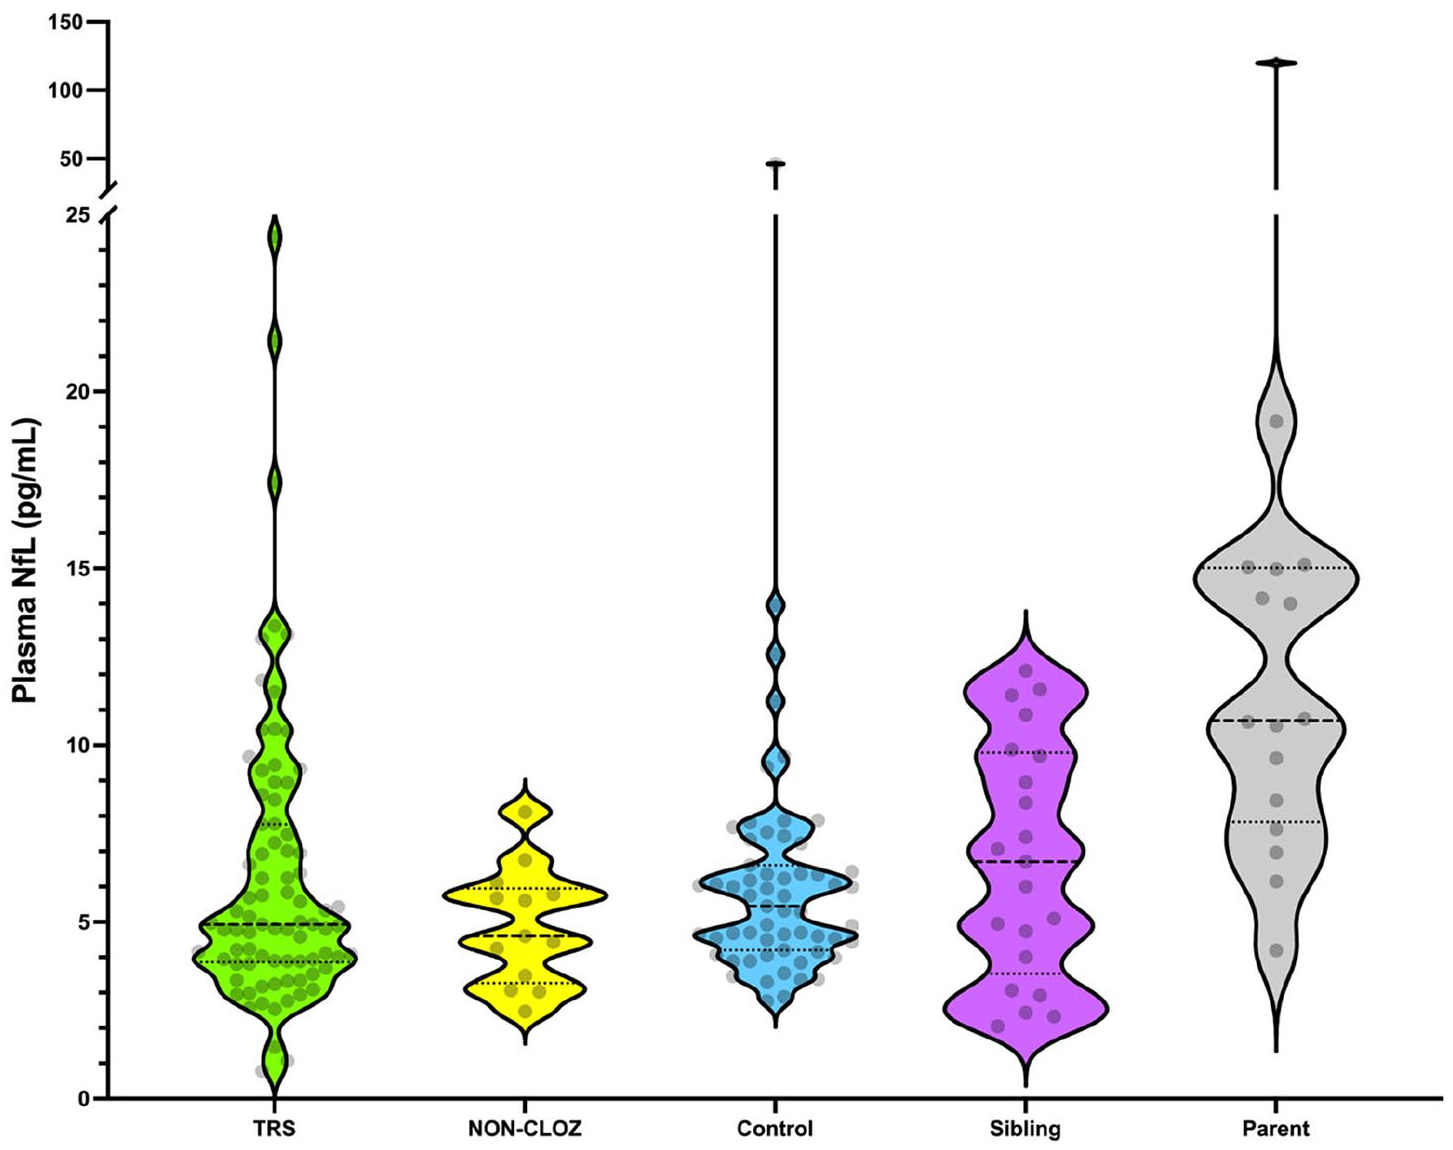
Plasma neurofilament light chain levels in treatment-resistant schizophrenia, non-clozapine-treated schizophrenia, controls, and unaffected siblings and parents.
The mean NfL level in the TRS group was 6.3 pg/mL (95% CI: [5.5, 7.2]). Levels in the TRS group were not different to controls (5.8 pg/mL, 95% CI: [5.3, 6.3], mean difference (Mdiff) = 0.4 pg/mL, 95% CI: [−0.6, 1.4], and including outlier: Mdiff = 0.3 pg/mL 95% CI: [−1.3, 1.9]). A Bayesian t-test was performed to determine whether this negative result was related to an underpowered study. The Bayes factor for the alternative hypothesis (BF10) was 0.14, which provided evidence for the null hypothesis and suggested that the negative finding was not due to the study being underpowered.
Levels in NON-CLOZ and siblings were 4.9 pg/mL, 95% CI: [4.0, 5.8] and 6.7 pg/mL, 95% CI: [5.2, 8.2], respectively. There were no statistical differences between TRS, siblings, NON-CLOZ and controls (Mdiff 95% CIs all included 0, whether including or excluding the control group outlier).
Percentile distributions between TRS, NON-CLOZ and siblings, compared to age-matched controls (Supplementary Table 1), showed an increased proportion of TRS and siblings participants with levels above the 90th percentile (Fisher exact test p = 0.039 and p < 0.001, respectively), but not above 95th and 98th percentiles, unlike Bavato and colleagues (Bavato et al., 2021).
After adjusting for the higher age in parents, there were no differences in NfL levels compared to the other groups. After adjusting for age, NfL levels estimated marginal mean in parents, excluding outlier was 6.7 pg/mL (95% CI: [4.7, 8.8]), including parent outlier was 13.3 pg/mL (95% CI: [5.3, 25.8]); Mdiff 95% CIs with all other groups included 0, including and excluding the outlier.
Additional sensitivity analyses
We repeated the primary analyses using Welch’s t-test, and we also computed Levene’s test of homogeneity of variances to directly investigate the presence of unequal variances. Finally, we re-estimated the GLMs using a robust sandwich estimator, which allowed for the inclusion of the age term in the model. These results are shown in Supplementary Table 2. Levene’s test suggested statistically significant heterogeneity of variance across the TRS vs control, sibling vs control, and parent vs control comparisons. Both Student’s and Welch’s t-tests, however, resulted in the same decision regarding the null hypothesis (all p > 0.05). Estimation of the group term using the robust estimator also produced non-significant results. The parent vs control comparison produced statistically significant results for both Student’s and Welch’s t-tests; however, this did not survive the GLM once age was included as a covariate. A similar pattern was observed for the NON-CLOZ vs TRS comparison: Welch’s t-test was marginally significant, but this difference did not survive adjustment for age in the GLM.
Finally, following Bavato et al. (2021), we computed z scores from age-adjusted percentiles in the control group using GAMLSS, implemented in R. We then used single sample t-tests to test the hypothesis that the mean z score was 0 (i.e. equal to the mean of the control group). These results were not statistically significant for the TRS (M = −0.31, SD = 2.00, p = 0.17), NON-CLOZ (M = −0.49, SD = 1.08, p = 0.13) and sibling (M = −0.04, SD = 1.65, p = 0.91) groups. There was evidence for elevated NfL levels in the parent group (M = 0.89, SD = 0.96, p = 0.003), which once again was most probably driven by the expected younger age in the control group (range = 22–62) compared to the parent group (range = 54–77).
Taken together, these sensitivity analyses suggested that heterogeneity of variances did not explain the lack of statistically significant group differences.
Associations between NfL and demographic and illness variables in TRS
Spearman correlations were performed to explore associations between NfL levels and the demographic and illness variables listed in Table 1, in the TRS group.
As expected, the strongest correlation was seen between NfL levels and age at sample (Spearman’s r = 0.683, 95% CI: [0.546, 0.785]). An association was seen between duration of illness and NfL levels (Spearman’s r = 0.467, 95% CI: [0.267, 0.629]). However, as expected, longer durations of illness were strongly associated with being older (Spearman’s r = 0.774, 95% CI: [0.664, 0.849]). There was some collinearity between age at sample and duration of illness (tolerance = 0.401, variance inflation factor [VIF] = 2.496), but these were just within acceptable limits. A regression model for NfL, age at sample and duration of illness (R2 = 0.585, adjusted R2 = 0.325, F change = 19.513, p < 0.001) demonstrated that age was a significant predictor (coefficient = 0.266, 95% CI: [0.143, 0.388], p < 0.001), but duration of illness was not (coefficient = −0.034, 95% CI: [−0.172, 0.105], p = 0.632). This appears to show that age was driving the model, but not duration of illness. Despite these findings, it is difficult to disentangle the causal effects of duration of illness entirely. Weak correlations were seen with clozapine levels (n = 80, Spearman’s r = 0.258, 95% CI: [0.034, 0.457]) and dyslipidaemia (Spearman’s r = 0.280, 95% CI: [0.064, 0.470]). In addition, we identified a negative correlation between NfL and weight in the TRS group (Spearman’s r = −0.305, 95% CI: [−0.504, −0.076]). A slightly weaker correlation was seen between NfL and body mass index (BMI; Spearman’s r = −0.264, 95% CI: [−0.48, −0.019]), but not with height. Further information can be found in the Supplementary Table 3 and Supplementary Figures 1–5. In order to determine the influence of these variables on the overall results for the primary aim, post hoc comparisons of NfL levels between TRS and other groups, adjusting for age, and in addition weight, BMI, dyslipidaemia, duration of illness and clozapine levels, were performed. Including these additional covariates did not change the overall results described in the previous section.
Discussion
While neurofilament light has been explored in a broad range of neurological and neurodegenerative disorders, few studies have examined NfL levels in primary psychiatric disorders. This study explored plasma NfL levels in the largest group, to date, of well-characterised patients on clozapine with TRS. In addition, this was the first study to explore NfL in siblings of people with TRS, who constitute a schizophrenia at-risk cohort. We did not find increased NfL levels in TRS, a cohort that represents severe disease, with long duration of illness and significant residual positive, negative and significant cognitive symptoms. Our result was likely not due to an underpowered study.
Our previous studies compared CSF NfL levels in a smaller group of schizophrenia spectrum disorders and other primary psychiatric disorders, to neurological and neurodegenerative disorders. We found no statistically significant differences between different primary psychiatric disorders and controls, but lower levels in primary psychiatric disorders compared with neurological and neurodegenerative disorders (Eratne et al., 2020a, 2020b). Several studies have included or explored NfL levels in patients with schizophrenia, many comparing them to neurodegenerative disorders such as frontotemporal dementia (Al Shweiki et al., 2019; Bavato et al., 2021; Katisko et al., 2020; Rodrigues-Amorim et al., 2020; Zerr et al., 2018). However, these studies had smaller numbers, less comprehensively characterised patients, mixed psychiatric cohorts rather than specifically exploring schizophrenia, and did not include many people with severe and TRS, and people on clozapine.
There are several possible reasons to explain why we did not find differences in NfL levels between this group of people with TRS and controls. First, although NfL exists in both axons and dendrites, it is much more abundant in axons. Our findings suggest that schizophrenia may not be associated with axonal injury or degeneration, even in a group of people with severe, chronic illness. Our findings are contradictory to the neuroimaging findings of white matter alterations in schizophrenia (Kelly et al., 2018). What these alterations represent histopathologically is not established but may be secondary to cortical (such as synaptic/dendritic) processes, or myelinative pathology without severe axonal pathology. Given such diffusion tensor imaging abnormalities generally show a relationship to NfL (Spotorno et al., 2020), our findings could add weight to the notion that the main pathological processes in schizophrenia, rather than axonal, are synaptic and/or dendritic (Forsyth and Lewis, 2017). This is also in agreement with studies showing synaptic loss in specific brain regions in schizophrenia (Blennow et al., 1996). Second, NfL levels may change dynamically in schizophrenia (e.g. there may be increased rate of change or elevated levels in NfL at the first episode/onset of illness, or with acute episodes, that then return to normal with treatment or a more chronic course of illness), not dissimilar to the dynamic changes seen in relapsing-remitting multiple sclerosis (Kuhle et al., 2019). Therefore, while our findings improve our understanding of neuroaxonal involvement in TRS, suggesting against the presence of accelerated neurodegeneration in chronic TRS on clozapine, further research is required to address the possibility of neuroaxonal involvement in other disease stages: in younger patients earlier in the disease course, at high risk for psychosis, with first-episode psychosis, pre- and post-treatment, and during acute episodes. It is also possible that NfL acts as a marker of treatment response to clozapine, again not dissimilar to being a marker of treatment response in multiple sclerosis (Kuhle et al., 2019), therefore studies investigating NfL in TRS pre- and post-clozapine, and in untreated psychosis, would be important. Our NON-CLOZ group was small, and of similar age and illness duration to the TRS group, thus limiting any interpretations that could be made from this group. Third, given that NfL levels reflect the severity, intensity and rapidity of progression of neuronal injury and degeneration, it may be that NfL levels are either not sensitive to a slower rate of neuronal degeneration in schizophrenia or that neuroimaging abnormalities may not relate primarily to axonal injury, of which NfL is primarily a marker. Fourth, there is significant heterogeneity in clinically diagnosed schizophrenia and TRS (Potkin et al., 2020), and likely differences in underlying genetic, environmental and other aetiological and pathophysiological mechanisms. Studies that focused on specific subgroups of patients with schizophrenia with neuroimaging abnormalities compared to those without, or with specific and clearly defined endophenotypes, may demonstrate differences in NfL levels. Fifth, while CSF and blood NfL levels have been shown to correlate strongly in a range of conditions (Khalil et al., 2018), this may not be the case in schizophrenia. We did not have access to CSF data in this population, but future studies should examine this issue. The TRS group had a relatively high proportion of head injuries and neurological disorder diagnoses, and ECT, reflective of the severity of their condition. While ECT has not been shown to elevate NfL levels (Besse et al., 2020), neurological diagnoses and a history of head trauma (especially recent) could have been expected to result in elevated NfL levels in the TRS group (Khalil et al., 2018), and thus a potential confounder. However, despite this, we did not find elevated NfL in TRS and we found no association between these factors and levels. Although we found some percentile distribution differences, limited interpretations can be made given the sample sizes, and sensitivity analyses taken together did not explain the lack of statistical differences between groups. Additional limitations of our study include the cross-sectional nature of the study, the lack of adequate information on a broader range of clinical variables (such as duration of clozapine treatment, treatment setting, number of episodes, treatment in the NON-CLOZ group, which would be important areas for future research) and the lack of serial NfL levels and follow-up clinical information, limiting interpretations on longitudinal trajectories of brain pathology and long-term outcomes.
Even though our study did not include patients with neurodegenerative disorders, our findings of similar NfL levels in TRS and age-matched controls fill an important gap in the literature and suggest that schizophrenia is not associated with the degree of axonal injury seen in neurodegenerative disorders such as Alzheimer disease and behavioural variant frontotemporal dementia, where significantly elevated levels are commonly observed (compared to controls and non-neurodegenerative disorders) (Al Shweiki et al., 2019; Bridel et al., 2019; Eratne et al., 2020a; Gaetani et al., 2019; Katisko et al., 2020; Khalil et al., 2018). Our results add further weight to the potential diagnostic and clinical utility of NfL for psychiatrists and other specialists in clinical practice, in differentiating people with established schizophrenia (even treatment-resistant or poor outcome), from progressive neurodegenerative disorders such as behavioural variant frontotemporal dementia, an often-challenging clinical distinction (Chan et al., 2014; Ducharme et al., 2020; Eratne et al., 2020a, 2020b).
Our exploratory, hypothesis-generating analyses identified some correlations that may warrant further investigation. The correlation observed between plasma NfL and clozapine levels was weak, and furthermore, there were no differences in NfL levels between the clozapine-treated TRS group and the non-clozapine-treated group (although the latter group was small). Whether this finding signifies some degree of neuronal injury related to clozapine, or a reflection of more severe illnesses that required higher doses of clozapine, requires further study. Our finding of an inverse relationship between weight and NfL levels has been observed in a few other studies (Barro et al., 2020; Manouchehrinia et al., 2020; Nilsson et al., 2019). Given findings of other non-neuronal factors that can influence plasma NfL levels, such as renal function (Akamine et al., 2020), weight may have to be considered and adjusted for, for precise modelling and interpretation NfL levels, and further research is required.
In conclusion, our study did not find evidence for differences in plasma NfL levels in a large, well-characterised cohort of people with TRS on clozapine, compared with unaffected siblings (an elevated risk group) and parents, controls and a group of people with non-clozapine-treated schizophrenia. Studies exploring NfL and neuroimaging correlates in TRS are underway, and further study is warranted in other stages of the illness, such as during the high-risk and prodrome period, first episode and during acute episodes.
Supplemental Material
sj-pdf-1-anp-10.1177_00048674211058684 – Supplemental material for Plasma neurofilament light chain protein is not increased in treatment-resistant schizophrenia and first-degree relatives
Supplemental material, sj-pdf-1-anp-10.1177_00048674211058684 for Plasma neurofilament light chain protein is not increased in treatment-resistant schizophrenia and first-degree relatives by Dhamidhu Eratne, Shorena Janelidze, Charles B Malpas, Samantha Loi, Mark Walterfang, Antonia Merritt, Ibrahima Diouf, Kaj Blennow, Henrik Zetterberg, Brandon Cilia, Cassandra Wannan, Chad Bousman, Ian Everall, Andrew Zalesky, Mahesh Jayaram, Naveen Thomas, Samuel F Berkovic, Oskar Hansson, Dennis Velakoulis, Christos Pantelis and Alexander Santillo in Australian & New Zealand Journal of Psychiatry
Footnotes
Acknowledgements
The authors acknowledge the financial support of the CRC for Mental Health. The Cooperative Research Centre (CRC) programme is an Australian Government Initiative. The authors wish to acknowledge the CRC Scientific Advisory Committee, in addition to the contributions of study participants, clinicians at recruitment services, staff at the Murdoch Children’s Research Institute, staff at the Australian Imaging, Biomarkers and Lifestyle Flagship Study of Aging, and research staff at the Melbourne Neuropsychiatry Centre, including coordinators Merritt, A., Phassouliotis, C., and research assistants, Burnside, A., Cross, H., Gale, S., and Tahtalian, S. Participants for this study were sourced, in part, through the Australian Schizophrenia Research Bank (ASRB), which is supported by the National Health and Medical Research Council of Australia (Enabling Grant N. 386500), the Pratt Foundation, Ramsay Health Care, the Viertel Charitable Foundation and the Schizophrenia Research Institute. We thank the Chief Investigators and ASRB Manager: Carr, V., Schall, U., Scott, R., Jablensky, A., Mowry, B., Michie, P., Catts, S., Henskens, F., Pantelis, C., Loughland, C. We acknowledge the help of Jason Bridge for ASRB database queries. The authors are grateful for assistance from Brett Trounson and Dr Christopher Fowler and the team at The Florey Oak St Biobank. Finally, the authors would like to thank all the participants and their families. The corresponding author had full access to all the data in the study and had final responsibility for the decision to submit for publication.
Collaborators:
Dr Qiao-Xin Li, National Dementia Diagnostics Laboratory, The Florey Institute, University of Melbourne; Dr Christiane Stehmann, Australian National CJD Registry, The Florey Institute, Melbourne; Ms Claire Cadwallader, Neuropsychiatry, Royal Melbourne Hospital; Melbourne; The Turner Institute for Brain and Mental Health, Monash University, Victoria 3800; Dr Christopher Fowler, The Florey Institute of Neuroscience and Mental Health, The University of Melbourne, Parkville, VIC; Parsa Ravanfar, Melbourne Neuropsychiatry Centre, Department of Psychiatry, The University of Melbourne and Melbourne Health, Carlton South, VIC, Australia; Dr Sarah Farrand, Royal Melbourne Hospital; Melbourne Neuropsychiatry Centre & Department of Psychiatry, University of Melbourne; Dr Michael Keem, Neuropsychiatry, Royal Melbourne Hospital; Dr Matthew Kang, Neuropsychiatry, Royal Melbourne Hospital; Department of Psychiatry, University of Melbourne; A/Prof Rosie Watson, Population Health and Immunity Division, The Walter and Eliza Hall Institute of Medical Research, Parkville, Australia; A/Prof Nawaf Yassi, Departments of Medicine and Neurology, Melbourne Brain Centre at the Royal Melbourne Hospital, University of Melbourne, Parkville, Australia; Population Health and Immunity Division, The Walter and Eliza Hall Institute of Medical Research, Parkville, Australia; Dr Cath Kaylor-Hughes, Integrated Mental Health Team; Dept of General Practice; University of Melbourne, 780 Elizabeth St, Melbourne, 3010; Prof. Richard Kanaan, Dept of Psychiatry, University of Melbourne, Austin Health, Heidelberg, VIC 3084; A/Prof Piero Perucca, Department of Medicine, Austin Health, The University of Melbourne; Comprehensive Epilepsy Program, Austin Health; Department of Neuroscience, Central Clinical School, Monash University; Department of Neurology, The Royal Melbourne Hospital; Department of Neurology, Alfred Health, Melbourne, VIC, Australia; Dr Lucy Vivash, The Department of Neuroscience, The Central Clinical School, The Alfred Hospital, Monash University; and The Departments of Medicine and Neurology, The Royal Melbourne Hospital, The University of Melbourne, Victoria, Australia; Ms Rashida Ali, Alfred Health; Monash University; Prof. Terence J. O’Brien, The Department of Neuroscience, The Central Clinical School, The Alfred Hospital, Monash University; and The Departments of Medicine and Neurology, The Royal Melbourne Hospital, The University of Melbourne, Victoria, Australia; Colin L Masters, National Dementia Diagnostics Laboratory, The Florey Institute, University of Melbourne; Professor Steven Collins, Australian National Creutzfeldt-Jakob Disease Registry, Florey Institute of Neuroscience and Mental Health and Department of Medicine, The University of Melbourne; Dr Wendy Kelso, Neuropsychiatry, Royal Melbourne Hospital; A/Prof Andrew Evans, Neuropsychiatry, Royal Melbourne Hospital; Professor Anna King, The Wicking Dementia Centre, Tasmania; Professor Patrick Kwan, Alfred Hospital; Monash University, Melbourne; Professor Jane Gunn, Department of General Practice, The University of Melbourne; Dr Ilias Goranitis, Health Economics Unit, Centre for Health Policy, Melbourne School of Population and Global Health, The University of Melbourne; Dr Tianxin Pan, Health Economics Unit, Centre for Health Policy, Melbourne School of Population and Global Health, The University of Melbourne; Ms Courtney Lewis, The University of Melbourne; Professor Tomas Kalincik, Clinical Outcomes Research Unit (CORe), Department of Medicine, Royal Melbourne Hospital, The University of Melbourne.
Declaration of Conflicting Interests
The author(s) declared the following potential conflicts of interest with respect to the research, authorship and/or publication of this article: K.B. has served as a consultant, at advisory boards or at data monitoring committees for Abcam, Axon, Biogen, JOMDD/Shimadzu. Julius Clinical, Lilly, MagQu, Novartis, Prothena, Roche Diagnostics and Siemens Healthineers, and is a co-founder of Brain Biomarker Solutions in Gothenburg AB (BBS), which is a part of the GU Ventures Incubator Program (outside the work presented in this paper). H.Z. has served at scientific advisory boards for Alector, Eisai, Denali, Roche Diagnostics, Wave, Samumed, Siemens Healthineers, Pinteon Therapeutics, Nervgen, AZTherapies and CogRx, has given lectures in symposia sponsored by Cellectricon, Fujirebio, Alzecure and Biogen, and is a co-founder of Brain Biomarker Solutions in Gothenburg AB (BBS), which is a part of the GU Ventures Incubator Program (outside submitted work). M.W. has served as a consultant, at advisory boards or at data monitoring committees for Actelion, Biomarin, Shire, Orphan, Vtesse and Orphazyme, and has received research funding from Eli-Lilly, Bristol Myers-Squibb and Pfizer. The remaining authors have nothing to disclose.
Funding
The author(s) disclosed receipt of the following financial support for the research, authorship and/or publication of this article: C.P. was supported by a National Health and Medical Research Council (NHMRC) Senior Principal Research Fellowship (1105825) and an NHMRC L3 Investigator Grant (1196508). Funding to A.S. was provided by Swedish federal government under the ALF agreement, Lund University, the Fredrik and Ingrid Thuring, Ellen and Henrik Sjöbring and the Fromma Foundation for medical research. H.Z. is a Wallenberg Scholar supported by grants from the Swedish Research Council (#2018-02532), the European Research Council (#681712), Swedish State Support for Clinical Research (#ALFGBG-720931), the Alzheimer Drug Discovery Foundation (ADDF), USA (#201809-2016862), the AD Strategic Fund and the Alzheimer’s Association (#ADSF-21-831376C, #ADSF-21-831381C and #ADSF-21-831377C), the Olav Thon Foundation, the Erling-Persson Family Foundation, Stiftelsen för Gamla Tjänarinnor, Hjärnfonden, Sweden (#FO2019-0228), the European Union’s Horizon 2020 research and innovation programme under the Marie Skłodowska-Curie grant agreement No 860197 (MIRIADE), and the UK Dementia Research Institute at UCL. This Study was also supported by: MACH MRFF RART 2.2, and Psychiatry and Rehabilitation Division, Region Skåne, Sweden. The role of these funding sources was to support research study staff and biosample analyses.
Statistical Analysis
Statistical analysis conducted by Dr Dhamidhu Eratne, Neuropsychiatry, Royal Melbourne Hospital, with assistance from Dr Charles Malpas, Dr Ibrahima Diouf and Dr Cassandra Wannan.
Supplemental Material
Supplemental material for this article is available online.
References
Supplementary Material
Please find the following supplemental material available below.
For Open Access articles published under a Creative Commons License, all supplemental material carries the same license as the article it is associated with.
For non-Open Access articles published, all supplemental material carries a non-exclusive license, and permission requests for re-use of supplemental material or any part of supplemental material shall be sent directly to the copyright owner as specified in the copyright notice associated with the article.