
Abstract
Objective:
Neurofilament light has shown promise as a biomarker for diagnosis, staging and prognosis in a wide range of neurological and neurodegenerative disorders. This study explored the utility of cerebrospinal fluid neurofilament light in distinguishing primary psychiatric disorders from neurodegenerative and neurological disorders, a common diagnostic dilemma for psychiatrists and neurologists.
Methods:
This cross-sectional retrospective pilot study assessed cerebrospinal fluid neurofilament light on patients referred to a tertiary neuropsychiatry service from 2009 to 2017 for diagnostic assessment of neuropsychiatric and neurocognitive symptoms, where a neurodegenerative disorder was a differential diagnosis, who received lumbar punctures as part of a comprehensive workup. The most recent gold-standard clinical consensus diagnosis was categorised into psychiatric disorder or neurodegenerative or neurological disorder. Data from healthy controls were available for comparison. Data extraction and diagnostic categorisation was blinded to neurofilament light results.
Results:
A total of 129 participants were included: 77 neurodegenerative or neurological disorder (mean age 57 years, including Alzheimer’s dementia, frontotemporal dementia), 31 psychiatric disorder (mean age 51 years, including schizophrenia, major depressive disorder) and 21 healthy controls (mean age 66 years). Neurofilament light was significantly higher in neurodegenerative or neurological disorder (M = 3560 pg/mL, 95% confidence intervals = [2918, 4601]) compared to psychiatric disorder (M = 949 pg/mL, 95% confidence intervals = [830, 1108]) and controls (M = 1036 pg/mL, 95% confidence intervals = [908, 1165]). Neurofilament light distinguished neurodegenerative or neurological disorder from psychiatric disorder with an area under the curve of 0.94 (95% confidence intervals = [0.89, 0.98]); a cut-off of 1332 pg/mL was associated with 87% sensitivity and 90% specificity.
Conclusion:
Cerebrospinal fluid neurofilament light shows promise as a diagnostic test to assist with the often challenging diagnostic dilemma of distinguishing psychiatric disorders from neurodegenerative and neurological disorders. Further studies are warranted to replicate and expand on these findings, including on plasma neurofilament light.
Keywords
Introduction
Identifying the underlying aetiology of neuropsychiatric symptoms in middle-aged patients is a common diagnostic dilemma for psychiatrists, neurologists and geriatricians. Cognitive symptoms are often present in psychiatric disorders such as schizophrenia, major depressive disorder and bipolar disorder, while psychiatric symptoms are frequently present in neurodegenerative and neurological disorders.For example, common diagnostic challenges include distinguishing Alzheimer’s disease from the ‘pseudodementia’ associated with major depression, and behavioural variant frontotemporal dementia (bvFTD) from schizophrenia, bipolar disorder or depression (Chan et al., 2014; Galimberti et al., 2015; Velakoulis et al., 2009; Woolley et al., 2011). Early-onset, or younger-onset dementia (defined as age at onset less than 65 years) in particular, can have broader, less ‘typical’ presenting features and can be more likely to present with psychiatric features, compared to ‘typical’, late-onset or older-onset (age at onset greater than 65 years) presentations, contributing to higher rates of misdiagnosis and diagnostic delays of over 3 years (Draper et al., 2016; Rossor et al., 2010). The risk of diagnostic overshadowing is particularly high in patients presenting with psychiatric symptoms, or with premorbid psychiatric disorders (Woolley et al., 2011). Misdiagnosis and delays can have significant consequences for patients and families with regard to treatment and management, access to services and future planning, stress and carer burden associated with diagnostic uncertainty, and more pronounced impacts in the younger population (work and insurance, dependent children, family planning, genetic counselling) (Sansoni et al., 2016). The ‘diagnostic odyssey’ can include conflicting clinical opinions, and repeated, costly, invasive assessments and investigations, with negative impacts on the healthcare system. Such delays may occur despite access to current gold-standard quality medical care, including serial clinical, cognitive, neuroradiological and cerebrospinal fluid (CSF) assessments. Therefore, despite even the best available, costly and repeated multidisciplinary and multimodal diagnostic and assessment tools and investigations, these diagnostic dilemmas are often difficult to confidently resolve. While recognising the limitations and somewhat arbitrary nature of categorising disorders as ‘psychiatric’ versus ‘neurological’, there is clinical utility in differentiating between these broad categories of neuropsychiatric disorders, given the important, significant differences in treatment and management, prognosis and progression, and in the role of genetic counselling. Thus, there remains a great need for biomarkers to help distinguish neurodegenerative from psychiatric disorders, allow for more precise and judicious use of resources, improve diagnostic accuracy, reduce diagnostic delay and improve outcomes for patients and families with psychiatric, neurodegenerative and neurological disorders.
Neurofilament light (NfL) is an important component of the neuronal cytoskeleton, typically found in large-calibre, myelinated axons. It is crucial for axonal structure, transport and growth and may have broader functions in neuropsychiatric disorders (Yuan and Nixon, 2016). In general, neuronal injury or insult can result in NfL being released into CSF, with smaller amounts crossing the blood–brain barrier, and NfL levels can be measured in CSF and blood. There has thus been a great deal of interest in its use as a biomarker in neurodegenerative and neurological conditions as a marker of neuronal damage (Khalil et al., 2018), and proposals to include it in biomarker guided diagnosis, in Alzheimer’s disease for example (Jack et al., 2018). Numerous studies have demonstrated utility of NfL in CSF and blood as a marker for diagnosis and/or severity and prognosis, in Alzheimer’s disease, frontotemporal dementia, amyotrophic lateral sclerosis, Huntington’s disease, encephalitis and other neurodegenerative and neurological diseases, with levels often elevated prior to the onset of clinical symptoms (Byrne et al., 2017; Gaiani et al., 2017; Mattsson et al., 2017; Preische et al., 2019; Rohrer et al., 2016; Scherling et al., 2014; Skillback et al., 2014; Weston et al., 2017; Zetterberg et al., 2015). In fact, neurofilament has been likened to a C-reactive protein for many disorders, as a marker of diagnosis, severity, prognosis and even treatment response, in many disorders, for example and in particular, multiple sclerosis. (Barro et al., 2018; Giovannoni, 2018)
A smaller number of studies have investigated NfL in patient cohorts that included primary psychiatric disorders. Jakobsson and Isgren and colleagues found elevated CSF NfL in younger patients with bipolar disorder (133 patients, median age 35 years), compared to healthy controls (Isgren et al., 2017; Jakobsson et al., 2014). Vijverberg et al. (2007) found higher CSF NfL in probable/definite bvFTD (22 patients, mean age 62.9 years) compared to patients with psychiatric illness (25 patients, none with primary psychotic illness, mean age 60.6 years), with an area under the curve (AUC) of 0.93. Abu-Rumeileh et al. (2018) explored CSF NfL in atypical/rapidly progressive neurodegenerative dementias. Their control group included patients with ‘minor psychiatric disorders’ that lacked clinical and neuroradiological evidence of central nervous system disease. More detailed information was not available (e.g. numbers of psychiatric patients, types of psychiatric disorders. age, sex, cognitive symptoms). Similarly, Zerr et al. (2018) included patients with psychiatric illness in a ‘non-primarily neurodegenerative neurological and psychiatric disease’ group (mean age 67 years) when investigating the diagnostic accuracy of CSF NfL in the differential diagnosis of prion disease. Their training cohort included patients with psychotic and bipolar disorders and their validation cohort included depression, but similar to the previously described study, more detailed demographic and clinical information was not available. Gudmundsson and colleagues investigated CSF biomarkers in 78 elderly women (mean age 73.9 years) without dementia for at least 10 years after CSF collection, 11 of whom had major depressive disorder (MDD). In this study, women with MDD had higher CSF NfL levels than women without MDD, and one hypothesis was that this may have indicated neuropathological and vascular aetiopathological events (Gudmundsson et al., 2010).
To our knowledge, no studies have directly compared CSF NfL concentrations in patients with a broad range of primary psychiatric disorders to a broad range of neurodegenerative and neurological diseases, in a younger population (in particular, with a focus on younger-onset dementia, onset less than 65 years of age) where distinguishing primary psychiatric disorders from neurodegenerative or neurological disorders can be more challenging, and the risk of misdiagnosis higher (Draper et al., 2016; Rossor et al., 2010).
Our primary aim was to explore the utility of CSF NfL in differentiating psychiatric disorders from neurodegenerative and neurological disorders, with a focus on younger patients. We hypothesised that CSF NfL levels would be significantly elevated in patients with neurodegenerative and neurological disorders compared to patients with psychiatric disorders. We hypothesised that CSF NfL levels in psychiatric disorders with younger onset would be within normal limits, with regard to the cut-off criteria recommended by the NfL ELISA (enzyme-linked immunosorbent assay) testing kit. Our secondary aims were to explore CSF NfL levels in different diagnostic neurological and psychiatric subgroups and to compare the diagnostic utility of CSF NfL to other CSF biomarkers.
Methods
This was a cross-sectional retrospective study. Patients were recruited from the Neuropsychiatry Unit (NPU), Royal Melbourne Hospital, Australia. The NPU is a state-wide tertiary referral centre offering inpatient and outpatient diagnostic, assessment and management services for patients with complex cognitive, neurological and psychiatric symptoms, in particular younger-onset dementia. Patients receive detailed comprehensive multidisciplinary assessments by a neuropsychiatrist, neurologist, clinical neuropsychologist, neuroradiologist, occupational therapist, social worker, speech therapist and nursing staff. The Neuropsychiatry Unit Cognitive Assessment Tool (NUCOG) is the most commonly used cognitive screening assessment (Walterfang et al., 2006). Patients receive comprehensive clinical investigation (e.g. magnetic resonance imaging [MRI], single photon emission computed tomography [SPECT] and fluorodeoxyglucose positron emission tomography [FDG-PET] brain imaging, CSF analysis and routine and extended blood and urine biochemical testing) with a gold-standard consensus diagnosis reached by the multidisciplinary team, informed by established diagnostic criteria and results of investigations.
Patients were included in the current study if they were referred to the NPU for diagnostic assessment and management, received a lumbar puncture and CSF was available for the study period, March 2009 to September 2017. Patients were excluded if there was insufficient residual sample for NfL analysis or if there were pre-analytical issues that could potentially impact NfL concentration (e.g. collection in a polystyrene tube rather than a polypropylene tube).
Patients’ medical records were accessed, and data extracted included primary gold-standard consensus diagnosis informed by established diagnostic criteria (made within several weeks of CSF sampling), most recent diagnosis where follow-up was available, age, sex, medical and psychiatric comorbidities, investigation results and bedside NUCOG cognitive assessment.
The most recent consensus diagnosis was grouped into one of the following categories: psychiatric disorder (PSY) or neurodegenerative or neurological disorder (NND). PSY included primary psychiatric diagnoses as defined by the American Psychiatric Association’s (2013) Diagnostic and Statistical Manual of Mental Disorders (4th Edition; Text Revision [DSM-IV-TR] and 5th Edition [DSM-5]). Although dementia/major neurocognitive disorders are also defined in DSM-IV-TR and DSM-5, major neurocognitive disorders due to an underlying neurodegenerative or neurological disease were included in the NND group for this study. Data extraction and diagnostic grouping was blinded to NfL results.
In addition to routine biochemical and cytological testing, since March 2009, as clinically indicated, CSF was analysed for amyloid beta (Aβ42), total tau (T-tau) and phosphorylated tau (P-tau), at the National Dementia Diagnostic Laboratory (NDDL), Florey Institute of Neuroscience and Mental Health, Melbourne, as described previously in detail by Li et al. (2015). Briefly, all samples were analysed in duplicate using INNOTEST ELISA immune-affinity capture and detection (Fujirebio, Ghent, Belgium) according to the manufacturer’s instructions (Li et al., 2015). Residual samples were stored at −80°C. CSF NfL concentrations were measured in duplicate using a commercial ELISA (NF-light; UmanDiagnostics, Umea, Sweden), according to the manufacturer’s protocol. An internal control of pooled CSF was included in each plate. The mean intra-assay coefficient of variation was 2.4%, and the inter-assay coefficient of variation was 12.2%.
Control data were accessed from the Australian Imaging, Biomarker & Lifestyle (AIBL) study of ageing. This study has been previously described by Ellis et al. (2009), but briefly, AIBL participants received a number of assessments, including clinical and neuropsychological assessment, amyloid PET imaging, CSF Aβ42, T-tau and P-tau. Exclusion criteria for healthy controls in AIBL included a history of schizophrenia, schizoaffective disorder or bipolar disorder, serious head injury and excessive alcohol use. Cases were selected from AIBL based on the following criteria: younger cases (age less than 70, as there were only six cases <65), classification as healthy control based on formal neuropsychology assessment, no diagnosis of neurological disorder or active psychiatric disorder at the time of CSF sampling and no recent diagnosis (within 18 months of CSF sampling) of neurological disorder, stroke, transient ischaemic attack, traumatic brain injury or psychiatric disorder as well as negative amyloid PET assessment and normal CSF Aβ42, T-tau and P-tau levels. CSF NfL concentrations were quantified in a separate laboratory in Perth using the same commercial ELISA employing the same standards (NF-light; UmanDiagnostics), according to the manufacturer’s protocol.
Ethics approval and consent for this project were obtained through the Melbourne Health Research and Ethics Committee (HREC 2016.038). Since 2016, informed consent was obtained from patients (or family members, where patients lacked capacity to provide consent). Ethics approval was obtained for retrospective biomarker analysis of samples collected prior 2016 when this project commenced.
Statistical analysis
All statistical analyses were performed using R software. Generalised linear models (GLMs) were estimated to examine the relationships between NfL and clinical variables. Age at CSF and sex were included as covariates where appropriate. Receiver operator characteristic (ROC) curves were computed to determine the AUCs, sensitivity and specificity of NfL and other biomarkers in distinguishing PSY from NND. The optimal cut-off was determined using Youden’s method, which maximises the sum of the sensitivity and specificity derived from the ROC curve. The difference between AUCs was determined by simple subtraction, with positive values favouring NfL. A number of variables displayed non-Gaussian distributions. As such, robust inference methods were used for all analyses. Bias-corrected and accelerated (BCa) confidence intervals (CIs) were computed for all GLM and ROC parameters via nonparametric bootstrapping. Two thousand replicates were used and were stratified by diagnostic group. Statistical significance was defined as any CI not capturing the null-hypothesis value (at the 95% level). These robust statistical methods were selected because they mitigate the effects of distributional violations, including the presence of outliers.
Results
Sample characteristics
A total of 121 samples of CSF were available from March 2009 to September 2017. Ten samples were excluded due to insufficient CSF to perform NfL analysis. One sample was excluded due to collection in an incorrect tube (polystyrene, rather than a polypropylene tube). Two patients had two CSF samples. For each of these patients, the two CSF samples were within 12 months of each other and had similar CSF biomarker profiles (including NfL). For the purpose of this study, the most recent sample and diagnosis were included. The final study number was 108 CSF samples from 108 individual patients.
Demographics and clinical variables are shown Table 1. The mean age of the cohort was 55.4 years (range: 25–77 years) and 40 were female (37%). Participants in the NND group were slightly older than the PSY group (Mdiff = 6, 95% CIs = [2, 10]). Seventeen patients were unable to complete bedside cognitive assessment. The mean NUCOG score was 75 (95% CIs = [67, 80]) in the PSY group and 68 (95% CIs = [63, 72]) in the NND group. This difference was not statistically significant (Mdiff = 7, 95% CIs = [−1, 15]).
Demographics for the study population.
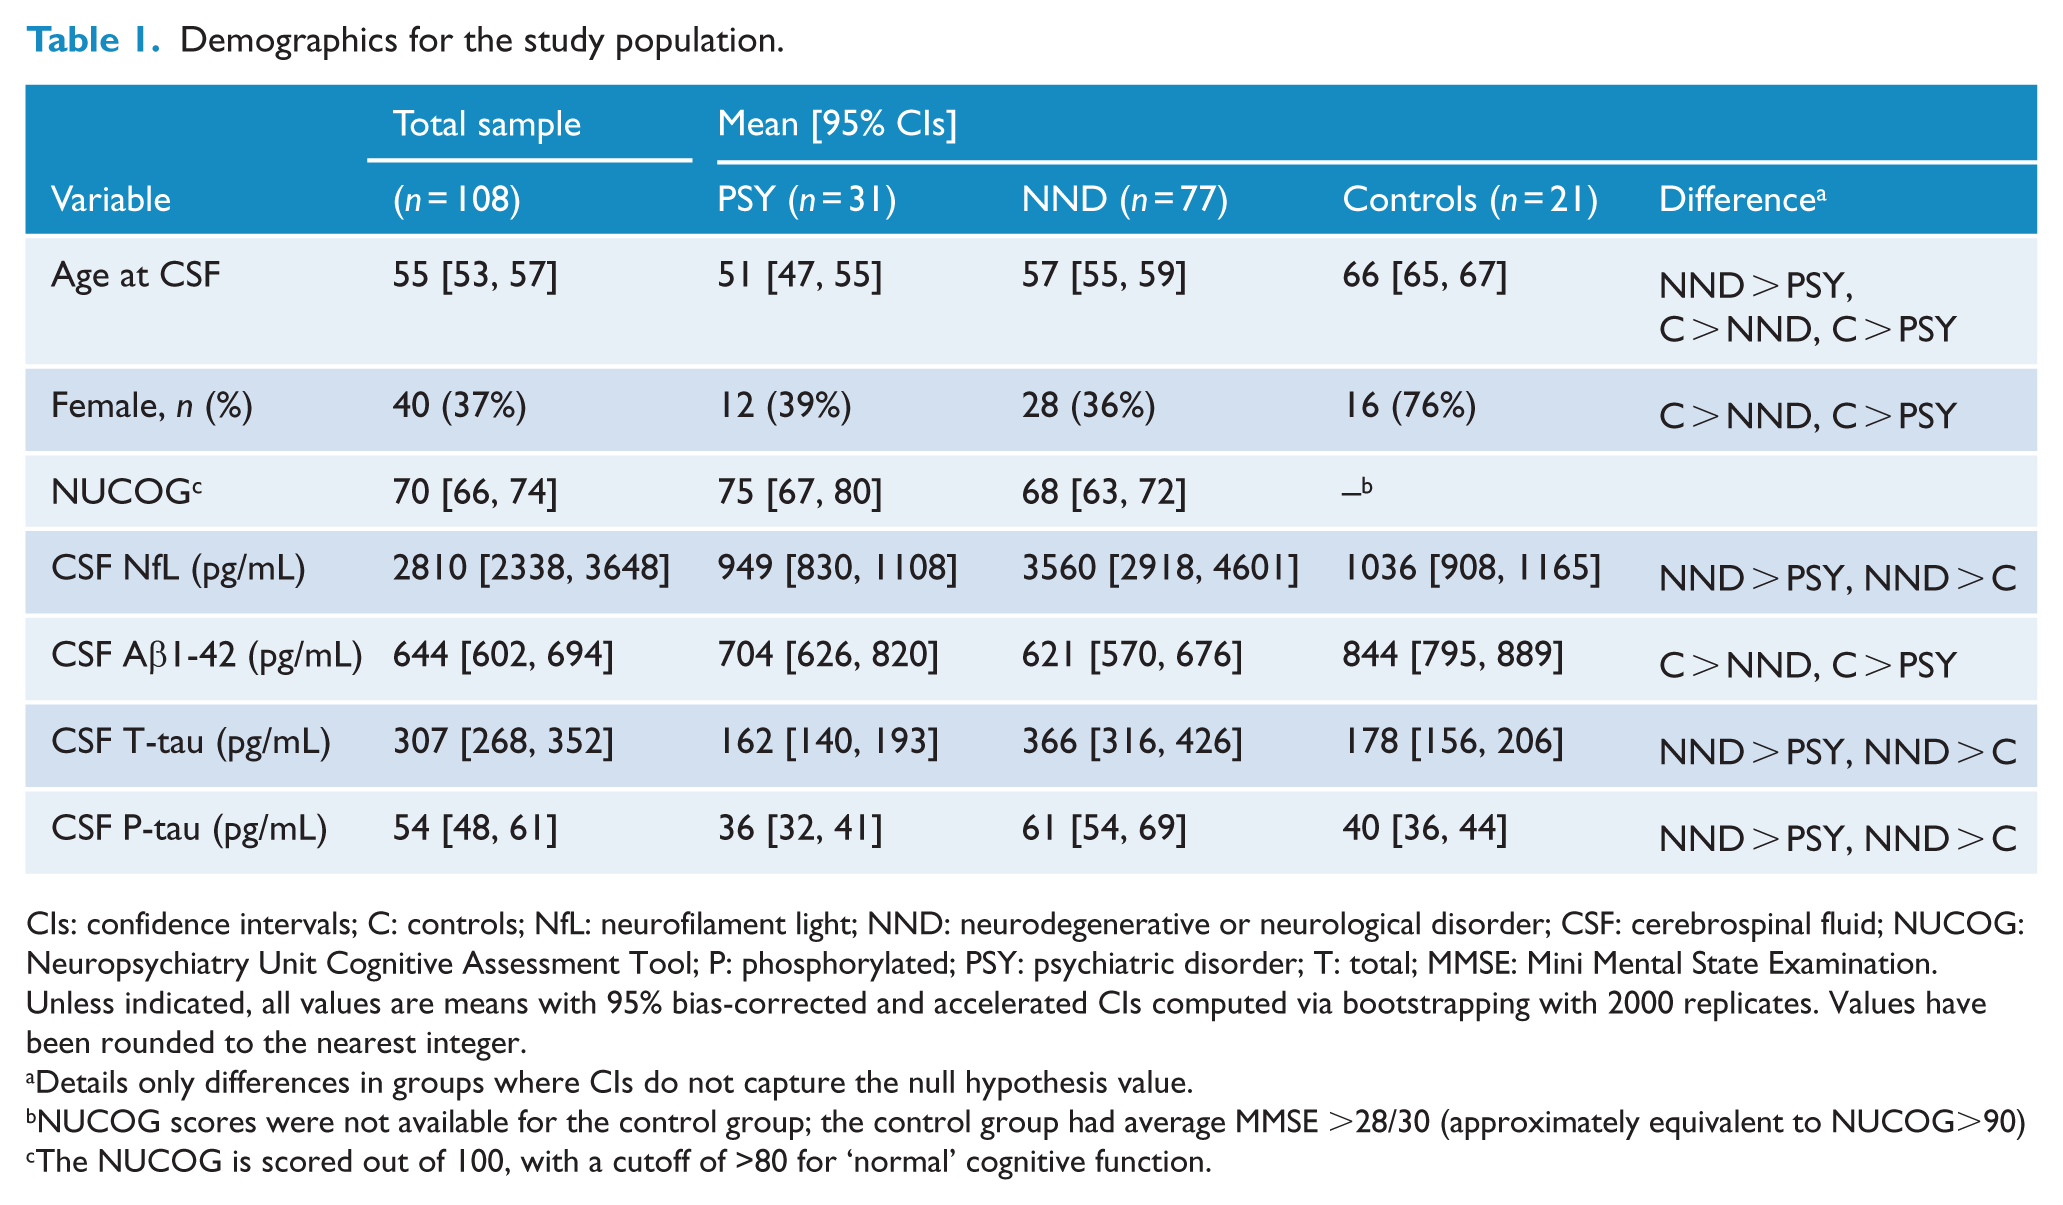
CIs: confidence intervals; C: controls; NfL: neurofilament light; NND: neurodegenerative or neurological disorder; CSF: cerebrospinal fluid; NUCOG: Neuropsychiatry Unit Cognitive Assessment Tool; P: phosphorylated; PSY: psychiatric disorder; T: total; MMSE: Mini Mental State Examination.
Unless indicated, all values are means with 95% bias-corrected and accelerated CIs computed via bootstrapping with 2000 replicates. Values have been rounded to the nearest integer.
Details only differences in groups where CIs do not capture the null hypothesis value.
NUCOG scores were not available for the control group; the control group had average MMSE >28/30 (approximately equivalent to NUCOG>90)
The NUCOG is scored out of 100, with a cutoff of >80 for ‘normal’ cognitive function.
Thirty-one patients, mean age 51 years, were diagnosed with a primary psychiatric disorder. Including major depressive disorder (n = 9), schizophrenia spectrum disorder (n = 9 eight with schizophrenia, one with schizoaffective disorder), bipolar disorder (n = 3), conversion disorder (n = 3), somatic symptom disorder (n = 3), adjustment disorder (n = 2), anxiety disorder (n = 1) and dissociative disorder (n = 1).
Seventy-seven patients, mean age 57.2 years, were diagnosed with neurodegenerative or neurological disorder. Including Alzheimer’s disease (n = 32), bvFTD (n = 16), vascular dementia (n = 3), dementia with Lewy bodies (n = 2), Parkinson’s disease dementia (n = 2), dementia not otherwise specified (where evidence of a progressive, neurodegenerative process was clinically evident, however, there was insufficient certainty with regard to a specific subtype, n = 11), corticobasal syndrome (n = 4), multiple system atrophy (n = 2), primary progressive aphasia (n = 2), progressive supranuclear palsy (n = 1), central nervous system vasculitis (n = 1) and multiple sclerosis (n = 1).
Twenty-one cases were selected for inclusion as healthy controls from the AIBL cohort, mean age 66.1 years (range: 61–69 years). As shown in Table 1, the healthy control group was older than both PSY and NND groups and had a higher proportion of females (76%).
NfL concentrations in PSY, NND and control groups
NfL concentrations were significantly lower in both PSY (M = 949 pg/mL, 95% CIs = [836, 1106]) and controls (M = 1036, 95% CIs = [930, 1158]) compared to NND (M = 3560 pg/mL, 95% CIs = [2864, 4509]), with adjustments made as described for differences in age and sex between the groups. The difference between NND and controls was large (b = 2109, 95% CIs = [1377, 3284]), as was the difference between NND and PSY (b = 2686, 95% CIs = [1885, 4087]). NfL concentrations were not significantly different between PSY and controls (b = 577, 95% CIs = [−637, 1901]). The spread of NfL levels in PSY was much narrower than those in NND, and no patients in PSY had an NfL level greater than 2000 pg/mL. Figure 1 demonstrates distribution of NfL concentrations in the groups.
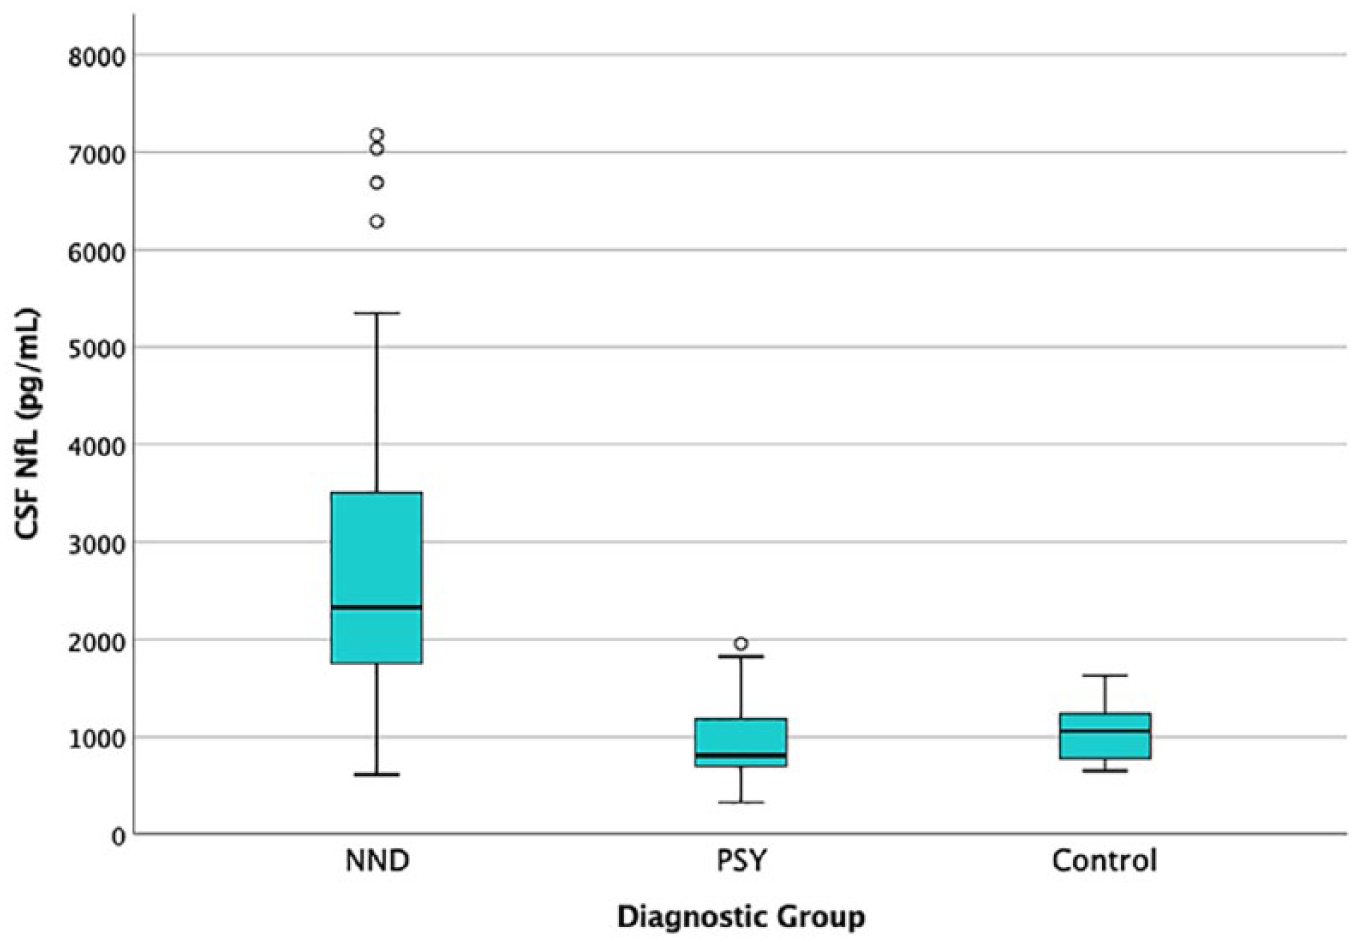
Box Plot of CSF NfL in PSY, NND and controls. Note that to improve readability, six levels >8000 pg/mL were not included in this plot. All of these levels were in the NND category; levels in pg/mL: 12,244; 12,824; 12,936; 13,442; 16,475; and 20,659.
NfL concentrations in younger-onset patients (age at onset less than 65 years)
Ninety-six patients had a younger-onset (using the standard definition for dementias: age at onset of symptoms less than 65): 29 patients with psychiatric disorders and 67 with neurodegenerative or neurological disorders. Demograph-ics and clinical variables for the younger-onset groups are shown Table 2. The mean age at CSF of the younger-onset cohort was 54 years (95% CI = [52, 55]) and 36 were female (38%). Participants in the younger-onset NND (YONND) group were slightly older than in the younger-onset PSY (YOPSY) group (Mdiff = 6, 95% CIs = [2, 10]). The mean score on the NUCOG was 68 (95% CIs = [67, 81]) in YONND and 75 (95% CIs = [68, 81]) in YOPSY group; this difference was not statistically significant (Mdiff = 7, 95% CIs = [−1, 15]).
Demographics for the younger-onset study population.
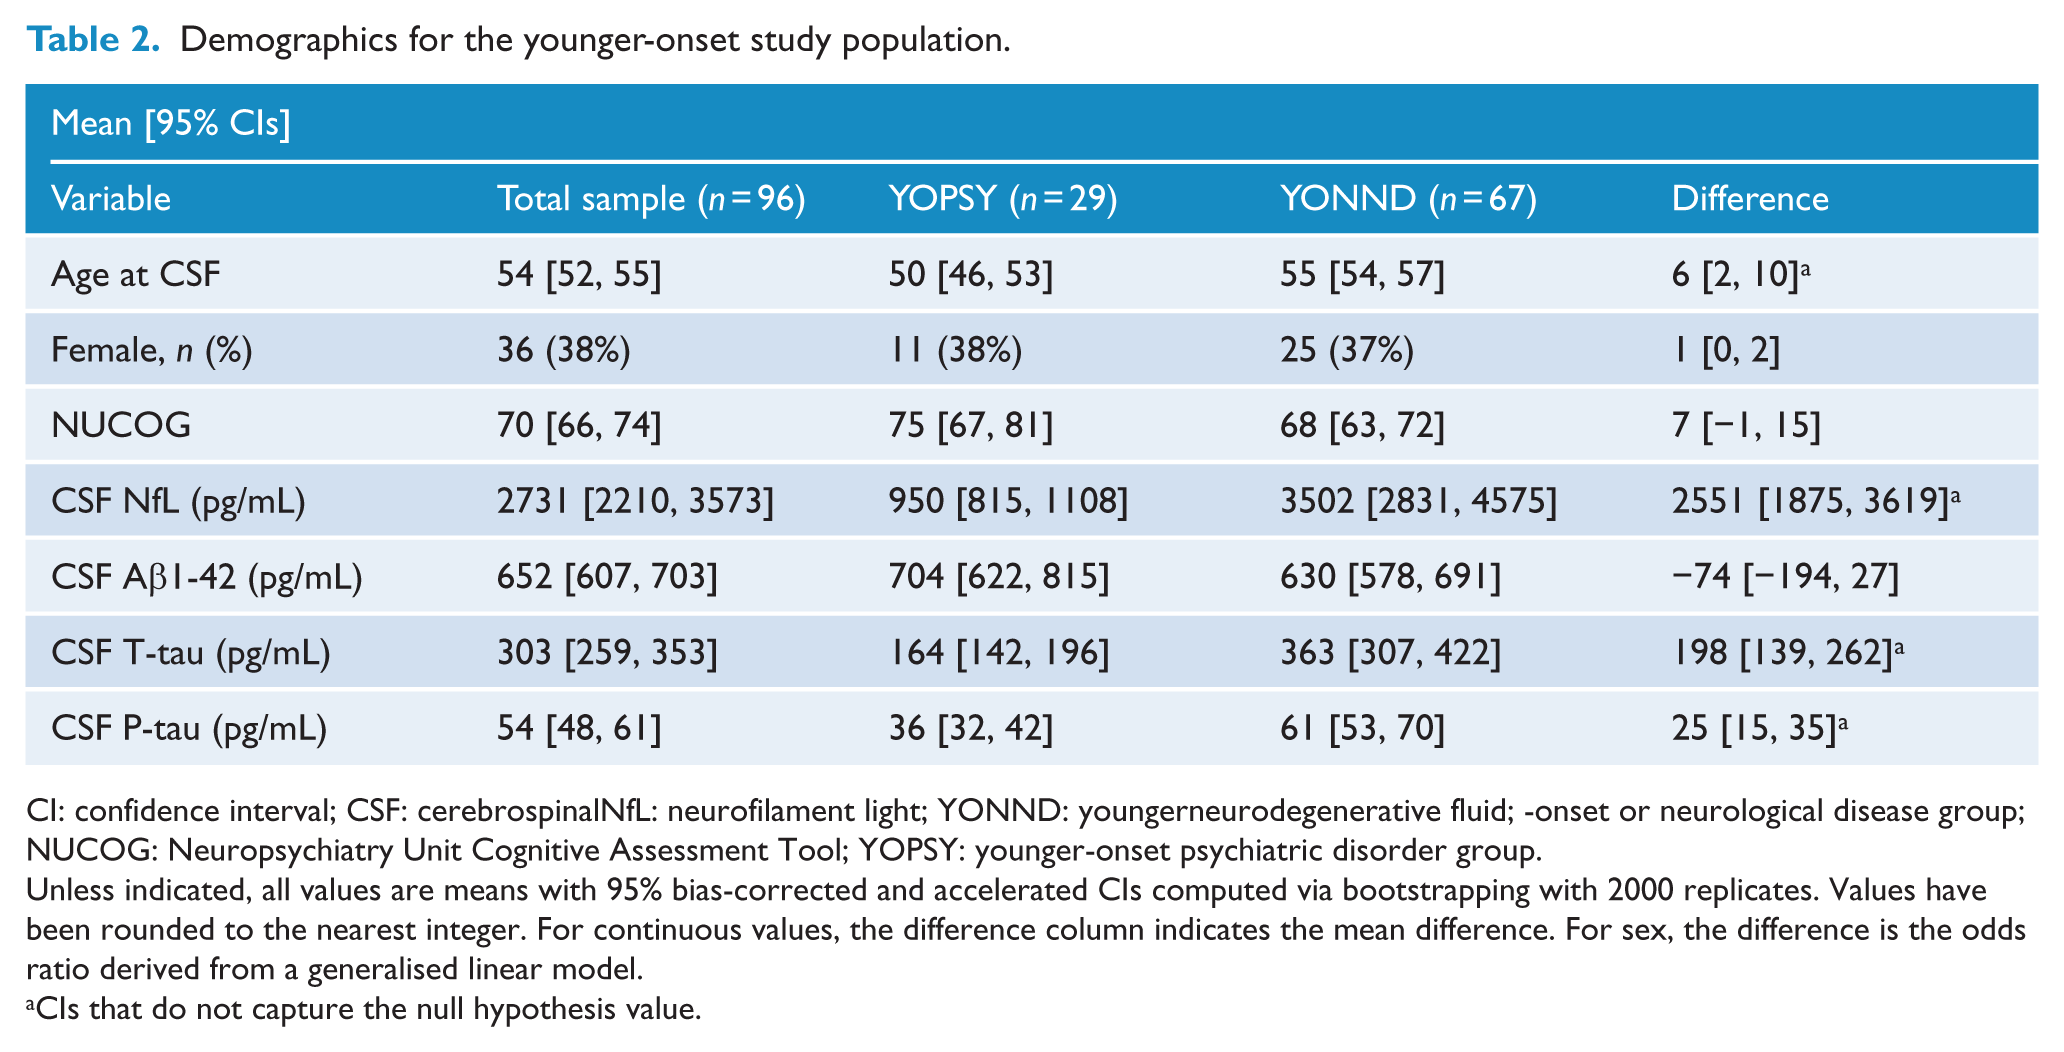
CI: confidence interval; CSF: cerebrospinalNfL: neurofilament light; YONND: youngerneurodegenerative fluid; -onset or neurological disease group; NUCOG: Neuropsychiatry Unit Cognitive Assessment Tool; YOPSY: younger-onset psychiatric disorder group.
Unless indicated, all values are means with 95% bias-corrected and accelerated CIs computed via bootstrapping with 2000 replicates. Values have been rounded to the nearest integer. For continuous values, the difference column indicates the mean difference. For sex, the difference is the odds ratio derived from a generalised linear model.
CIs that do not capture the null hypothesis value.
Figure 2 demonstrates the distribution of NfL concentrations in the younger-onset patients. Similar differences were found between the younger-onset groups. NfL concentrations were significantly lower in YOPSY (M = 950 pg/mL, 95% CIs = [820, 1114]) compared to YONND (M = 3502 pg/mL, 95% CIs = [2870, 4645]). This difference was large (b = 2740, 95% CIs = [1867, 4213]). NfL concentrations were not significantly different between YOPSY and controls (b = 833, 95% CIs = [−289, 2591]), but were significantly lower in controls compared to YONND (b = 1906, 95% CIs = [1038, 2847]).
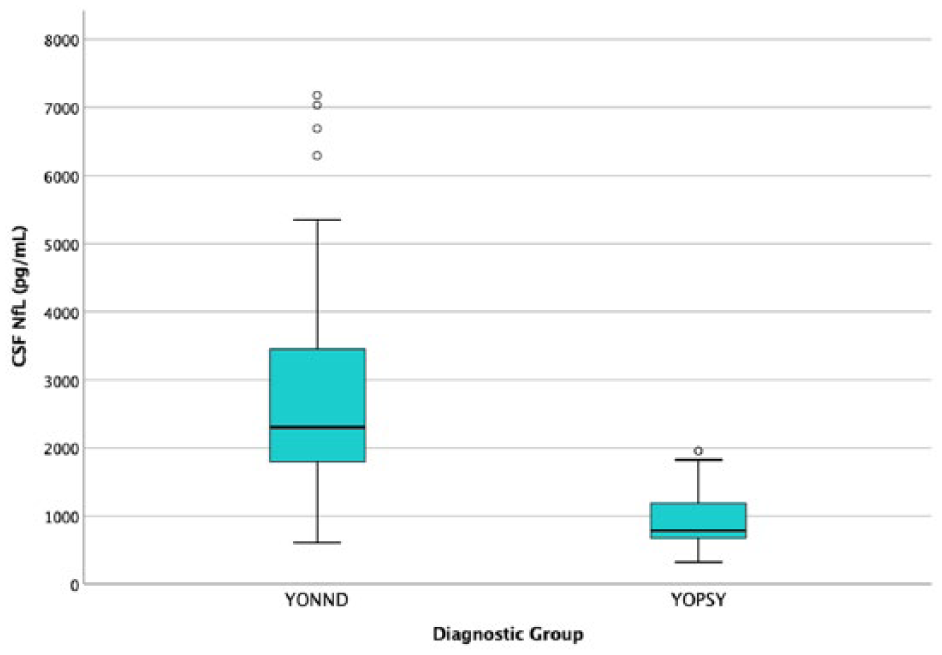
CSF NfL in the younger-onset population. Note that to improve readability, five levels >8000 pg/mL were not included in this plot. All of these levels were in the NND category; levels in pg/mL: 12,244; 12,824; 12,936; 13,442; and 20,659.
NfL concentrations in different diagnoses
Figure 3 compares NfL concentrations across all diagnoses within the PSY and NND groups. Robust linear models revealed that NfL concentrations were significantly greater in AD, bvFTD and dementia not otherwise specified, when compared to the PSY group. With regard to diagnostic subgroups with fewer than 10 patients, corticobasal syndrome, multiple system atrophy, and primary progressive aphasia also had higher concentrations compared to PSY. Age, sex, and age at onset were not statistically significant predictors. There were no statistically significant differences between diagnoses within the PSY group, nor were there significant differences between diagnoses within the NND group, but given the relatively small numbers of patients with each individual diagnosis, these comparisons need to be interpreted with caution.
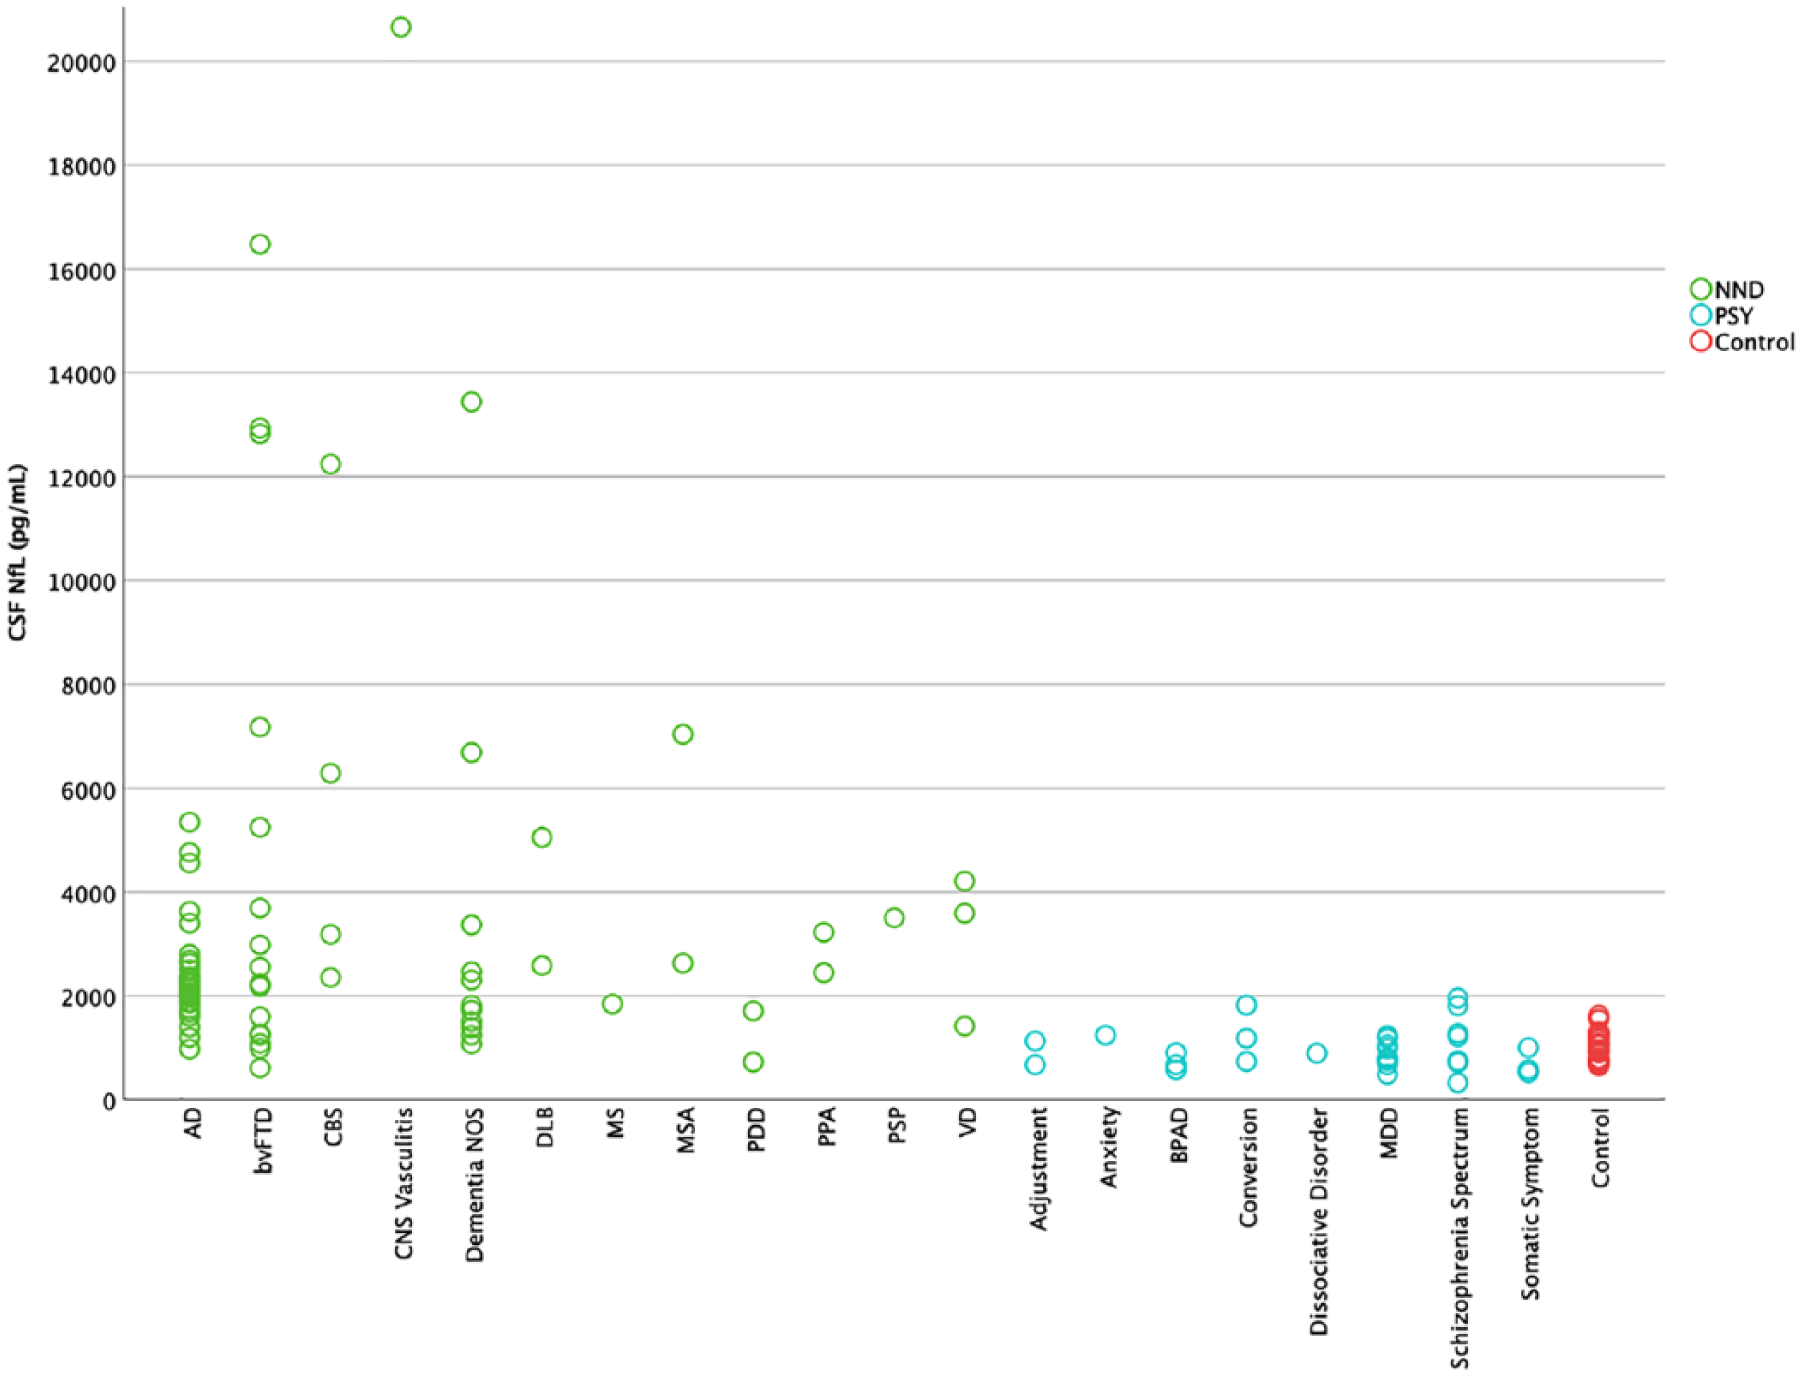
CSF NfL in different diagnoses.
NfL as a diagnostic test
ROC curve analyses were performed to determine sensitivity and specificity of CSF NfL and other biomarkers in distinguishing PSY from NND. As shown in Table 3 and Figure 4, CSF NfL demonstrated the greatest AUC (0.94, 95% CIs = [0.89, 0.98]). Using the optimal cut-off of 1332 pg/mL resulted in a sensitivity of 0.87 and specificity of 0.90. When compared directly, the AUC for NfL was significantly greater than Aβ1-42 (AUCdiff = 0.34, 95% CIs = [0.22, 0.6]), P-tau (AUCdiff = 0.20, 95% CIs = [0.12, 0.30]) and T-tau (AUCdiff = 0.14, 95% CIs = [0.07, 0.23]). Comparable results were observed when the analysis was restricted to the younger-onset group only, with NfL once again resulting in more accurate classification compared to other biomarkers.
Receiver operating characteristic (ROC) curve analyses for NND versus PSY.
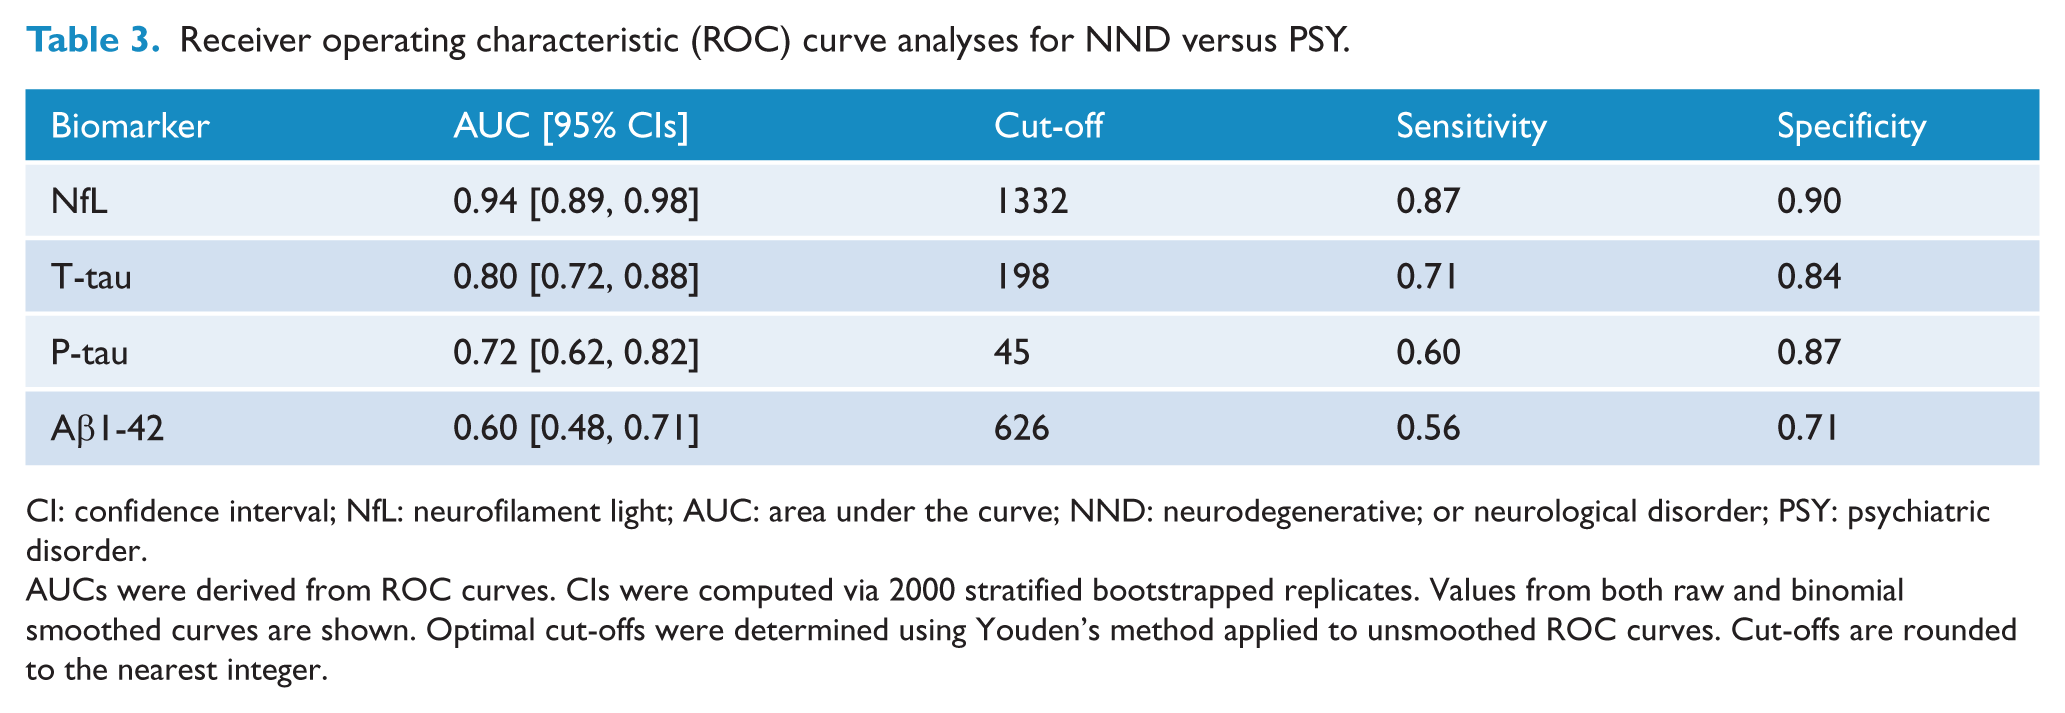
CI: confidence interval; NfL: neurofilament light; AUC: area under the curve; NND: neurodegenerative; or neurological disorder; PSY: psychiatric disorder.
AUCs were derived from ROC curves. CIs were computed via 2000 stratified bootstrapped replicates. Values from both raw and binomial smoothed curves are shown. Optimal cut-offs were determined using Youden’s method applied to unsmoothed ROC curves. Cut-offs are rounded to the nearest integer.
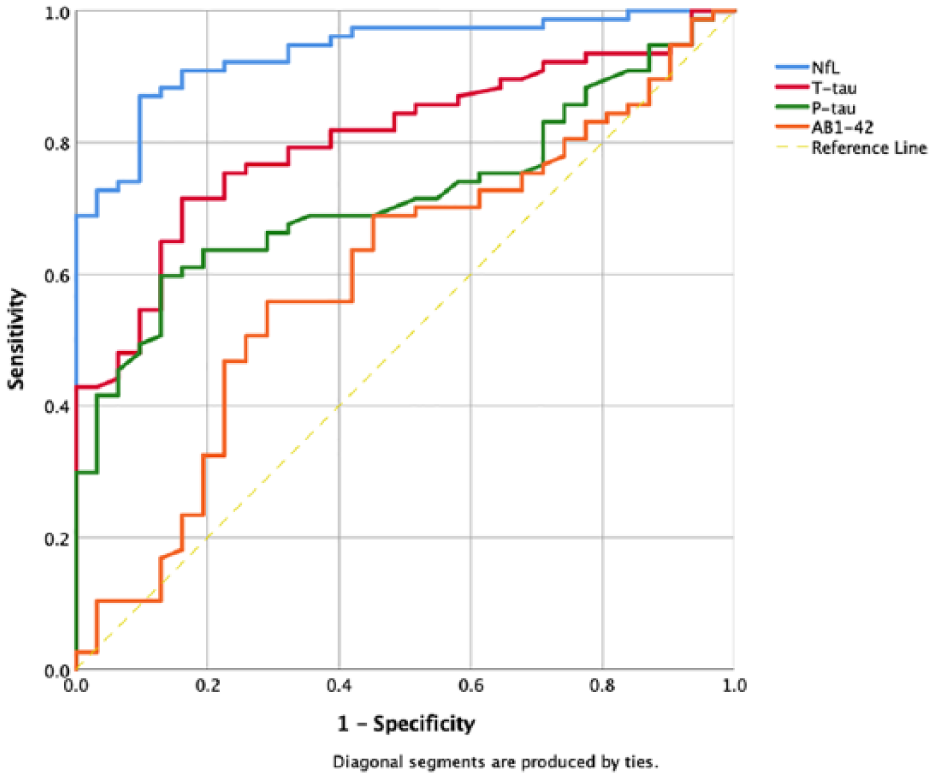
Receiver operating characteristic (ROC) curves for NND versus PSY.
Discussion
Even despite multidisciplinary and multimodal assessments, distinguishing a primary psychiatric disorder from a primary or comorbid neurodegenerative or neurological disorder, can be challenging, particularly in patients presenting under the age of 65. This study demonstrated statistically significant differences in CSF NfL concentrations between psychiatric and neurodegenerative and neurological disorders, with high area under the curve, sensitivity and specificity.
These results suggest potential utility of CSF NfL as a diagnostic test to differentiate psychiatric disorders from neurodegenerative or neurological disorders, including when psychiatric symptoms are admixed in the latter group. As far as we are aware, there has not been a marker identified that on its own can assist with this diagnostic dilemma with comparable performance. Several studies have shown that serum and plasma NfL can be detected reliably and correlate well with CSF NfL,(Byrne et al., 2017; Mattsson et al., 2017) therefore opening up the possibility of a more accessible and potentially even routine test for patients in a range of services, which could dramatically alter clinical care of patients with neuropsychiatric and neurocognitive symptoms, particularly in psychiatric settings where there may be increased barriers to lumbar puncture.
To our knowledge, this is the first study to have specifically explored the utility of CSF NfL in distinguishing patients with a range of psychiatric disorders from a range of neurodegenerative and neurological disorders in a younger population, and, importantly, in patients with psychiatric disorders with neurocognitive symptoms where the explicit clinical dilemma and reason for referral to a tertiary neuropsychiatry service was whether there was a primary or co-morbid neurodegenerative disorder or not. We used robust statistical methods for all comparisons that mitigated and were robust against potential confounding factors such as age and sex. These statistical methods were also robust against the effect of outliers, of significance given the broad spread of levels in the NND group, and in addition, simple sensitivity analyses via exclusion of outliers demonstrated minimal impact of these outliers on the results.
Limitations of this study include its retrospective, cross-sectional design. Diagnosis was based on comprehensive gold-standard multidisciplinary and multimodality assessments and informed by established diagnostic criteria, but the majority of patients did not have more definitive confirmation such as genetic testing, amyloid imaging or neuropathology. Assessments were not conducted using structured interviews; however, assessments were not based on single interviews and were multidisciplinary. Follow-up data were available for many patients and ranged from 6 months to 9 years, but follow-up data were not available for all patients. Not all patients referred to the NPU received lumbar punctures, in particular when it was deemed not to be clinically indicated (e.g. diagnosis clear on clinical, neuroimaging and cognitive assessments). The psychiatric patients included in this study in general had more severe and complex presentations that led to referral to a tertiary neuropsychiatry service and may not necessarily be generalisable to general psychiatric patients. However, many psychiatric patients with severe and complex issues are managed primarily by psychiatric services and do not get referred to (or have access to) tertiary neuropsychiatry services, and neurocognitive and neurological symptoms are common in psychiatric disorders (Bora et al., 2010; Porter et al., 2003; Thompson et al., 2005). Furthermore, it could be hypothesised that NfL levels would be even lower in patients with less severe psychiatric disorders and thus more significantly different to neurodegenerative disorders. Finally, the relatively small numbers of patients mean that our comparisons across and within PSY and NND diagnostic groups need to be interpreted with caution. The number of patients in each specific diagnostic subgroup was relatively small. While we detected large differences between the psychiatric and neurodegenerative disorder groups, we did not detect differences between specific neurological or psychiatric diagnostic subgroups within these groups. As such, larger studies will be required to determine whether NfL is differentially expressed across these specific subgroups.
We had hypothesised that NfL concentrations in patients with psychiatric disorders would generally be within the UmanDiagnostics NfL testing kit–recommended age-specific normal limits (<30 years: <290 pg/mL; 30–39 years: <380 pg/mL; and 40–60 years: <830 pg/mL). Interestingly, almost two-thirds of psychiatric patients had concentrations above the age-appropriate cut-offs (compared to over 97% in the NND group). This preliminary data could potentially suggest a degree of neurodegeneration in a range of psychiatric disorders consistent with neuroimaging, neurocognitive and neurological abnormalities in severe disorders such as schizophrenia (Ross et al., 2006). This observation however relies on the kit’s suggested cut-offs, and the importance of individual laboratories establishing their own cut-off values for CSF biomarkers is well recognised (Mattsson et al., 2013). Furthermore, the lack of kit cut-offs for ages greater than 60, the absence of age-matched healthy controls and the small numbers (it could be hypothesised that having NfL levels on younger, age-matched healthy controls, and larger numbers, might have more clearly demonstrated an elevation in NfL levels in psychiatric disorders) further limit the strength of interpretations that can be made. It could be hypothesised that patients without neurocognitive symptoms, less complex and severe psychiatric symptoms, and without neurological and/or neuroradiological abnormalities, may in fact have even lower NfL concentrations and thus be more significantly different compared to neurological and neurodegenerative disorders. Our study however focussed on patients with psychiatric disorders where the specific clinical dilemma and question was of a potential comorbid or primary neurodegenerative disorder, which better reflects the reality of clinical practice. Finally, our data could suggest that psychiatric disorders of any type should not necessarily be assumed to be ‘healthy controls’ for NfL studies, and that larger, longitudinal studies of NfL as a marker of potential neurodegeneration in psychiatric disorders are required.
In summary, this pilot study demonstrated the ability of CSF NfL to distinguish psychiatric disorders from neurodegenerative and neurological disorders with relatively high sensitivity and specificity. This provides evidence of utility of CSF NfL as a diagnostic test to assist with this relatively common, challenging diagnostic dilemma and to reduce diagnostic delay and improve outcomes for patients, families and the healthcare system. In particular, a significantly elevated CSF NfL concentration in a patient with a primary psychiatric diagnosis should prompt review and consideration of neurological and neurodegenerative differential diagnoses. Several clinical cases from our unit where the availability of NfL at the time of initial assessment could have had significant clinical outcomes for patients, families and the healthcare system, even in our tertiary specialised, heavily resourced setting, are detailed in Supplemental Material. Moving from measuring NfL in CSF to a more straightforward blood test has the potential to dramatically transform the clinical assessment, care and treatment of patients with neuropsychiatric, neurological and neurocognitive symptoms and allow a much more precision-medicine approach with regard to other assessments, investigations and treatments in a broad range of settings, from primary care, to memory clinics, to hospital wards, to psychiatric settings. Larger, prospective studies on plasma and CSF NfL are underway, to more confidently define the true clinical merit of this biomarker in patients presenting with neurocognitive and neuropsychiatric symptoms.
Supplemental Material
Online_Supp – Supplemental material for A pilot study of the utility of cerebrospinal fluid neurofilament light chain in differentiating neurodegenerative from psychiatric disorders: A ‘C-reactive protein’ for psychiatrists and neurologists?
Supplemental material, Online_Supp for A pilot study of the utility of cerebrospinal fluid neurofilament light chain in differentiating neurodegenerative from psychiatric disorders: A ‘C-reactive protein’ for psychiatrists and neurologists? by Dhamidhu Eratne, Samantha M Loi, Nirbaanjot Walia, Sarah Farrand, Qiao-Xin Li, Shiji Varghese, Mark Walterfang, Andrew Evans, Ramon Mocellin, Kunal Dhiman, Veer Gupta, Charles B Malpas, Steven Collins, Colin L Masters and Dennis Velakoulis in Australian & New Zealand Journal of Psychiatry
Footnotes
Acknowledgements
The authors would like to thank Dr Christopher Fowler for assistance with coordination and data collection and the Australian Imaging, Biomarker and Lifestyle (AIBL) study of ageing for sharing data with us. The authors also thank all the patients of the Neuropsychiatry Unit and their families, and the participants of the AIBL study, for their time, assistance and commitment.
Authors’ contributions
D.E. performed literature search, study design and coordination, data collection, data analysis and interpretation, and writing. N.W. was involved in the literature search, data collection, data analysis and interpretation, writing and manuscript review. S.M.L., S.F., M.W., A.E., R.M., K.D. and V.G. contributed to study design, data collection and manuscript review. C.B.M. prepared figures and was involved in data analysis and interpretation, statistical analyses, writing and manuscript review. Q.-X.L. and S.V. performed study design, data collection, data analysis and manuscript review. C.L.M., S.C. and D.V. were involved in study design, data collection, data analysis and interpretation, writing and manuscript review.
Declaration of Conflicting Interests
The author(s) declared no potential conflicts of interest with respect to the research, authorship and/or publication of this article.
Funding
The author(s) disclosed receipt of the following financial support for the research, authorship and/or publication of this article: This study was supported in part by the Trisno Family Research Grant in Old Age Psychiatry and two NorthWestern Mental Health Research Seed Grants. The role of these funding sources was solely to purchase UmanDiagnostics NF-Light ELISA kits and had no role in the study design, collection, analysis or interpretation of data, or writing of the report. The corresponding author had full access to all the data in the study and had final responsibility for the decision to submit for publication.
Supplemental Material
Supplemental material for this article is available online.
References
Supplementary Material
Please find the following supplemental material available below.
For Open Access articles published under a Creative Commons License, all supplemental material carries the same license as the article it is associated with.
For non-Open Access articles published, all supplemental material carries a non-exclusive license, and permission requests for re-use of supplemental material or any part of supplemental material shall be sent directly to the copyright owner as specified in the copyright notice associated with the article.