
Abstract
Background:
Although brain structural changes have been reported in patients with obsessive-compulsive disorder (OCD), results from previous studies have been inconsistent. A growing number of studies have focused on obsessive beliefs and impulsivity which could be involved in the occurrence and maintenance of OCD symptoms. The present study aimed to examine whether there are distinct brain structural changes in patients with different OCD subgroups.
Methods:
Eighty-nine patients with OCD and 42 healthy controls were recruited to undergo structural magnetic resonance imaging brain scan. OCD patients were classified into subgroups according to scores of the Obsessive Belief Questionnaire (OBQ-44) and the Barratt Impulsiveness Scale (BIS-11) using cluster analysis. Group comparisons in cortical thickness and subcortical volumes between all OCD patients and healthy controls, as well as between subgroups of OCD patients and healthy controls, were carried out.
Results:
OCD patients with more obsessive beliefs and attentional impulsivity (OCD_OB_AT) had reduced cortical thickness at the inferior parietal gyrus, the superior and middle temporal gyrus and the insula compared with OCD patients with higher score on the non-planning impulsivity (OCD_NP, corrected p < 0.05). The whole group of OCD patients and both subgroups showed reduced cortical thickness at the superior parietal gyrus compared with controls (uncorrected p < 0.01, number of vertices > 100).
Conclusion:
Our results suggest that apart from distinct phenomenology, there are distinct neural correlates of different OCD subgroups based on obsessive beliefs and impulsivity. These neural correlates may have clinical significance and should be considered in future research.
Introduction
Obsessive-compulsive disorder (OCD) is a heterogeneous mental disorder characterized by recurrent intrusive thoughts and compulsive behaviours, which is associated with significant health burden. Previous neuroimaging studies have consistently reported dysfunction in the cortico-striato-thalamo-cortical (CSTC) circuit (Alexander et al., 1986).
Recent results from studies examining structural brain changes in OCD are less consistent. A previous review on voxel-based morphometric (VBM) studies has reported decreased grey matter volume at the medial frontal cortex, the dorsal lateral frontal cortex and the temporo-parieto-occipital associative regions in OCD patients compared with healthy controls (Piras et al., 2015). Another meta-analysis has reported increased grey matter volume at the frontal cortex, the postcentral cortex, the cingulate gyrus, the putamen and the thalamus; whereas OCD patients only exhibited decreased grey matter volumes at the temporal gyrus and the insula (Eng et al., 2015). Tang (2016) conducted another VBM study and found increased grey matter volume at the left orbital frontal gyrus, the anterior lobe of the cerebellum, the right middle frontal gyrus, the left middle temporal gyrus, and the pre- and postcentral gyrus in OCD patients. The caudate nucleus, which has often been implicated in the pathophysiology of OCD, showed inconsistent changes in previous studies. A meta-analysis of volumetric changes in OCD patients has shown that caudate volume is significantly increased in OCD patients (Radua and Mataix-Cols, 2009), while both meta- and mega-analysis by the enhancing neuro-imaging genetics throughmeta-analysis (ENIGMA) and the OCD brain imaging consortium (OBIC) groups reported no notable caudate volume changes (Cohen’s d = 0.032, by the ENIGMA group) in OCD patients relative to healthy controls (Boedhoe et al., 2017; de Wit et al., 2014).
The altered cortical thickness reported in OCD patients mainly involves fronto-limbic and fronto-parietal regions, such as the frontal, precentral, temporal and parietal gyri and the insula (Kühn et al., 2013; Shin et al., 2010). A meta-analysis has also found significantly reduced cortical thickness at the lateral occipital, precentral, middle temporal and inferior parietal gyri and the precuneus in OCD patients (Fouche et al., 2018). The ENIGMA OCD working group has emphasized the importance of the parietal cortex in the underlying neurobiological mechanism of OCD (Boedhoe et al., 2018). Based on the findings mentioned above, these inconsistent results may suggest that there are distinct neurobiological mechanisms underlying different OCD subgroups.
Traditionally, researchers have explored the distinct underlying neurobiological mechanisms of OCD based on clinical symptoms. The existing literature suggests that patients with different symptom subgroups are associated with different neurobiological changes (Lázaro et al., 2014; Reess et al., 2018). For example, Lázaro and colleagues investigated the difference in grey matter and white matter volumes between OCD subgroups with different symptoms and found that the harm/checking subgroup show a near-significant reduced white matter volume in the right superior temporal gyrus extending to the insula (Lázaro et al., 2014). Another study using cluster analysis to explore the different symptom profiles of OCD patients found a significantly smaller hippocampal volume in an OCD subgroup characterized by checking and ordering symptoms (Reess et al., 2018).
However, the traditional method of classifying OCD subgroups based on only clinical symptoms may not be sufficient. A growing number of studies have focused on obsessive beliefs which could be involved in the occurrence and maintenance of symptoms in OCD (Rachman, 1997). It has been suggested that OCD subgroups with more dysfunctional beliefs are associated with more severe deficit in cognitive flexibility (Sahin et al., 2017). Obsessive beliefs can predict different symptom dimensions in OCD, such as perfectionism and responsibility beliefs can predict aggressive, symmetry and sexual/religious symptoms (Cordeiro et al., 2015). Impulsivity is another construct that researchers have focused on and it is considered by some to be a feature of OCD (Benatti et al., 2013; Ettelt et al., 2007). OCD patients with greater impulsivity have been found to have worse clinical outcome (Benatti et al., 2013). To the best of our knowledge, one study has used obsessive beliefs and impulsivity in subtyping OCD patients, and its result has shown that OCD can be divided into four subgroups, and obsessive beliefs and impulsivity may mediate OCD symptoms (Prochazkova et al., 2017). However, this study only compared behavioural differences, and no imaging study has examined the neural correlates of different OCD subgroups. Obsessive beliefs and impulsivity may constitute a feasible approach to explore the distinct neurobiological mechanisms underlying OCD symptoms.
Significant negative correlation has been found between morphometric variability at the anterior temporal gyrus (including the anterior aspect of the superior, middle and inferior temporal gyrus and the temporal pole) and dysfunctional beliefs in healthy people (Alonso et al., 2013). Other studies have also reported a significant negative relationship between the volume of the amygdala and obsessive beliefs (Nakamae et al., 2012), as well as between fractional anisotropy at the nucleus accumbens and obsessive beliefs (Li et al., 2014) in OCD patients. It has been reported that attentional impulsivity is negatively correlated with cortical thickness of the bilateral superior temporal gyrus and non-planning impulsivity is negatively correlated with cortical thickness of the orbitofrontal cortex (OFC) in healthy people (Schilling et al., 2012). Changes in cortical regions of the parietal-temporal circuit and subcortical regions such as the caudate have also been found to be correlated with impulsivity in OCD (Choi et al., 2006; Norman et al., 2016).
In this study, we examined whether there are distinct brain structural changes in patients with different OCD subgroups classified based on obsessive beliefs and impulsivity. We hypothesized that OCD patients would show structural abnormalities, and each OCD subgroup would exhibit unique changes in cortical thickness in the parietal and temporal lobes as well as caudate volume.
Methods
Participants
Eighty-nine OCD patients were recruited from the Shanghai Mental Health Centre, Shanghai, China, from 2016 to 2018. All patients met the diagnostic criteria for OCD according to the Diagnostic and Statistical Manual of Mental Disorders, fourth edition (DSM-IV) and had no other comorbid axis I mental disorders. All OCD patients who scored above 16 on the Yale-Brown Obsessive-Compulsive Scale (Y-BOCS) were recruited in this study. They were aged between 18 and 45 years, right-handed and all were educated up to at least junior high school level. Potential participants were excluded if (1) they had a history of substance abuse, brain trauma or severe physical illness; (2) they had high suicide risk; or (3) they had claustrophobia or were otherwise unable to undergo magnetic resonance imaging (MRI) scanning. All patients were medication-free for at least 8 weeks at the time of recruitment.
Forty-two healthy controls were recruited from the neighbouring community through advertising. The same exclusion criteria also applied to the control group. Moreover, healthy controls must have no psychiatric treatment history in any of their first-degree relatives. This study has been approved by the Ethics Committee of the Shanghai Mental Health Centre. Written informed consent was obtained from all participants.
Measures
The Obsessive Belief Questionnaire
The Chinese version of the Obsessive Belief Questionnaire (OBQ-44) (Obsessive Compulsive Cognitions Working Group, 2005) was used to assess obsessive beliefs. The scale consists of 44 items and the response to each item is scored from 1 (‘disagree very much’) to 7 (‘agree very much’). The scale includes three factors: (1) responsibility and threat estimation; (2) perfectionism and intolerance for uncertainty; and (3) importance and control of thoughts. A higher score indicates more obsessive beliefs. In this study, the Cronbach’s alpha of the OBQ-44 was 0.90.
The Barratt Impulsiveness Scale
Impulsivity was assessed using the Chinese version of the Barratt Impulsiveness Scale (BIS-11) (Patton et al., 1995). The scale includes 26 items and the response to each item is scored from 1 (‘never’) to 4 (‘always’). Among these items, 11 items are reversely scored. The scale includes three factors: attentional impulsivity, motor impulsivity and non-planning impulsivity. Higher scores indicate stronger impulsiveness. In this study, the Cronbach’s alpha of the BIS-11 was 0.74.
Clinical measures
The Chinese version of the Y-BOCS (Goodman et al., 1989) was used to assess the severity of obsessive-compulsive symptoms. The Y-BOC includes two subscales, namely ‘obsession’ and ‘compulsion’. All participants were also screened with the Mini-International Neuropsychiatric Interview (M.I.N.I.) (Sheehan et al., 1998) and asked to complete the Beck Depression Inventory, second edition (BDI-II) (Beck et al., 1996) and the Beck Anxiety Inventory (BAI) (Steer et al., 1993).
Image acquisition
All T1-weighted images were acquired using a Siemens Verio 3.0 T MRI scanner at the Shanghai Mental Health Centre. The three-dimensional sequence was produced by a 3D-MPRAGE sequence with the following parameters: repetition time (TR) = 2300 ms, echo time (TE) = 2.96 ms, flip angle = 9 degree, matrix size = 256 × 256, field of view (FOV) = 256 mm, slices = 192, slice thickness = 1 mm and voxel size = 1 × 1 × 1 mm3. During scanning, all participants were asked to relax with their eyes closed and lie still.
Data analysis
Demographic and self-reported scales
Statistical analysis was carried out using the SPSS (version 22.0). To compare the difference between groups, chi-square test for categorical variables and independent sample t-tests or analysis of variance for continuous variables were used. Significance level was set at p < 0.05.
Cluster analysis
To classify OCD patients into different subgroups, we conducted cluster analysis. Scores on the three subscales of the OBQ-44 and the three subscales of the BIS-11 were used as cluster variables. First, scores on the six subscales were transformed into Z-scores. Following the methodology of a previous study (Zou et al., 2018), we conducted a two-step cluster analysis to determine the optimal cluster number. The Bayesian information criterion (BIC) was used as a parameter to determine the optimal cluster number. We defined the most optimal number of clusters as when the BIC value was small and the change in BIC value between different cluster groups was also small (Mooi and Sarstedt, 2010). Next, we ran a K-means cluster analysis to classify OCD patients into different subgroups. Finally, we conducted discriminant analysis to establish discriminant function, adopting the leave-one-out cross validation method, to test the accuracy of OCD patients who were accurately classified into the target subgroups based on the cluster analysis.
Image data preprocessing and statistical analysis
Structural images of each participant were pre-processed using FreeSurfer (version 6.0, http://surfer.nmr.mgh.harvard.edu). In brief, T1-weighted images were skull-tripped, standardized and segmented into grey and white matter by computing the cortical surfaces, which provided an estimate of cortical thickness based on the distance between vertices in grey-white matter surfaces and the pial. Afterwards, quality control on all image outcomes was conducted manually by checking the distance between the pial and grey-white matter surfaces. For example, if the skull was included in the calculation of cortical thickness, we used the g-cut function to ensure that it was stripped clean. If this failed, the image was manually erased slice by slice. After manual correction, these images were re-run and cortical thickness was re-estimated. At the same time, the volumes of seven subcortical structures (the thalamus, the caudate, the putamen, the pallidum, the hippocampus, the amygdala and the nucleus accumbens) and intracranial volumes (ICV) were estimated by FreeSurfer segmentation.
The thickness data were analysed in Qdec 1.4 using a general linear model (GLM). Individual images were smoothed using a 10 mm full-width half maximum (FWHM) within a Gaussian smoothing kernel. The significance threshold was set at p < 0.01 (uncorrected) after controlling for age and length of education. The results were only reported when the number of vertices was greater than 100. The Monte Carlo simulation method (p < 0.05) was applied for multiple comparison correction. This simulation calculated the distribution of the maximum cluster size and recorded the area of the maximum cluster under the null hypothesis, which was then repeated over 10,000 iterations. For each cluster, the corrected p value was the probability of observing a maximum cluster that size or larger during simulation.
The subcortical volume data were exported from FreeSurfer into SPSS. We used analysis of covariance to determine whether there was a significant difference in subcortical volume between OCD subgroups and healthy controls, with significance level set at p < 0.05, controlling for age, length of education and ICV. We adopted the Bonferroni method to correct for multiple comparisons (corrected p value = 0.002).
Regions with significant differences in cortical thickness were defined as regions of interest (ROIs). Pearson correlation analysis was used to examine the correlation between clinical symptoms (Y-BOCS total and subscale scores) and cortical thickness ROIs and subcortical volumes with significant difference.
Results
Demographic information and self-reported measures
OCD patients and controls differed significantly in age (t = 2.72, p < 0.007) and length of education (t = −2.80, p = 0.006). Compared with healthy controls, OCD patients had significantly higher BDI-II and BAI scores. The two groups were significantly different in scores on the responsibility and threat estimation subscale (t = 4.80, p < 0.001), the perfectionism and intolerance for uncertainty subscale (t = 4.63, p < 0.001) and the importance and control of thoughts subscale (t = 4.56, p < 0.001) of the OBQ-44. For the BIS-11, the two groups were significantly different in scores on the attentional (t = 2.51, p = 0.013) and non-planning impulsivity (t = 2.40, p = 0.018) subscales (see Table 1).
The demographic information of patient and healthy controls (Mean [SD]).
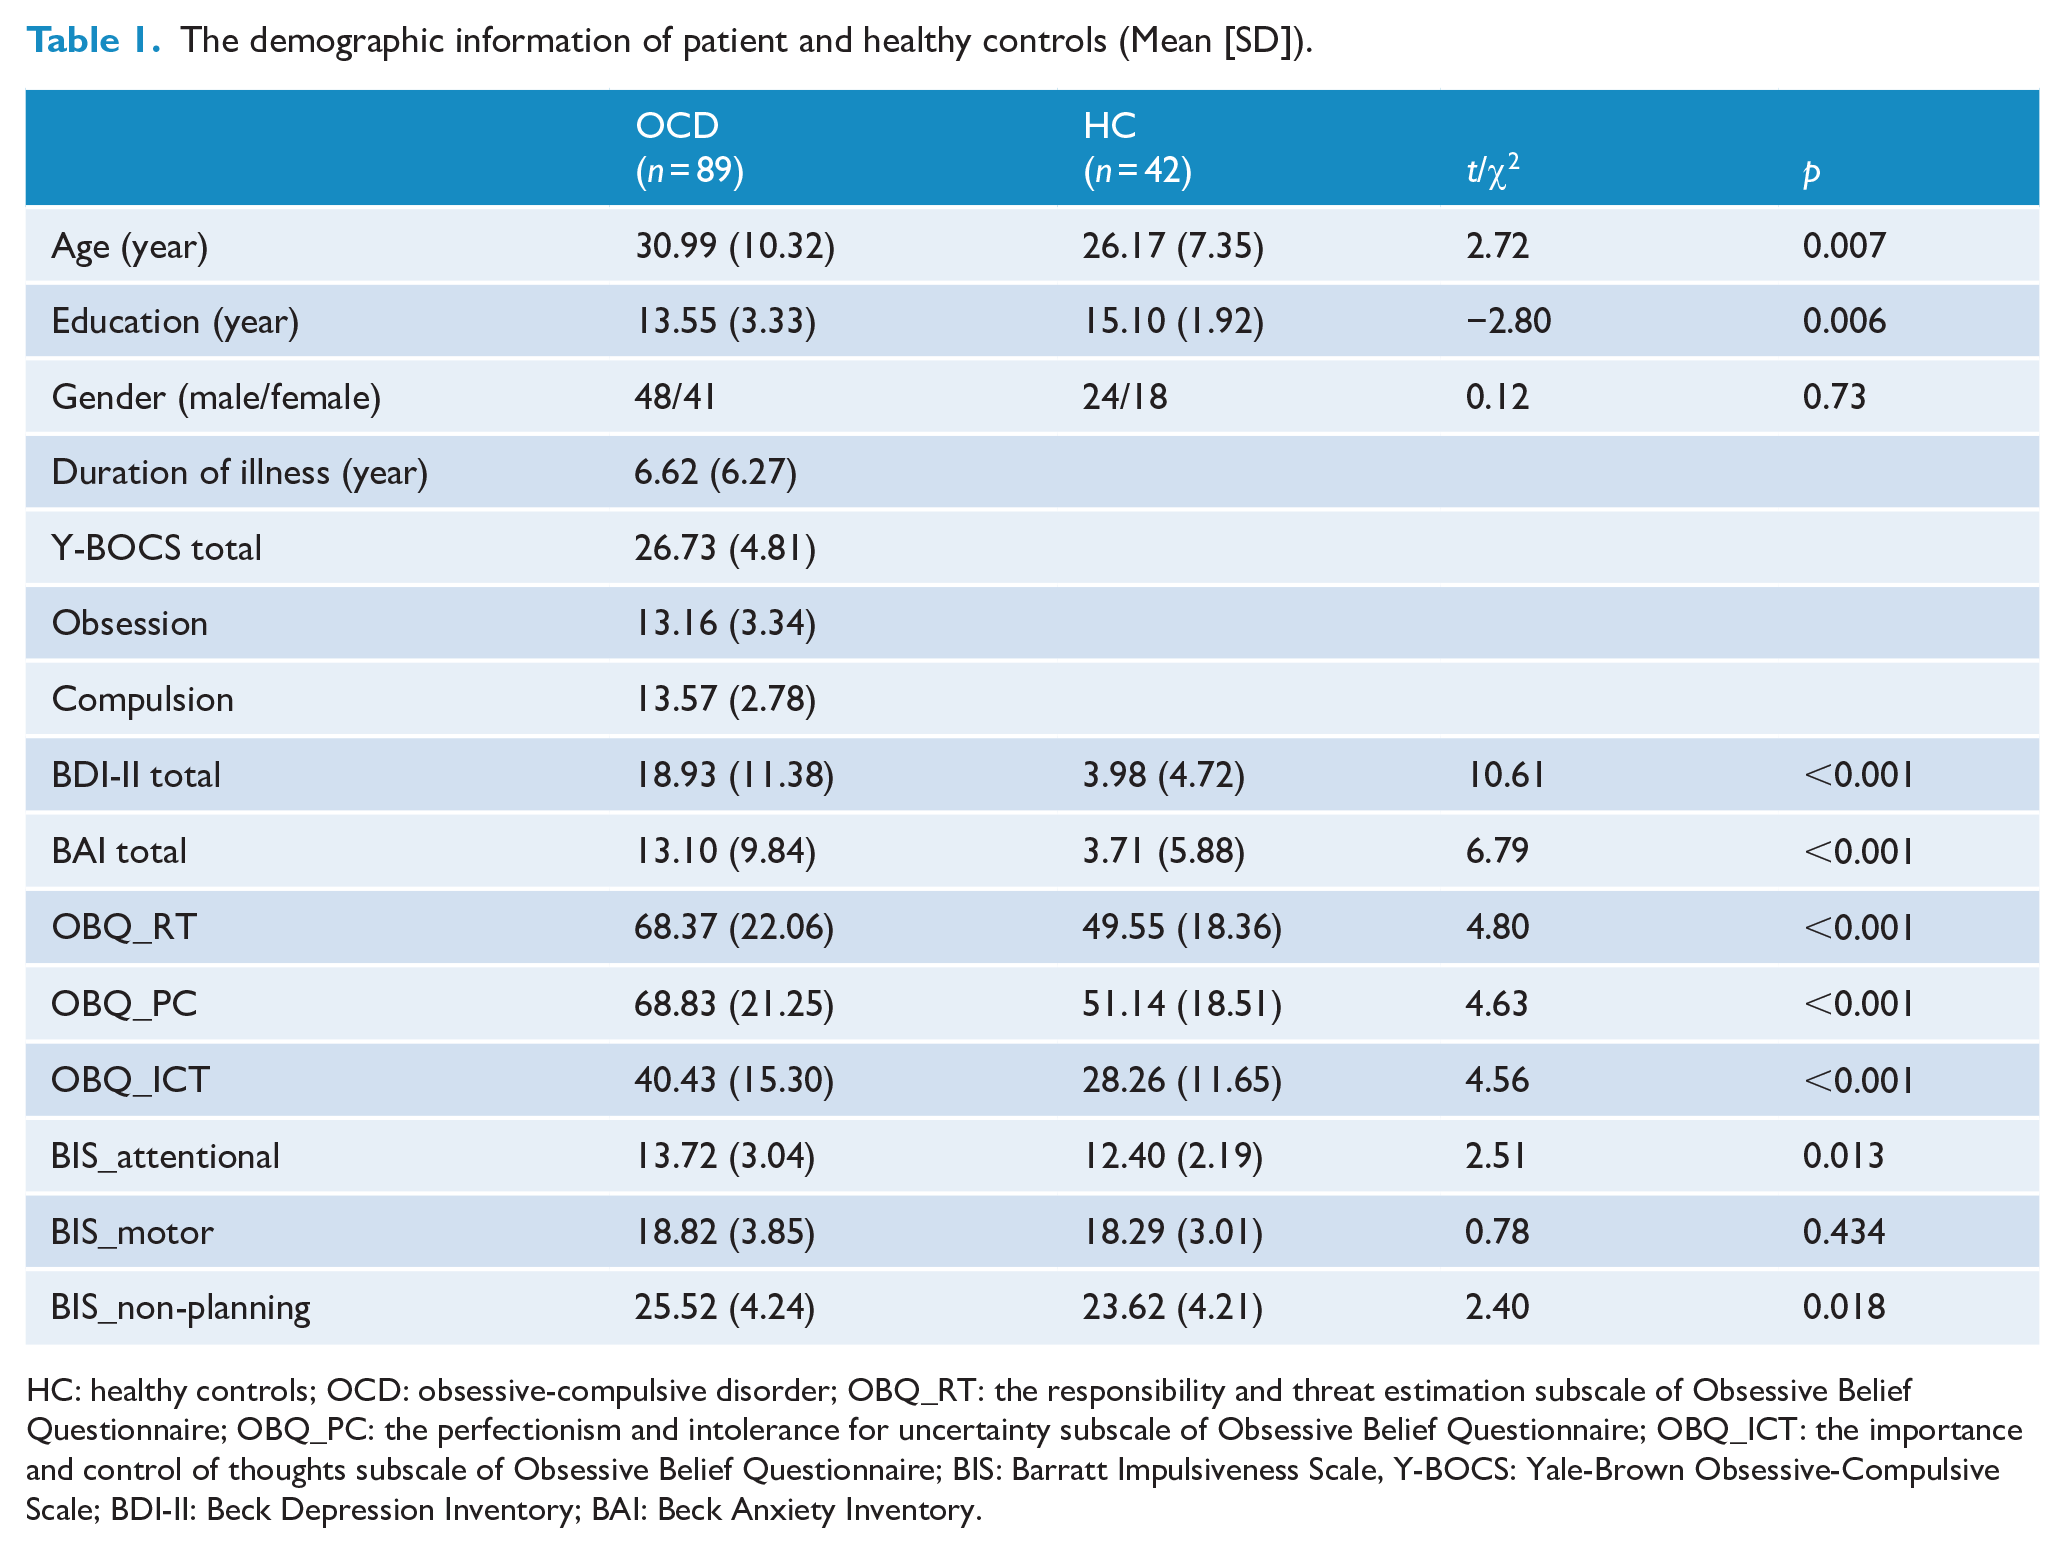
HC: healthy controls; OCD: obsessive-compulsive disorder; OBQ_RT: the responsibility and threat estimation subscale of Obsessive Belief Questionnaire; OBQ_PC: the perfectionism and intolerance for uncertainty subscale of Obsessive Belief Questionnaire; OBQ_ICT: the importance and control of thoughts subscale of Obsessive Belief Questionnaire; BIS: Barratt Impulsiveness Scale, Y-BOCS: Yale-Brown Obsessive-Compulsive Scale; BDI-II: Beck Depression Inventory; BAI: Beck Anxiety Inventory.
Cluster analysis
We found that when the cluster number was two, the BIC value was the smallest (cluster number = 2, BIC = 507.88; cluster number = 3, BIC = 517.54; cluster number = 4, BIC = 547.08). K-means cluster analysis showed that there were 47 OCD patients in Cluster 1 and 42 OCD patients in Cluster 2. The result of cluster analysis based on the subscale scores of the OBQ-44 and the BIS-11 is presented in Table 2 and Figure 1.
Differences in cluster variables and other variables between two subgroups groups and healthy controls (Mean [SD]).
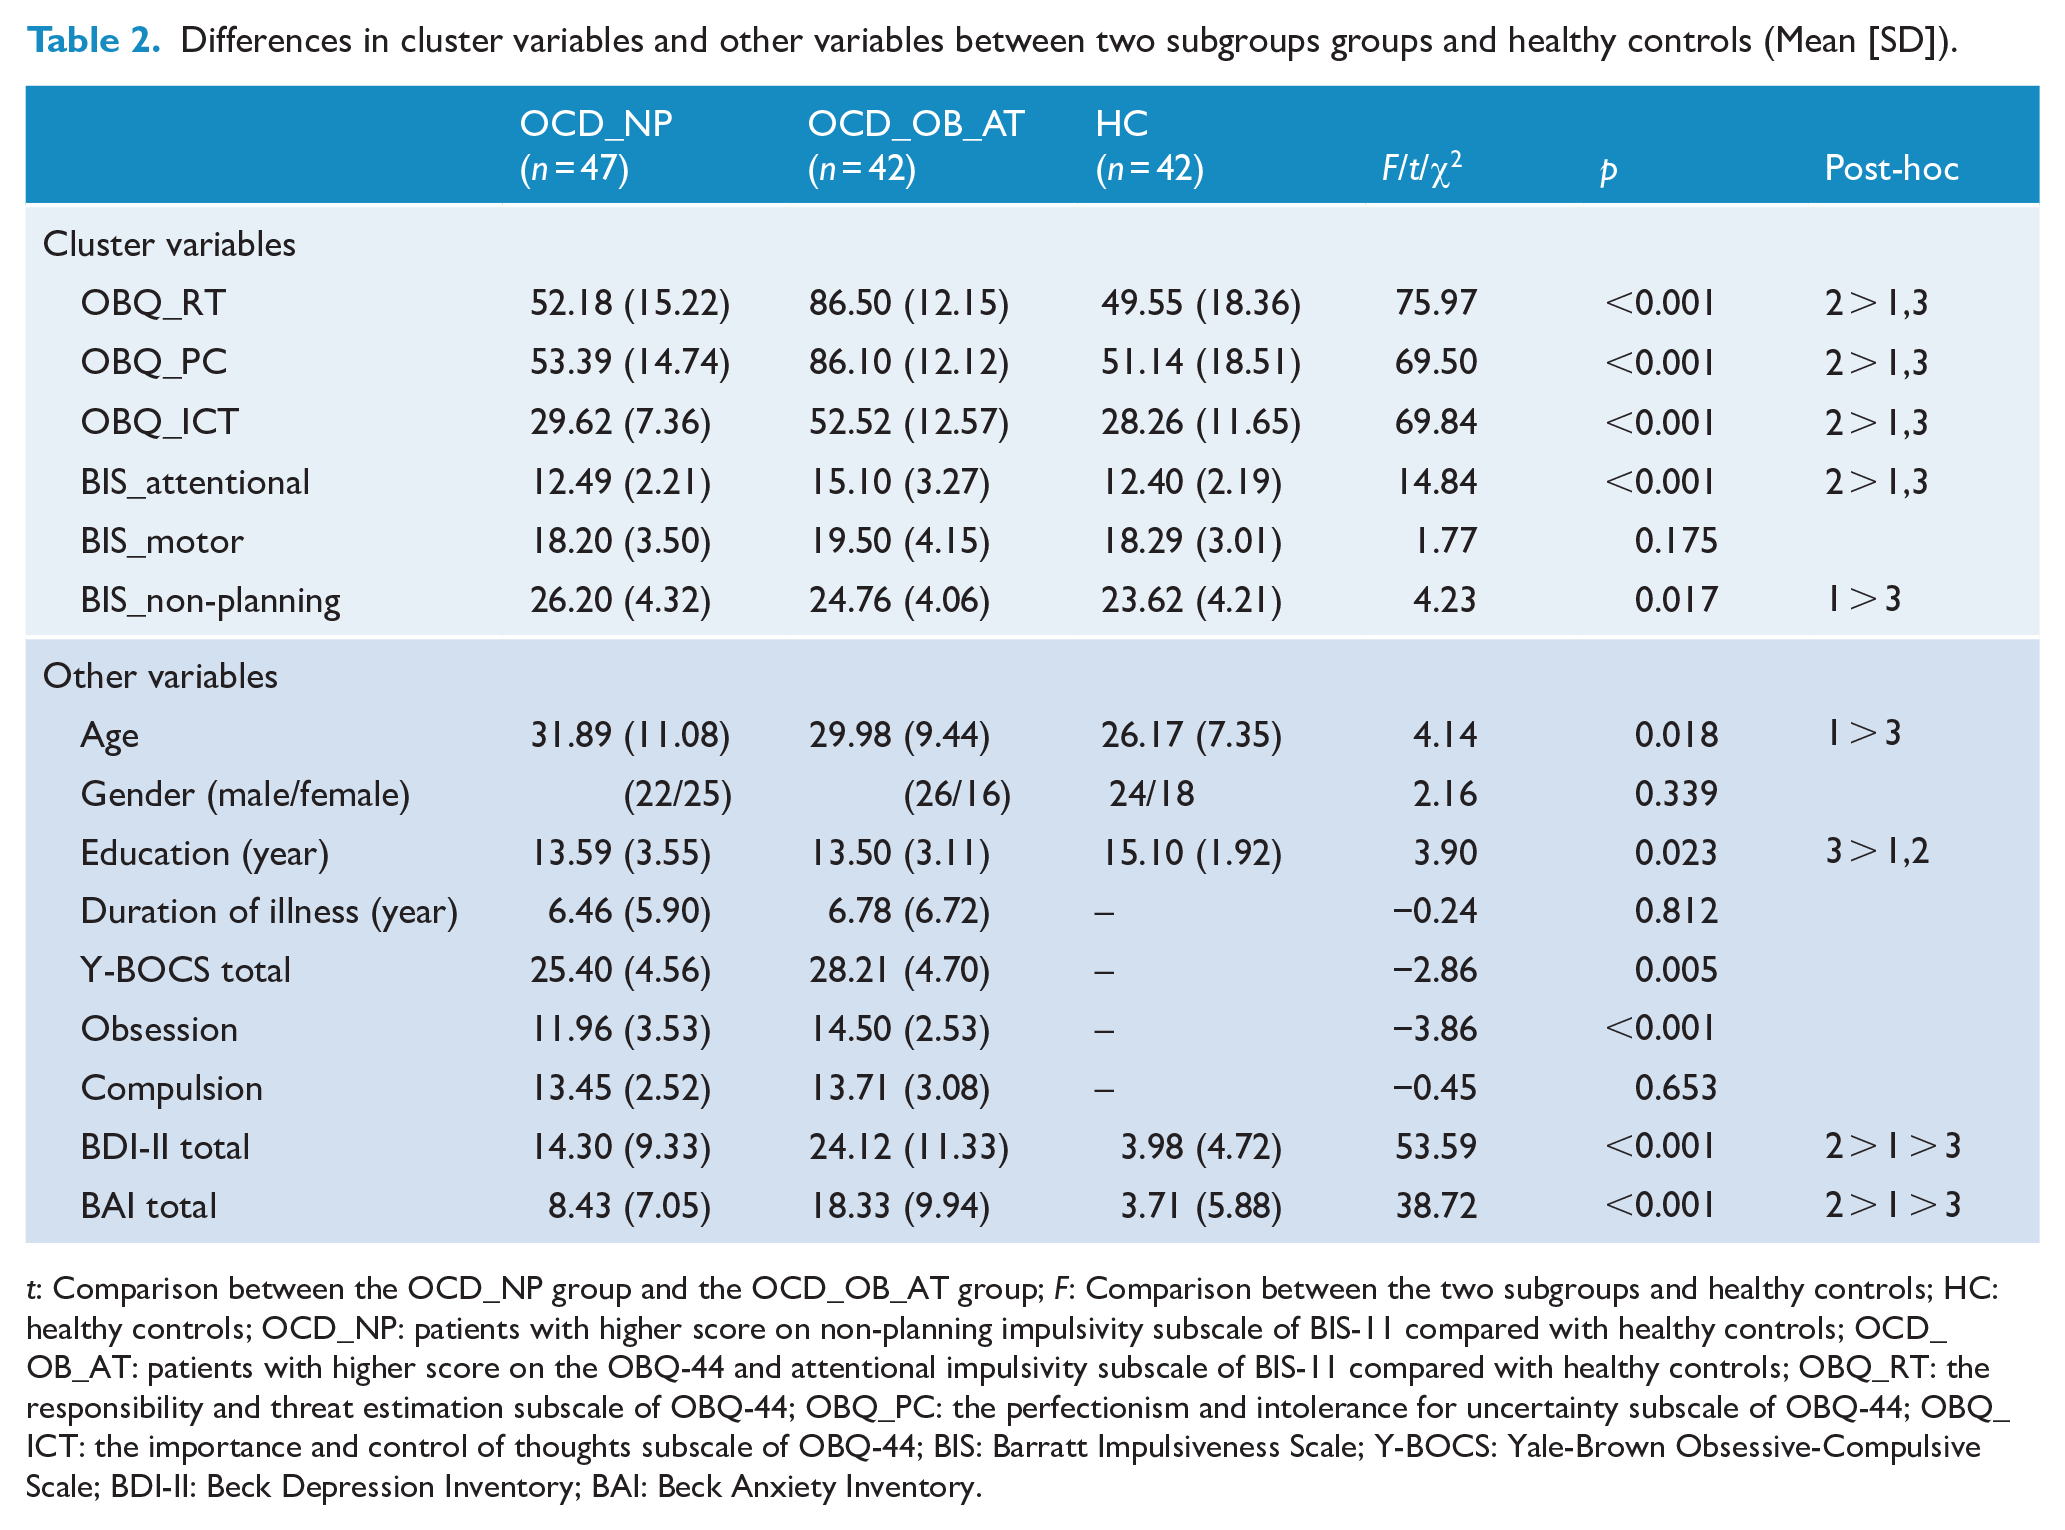
t: Comparison between the OCD_NP group and the OCD_OB_AT group; F: Comparison between the two subgroups and healthy controls; HC: healthy controls; OCD_NP: patients with higher score on non-planning impulsivity subscale of BIS-11 compared with healthy controls; OCD_OB_AT: patients with higher score on the OBQ-44 and attentional impulsivity subscale of BIS-11 compared with healthy controls; OBQ_RT: the responsibility and threat estimation subscale of OBQ-44; OBQ_PC: the perfectionism and intolerance for uncertainty subscale of OBQ-44; OBQ_ICT: the importance and control of thoughts subscale of OBQ-44; BIS: Barratt Impulsiveness Scale; Y-BOCS: Yale-Brown Obsessive-Compulsive Scale; BDI-II: Beck Depression Inventory; BAI: Beck Anxiety Inventory.
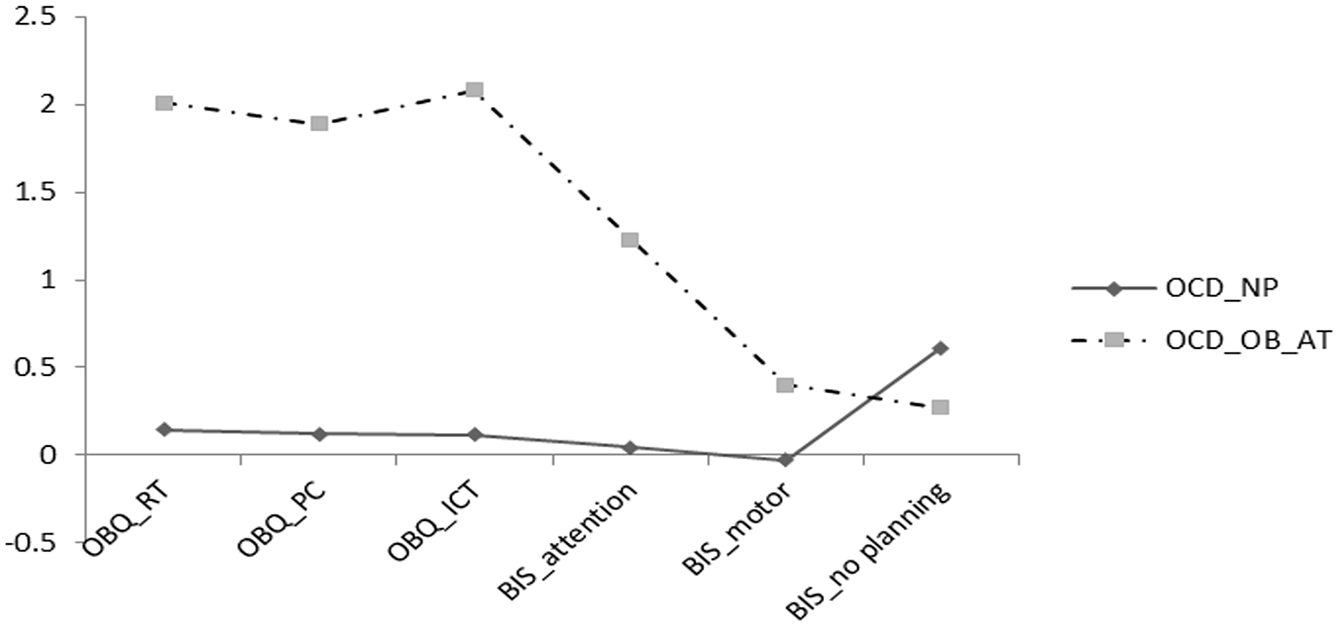
Profiles of OCD subgroups. Cluster analysis was conducted based on obsession beliefs measure by OBQ-44 and impulsivity captured by BIS-11 in OCD patients. Taking the healthy control as the baseline, we converted the original scores of the two subgroups into Z-scores which were shown in the figure. OCD_NP = patients with higher score on non-planning impulsivity subscale of BIS-11 compared with healthy controls; OCD_OB_AT = patients with higher score on the OBQ-44 and attentional impulsivity subscale of BIS-11 compared with healthy controls.
Cluster 1 consisted of OCD patients with higher scores on the non-planning impulsivity subscale of the BIS-11 and normal scores in all subscales of the OBQ-44 and attentional and motor subscales of the BIS-11 (OCD_NP), while Cluster 2 consisted of OCD patients with higher scores on the responsibility and threat estimation subscale, the perfectionism and intolerance for uncertainty subscale, and the importance and control of thoughts subscale of the OBQ-44, as well as the attentional impulsivity subscale of the BIS-11 (OCD_OB_AT). Furthermore, results of the leave-one-out cross validation method showed that 95.5% patients were correctly classified in the discriminant analysis. The accuracy for the OCD_NP group was 97.9% and the accuracy for the OCD_OB_AT group was 92.9%.
In terms of clinical characteristics, there were significant differences in age (F = 4.14, p = 0.018), length of education (F = 3.90, p = 0.023), BDI-II score (F = 53.59, p < 0.001) and BAI score (F = 38.72, p < 0.001) between the two OCD subgroups and healthy controls. There was no significant difference in gender (χ2 = 2.16, p = 0.339). Post hoc analysis showed that compared with healthy controls, the OCD_NP group was older, while the OCD_OB_AT group had a shorter length of education. Moreover, the OCD_NP group and the OCD_OB_AT group both had higher BDI-II score and BAI score than healthy controls (see Table 2). The two subgroups of OCD patients did not differ in duration of illness (t = −0.24, p = 0.812) and scores on the compulsion subscale of the Y-BOCS (t = −0.45, p = 0.653). The OCD_OB_AT group scored significantly higher on the obsession subscale (t = −3.86, p < 0.001) and total score of the Y-BOCS (t = −2.86, p = 0.005) (see Supplementary Materials Table S1 and Table S2).
Difference in subcortical volume
There was no significant difference in subcortical volume between the two OCD subgroups and healthy controls after correcting for multiple comparisons. The uncorrected results indicated a significant group effect in caudate volume (F = 3.43, p = 0.035) between the OCD_OB_AT group and the OCD_NP group and healthy controls. Post hoc analysis indicated that the OCD_OB_AT group had a larger caudate volume compared with healthy controls (mean difference = 410.35, p = 0.033). In the comparison between all OCD patients and healthy controls, we also found that OCD patients had a significant larger caudate volume (t = 6.190, p = 0.014) before correcting for multiple comparisons (see Table 3).
Subcortical volume differences in whole brain between two subgroups of OCD patients and healthy controls controlling for age, education year and ICV without multiple comparison corrections (Mean [SD]).
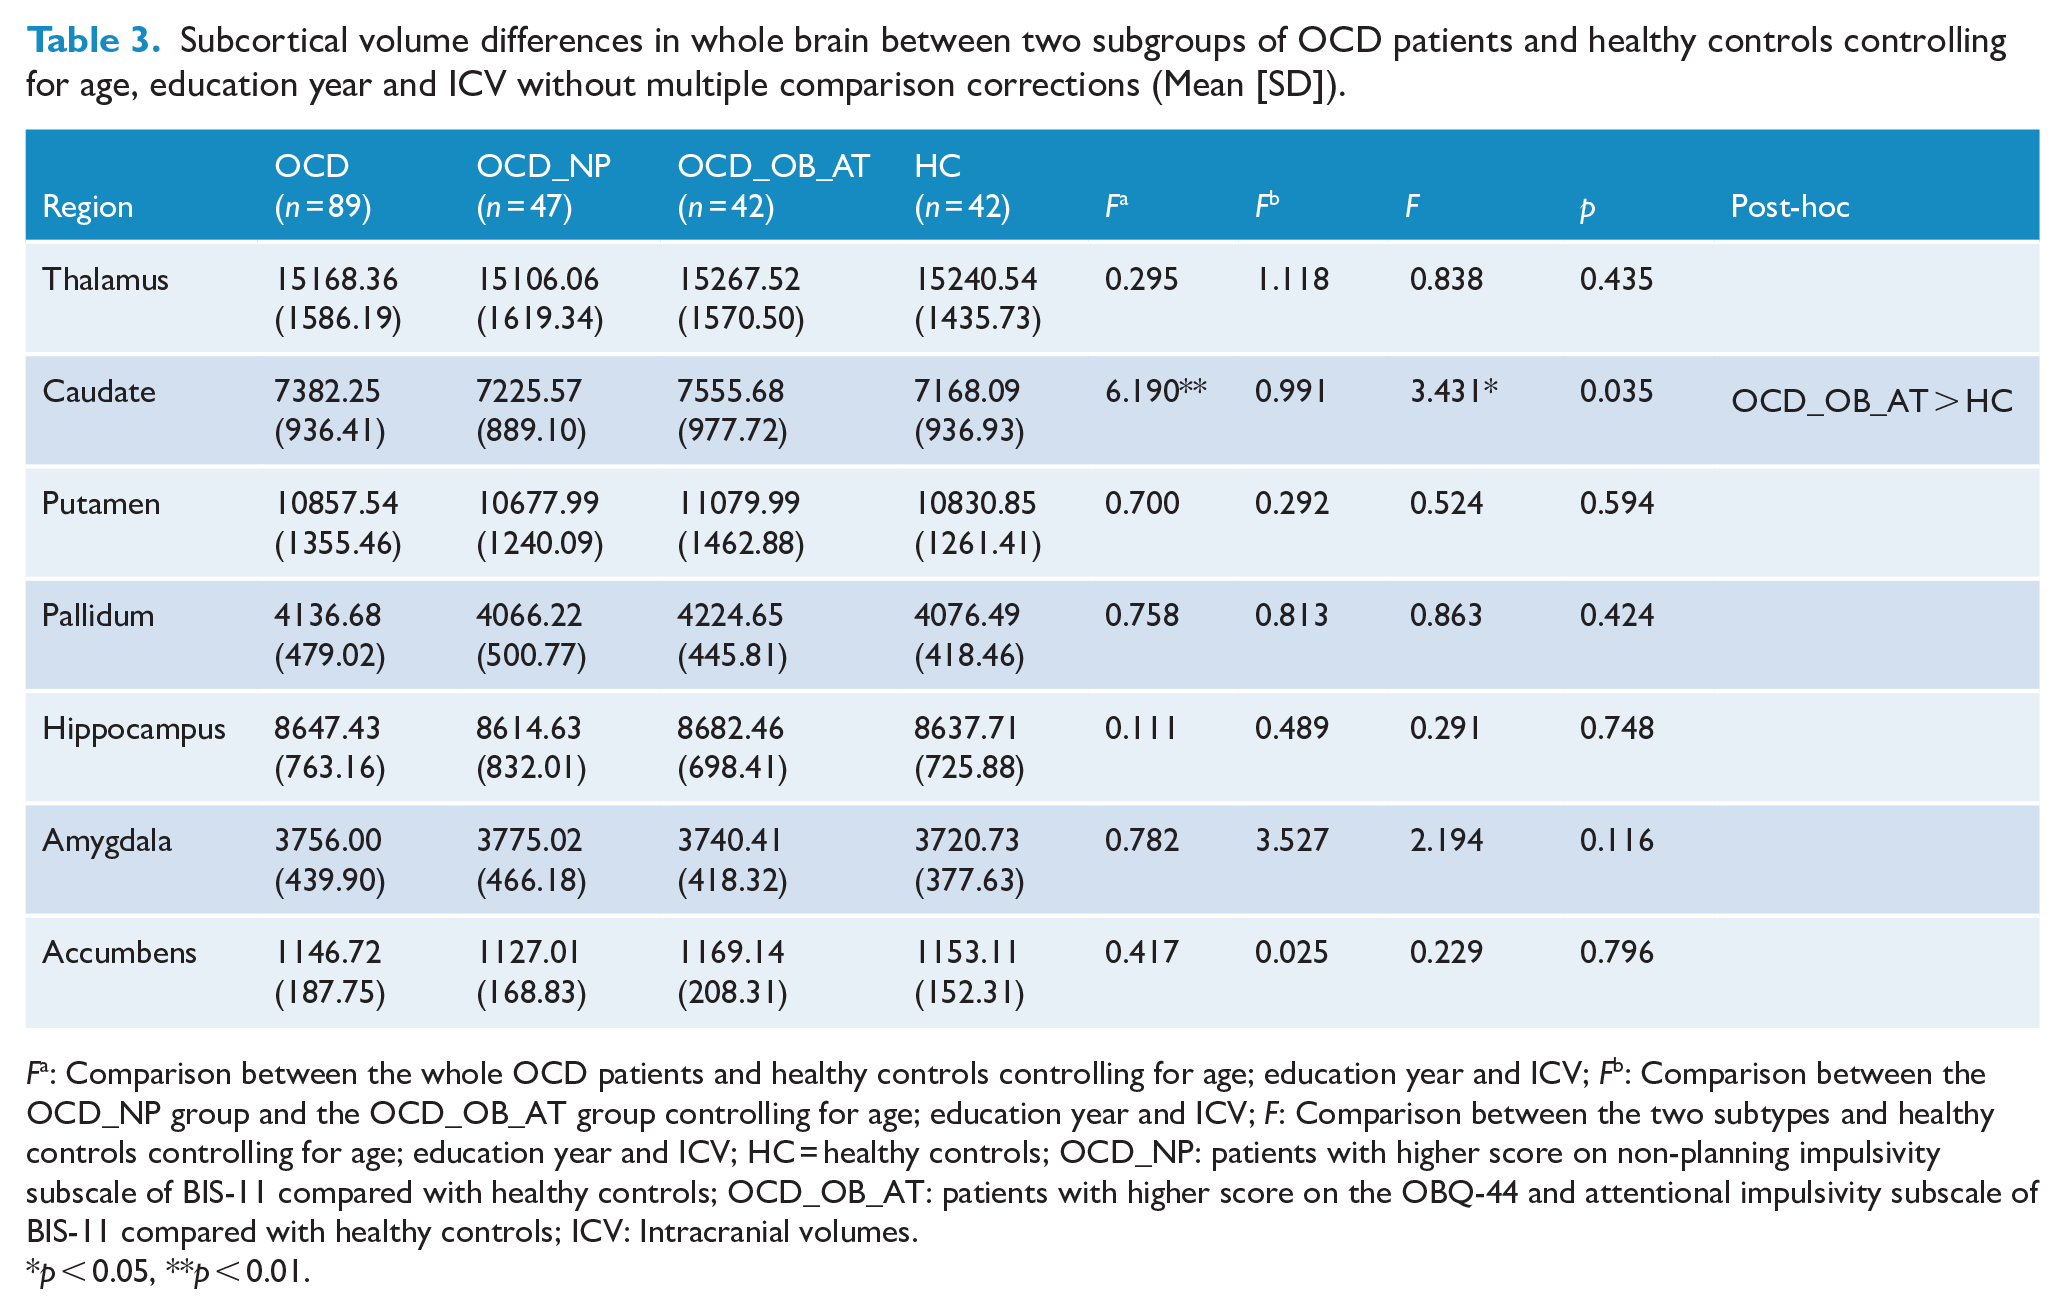
Fa: Comparison between the whole OCD patients and healthy controls controlling for age; education year and ICV; Fb: Comparison between the OCD_NP group and the OCD_OB_AT group controlling for age; education year and ICV; F: Comparison between the two subtypes and healthy controls controlling for age; education year and ICV; HC = healthy controls; OCD_NP: patients with higher score on non-planning impulsivity subscale of BIS-11 compared with healthy controls; OCD_OB_AT: patients with higher score on the OBQ-44 and attentional impulsivity subscale of BIS-11 compared with healthy controls; ICV: Intracranial volumes.
p < 0.05, **p < 0.01.
Difference in cortical thickness
Compared with the OCD_NP group, the OCD_OB_AT group had reduced cortical thickness at the right inferior parietal gyrus, the left superior temporal gyrus, the right middle temporal gyrus and the left insula after Monte Carlo correction (p < 0.05).
Compared with healthy controls, the OCD_NP group had significantly increased cortical thickness at the right superior frontal gyrus and the right temporal pole, while the OCD_OB_AT group had reduced cortical thickness at the right inferior parietal gyrus and the right superior temporal gyrus before correcting for multiple comparisons.
When all OCD patients were compared with healthy controls, we found significantly reduced cortical thickness at the left superior parietal gyrus, which did not survive multiple comparison correction (see Table 4 and Figure 2).
Cortical thickness differences in whole brain between two subtypes of OCD patients and healthy controls controlling for age and the length of education.
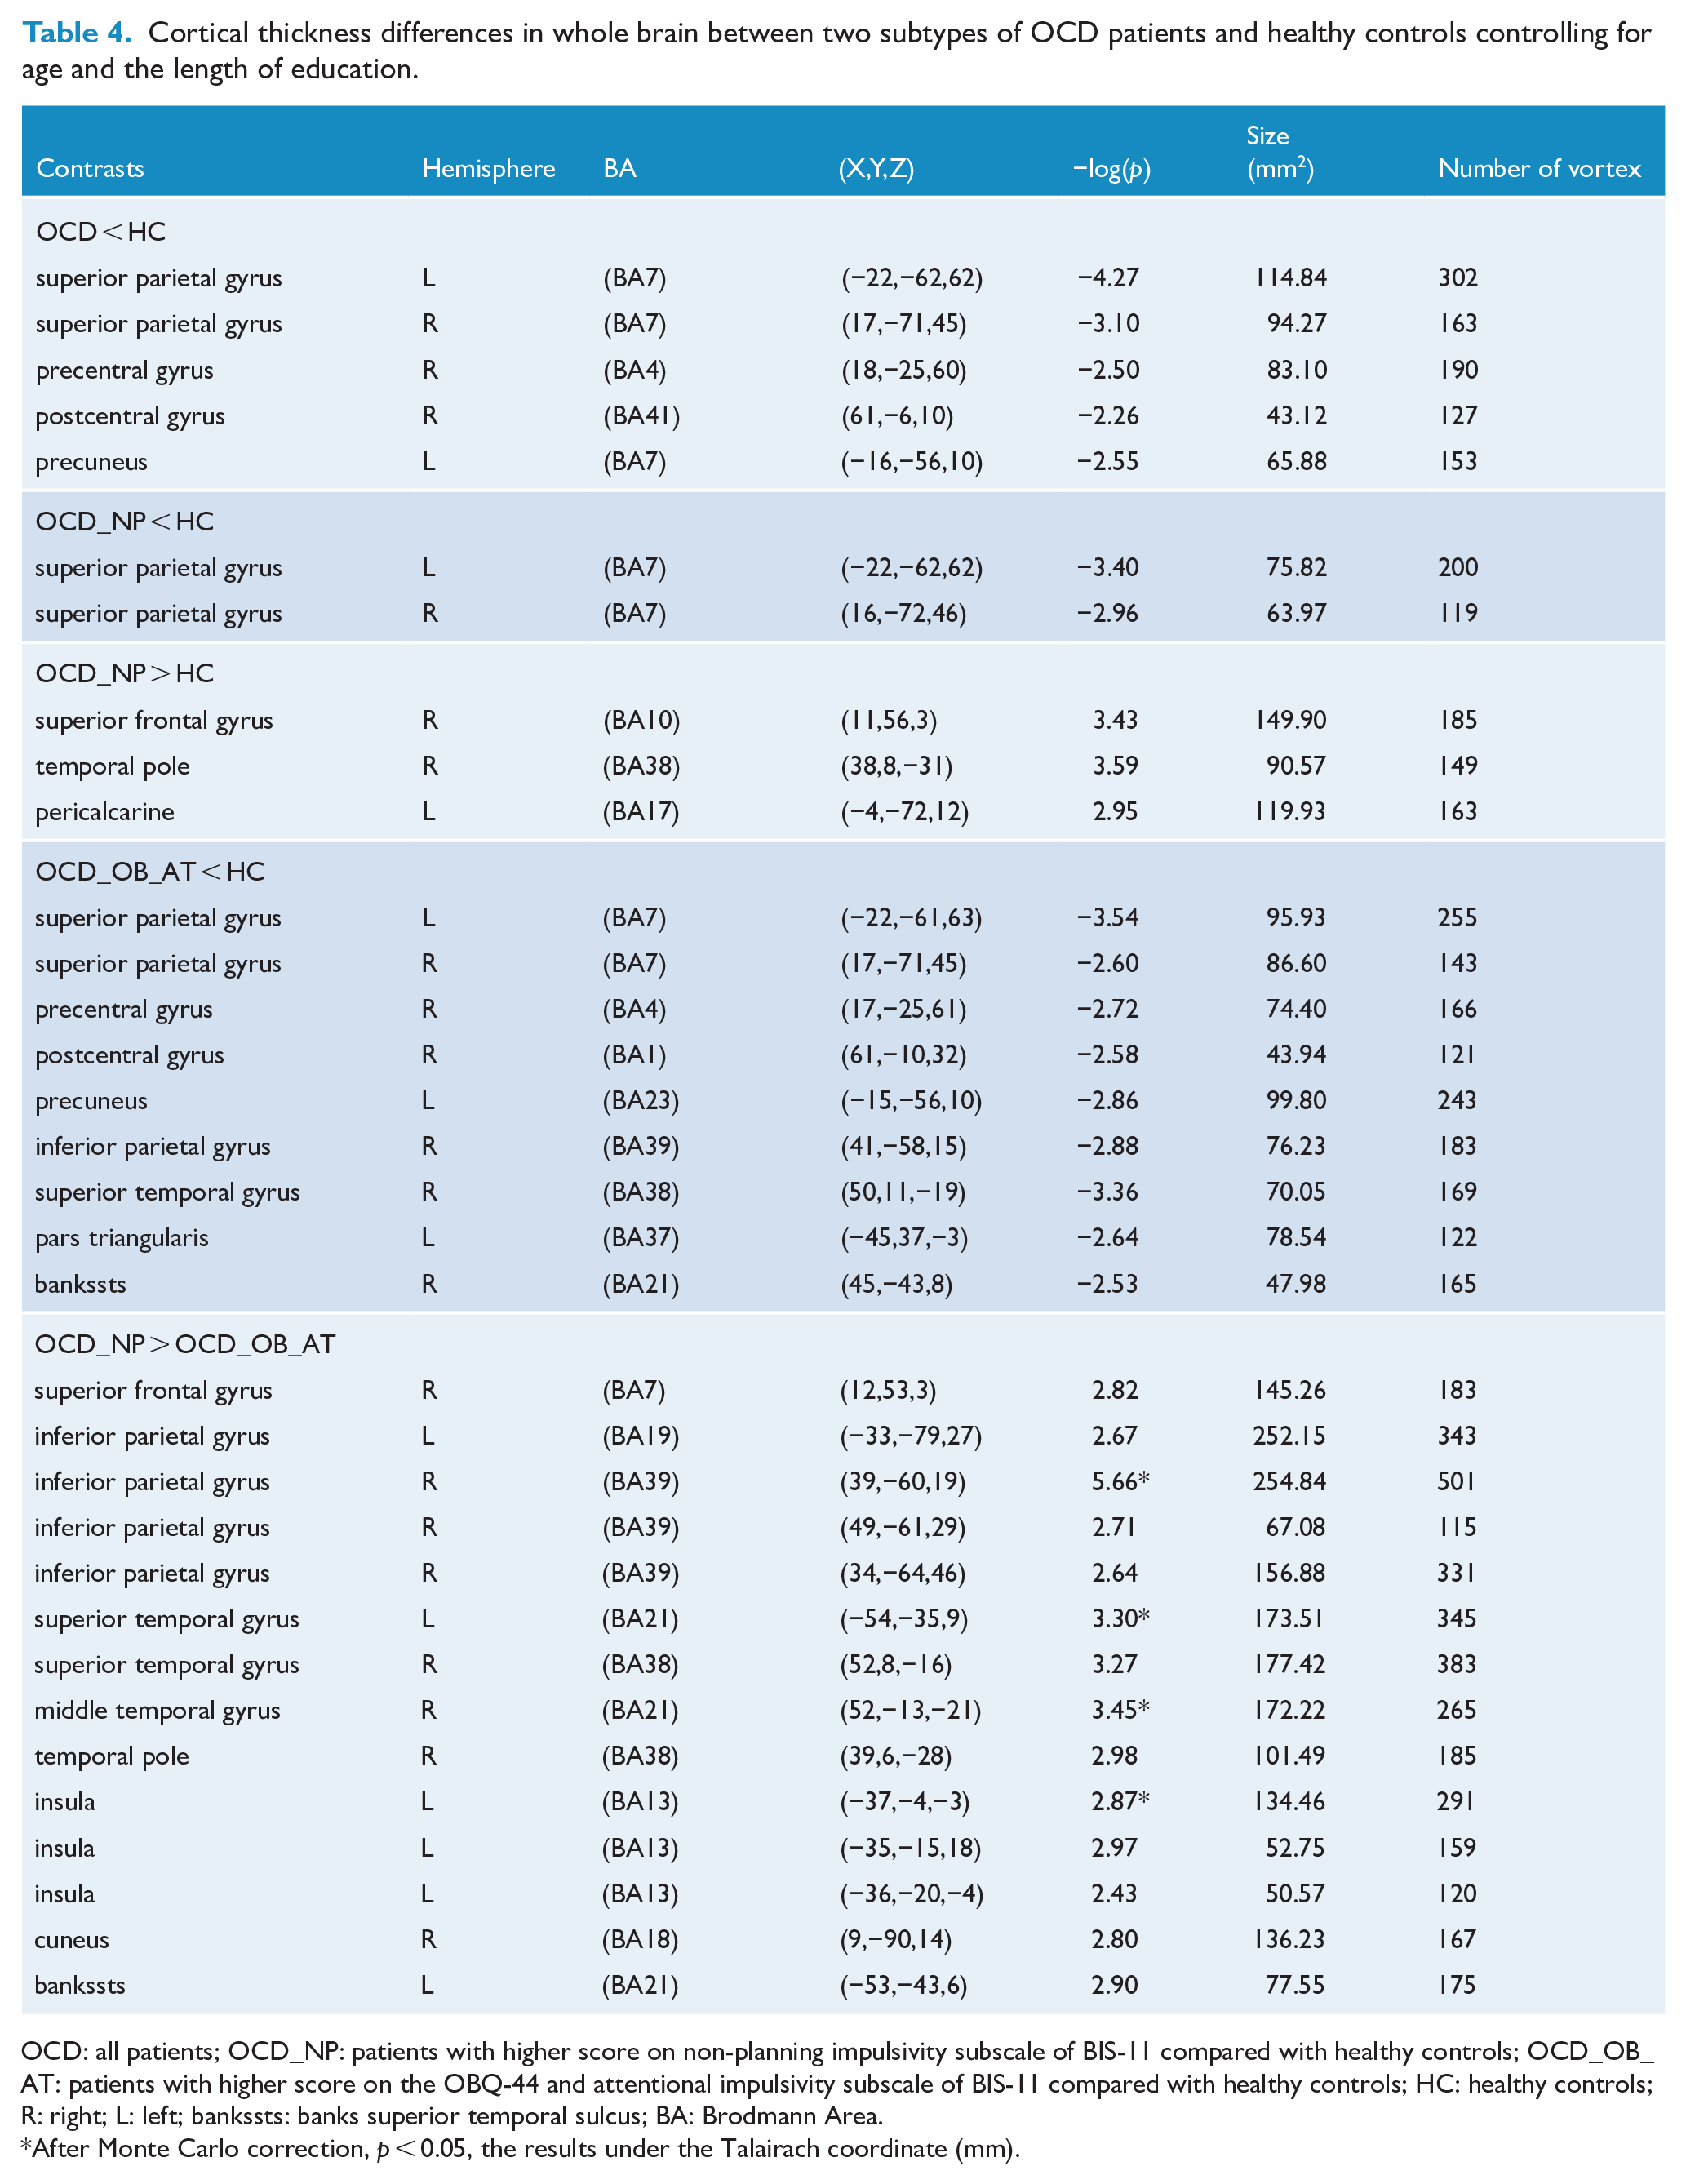
OCD: all patients; OCD_NP: patients with higher score on non-planning impulsivity subscale of BIS-11 compared with healthy controls; OCD_OB_AT: patients with higher score on the OBQ-44 and attentional impulsivity subscale of BIS-11 compared with healthy controls; HC: healthy controls; R: right; L: left; bankssts: banks superior temporal sulcus; BA: Brodmann Area.
After Monte Carlo correction, p < 0.05, the results under the Talairach coordinate (mm).
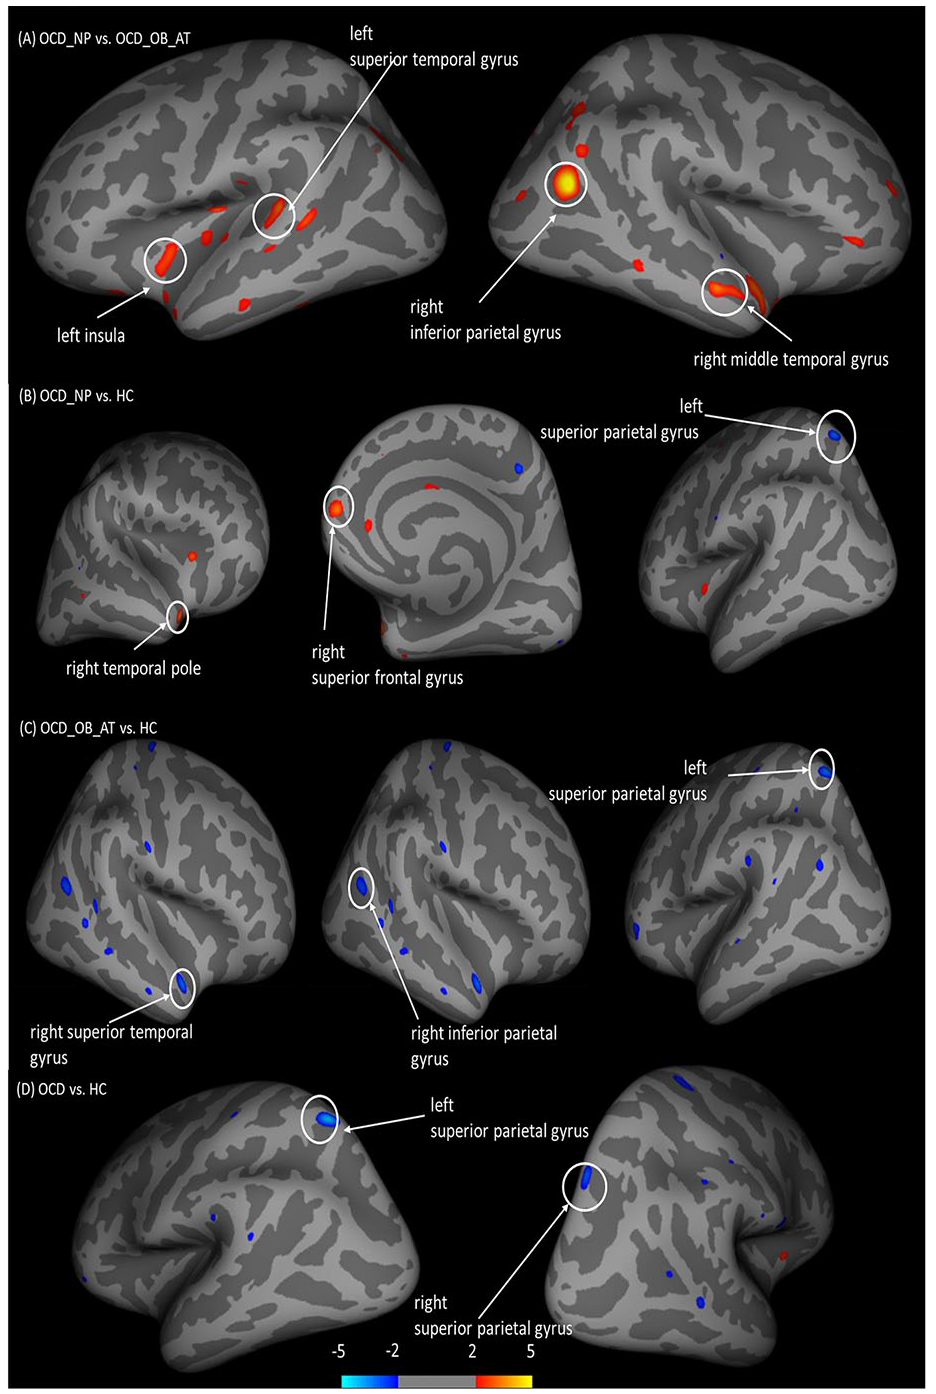
Differences in cortical thickness between healthy controls and OCD subgroups. Group comparisons were performed using QDEC implemented in FreeSurfer, taking age and the length of education as covariates. OCD_NP = patients with high score on the non-planning subscale of BIS-11, OCD_OB_AT = patients with high score on the OBQ-44 and attentional subscale of BIS-11. (A) Difference in cortical thickness between OCD_OB_AT patients and OCD_NP patients (Monte Carlo corrected, p < 0.05). (B) Difference in cortical thickness between OCD_NP patients and healthy controls (uncorrected, p < 0.01). (C) Difference in cortical thickness between OCD_OB_AT patients and healthy controls (uncorrected, p < 0.01). (D) Difference in cortical thickness between all OCD patients to healthy controls (uncorrected, p < 0.01). The colour bar encodes increased (red) and decreased (blue) cortical thickness for the corresponding contrast.
Correlation analysis
To further investigate the relationship between structural brain changes and symptoms, we conducted correlation analysis of regional cortical thickness or volumes with significant differences from the analyses mentioned above with Y-BOCS scores. We did not find any significant correlation with scores on the obsession subscale, the compulsion subscale or the Y-BOCS total score in OCD patients.
Discussion
In this study, we identified distinct cortical thickness and subcortical volume changes underlying the constructs of ‘obsessive beliefs’ and ‘impulsivity’ by cluster analysis in OCD patients. Our results indicated that OCD_OB_AT patients had reduced cortical thickness at the inferior parietal gyrus, the superior and middle temporal gyrus and the insula compared with the OCD_NP patients. This subgroup of OCD patients also had decreased thickness at the inferior parietal gyrus and the superior temporal gyrus compared with controls. OCD_NP patients had increased cortical thickness at the superior frontal gyrus and the temporal pole compared with both OCD_OB_AT patients and controls. Furthermore, both subgroups of OCD patients and the whole group of OCD patients showed reduced cortical thickness at the superior parietal gyrus compared with controls. These findings partially support our hypothesis, suggesting that there are distinct neural correlates of different OCD subgroups classified based on obsessive beliefs and impulsivity. These neural correlates may have clinical significance and should be considered in future OCD research.
We found that OCD_OB_AT patients had reduced cortical thickness at the superior and middle temporal gyrus, the inferior parietal gyrus and the insula, compared with OCD_NP patients. Reduced cortical thickness in these regions has been found in previous studies (Boedhoe et al., 2018; Fouche et al., 2018; Kühn et al., 2013). Activation of the inferior parietal gyrus has been shown to correlate with cognitive function, including set-shifting (Morein-Zamir et al., 2016), response inhibition (Zhang et al., 2017) and working memory (Ravizza et al., 2004). Accumulating evidence has highlighted the vital role of the insula in the detection of salient events (Menon and Uddin, 2010), feeling of uncertainty (Singer et al., 2009), human awareness and insight (Fan et al., 2017). The inferior parietal gyrus and the insula are part of the fronto-parietal network (FPN) (Yeo et al., 2011), which is involved in goal-oriented/attention external-oriented tasks. The superior and middle temporal gyri play a role in visual and auditory information integration (Beauchamp et al., 2004). The superior temporal and middle temporal gyri are part of the default mode network (DMN) (Yeo et al., 2011), which contributes to a variety of introspectively oriented processes including autobiographical memory, imagination and thinking about self. Previous studies have suggested that brain regions related to these two networks have close relationship with symptoms in OCD patients, which may lead to difficulties in dissociating between internal thinking and external information and excessive focus on intrinsic fear while ignoring external information (Stern et al., 2012). In addition, reduced cortical thickness at the inferior parietal gyrus and the superior temporal gyrus was also found in OCD_OB_AT patients compared with controls. Our findings suggest that obsessive beliefs and impulsivity in OCD patients may be related to these brain regions, and the clinical characteristics of the two subgroups of OCD patients appear to be correlated with dinsticnt volumetic changes in different brain regions.
We found that OCD_NP patients had increased cortical thickness at the right superior frontal gyrus (BA10, which belongs to the orbital frontal cortex [OFC]) and the temporal pole compared with both OCD_OB_AT patients and healthy controls. The OFC belongs to the affective circuit of the CSTC, which influences emotion processing and reward (van den Heuvel et al., 2016), such as reward value evaluation (Gottfried et al., 2003), reversal learning (Chamberlain et al., 2008) and decision-making (Schoenbaum et al., 2006). In addition, cortical thickness of the OFC is a strong predictor of treatment response in treatment-naïve OCD patients (Hoexter et al., 2015). Meanwhile, several studies have reported structural and functional alterations at the OFC in OCD patients (Atmaca et al., 2007; Chamberlain et al., 2008). The temporal pole plays a role in both social and emotional processes, including facial emotion recognition and theory of mind (Olson et al., 2007). Although these findings in OCD_NP patients did not survive multiple comparison correction, our results to a certain extent indicated that alterations in these brain regions may be related to non-planning impulsivity, which is involved in reward and emotion processing in OCD patients.
We also found reduced cortical thickness at the superior parietal gyrus in both subgroups of OCD patients compared with controls as well as between the whole OCD group and controls, which is consistent with the results from the ENIGMA study (Boedhoe et al., 2018), suggesting that the parietal lobe may be important in the neurobiology of OCD. A previous study has found that cortical thickness of the parietal lobe decreases more quickly with age in patients with OCD compared with healthy controls (Fouche et al., 2018). Furthermore, researchers have speculated that reduction in cortical thickness may be related to synaptic pruning (Gogtay et al., 2004). The reduced thickness in this region in OCD patients may indicate the important role of developmental experience in the formation of OCD. Future studies could take adverse developmental events into consideration when examining structural alterations of the superior parietal gyrus in OCD patients.
One of the main limitations of this study is that some cortical thickness and cortical volume results in the comparison between the two OCD subgroups and healthy controls did not survive multiple comparison correction, which may be due to the small sample size. Future studies should enlarge the sample size to investigate. However, since few studies have been conducted on this topic, some of our uncorrected results may be noteworthy as a preliminary exploration. Second, we conducted a whole brain analysis in cortical thickness between OCD patients and healthy controls. Future studies could put forward a more precise hypothesis to determine the interested brain regions and investigate cortical thickness changes in OCD patients. Third, although we adopted leave-one-out cross validation in our discriminant analysis to confirm the accuracy of subgroup classification, we did not recruit another independent sample to verify our behavioural and brain structure results. Future studies should verify our findings by recruiting an independent sample. Finally, medications might have affected the observed clinical manifestations of our OCD patients. Although the participants in this study were free from medications in the 8 weeks preceding the study, the confounding effect of medications could not be completely excluded. Future studies should recruit drug-naïve OCD patients.
In conclusion, we identified distinct subgroups of OCD patients based on obsessive beliefs and impulsivity, and distinct structural changes in specific brain regions were found in patients in different OCD subgroups, suggesting that these subgroups may have different pathological mechanisms. These findings may have clinical significance and should be considered in future OCD research.
Supplemental Material
sj-docx-1-anp-10.1177_00048674211009623 – Supplemental material for Distinct clinical manifestations of obsessive-compulsive disorder are associated with cortical thickness alteration
Supplemental material, sj-docx-1-anp-10.1177_00048674211009623 for Distinct clinical manifestations of obsessive-compulsive disorder are associated with cortical thickness alteration by Hai-di Shan, Ya-fei Liu, Qing Zhao, Yi Wang, Yong-ming Wang, Eric F Cheung, Raymond C Chan and Zhen Wang in Australian & New Zealand Journal of Psychiatry
Footnotes
Declaration of Conflicting Interests
The author(s) declared no potential conflicts of interest with respect to the research, authorship, and/or publication of this article.
Funding
The author(s) disclosed receipt of the following financial support for the research, authorship, and/or publication of this article: This research was supported by grants from the National Natural Science Foundation of China Grant (81671340), Shanghai Municipal Education Commission-Gao Feng Clinical Medicine (20161321), Municipal Human Resources Development Programme for Outstanding Leaders in Medical Disciplines in Shanghai (2017BR058), and the Shanghai Key Laboratory of Psychotic Disorders (No.13dz2260500).
Supplemental Material
Supplemental material for this article is available online.
References
Supplementary Material
Please find the following supplemental material available below.
For Open Access articles published under a Creative Commons License, all supplemental material carries the same license as the article it is associated with.
For non-Open Access articles published, all supplemental material carries a non-exclusive license, and permission requests for re-use of supplemental material or any part of supplemental material shall be sent directly to the copyright owner as specified in the copyright notice associated with the article.