
Abstract
Background:
Gaming disorder was included in the latest revision of the International Classification of Diseases (11th ed.). Worldwide, prevalence estimates of gaming disorder are considerably heterogeneous and often appear to be exceedingly high. However, few studies have examined the methodological, cultural and/or demographic factors that might explain this phenomenon. This review employed meta-analytic techniques to compute the worldwide-pooled prevalence of gaming disorder and evaluate the potential contributing factors for varied prevalence estimates.
Method:
Prevalence estimates were extracted from 53 studies conducted between 2009 and 2019, which included 226,247 participants across 17 different countries. Study findings were meta-analyzed using a random-effects model. Subgroup and moderator analyses examined potential sources of heterogeneity, including assessment tool and cut-off, participant age and gender, sample size and type, study region, and year of data collection.
Results:
The worldwide prevalence of gaming disorder was 3.05% (confidence interval: [2.38, 3.91]); this figure was adjusted to 1.96% [0.19, 17.12] when considering only studies that met more stringent sampling criteria (e.g. stratified random sampling). However, these estimates were associated with significant variability. The choice of screening tool accounted for 77% of the variance, with the Lemmens Internet gaming disorder-9, Gaming Addiction Identification Test and Problematic Videogame Playing scales associated with the highest estimates. Adolescent samples, lower cut-off scores and smaller sample size were significant predictors of higher prevalence. Gaming disorder rates were approximately 2.5:1 in favor of males compared to females.
Conclusion:
The worldwide prevalence of gaming disorder appears to be comparable to obsessive-compulsive disorder and some substance-related addictions, but lower than compulsive buying and higher than problem gambling. Gaming disorder prevalence rates appear to be inflated by methodological characteristics, particularly measurement and sampling issues.
Introduction
Following a provisional status for ‘Internet gaming disorder’ (IGD) in the Diagnostic and Statistical Manual of Mental Disorders (5th ed.; DSM-5), gaming disorder (GD) was officially adopted at the World Health Assembly in May 2019 as a diagnosis in the 11th edition of the International Classification of Diseases (ICD-11; https://icd.who.int/en). GD is characterized by persistent gaming behavior, impaired control over gaming and functional impairment due to gaming usually for a period of at least 12 months. Individuals with GD play games to the exclusion of other activities, resulting in missed life opportunities and interference with normal routine and basic self-care (i.e. sleep, eating, personal hygiene); real-world social interaction (i.e. meeting friends, visiting family); and important responsibilities (i.e. school, work, care of children) (Brand et al., 2019; Humphreys, 2019; Wölfling et al., 2019). Individuals with GD often feel unable to regulate or cease their gaming behavior and experience intense negative mood states (e.g. irritability, sadness and boredom) when unable to play (Kaptsis et al., 2016; King et al., 2018; Rumpf et al., 2018; Saunders et al., 2017). Personal distress may relate to a fear of missing out on the online game world, where the user feels a strong sense of personal identity and self-efficacy (King and Delfabbro, 2014; Leménager et al., 2013; Marino and Spada, 2017; Stevens et al., 2019; Wegmann et al., 2017). With the inclusion of GD as a diagnostic category in the ICD-11, it was considered timely to evaluate the worldwide prevalence of GD to assist in estimating the potential burden of harm related to excessive gaming behaviors.
The conceptualization of GD shares features and symptoms (e.g. loss of control and continuation despite awareness of harm) with other addictive behaviors (e.g. gambling disorder), substance use disorders (SUDs), impulse control disorders (e.g. compulsive buying disorder [CBD]) and obsessive-compulsive disorder (OCD). However, the extent to which the prevalence of GD may be comparable to these disorders is unclear. For context, Calado and Griffiths (2016) reported that the worldwide prevalence of problem gambling was between 0.12% and 5.80%, with most studies reporting figures less than 1%. Degenhardt et al.’s (2017) review of 28 nationally representative studies reported the prevalence of various SUDs was 2.6%. Epidemiological studies of OCD have estimated that its prevalence falls between 0.6% and 3.5% (Crino et al., 2005; Kessler et al., 2005; Ruscio et al., 2010). Higher prevalence rates have generally been reported for compulsive buying, with a meta-analysis of 40 studies by Maraz et al. (2016) reporting the prevalence of CBD was between 3.4% and 6.9%.
Understanding the epidemiological aspects of GD provides valuable insight into its etiology and risk factors (Mihara and Higuchi, 2017). Prevalence data are also important for guiding decisions on public health policy interventions and the allocation of research funding and health resources. In the past few decades, a number of research teams, particularly those in Europe and Asia, have made substantial efforts to define the prevalence of GD and/or problematic gaming. Some studies have reported figures between 1% and 2% (Haagsma et al., 2012; Müller et al., 2015; Rehbein et al., 2015), whereas other estimates have been as high as 14% (Wang et al., 2015; Wartberg et al., 2019) and even in excess of 20% (Vadlin et al., 2018). Given that such figures greatly exceed those of related disorders, it is necessary to evaluate whether there may be sources of bias that affect the validity of these prevalence estimates (King et al., 2020a).
Variability across GD prevalence rates is proposed to be attributable to the influence of demographic and cultural factors, as well as the methodological characteristics of studies. Research has consistently reported, for example, that adolescents have higher rates of gaming-related problems than older age groups (Mak et al., 2014; Mentzoni et al., 2011; Müller et al., 2015; Van Rooij et al., 2011). Studies also report that males engage in longer gaming sessions (Desai et al., 2010) and experience more gaming-related problems than females (Rehbein et al., 2010; Turner et al., 2012; Vadlin et al., 2015; Wang et al., 2014). Age and gender differences have been reported in studies of impulse control disorders, but not necessarily in the same direction, for example, compulsive buying appears to be more prevalent among females (Maraz et al., 2016).
In their systematic review of GD prevalence, Feng et al. (2017) examined 27 studies and reported prevalence estimates ranging from 0.7% to 15.6% among school-aged children. The authors concluded that the average prevalence from 1998 to 2016 ‘[did] not appear to have increased in prevalence to the extent that internet usage has increased’ (p. 22). However, the authors did not conduct subgroup analyses to identify potential sources of bias. Another review by Fam (2018), which involved a meta-analysis of 16 studies of adolescents, reported that the pooled prevalence estimate was 4.6%, including 6.8% among males. Fam’s (2018) subgroup analyses indicated that prevalence estimates tended to be higher among older (pre-2000) studies with smaller (N < 1000) samples conducted in Asia and for studies which employed measurement adapted from DSM pathological gambling criteria. Another systematic review by Mihara and Higuchi (2017) of 50 GD prevalence studies—the largest to date—found prevalence rates ranged between 0.7% and 27.5%. The authors noted that methodological differences, particularly the choice of instrument and cut-off score, made it difficult to compare prevalence estimates across studies. These studies highlight the complexities that arise when attempting to obtain an accurate pooled prevalence rate of GD but have not yet determined clearly the most significant factors contributing to variability in rates.
Another important reason for undertaking this meta-analysis of GD prevalence was to account for differences that may arise due to cultural factors (King et al., 2018; Long et al., 2018). A review of 36 studies published in Chinese by Long et al. (2018) reported that the prevalence of GD ranged from 3.5% to 17%. Gaming is a popular activity in some East Asian countries, including Japan and China and particularly in South Korea, where gaming is highly accessible and available ‘24/7’ (e.g. ‘PC bang’ or Internet café culture) and supported by high-speed Internet services and related infrastructure propelled by booming esports industries. These countries have also been active in promoting public health and regulatory initiatives to reduce excessive use of gaming and other screen-based activities (Humphreys, 2019). One explanation for higher GD rates in these regions has been the greater familial and societal pressures on young people to succeed in education, which may be pronounced in single-child families (Lim, 2012). However, higher prevalence rates in East Asian regions (Fam, 2018) should be considered cautiously given that these studies have often employed instruments (e.g. the Internet Addiction Test) that were developed outside of Asia and without adequate attempts to ensure that these measures are valid and culturally appropriate (King et al., 2020; Wang et al., 2014).
Methodological characteristics of studies, including the instrument and its scoring, are an important influence on GD prevalence (Lortie and Guitton, 2013; Petry et al., 2015); however, these issues have received less attention than demographic and regional differences. The tools used to screen for GD have changed greatly over time, and many tools have been based on criteria transposed from other disorders, such as gambling and SUDs. This may affect the validity and applicability of certain items (e.g. tolerance and withdrawal, deception and chasing losses). Variability in GD measurement, including different profiles of strengths and weaknesses across instruments, has been highlighted by King et al. (2020) in a systematic review that identified 32 tools used across 320 studies of GD in Europe and Asia. Tools have varied in their scope of coverage of DSM-5 and ICD-11 criteria for GD, which may potentially affect their sensitivity and specificity. For example, the criterion referring to continued use despite harm (i.e. an important feature of addictive disorders, including in the ICD-11 conceptualization of GD) has appeared in only 9 out of 32 tools. Currently, the extent to which specific tools may contribute to variability in prevalence estimates is unclear.
The present review
Previous work has suggested that demographic and/or regional differences as well as methodological characteristics are likely to contribute to variability in GD prevalence estimates. However, these factors have not yet been examined systematically using meta-analytic techniques. The purpose of this review was to review the literature on the prevalence of GD to: (1) calculate the global pooled prevalence of GD and (2) determine which factors may be implicated in the variability of estimates by conducting subgroup analyses based on the demographic, regional and methodological characteristics of studies. Given limited previous reviews to guide hypotheses, this review was designed to be exploratory but expected to identify significant differences in prevalence rates according to all these characteristics.
Method
Data sources
The present review sought to collect the findings of all published studies reporting prevalence rates of GD. Although numerous studies refer to ‘Internet gaming disorder’ or IGD (i.e. the DSM-5 terminology), this review uses the abbreviation GD to encompass both the DSM-5 and ICD-11 classifications, including when referring to studies that predate the DSM-5. This review employed the same methodology used in King et al.’s (2020) review, which involved the identification of all empirical literature (N = 320 studies) that employed a named instrument to assess GD. King et al.’s (2020) review involved a database search using the following keywords and protocol: ([or tool or test or validation or psychometric or screening or diagnostic or item or instrument] AND gaming). Databases included PsycINFO, PsycArticles, PubMed, ScienceDirect, Scopus, Web of Science and Google Scholar. A PRISMA (Preferred Reporting Items for Systematic Reviews and Meta-Analyses) chart and supplementary file containing all 320 references is available in this open-access paper. There were 5828 results (including duplicate results). The titles and abstracts of all results generated by each database were screened for relevance, which led to the initial identification of 75 studies. Three duplicate studies (i.e. same data re-analyzed) were removed. Sixteen studies did not provide a prevalence estimate or sufficient data for manual calculation. Note that the reference lists of included studies were not checked for potential additional studies; however, this would likely not have identified further studies due to the requirement of studies to have used a named GD tool (which would likely be cited and therefore identified by the protocol). Thus, there were 53 studies for inclusion in the present review, which encompassed a total of 226,247 participants across 17 different countries.
In the present review, studies from the list of 320 studies met the following inclusion criteria: (1) peer-reviewed and published in English, (2) assessed problematic gaming or GD using a named IGD/GD tool and (3) reported a prevalence rate of IGD/GD. In relation to criterion (3), a further check of each study was performed to assess each prevalence rate against the sample characteristics of the study (i.e. identifying level of rigor and variability in study procedures and reporting). This subsequent check led to studies being categorized into one of four categories based on aspects of their sampling (see Data Analysis or Table 1 legend for a complete description of each ‘sample type’). Regarding criterion (2), studies that employed Internet addiction tools were included when they were used to screen for gaming-related problems, for example, the Young Internet Addiction Test (YIAT) and Compulsive Internet Use Scale (CIUS).
Characteristics of included studies (N = 53) in order of year of data collection.
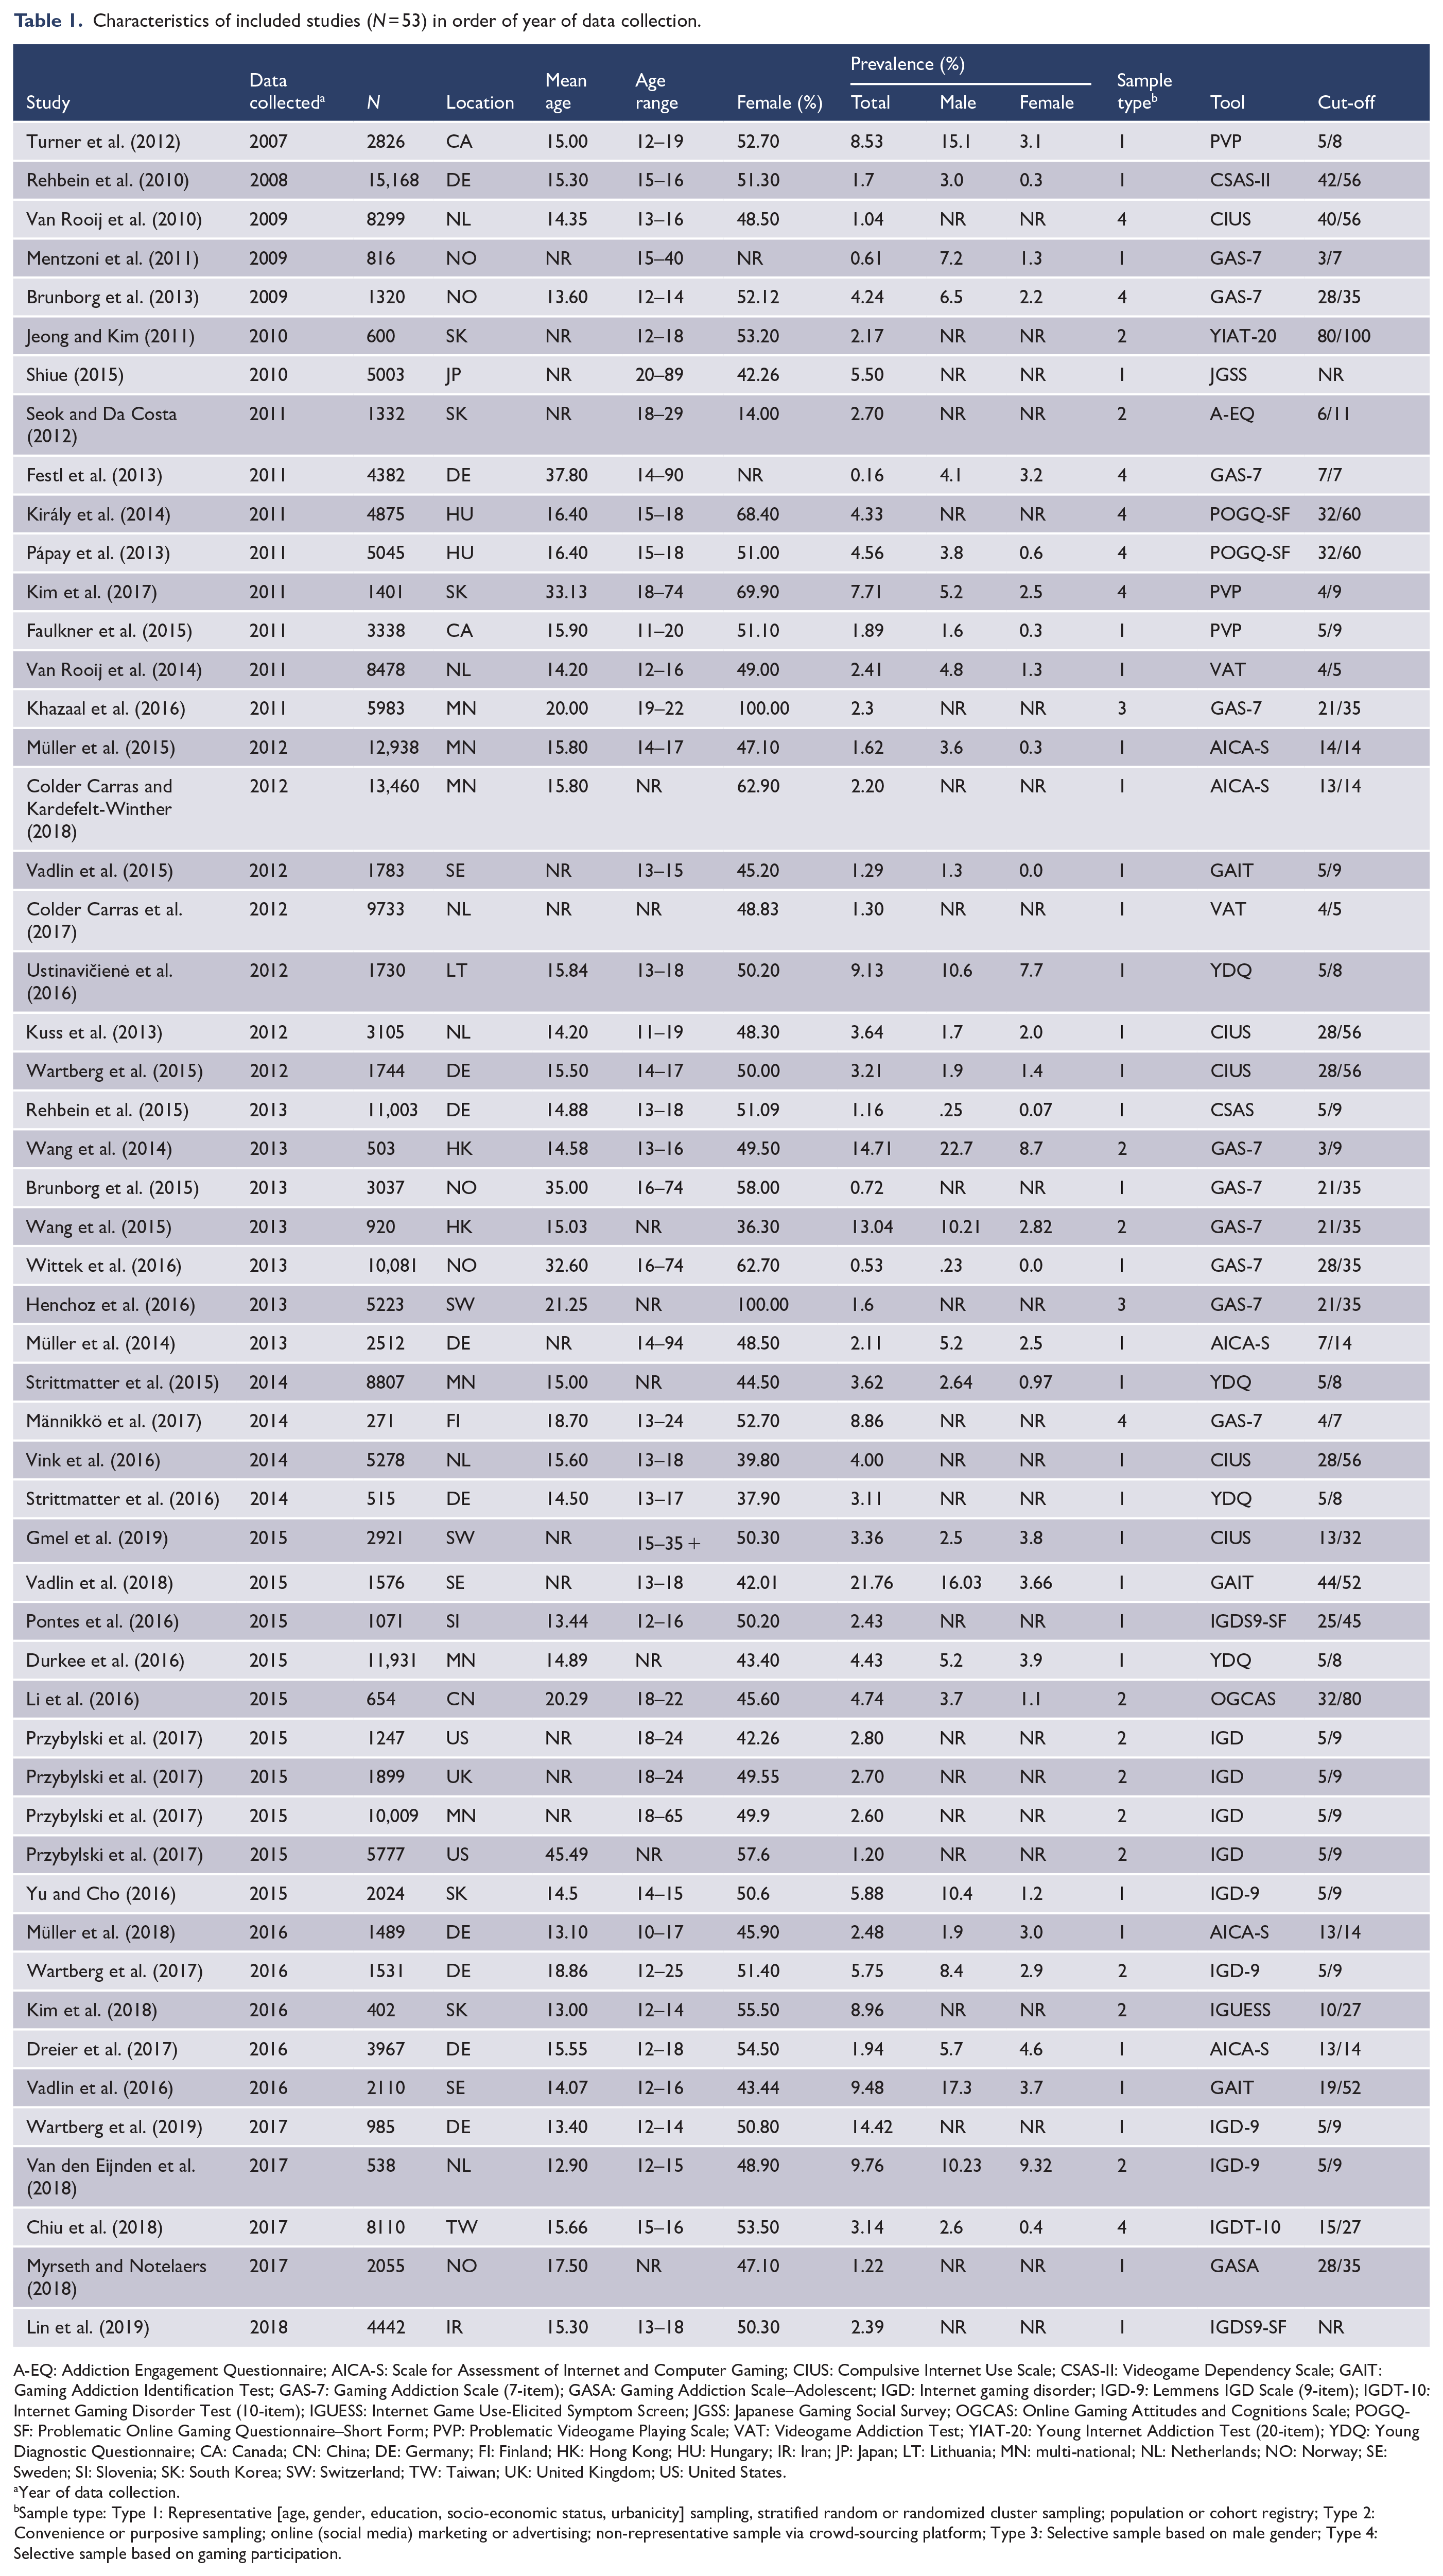
A-EQ: Addiction Engagement Questionnaire; AICA-S: Scale for Assessment of Internet and Computer Gaming; CIUS: Compulsive Internet Use Scale; CSAS-II: Videogame Dependency Scale; GAIT: Gaming Addiction Identification Test; GAS-7: Gaming Addiction Scale (7-item); GASA: Gaming Addiction Scale–Adolescent; IGD: Internet gaming disorder; IGD-9: Lemmens IGD Scale (9-item); IGDT-10: Internet Gaming Disorder Test (10-item); IGUESS: Internet Game Use-Elicited Symptom Screen; JGSS: Japanese Gaming Social Survey; OGCAS: Online Gaming Attitudes and Cognitions Scale; POGQ-SF: Problematic Online Gaming Questionnaire–Short Form; PVP: Problematic Videogame Playing Scale; VAT: Videogame Addiction Test; YIAT-20: Young Internet Addiction Test (20-item); YDQ: Young Diagnostic Questionnaire; CA: Canada; CN: China; DE: Germany; FI: Finland; HK: Hong Kong; HU: Hungary; IR: Iran; JP: Japan; LT: Lithuania; MN: multi-national; NL: Netherlands; NO: Norway; SE: Sweden; SI: Slovenia; SK: South Korea; SW: Switzerland; TW: Taiwan; UK: United Kingdom; US: United States.
Year of data collection.
Sample type: Type 1: Representative [age, gender, education, socio-economic status, urbanicity] sampling, stratified random or randomized cluster sampling; population or cohort registry; Type 2: Convenience or purposive sampling; online (social media) marketing or advertising; non-representative sample via crowd-sourcing platform; Type 3: Selective sample based on male gender; Type 4: Selective sample based on gaming participation.
Data extraction
Data of interest were extracted from each study independently and checked for agreement by two authors (M.W.R.S. and D.L.K.). The variables of interest were participants (i.e. total number of participants, and total number with GD status); age (i.e. mean age, SD and age range); gender (i.e. total number of male and female participants); prevalence (i.e. proportion of individuals with GD among the total sample; and separate prevalence rates for males and females); methodology (i.e. location and year of data collection); and assessment (i.e. screening tool and cut-off score).
Data analysis
The first aim of the review was to determine a pooled estimate for prevalence of GD based on all 53 included studies. Reported prevalence estimates were extracted from each study and checked for accuracy by dividing the number of GD cases (n) by the number of total participants (N). Where possible, calculated rates were chosen in favor of reported rates to yield more precise estimates and to reduce error caused by rounding of figures.
When prevalence estimates are small (i.e. <0.10), heterogeneity tends to be artificially inflated (Higgins and Green, 2011). To counteract the influence of heterogeneity and outliers, all prevalence estimates were transformed into logits (or log odds). By transforming prevalence estimates onto a logit scale, the data become normally distributed, centered around a mean of zero, making statistical analysis more straightforward. The formula for the logit transformation and calculating the standard error were as follows

and

In the above case, ES is the log odds of study k, where ln is the natural log, and p is the raw GD prevalence estimate; and SE is the standard error for study k, where n is the total number of participants. Pooled prevalence estimates (point estimates) and 95% confidence intervals (CIs) were calculated using a random-effects model. All analyses were conducted using the logits and then converted back to the original proportion metric. A random-effects model was selected due to handling data from diverse populations (Borenstein et al., 2011). The formula for converting back to the original proportion metric was

The degree of between-study heterogeneity, or the variance in prevalence estimate, was examined using the following two indices: Cochrane’s Q, which determines the ratio of observed variation to within-study error (Borenstein et al., 2017) and the I2 statistic, which estimates the true effect variance over sampling error observed. I2 reflects the level of inconsistency of findings across studies and is expressed as a percentage, with values of 25%, 50% and 75% indicating low, medium and high heterogeneity, respectively (Borenstein et al., 2017). All analyses were conducted using Meta-Essentials v.1.4.
Subgroup and moderator analyses were conducted to identify possible sources of heterogeneity among prevalence estimates. Studies were sorted into the following categories: sample type (Type 1: Representative [age, gender, education, socio-economic status, urbanicity] sampling, stratified random or randomized cluster sampling; population or cohort registry; Type 2: Convenience or purposive sampling; online (social media) marketing or advertising; non-representative sample via crowd-sourcing platform; Type 3: Selective sampling based on male gender; Type 4: Selective sampling based on gaming participation); assessment (i.e. assessment tool used to identify potential cases of GD); region (i.e. geographical region of data collection); and year (i.e. year of data collection). In three cases where data collection dates were not provided, the year prior to publication was substituted. Point estimates and 95% CIs were then compared for each group using a random-effects model.
Three other potential sources of variance were identified. These were age (i.e. mean age of participants); cut-off (i.e. cut-off value used to determine cases of potential GD as a percentage of total score, or as percentage of endorsed criteria); and sample size (i.e. size of the total sample). Total sample size was reported in all included studies. In studies where GD cut-off scores were not reported, the cut-off recommended by the tool’s authors was used. The number of endorsed criteria (rather than a continuous score) was used in some cases. Cut-off scores were converted to a percentage. Similarly, gender rates were manually calculated if not reported and sufficient data were available. All three variables (i.e. age, cut-off and sample-size) were first analyzed individually using univariate regression to determine the ability of each variable to predict variance in GD prevalence scores. Significant univariates were then included in a multivariate regression analysis.
Potential publication bias was also checked in this analysis. Fail-safe N’s were calculated using Rosenthal’s (1979) method. A conservative Fail-safe N was adopted for the present review. Specifically, publication bias was deemed to not be an issue if the Fail-safe N value was greater than the number of studies (k) that contributed to each analysis.
Results
Study characteristics
Table 1 presents a summary of the study characteristics. Of studies that provided demographic information, the majority included adolescent-only samples (n = 25, 47.2%) with an overall mean age of 17.55 years (SD = 6.1). Of the 53 studies, 58.5% of studies (k = 31) belonged to the Type 1 (‘representative’) sample type. There were 12 studies (22.6%) in Type 2 (‘convenience/purposive’), 8 studies (15.1%) in Type 3 (‘male only’) and 2 studies (3.8%) in Type 4 (‘gamer only’) category. The majority of studies were conducted in Europe (k = 37, 69.9%), with the Gaming Addiction Scale (7-item; GAS-7) being the most used assessment tool (k = 11, 20.8%). In terms of cut-off, the mean adjusted score was 59.8% (SD = 17.0%), which equated to endorsement of 5.3 out of 9 DSM-5 GD criteria. The lowest cut-off value was 33% (i.e. 3/9 IGD criteria) (Wang et al., 2014), with the strictest tool requiring all criteria are met or a total score of 100% (Muller et al., 2015). Most studies (81.1%) measured GD specifically (k = 43) whereas other studies measured GD either by using a tool designed for problematic internet use (PIU) (k = 4, 7.5%) or a tool for both GD and PIU (k = 6, 11.3%). In terms of ICD-11 qualifiers for GD (i.e. online/offline distinction), the most common type of GD was online-only (k = 18, 33.4%) and both online and offline forms (k = 9, 17.0%), with the other studies (49.0%) not providing sufficient information about predominantly online/offline distinctions (k = 26).
Data synthesis
Overall, the pooled prevalence of GD across the 53 studies was 3.05% (k = 53 [2.38, 3.91]). However, significant heterogeneity between estimates was detected. Subgroup and moderator analyses were conducted to explore possible sources of heterogeneity. Tables 2 and 3 present the results of subgroup and moderator analyses, respectively. Figure 1 presents a forest plot of subgroups containing at least five studies. Figure 2 provides a visual summary of the GD prevalence rate across all 53 studies, in chronological order of data collection.
Subgroup analyses of prevalence according to assessment, region and year of data collection (N = 53 studies).
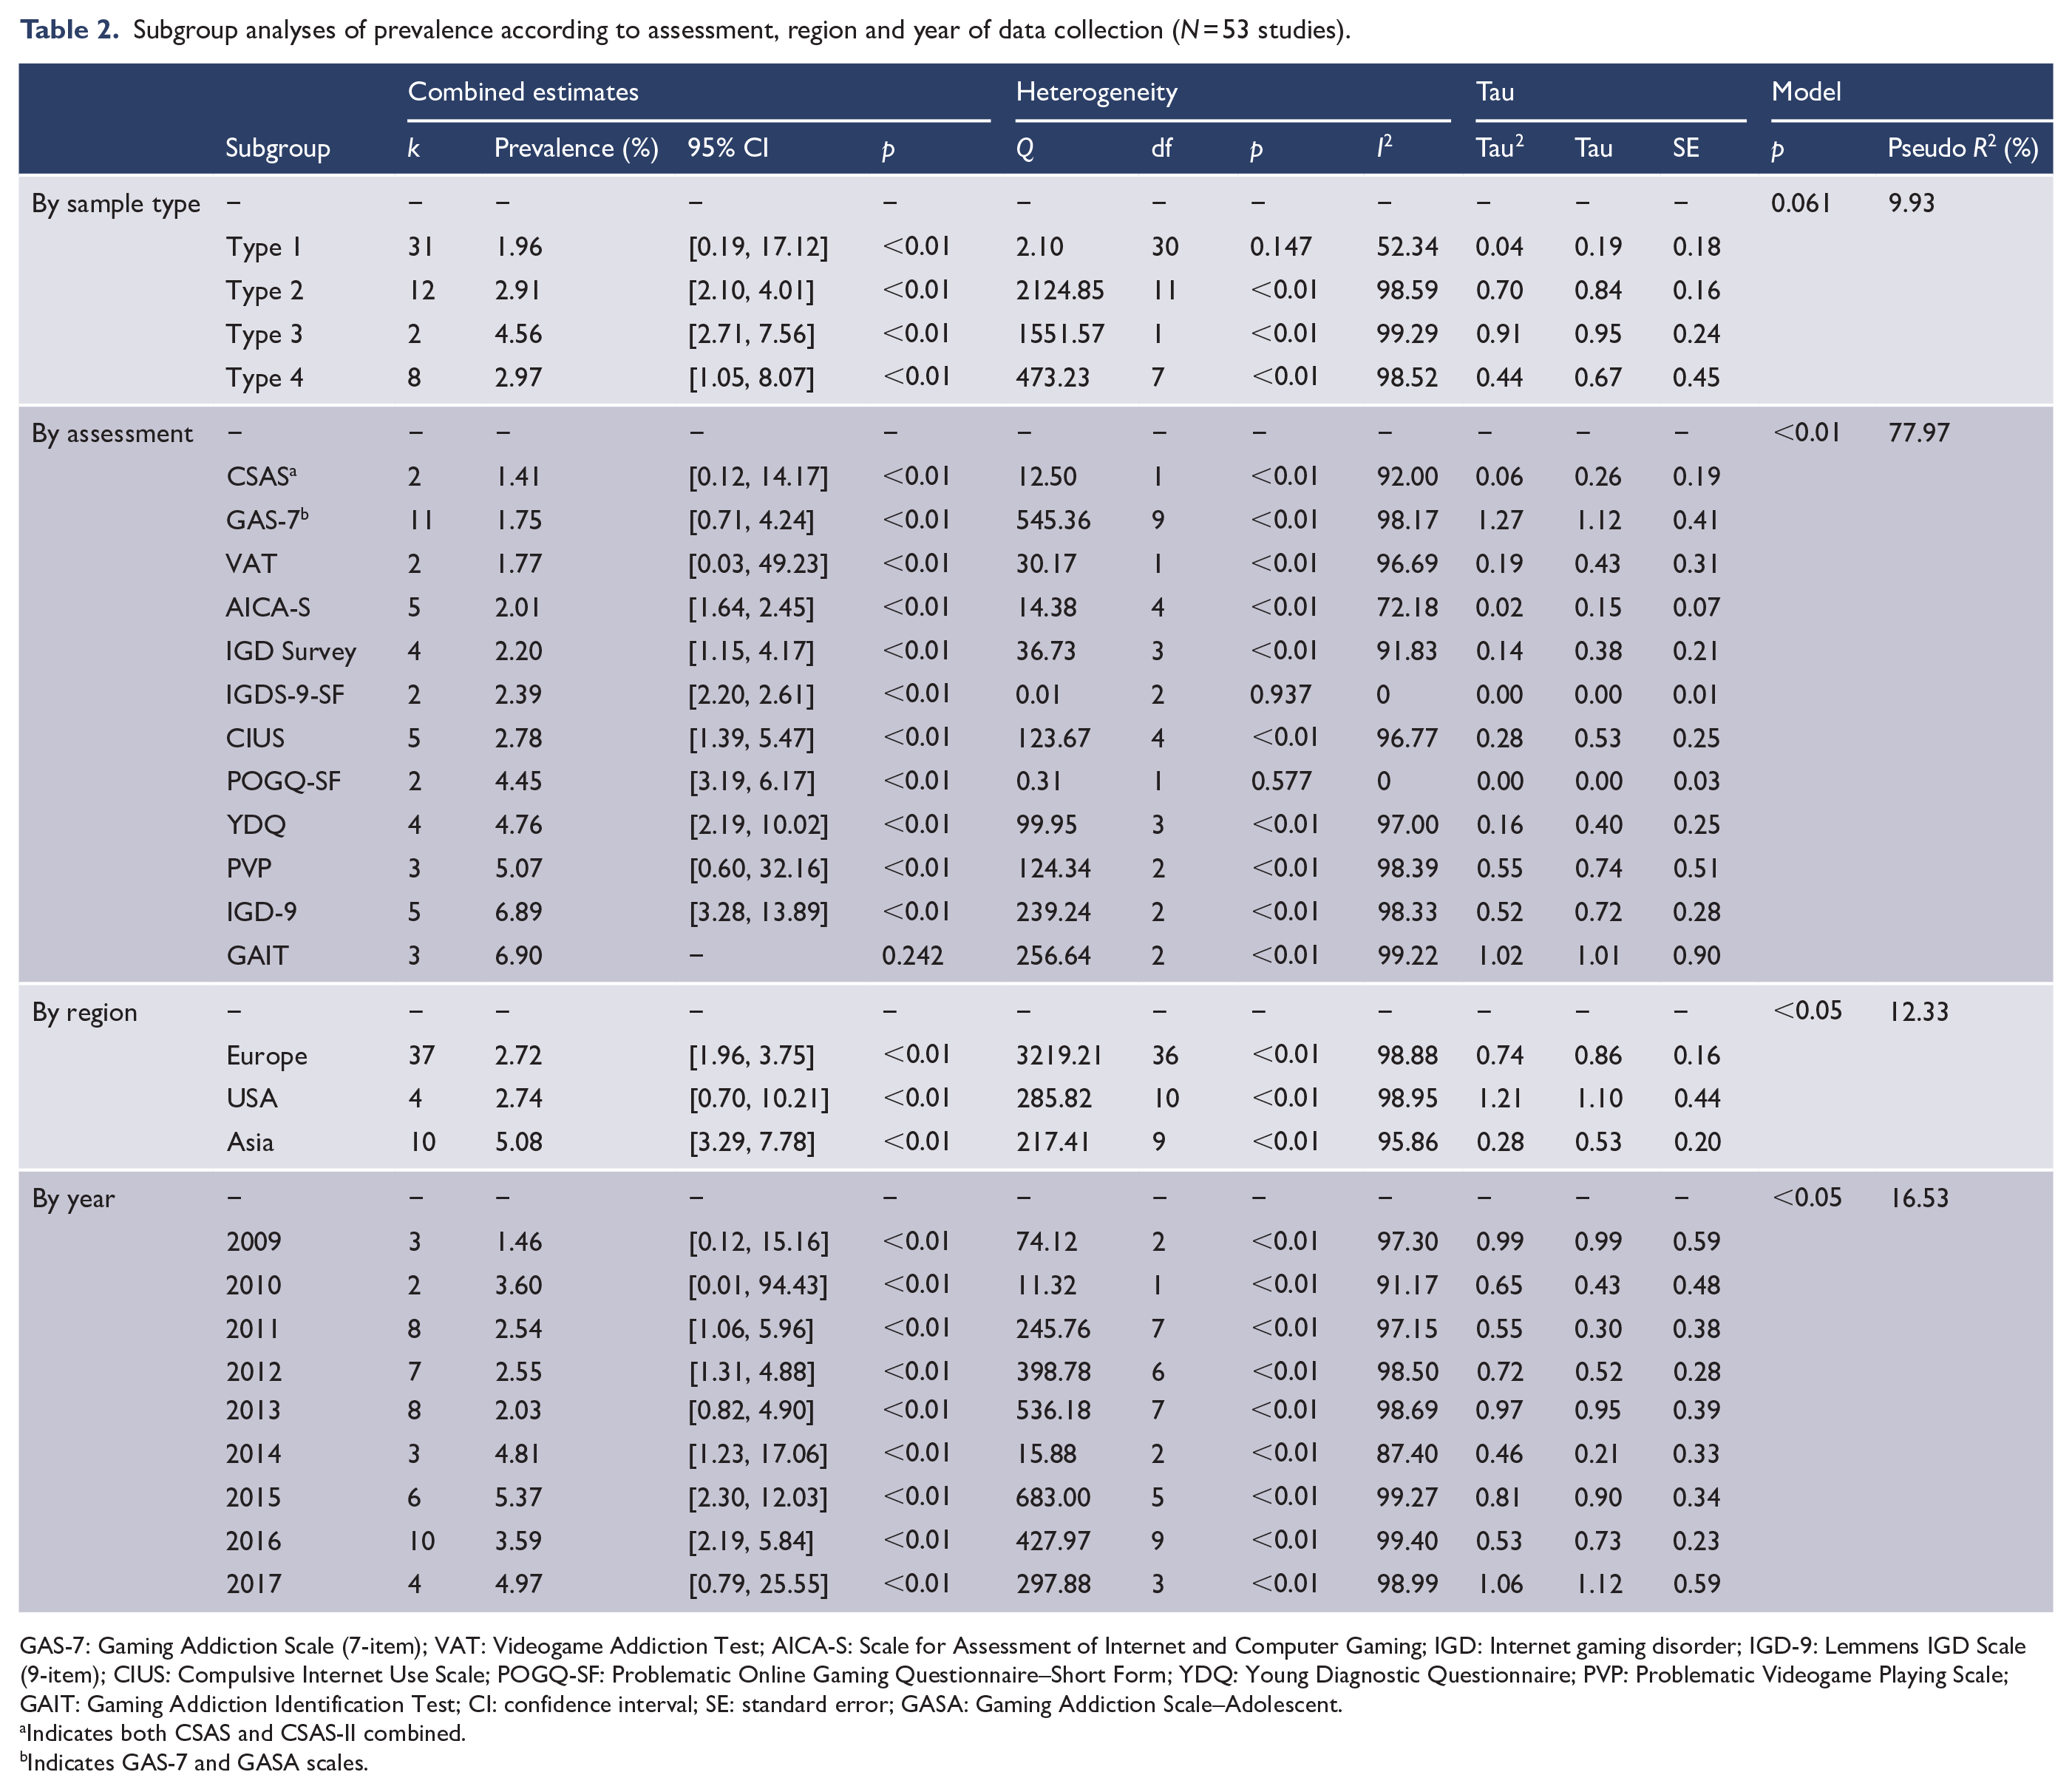
GAS-7: Gaming Addiction Scale (7-item); VAT: Videogame Addiction Test; AICA-S: Scale for Assessment of Internet and Computer Gaming; IGD: Internet gaming disorder; IGD-9: Lemmens IGD Scale (9-item); CIUS: Compulsive Internet Use Scale; POGQ-SF: Problematic Online Gaming Questionnaire–Short Form; YDQ: Young Diagnostic Questionnaire; PVP: Problematic Videogame Playing Scale; GAIT: Gaming Addiction Identification Test; CI: confidence interval; SE: standard error; GASA: Gaming Addiction Scale–Adolescent.
Indicates both CSAS and CSAS-II combined.
Indicates GAS-7 and GASA scales.
Univariate and multivariate regression analyses of prevalence according to age, tool cut-off and sample size.
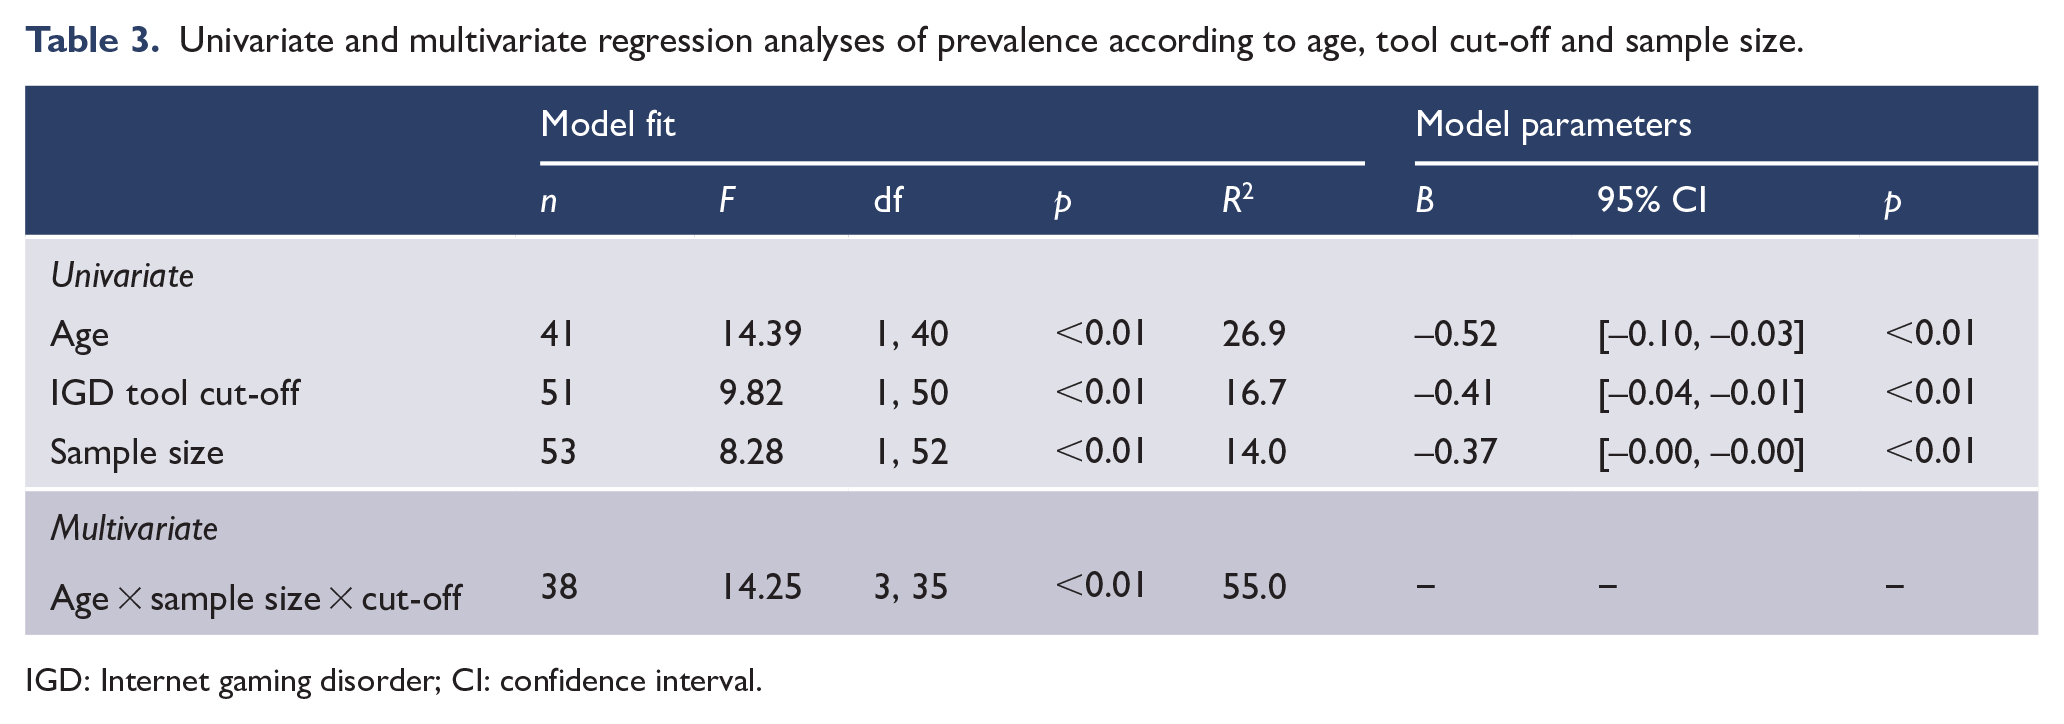
IGD: Internet gaming disorder; CI: confidence interval.
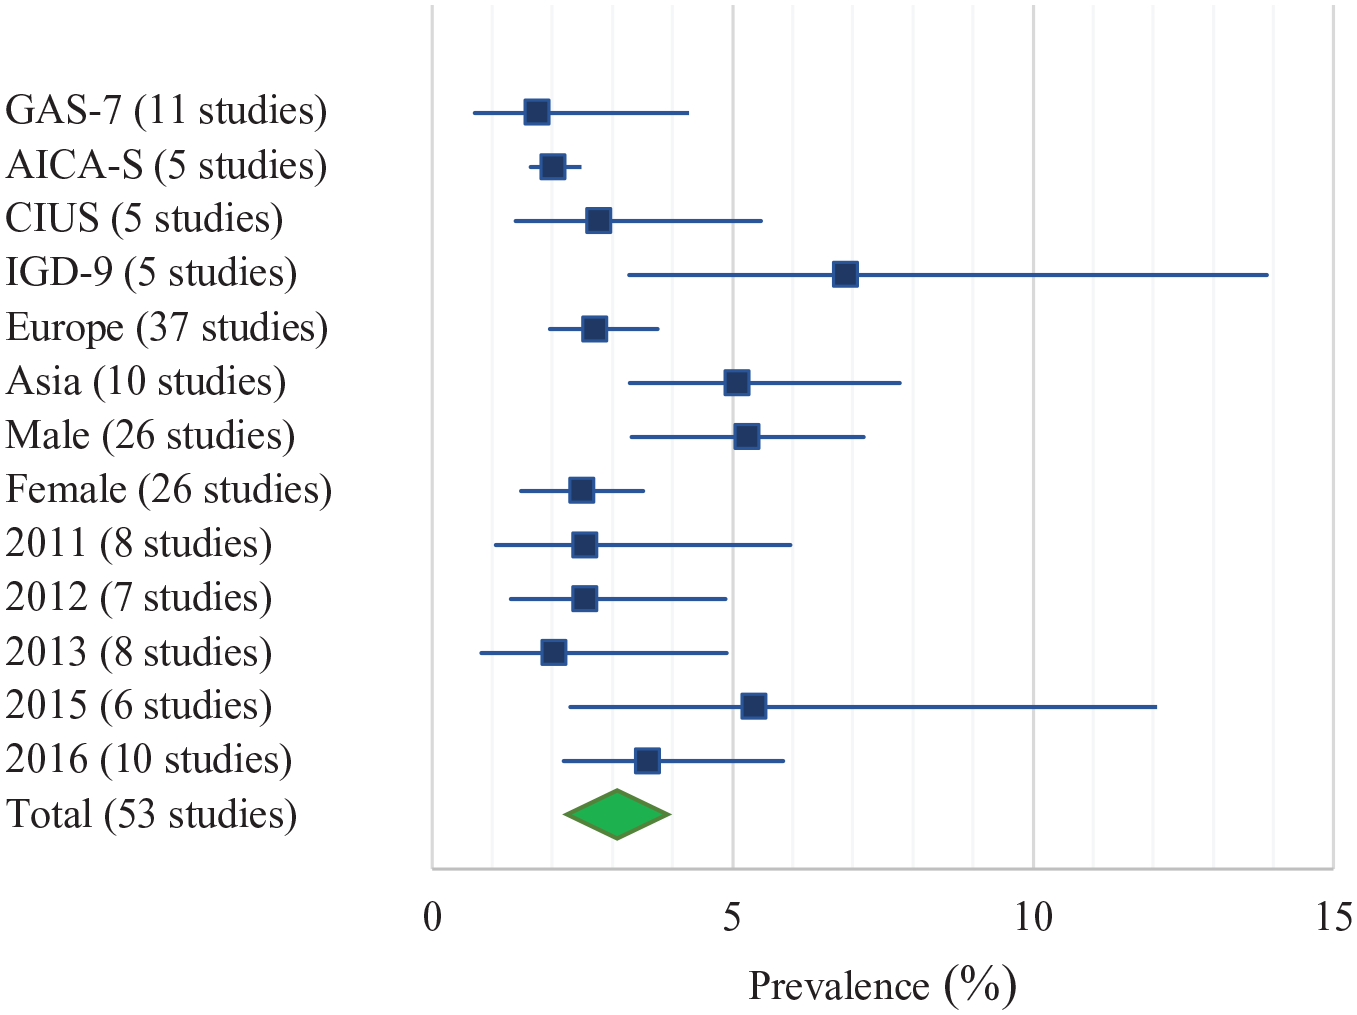
Forest plot of pooled prevalence estimates across all groups containing >5 studies.
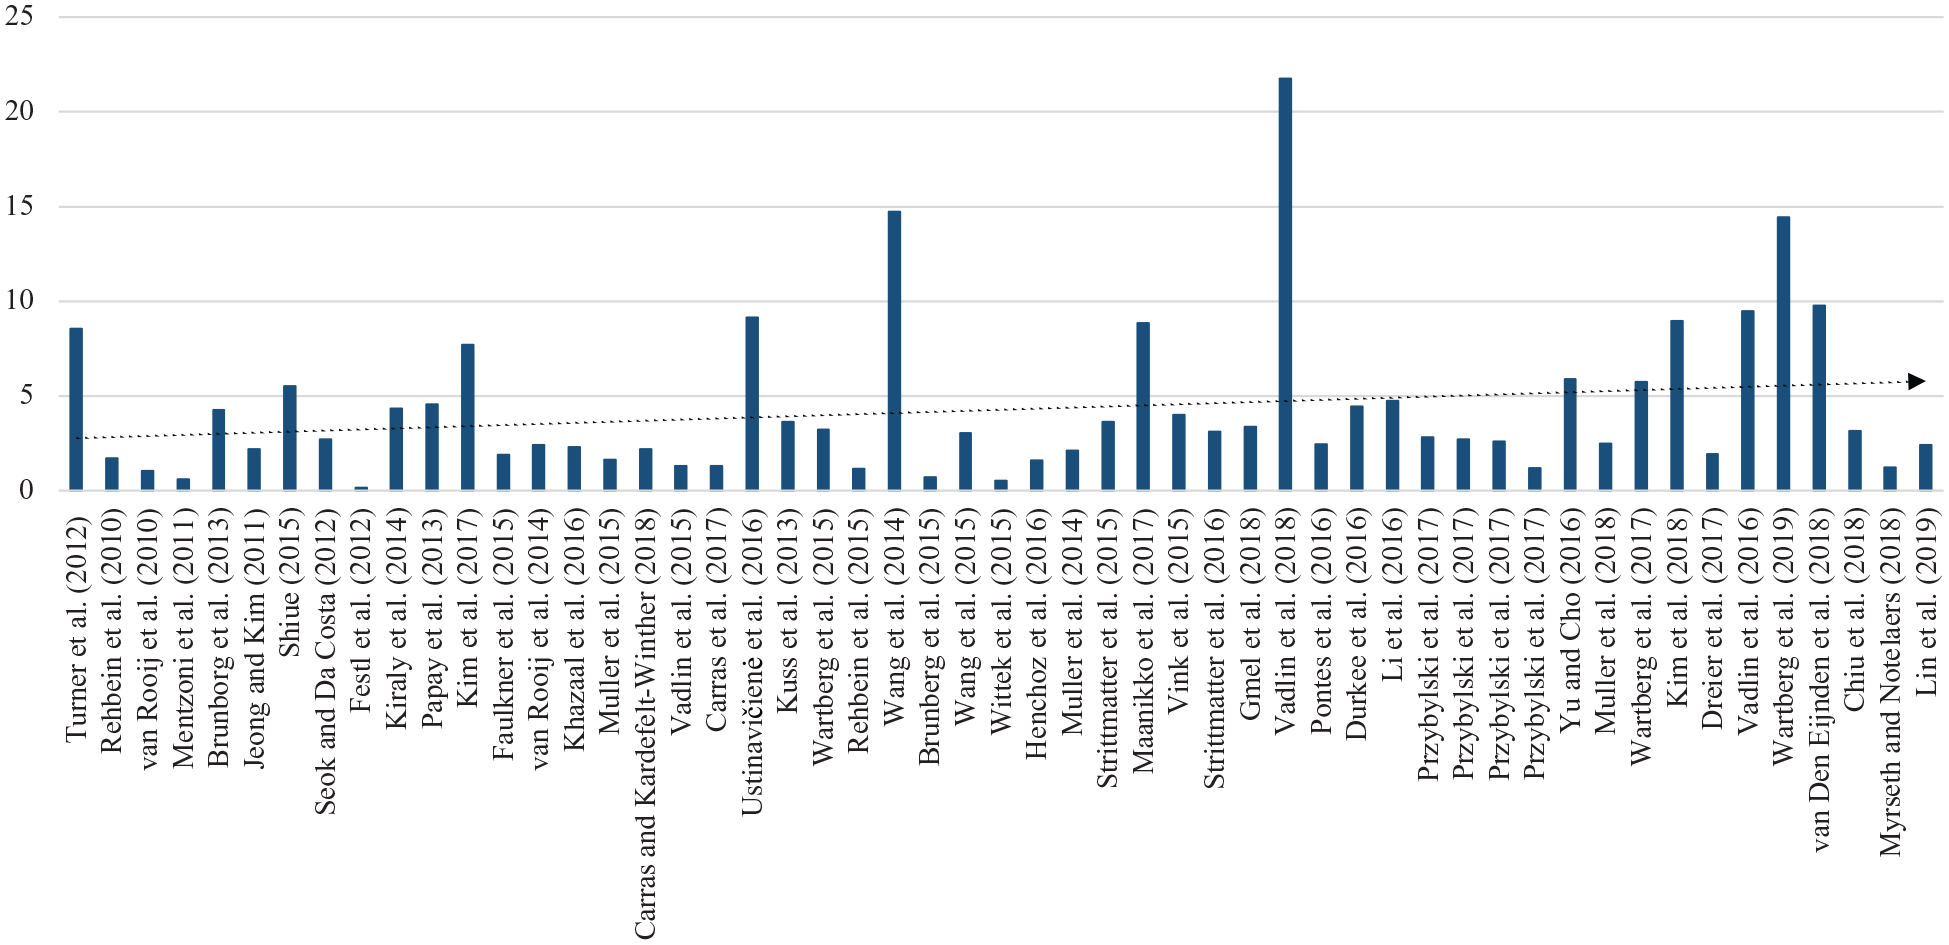
Prevalence rates in order of data collection date (publication date in parentheses).
Subgroup analyses
Sampling
Statistical heterogeneity is inevitable in meta-analysis due to the diverse range of participants and study designs (Higgins et al., 2003). A subgroup that contains significant heterogeneity indicates that the underlying populations are too diverse to be considered homogeneous. Thus, non-significant results are not necessarily more ideal than significant results; the difference lies in the interpretation. For GD prevalence according to the sample type (i.e. Types 1, 2, 3 and 4; see Data Analysis for descriptions), the point estimate for Type 1 (k = 31) was significant, with I2 estimates of heterogeneity indicating moderate heterogeneity. Types 2, 3 and 4 also had significant point estimates, with each group displaying large I2 estimates of heterogeneity. Overall, sample type explained 9.93% of the variance in prevalence rates but was only considered significant at the 0.05 level (p = 0.023). Of the three subgroups including five or more studies, Type 1 samples (k = 31) provided the lowest estimates (1.96 [0.19, 17.2]), and Type 3 (k = 8, male only) samples reported the highest pooled prevalence (4.56 [2.71, 7.56]).
Assessment
Considering GD prevalence according to assessment tool, the point estimates for all assessment tools were significant except for the Gaming Addiction Identification Test (GAIT; k = 3, p = 0.242). I2 estimates indicate heterogeneity was not detected for the Problematic Online Gaming Questionnaire–Short Form (POGQ-SF) and Internet Gaming Disorder Scale-9-Short Form (IGDS-9-SF); moderate for the Scale for Assessment of Internet and Computer Gaming (AICA-S) and high for the remaining tools. Overall, the choice of assessment tool was a significant predictor (p < 0.01) that accounted for 77.97% of the variance across prevalence estimates. Of the four subgroups including five or more studies, the GAS-7 reported the lowest prevalence estimates (1.75 [0.71, 4.24]) and the Lemmens IGD-9 reported the highest prevalence estimates (6.89 [3.28, 13.89]).
Region
For GD prevalence according to geographical region, the point estimates for Europe (k = 37), Asia (k = 10) and USA (k = 4) were significant, with each group displaying large I2 estimates of heterogeneity. Overall, study region accounted for 12.33% of the variance in prevalence rates but was only considered significant at the 0.05 level (p = 0.039). Only two subgroups contained five or more studies, of which Asia reported higher prevalence estimates (5.08 [3.29, 7.78]) than Europe (2.72 [1.96, 3.75]).
Year
For GD prevalence according to year of data collection, the point estimates for all values were significant. In all cases, I2 estimates of heterogeneity were large. Overall, year of data collection explained 16.53% of the variance in prevalence rates but was only considered significant at the 0.05 level (p = 0.012). Of the five subgroups including five or more studies, 2013 (k = 8) provided the lowest estimates (2.03 [0.82, 4.89]) and 2015 was the highest (5.37 [2.30, 12.03]).
Moderator analyses
Moderator analyses were conducted to examine possible effects of underlying univariates of participant age (k = 41), cut-off (k = 51) and sample size (k = 53). Univariate regression analysis determined that age, F(1,40) = 14.39, p = 0.001, R2 = 26.9%, cut-off, F(1,50) = 9.82, p = 0.003, R2 = 16.7%, and sample size, F(1,52) = 8.28, p = 0.006, R2 = 14.0%, were all significant predictors of GD prevalence rate. A stepwise multivariate model was then generated using age, cut-off and sample size. The model was significant, F(3,35) = 14.25, p < 0.001, R2 = 55.0%, with standardized coefficients: age (B = −0.05 [−0.08, −0.02], p = 0.001, B = −0.41); cut-off (B = −0.02 [−0.04, −0.01], p = 0.003, B = −0.41); and sample size (B = −0.00 [−0.00, −0.00], p = 0.022, B = −0.31), indicating that younger participants, smaller sample sizes and lower cut-off values predicted higher prevalence rates. Table 3 provides a summary of the meta-regression analyses.
Gender differences in GD prevalence
There were 31 studies that stratified prevalence by gender or provided sufficient information to calculate distinct prevalence rates according to gender. Gender-specific prevalence rates were included in a separate analysis. GD rates were approximately 2.5:1 in favor of males compared to females. Only 3 out of 31 studies (9.6%) reported a higher GD prevalence rate among females. Results from a one-way analysis of variance (ANOVA) were statistically significant, F(1,60) = 13.04, p = 0.001, indicating that the average GD rate was higher for male (6.31% [4.30, 8.31]) than female samples (2.54 [1.65, 3.43]).
Publication bias
No evidence of publication bias was found (Fail-safe N = 12,350), indicating 12,350 studies with null findings would need to be included in the analysis to render the true prevalence 0 (i.e. no effect).
Discussion
The purpose of this review was to determine the global prevalence of GD. To our knowledge, this work represents the largest systematic review and meta-analysis of GD prevalence rates, including a total of 226,247 participants across 17 different countries. The main findings were as follows: (1) the global pooled prevalence of GD was 3.05% (95% CI = [2.38, 3.91]), and this figure was adjusted to 1.96% (95% CI = [0.19, 17.12]) when considering only those studies which met more stringent sampling criteria (e.g. stratified random sampling); (2) prevalence estimates varied largely as a function of the GD screening tool; (3) studies with smaller sample sizes, adolescent samples and/or studies employing lower cut-off scores reported significantly higher prevalence rates; and (4) GD rates were approximately 2.5:1 in favor of males compared to females. There was also some evidence that higher prevalence rates were reported in more recent (post-2013) studies and in studies conducted in Asia as compared to Europe.
The results suggest that the global prevalence of GD (3.05%) may be comparable to some SUDs (2.6%) (Degenhardt et al., 2017) and OCD (0.6–3.5%) (Crino et al., 2005), but appears to be lower than compulsive buying (3–6%) (Maraz et al., 2016) and higher than problem gambling (close to 1%) (Calado and Griffiths, 2016). This GD prevalence rate is lower than the rate reported in Fam’s (2018) review, which appears attributable to its focus on adolescents. However, interpretation of these findings should take several factors into consideration. First, the results from subgroup analyses indicated GD prevalence estimates varied significantly according to the GD screening tool. In addition, as expected, moderator analyses identified lower cut-off scores as a significant predictor of higher prevalence rates. In some cases, cut-off scores for identifying potential cases of GD were as low as 33% of the total score. Studies employing cut-off scores lower than 50% should be treated cautiously, because these studies may inflate prevalence estimates above thresholds recommended by the DSM-5 (i.e. at least 5/9 criteria) and may be more likely to count cases without functional impairment.
Prevalence rates varied according to several study characteristics. Regression analysis identified that adolescent samples tended to report higher prevalence estimates. Higher GD prevalence among adolescents is a common finding in the literature (King et al., 2013; Mak et al., 2014; Müller et al., 2015). Given that the overall mean age of the total sample was 17.5 years (SD = 6.1), the total pooled prevalence figure may represent the peak of the distribution of GD scores. Gender was another demographic factor that affected prevalence rates in the expected direction (i.e. male bias). Consistent with previous reviews (Feng et al., 2017; Mihara and Higuchi, 2017), GD prevalence rates were found to be 2.5 times higher for males than for females. Although female prevalence rates were lower, the results suggested that female prevalence rates increased over the last decade. The average female GD prevalence rate was 1.75% in 2009 compared to 4.47% in 2017, which may be partly due to the increasing popularity of games among females, particularly for games that intersect with social media and related online activities (King and Potenza, 2020).
This review contributes to critical discussion of GD screening approaches by highlighting that GD prevalence is strongly influenced by the choice of instrument. The field has an abundance of screening tools (i.e. more than 30); many appear to be quite similar on face value but demonstrate varying psychometric properties (King et al., 2020). The relative performance of different tools according to sampling approaches warrants closer attention. This review highlights, for example, that the CSAS assessment tool has been administered exclusively in non-convenience samples and yielded the lowest prevalence estimate (1.41%). However, the GAIT was also administered in non-convenience samples, and the Lemmens IGD-9 was primarily administered (65%) in non-convenience samples, and these two tools yielded some of the highest prevalence estimates (6.90% and 6.89%, respectively). Thus, when considering prevalence rates according to tools, the effect of sampling, while relevant, does not necessarily tell the whole story.
As often the case in psychological research, it is the interaction between several factors that becomes important in understanding the bigger picture. Overall, GD prevalence was affected by the combination of small-sized and adolescent-only samples. For example, three of the five smallest studies in the present review had quite low mean ages and reported some of the highest prevalence rates (i.e. Kim et al. (2018) [8.96%, N = 402, age = 13.0 years]; Wang et al. (2014) [14.71%, N = 503, age =14.58 years]; and Van den Eijnden et al. (2018) [9.76%, N = 538, age = 12.9 years]). Such studies can contribute to the perception of GD prevalence as being unreasonably high which can then draw strong criticism of the validity of the condition. Although some studies have been described as ‘prevalence’ studies, a closer inspection of some studies reveals that their methods were not likely to yield genuinely representative data. The present review differentiated 31 studies, which we termed ‘Type 1’ studies, based on clearly identifiable representative sampling (e.g. according to age, gender, education, socio-economic status, urbanicity), stratified random or randomized cluster sampling, and population or cohort registry sampling. The pooled prevalence rate for Type 1 studies was 1.96%. However, it bears noting that, like the total sample of 53 studies, this figure had a large CI, partly due to lower cut-off scores applied in some of these studies which increased heterogeneity.
Prevalence rates were found to be higher for Asian countries than for other regions. These results support previous findings in which East Asian prevalence rates were among the highest worldwide (Fam, 2018; Long et al., 2018). The reasons for these regional differences remain unclear, but it is well-documented that gaming is very popular and considered a national pastime in regions including South Korea. The greater popularity of gaming in Asian regions is often understood with reference to the rise in popularity of esports, more abundant gaming infrastructure (i.e. 24/7 gaming cafes), and more accepting cultural attitudes toward gaming in general despite strong regulatory measures. However, methodological factors including a higher proportion of high-school survey studies conducted in those regions should be considered. There is a need for cross-cultural research on GD (i.e. comparing Eastern and Western countries) employing comparable methodological approaches, including recruitment, sampling and measurement (Rumpf et al., 2019).
Results suggest that GD prevalence has increased slightly over the last decade. In 2009, the average prevalence estimate was 1.97%, whereas estimates in 2017 averaged 4.70%. One reason for this apparent increase may be related to the adoption of the DSM-5 criteria into screening measures. The DSM-5 refers to nine criteria that include symptoms of preoccupation, tolerance and withdrawal, which have been shown to converge with highly engaged but non-problematic gaming (Charlton and Danforth, 2007). Although these criteria are listed in other addictive disorders (including gambling disorder), their inclusion in GD screening tools may lead to tests being overly sensitive. Some authors have argued that applying DSM-5 criteria to activities, including gaming and other everyday activities, may result in over-pathologization (Billieux et al., 2015). The DSM-5 approach (i.e. any five criteria, with harm not required) employed in some tools (e.g. the Lemmens IGD-9) may lead to artificially high prevalence rates that do not reflect genuine gaming-related problems. In support of this, the present review showed that the pre-2013 (i.e. pre-DSM-5) pooled prevalence estimate of GD was 2.35% compared to 4.45% post-DSM-5. As an alternative to the DSM-5, the ICD-11 guidelines refer to three GD criteria (over-prioritization of gaming, loss of control and continued use despite harm) and requires functional impairment. Therefore, future studies adopting the ICD-11 approach may be expected to report lower prevalence figures which may not necessarily reflect an actual decrease in prevalence rate. This potential decrease (due to the ICD-11 approach) should be anticipated by policymakers and public health authorities in evaluating the GD-related burden in populations over time, or in evaluating effects of potential GD preventive countermeasures (King and Delfabbro, 2017). On the contrary, there may be a general increase in gaming and associated problem gaming in the context of the COVID-19 pandemic (i.e. due to stay-at-home mandates and lockdowns) which may counteract this potential decrease (King et al., 2020c; Király et al., 2020).
The main strength of the present review was its scope. This meta-analysis was the largest to date, including 53 studies and 226,247 participants across 17 different countries. However, some limitations warrant acknowledgment. First, some of the subgroup analyses may have been underpowered. The Cochrane Handbook recommends the inclusion of at least 10 studies for each continuous variable in subgroup analyses (Higgins and Green, 2011). However, Fu et al. (2011) contend that between 6 and 10 studies is sufficient. Differences in sampling approaches were another potential limitation to the present review. Some studies did not provide detailed information about their sampling methods, which affected the designation of some studies to the four types of sampling. Another limitation is that only English-language studies were included, which affected the representativeness of cross-cultural comparisons. This review only included peer-reviewed studies; gray literature was not included, which may have excluded some important studies, such as those published in government reports. The relative number of adolescent samples also affects the overall representativeness of the data. About half of the studies did not report whether gaming occurred predominantly online versus offline or both (i.e. ICD-11 category distinctions).
As the GD evidence base continues to grow, it would be helpful for future reviews that consider prevalence rates to consider some additional variables. Specifically, this work could examine the potential effects of sampling methodologies in more detail (e.g. school-based samples, online convenience sampling and crowd-sourced data, such as Amazon MTurk). Another issue for consideration is the influence of comorbidity, for example, axis I disorders, other addictive disorders. A stronger focus on gaming-related harm (see Delfabbro et al., 2020; King and Delfabbro, 2018) to gain insights into genuine harm and functional impairment would strengthen future studies and meta-analyses.
Conclusion
This review found that the worldwide prevalence of GD was 3.05% (CI: [2.38, 3.91]) and this rate reduced to 1.96% [0.19, 17.12] when considering only those studies that met more stringent sampling criteria (e.g. stratified random sampling). However, given the larger proportion of adolescent samples in this evidence base, these prevalence rates may be substantially lower among other demographic groups. The results indicated that the choice of assessment tool accounted for a large proportion of the variance in GD prevalence. Furthermore, higher GD rates were found among adolescents and males, as well as in studies employing smaller sample sizes or lower cut-offs. This review affirms previous observations of the varied methodological approaches employed in GD research (King et al., 2020b; Zajac et al., 2017) and was consistent with Mihara and Higuchi’s (2017) observation that variability in GD screening greatly affects comparability of studies of prevalence. Future epidemiological research should apply standardized approaches to GD screening and report more detailed information on sampling. Given that much of the variability in prevalence is related to screening, a potentially helpful next step for the global GD research agenda would be to conduct studies employing cognitive interviews to gain insights into how people are interpreting screening questions or whether classifications based on screening instruments stand up to independent clinical review of the same cases. Future research should also consider the potential effect of other factors including the role of comorbidity and different types of games (Green et al., 2020; King et al., 2019a, 2019b).
Footnotes
Author Contributions
M.W.R.S. and D.L.K. designed the review and conducted literature searches and provided summaries of the identified content. M.W.R.S. and D.D. conducted the meta-analysis. M.W.R.S. wrote the first draft of the manuscript, and all authors contributed to and approved the final manuscript.
Declaration of Conflicting Interests
The author(s) declared no potential conflicts of interest with respect to the research, authorship and/or publication of this article.
Funding
The author(s) disclosed receipt of the following financial support for the research, authorship and/or publication of this article: This work received financial support from a Discovery Early Career Researcher Award (DECRA) DE170101198 funded by the Australian Research Council (ARC).