
Abstract
Background:
Clinical staging is a paradigm in which stages of disease progression are identified; these, in turn, have prognostic value. A staging model that enables the prediction of long-term course in anxiety disorders is currently unavailable but much needed as course trajectories are highly heterogenic. This study therefore tailored a heuristic staging model to anxiety disorders and assessed its validity.
Methods:
A clinical staging model was tailored to anxiety disorders, distinguishing nine stages of disease progression varying from subclinical stages (0, 1A, 1B) to clinical stages (2A–4B). At-risk subjects and subjects with anxiety disorders (n = 2352) from the longitudinal Netherlands Study of Depression and Anxiety were assigned to these nine stages. The model’s validity was assessed by comparing baseline (construct validity) and 2-year, 4-year and 6-year follow-up (predictive validity) differences in anxiety severity measures across stages. Differences in depression severity and disability were assessed as secondary outcome measures.
Results:
Results showed that the anxiety disorder staging model has construct and predictive validity. At baseline, differences in anxiety severity, social avoidance behaviors, agoraphobic avoidance behaviors, worrying, depressive symptoms and levels of disability existed across all stages (all p-values < 0.001). Over time, these differences between stages remained present until the 6-year follow-up. Differences across stages followed a linear trend in all analyses: higher stages were characterized by the worst outcomes. Regarding the stages, subjects with psychiatric comorbidity (stages 2B, 3B, 4B) showed a deteriorated course compared with those without comorbidity (stages 2A, 3A, 4A).
Conclusion:
A clinical staging tool would be useful in clinical practice to predict disease course in anxiety disorders.
Introduction
Anxiety disorders are characterized by highly heterogenic course trajectories. The longitudinal course of anxiety disorders is characterized as ‘chronic’ in almost 60% of the cases after 2 years (Batelaan et al., 2014) and in 20–60% of the cases after 12 years (Bruce et al., 2005). In contrast, another subset of anxiety disorder patients experience a mild course with moderate symptom severity and lower subjective need for care (Batelaan et al., 2014; van Beljouw et al., 2010). Information on prognosis is essential to tailor treatment to individual needs. However, such information is not provided by a Diagnostic and Statistical Manual of Mental Disorders (DSM) classification. Any tool that contributes to course prediction in anxiety disorders would be of great clinical relevance (Cosci and Fava, 2013; Fava and Kellner, 1993; Scott et al., 2013).
In clinical staging, stages are distinguished that reflect increasing levels of disease progression. Disorders of individual patients are assigned to a certain stage according to their risk profile. One of the most widely recognized clinical staging models for psychiatric disorders is the heuristic model developed by McGorry and colleagues (Hickie et al., 2013; McGorry et al., 2006). This model covers the spectrum from asymptomatic, at-risk subjects (stage 0) to severe, chronic illness (stage 4). This model showed some promise in predicting the longitudinal course in adolescents seeking help for a variety of psychiatric disorders and in adults with major depressive disorder (MDD; Hickie et al., 2013; Verduijn et al., 2015). A study in young adults who presented with social anxiety showed clinical applicability (Clarke et al., 2012). Until now, no staging model has been studied empirically in adult patients with anxiety disorders.
In this study, we tailored McGorry’s staging model to anxiety disorders and examined its validity in a heterogeneous anxiety disorder sample. For a staging model to be valid, two assumptions must be met: (1) with each successive stage, probabilities of unfavorable disease markers should increase; (2) with each successive stage, longitudinal course should worsen (Scott et al., 2013). The first assumption was tested cross-sectionally (construct validity), while the second assumption was tested with longitudinal data (predictive validity). In these comparisons, we distinguished two sets of validators: (1) anxiety severity measures and (2) general psychopathology measures. These sets of validators were chosen as the symptoms for anxiety disorders often overlap with those in other common mental disorders. We hypothesized that distributions of construct and predictive validators in our model would show linearity across stages with increasing baseline and follow-up severity in higher stages. This would implicate that the model is valid. If a staging model in anxiety disorders appears to be valid, treatment guidelines could be improved by differentiating treatment according to the level of disease progression (e.g. Andrews et al., 2018; Bandelow et al., 2008; National Institute for Health and Clinical Excellence, 2013).
Methods
Sample
Data were derived from the Netherlands Study of Depression and Anxiety (NESDA), a naturalistic longitudinal cohort study, using a sample (n = 2981) that is representative of the various developmental stages of depression and anxiety (Penninx et al., 2008). An extensive description of the study design for NESDA is provided elsewhere (Penninx et al., 2008).
For the purpose of this study, we included subjects with anxiety disorders (n = 1305). Subjects without anxiety disorders were included if they had risk factors for development of anxiety disorders (n = 1115; see below for definition). Healthy controls without risk factors were excluded (n = 156). Subjects with a diagnosis of MDD were excluded if they did not have an anxiety disorder (n = 396). Subjects with missing data (n = 77) were also excluded. The total sample size for this study was n = 2352. Of these, 2042 (86.8%) were reassessed after 2 years (T2), 1895 (80.6%) after 4 years (T4) and 1772 (75.3%) after 6 years of follow-up (T6).
Measurements
Clinical staging model
This study was based on a staging model developed by McGorry and colleagues, which we tailored to anxiety disorders (Hickie et al., 2013; McGorry et al., 2006). The subjects were assigned to a certain stage in the staging model, based on their baseline measurements. The different stages included stage 0 (asymptomatic), 1A (nonspecific symptoms), 1B (attenuated syndromes), 2A (discrete disorder), 2B (discrete disorder with comorbidity), 3A (intermittent symptoms), 3B (intermittent symptoms with comorbidity), 4A (chronic symptoms) and 4B (chronic symptoms with comorbidity).
Stages 0, 1A and 1B were labeled ‘subclinical’ stages and were assigned in subjects without Diagnostic and Statistical Manual of Mental Disorders (4th ed.; DSM-IV) anxiety disorders but who did have at least one risk factor for developing an anxiety disorder. Three risk factors for developing an anxiety disorder were derived from the literature: lifetime history of anxiety disorders (Batelaan et al., 2010; Moreno-Peral et al., 2014), exposure to childhood trauma (Graaf et al., 2002; Macmillan et al., 2001; Moreno-Peral et al., 2014) and family history for psychiatric disorders (Hyland et al., 2016; Moreno-Peral et al., 2014). Stage 0 was assigned to subjects with low symptom severity, stage 1A to subjects with mild to moderate symptom severity and stage 1B to subjects with moderate to severe symptom severity. Stages 2 through 4 were labeled the ‘clinical’ stages. We assigned subjects to stages 2, 3 or 4 when they had any current DSM-IV anxiety disorder: panic disorder, panic disorder with agoraphobia, agoraphobia, generalized anxiety disorder or social anxiety disorder. Subjects with a non-chronic duration prior to baseline measurements were assigned to stage 2, subjects with an intermittent duration prior to baseline measurements to stage 3 and subjects with a chronic duration prior to baseline measurements to stage 4. We adapted McGorry’s model to account for the presence of psychiatric comorbidity (e.g. MDD, alcohol dependency) for two reasons. First, anxiety often co-occurs with these comorbidities (Lamers et al., 2011), and second, these comorbidities strongly predict a worse course in anxiety disorders (Batelaan et al., 2014; Bruce et al., 2005). Subjects with comorbid MDD, dysthymia or alcohol dependency were assigned to ‘B’ substages. See Table 1 for explicit assignment criteria and Figure 1 for a flowchart. See the supplementary material for full information on the measurement instruments as well as the rationale behind the cut-off values used in stage assignment.
Adaptation of the staging model.
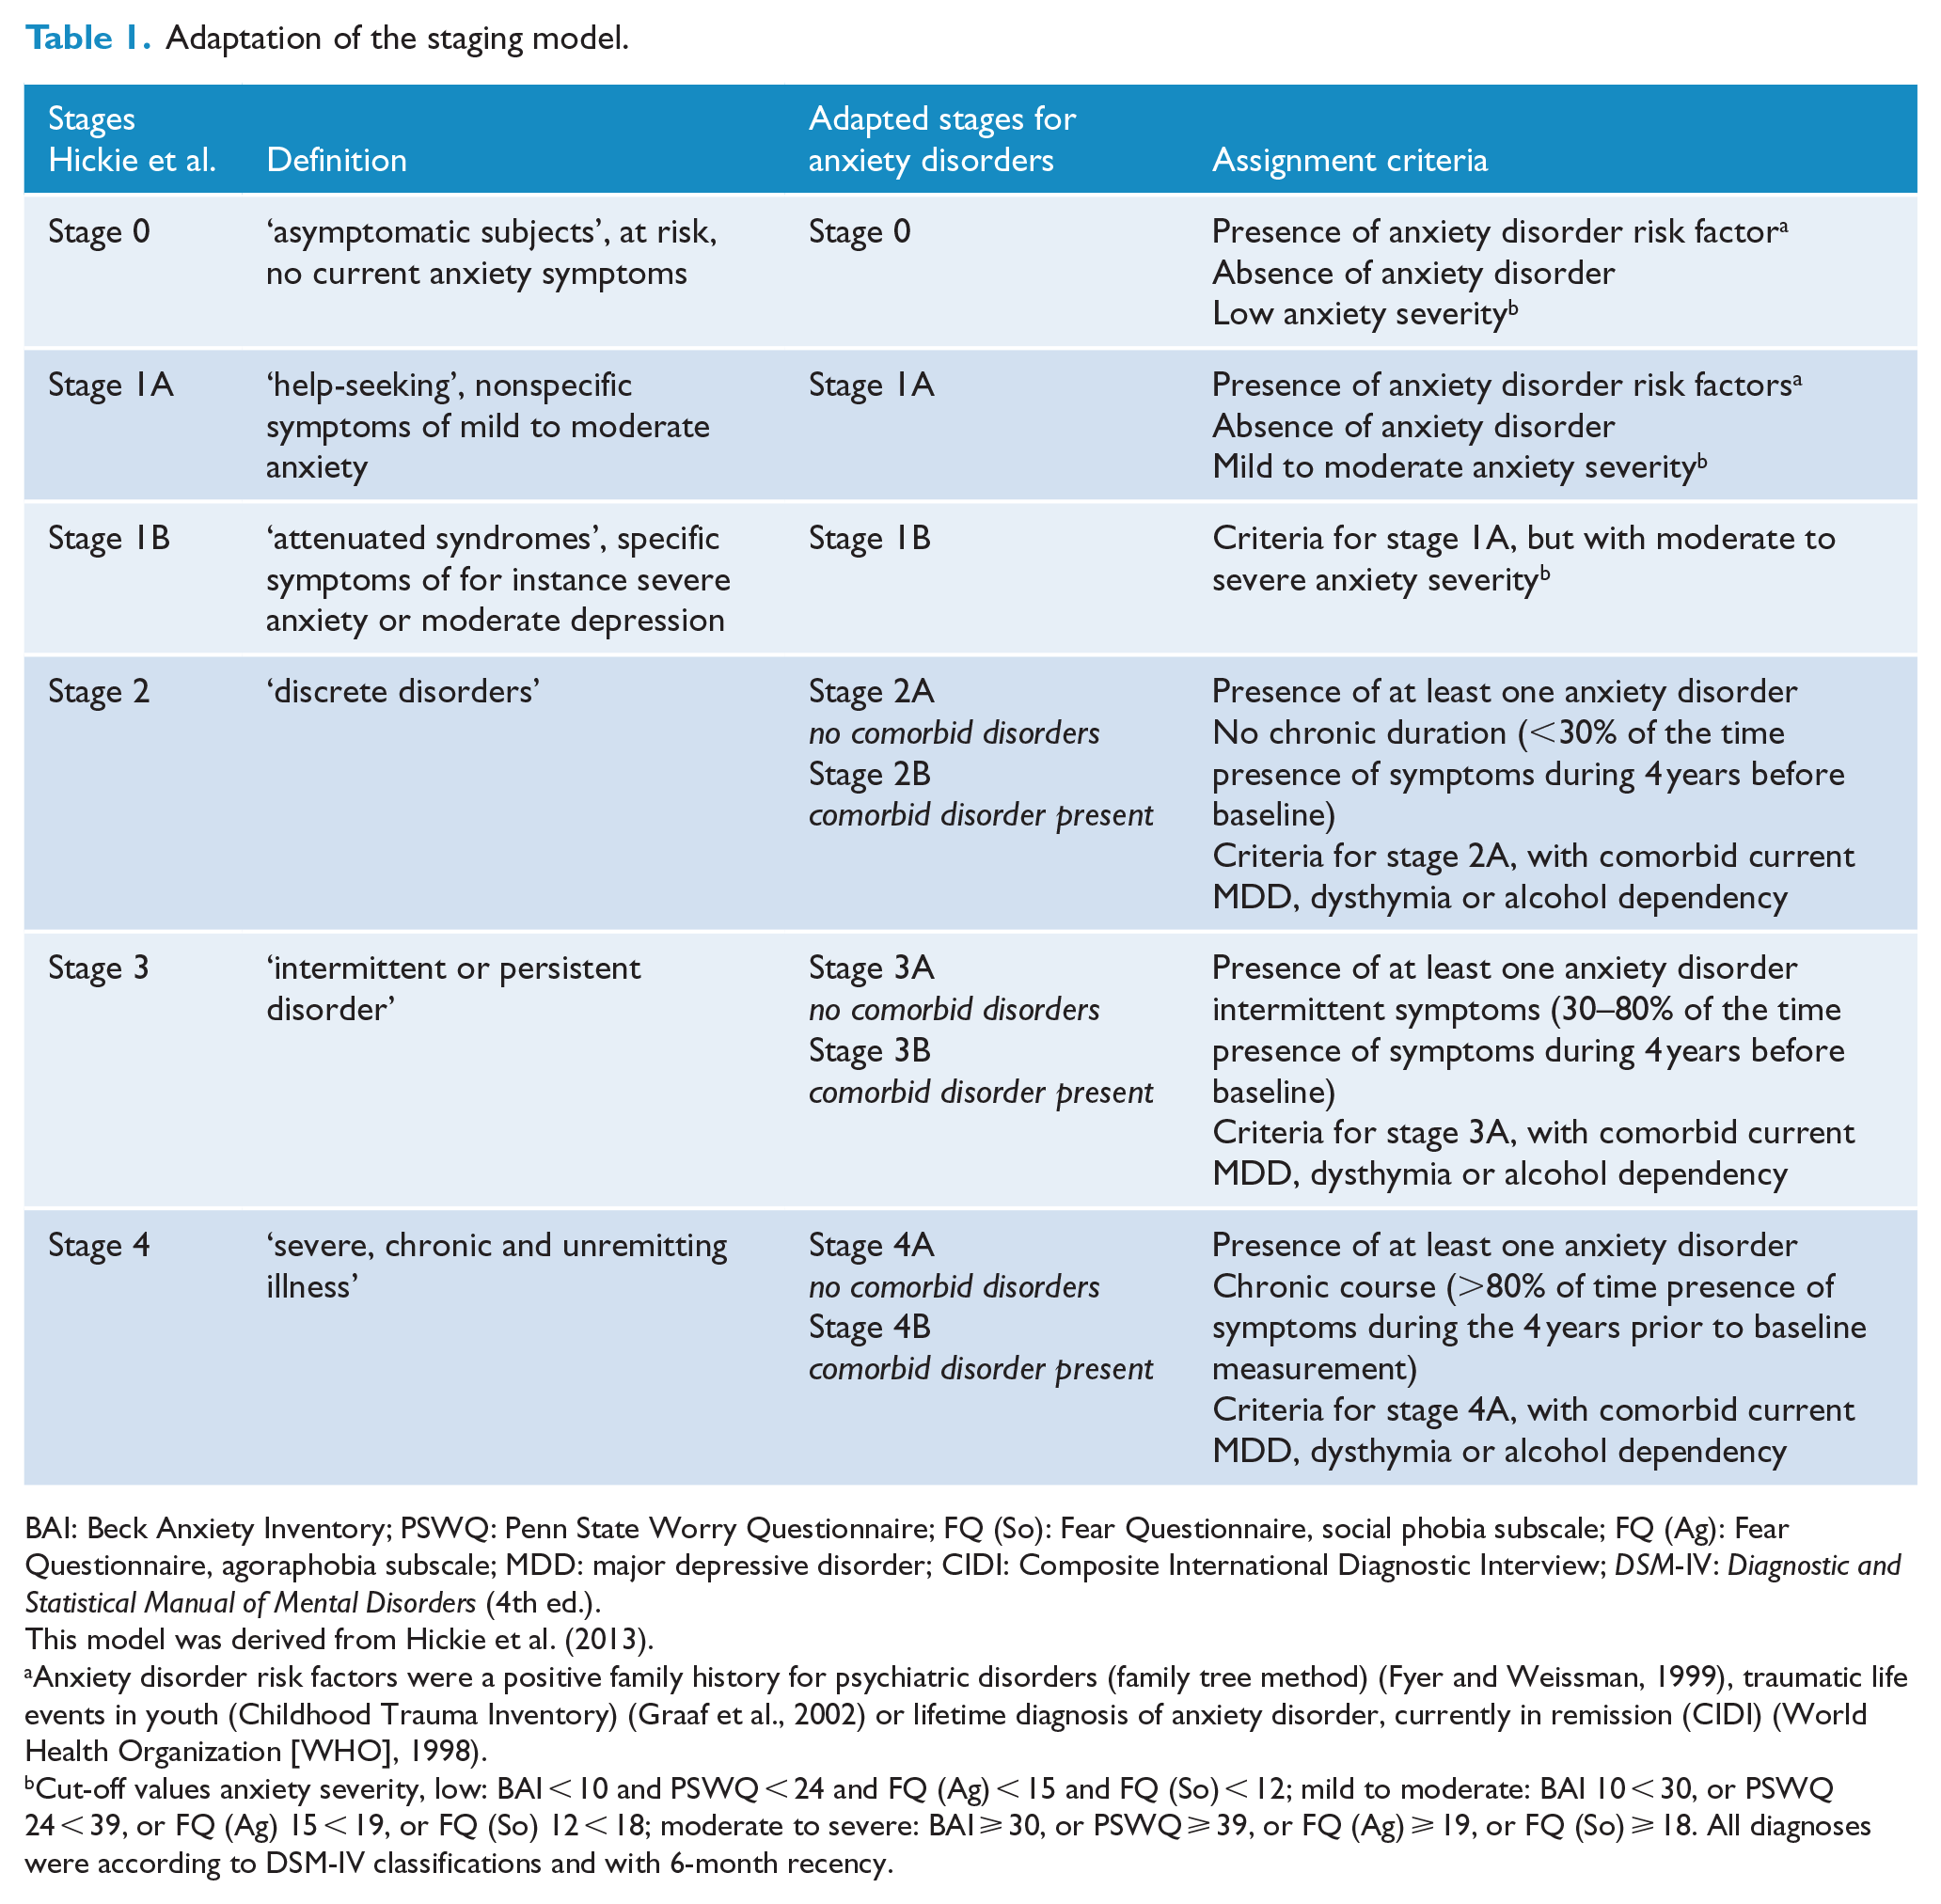
BAI: Beck Anxiety Inventory; PSWQ: Penn State Worry Questionnaire; FQ (So): Fear Questionnaire, social phobia subscale; FQ (Ag): Fear Questionnaire, agoraphobia subscale; MDD: major depressive disorder; CIDI: Composite International Diagnostic Interview; DSM-IV: Diagnostic and Statistical Manual of Mental Disorders (4th ed.).
This model was derived from Hickie et al. (2013).
Anxiety disorder risk factors were a positive family history for psychiatric disorders (family tree method) (Fyer and Weissman, 1999), traumatic life events in youth (Childhood Trauma Inventory) (Graaf et al., 2002) or lifetime diagnosis of anxiety disorder, currently in remission (CIDI) (World Health Organization [WHO], 1998).
Cut-off values anxiety severity, low: BAI < 10 and PSWQ < 24 and FQ (Ag) < 15 and FQ (So) < 12; mild to moderate: BAI 10 < 30, or PSWQ 24 < 39, or FQ (Ag) 15 < 19, or FQ (So) 12 < 18; moderate to severe: BAI ⩾ 30, or PSWQ ⩾ 39, or FQ (Ag) ⩾ 19, or FQ (So) ⩾ 18. All diagnoses were according to DSM-IV classifications and with 6-month recency.
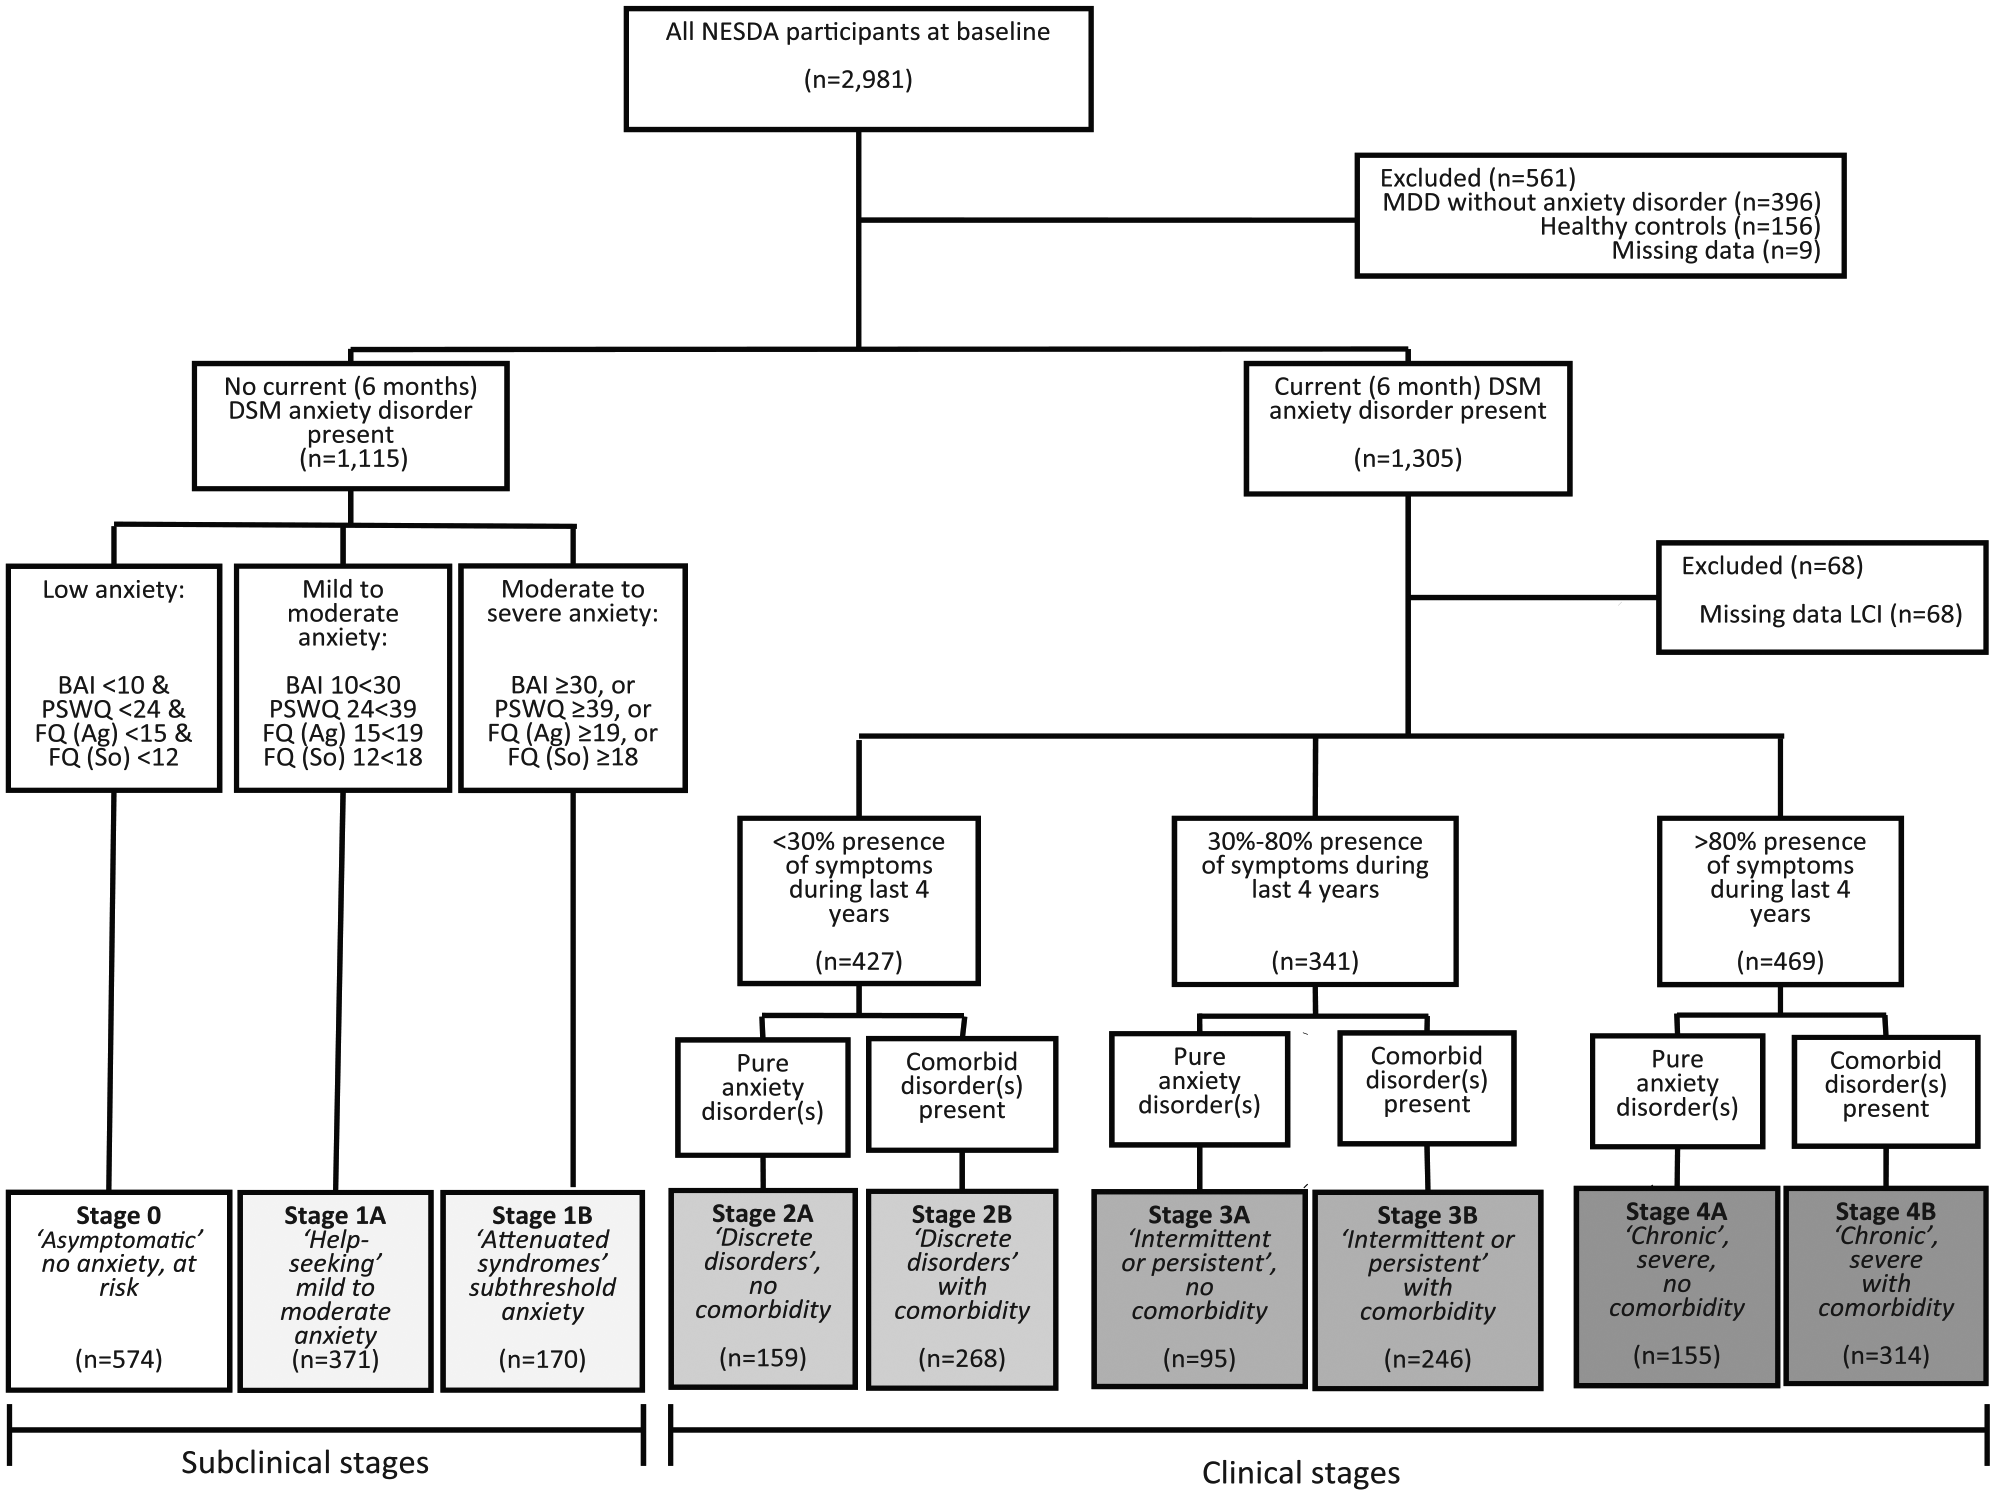
Flowchart for inclusion and assignment to stages.
Instruments used for stage assignment
The World Health Organization (WHO) Composite International Diagnostic Interview (CIDI, version 2.1) was used at baseline to assess lifetime history of anxiety disorders, family history for psychiatric disorders, presence of DSM-IV panic disorder, panic disorder with agoraphobia, agoraphobia, generalized anxiety disorder, social anxiety disorder, MDD, dysthymia and alcohol dependency (6-month recency) and age of onset for these disorders. The CIDI is a structured interview with good reliability and validity (WHO, 1998).
Duration of anxiety and avoidance symptoms during the last 4 years prior to baseline were assessed with the Life Chart Interview (LCI), a structured retrospective interview using a calendar approach (Lyketsos et al., 1994). The LCI has adequate reliability and validity (Warshaw et al., 1994). We calculated proportional scores reflecting the duration of anxiety or avoidance symptoms: ‘not chronic’ (<30% of months in previous 4 years), ‘intermittent’ (30–80% of months in previous 4 years) and ‘chronic’ (>80% of months in previous 4 years).
Validators
Two sets of outcome measures were used to assess construct and predictive validity: (1) anxiety severity measures (main outcome measure) and (2) general psychopathology measures (depression severity and disability: secondary outcome measure). The latter were included since longitudinal anxiety course is known to show high levels of comorbidity with depression and because remission of symptoms does not always indicate that the subject has recovered from the disability (Bystritsky, 2006; Hovenkamp-Hermelink et al., 2016; Iancu et al., 2014; Lamers et al., 2011; Scholten et al., 2016).
Construct validation
Baseline measures were used to assess construct validity. Severity of anxiety was measured with the Beck Anxiety Inventory (BAI), a 21-item self-report questionnaire (Beck et al., 1988). Severity of avoidance behaviors was measured with the Fear Questionnaire (FQ), a 15-item self-report questionnaire (Marks and Mathews, 1979). For the purpose of this study, two of its subscales were used: agoraphobic avoidance (FQ Ag) and social avoidance (FQ So). Severity of pathological worrying was assessed using the 11-item self-report version of the Penn State Worry Questionnaire (PSWQ) (Drost et al., 2012). Depressive symptoms were measured with the Inventory of Depressive Symptomatology-SR (IDS), a self-report questionnaire on severity of depression (Rush et al., 1996). Levels of disability were measured with the WHO Disability Assessment Schedule (WHO DAS II), a 36-item self-report questionnaire measuring levels of disability (Chwastiak and Von Korff, 2003).
Predictive validation
At 2-year, 4-year and 6-year follow-up, all these measurements were repeated to assess predictive validity. Furthermore, at these time-points, presence of any anxiety disorder and presence of any psychiatric disorder (anxiety disorder, MDD, dysthymia or alcohol dependency) were used to assess predictive validity.
Statistical analyses
Construct validity analyses
After assigning subjects to stages, baseline clinical characteristics and construct validators in our sample were compared using Pearson chi-square statistics for dichotomous variables and one-way analyses of variance (ANOVAs) for continuous variables. In addition, Mantel Haenszel’s trend analyses and (Wilcoxon type of) nonparametric tests for trend across ordered groups (Cuzick, 1985) were performed to investigate whether an increase across stages could be demonstrated while taking the ordinal distributions of the staging model into account. We applied Bonferroni correction, α(corrected) = α/k hypotheses, for the 10 construct-validator statistical tests. This yielded an α(corrected) of 0.05/10 = 0.005. To ensure that attrition from the cohort did not lead to a power problem, the number of events per variable (EPV) at 2-year, 4-year and 6-year time-points were calculated for the main outcome measure.
Predictive validity analyses
Binary measures (e.g. presence of anxiety disorder) were linked to the staging model by fitting generalized estimating equation (GEE) models with an exchangeable correlation structure to longitudinal data (T2, T4 and T6), estimating effects for stages (categorical), time-points (categorical) and for all stage × time-point interactions. We adjusted these for baseline age because age was correlated with the pre-baseline duration of anxiety: younger subjects had lower duration of anxiety. From these models, odds ratios (ORs) for the presence of diagnoses at successive time-points for different stages were derived using the combined subclinical stages 0-1B at 2-year follow-up as reference. For continuous measures (e.g. anxiety severity), linear mixed models were used. While GEE and mixed model analyses are quite similar, mixed models perform better in linear analyses in cases of incomplete data (Twisk et al., 2017). In these models, fixed effects for stages (categorical), time-points (categorical) and for all stage × time-point interactions were estimated while adjusting for age. These models included a random intercept. From these models, expected severity scores at successive time-points for each stage were derived.
Sensitivity analysis
Inclusion of any predictors used in stage assignment would only be justified when each showed predictive power. To check this, a multivariable logistic regression model that incorporated all stage-assignment variables independently was made to predict 2-year presence of anxiety disorders. We hypothesized that all variables that were used in stage assignment were significant predictors of longitudinal course when adjusted for other predictors. See the supplement for the full rationale on this sensitivity analysis.
Results
Sample characteristics
Table 2 shows baseline demographics and clinical characteristics, stratified per stage. Gender, age and education years were unevenly distributed across stages. The number of years of education attained was lower in higher stages (p < 0.001). For most clinical characteristics, a pattern indicating a higher severity in higher stages was present. The exceptions were age of onset and presence of panic disorder without agoraphobia, for which negative linear associations existed (see Table 2). MDD was the most prevalent comorbidity (82.2–89.4%), followed by alcohol dependency (29.1–33.1%) and dysthymia (11.2–38.9%). The presence of MDD and alcohol dependency was evenly distributed across stages 2B, 3B and 4B, whereas dysthymia was more prevalent in higher stages, linear trend χ2(1) = 55.3, p < 0.001. Furthermore, subjects in higher stages had greater chances of receiving current psychiatric treatments (Table 2). Percentages of subjects receiving treatment were highest in the comorbidity stages 2B, 3B and 4B (57.7–59.9%).
Distribution of baseline characteristics and construct validators across stages.
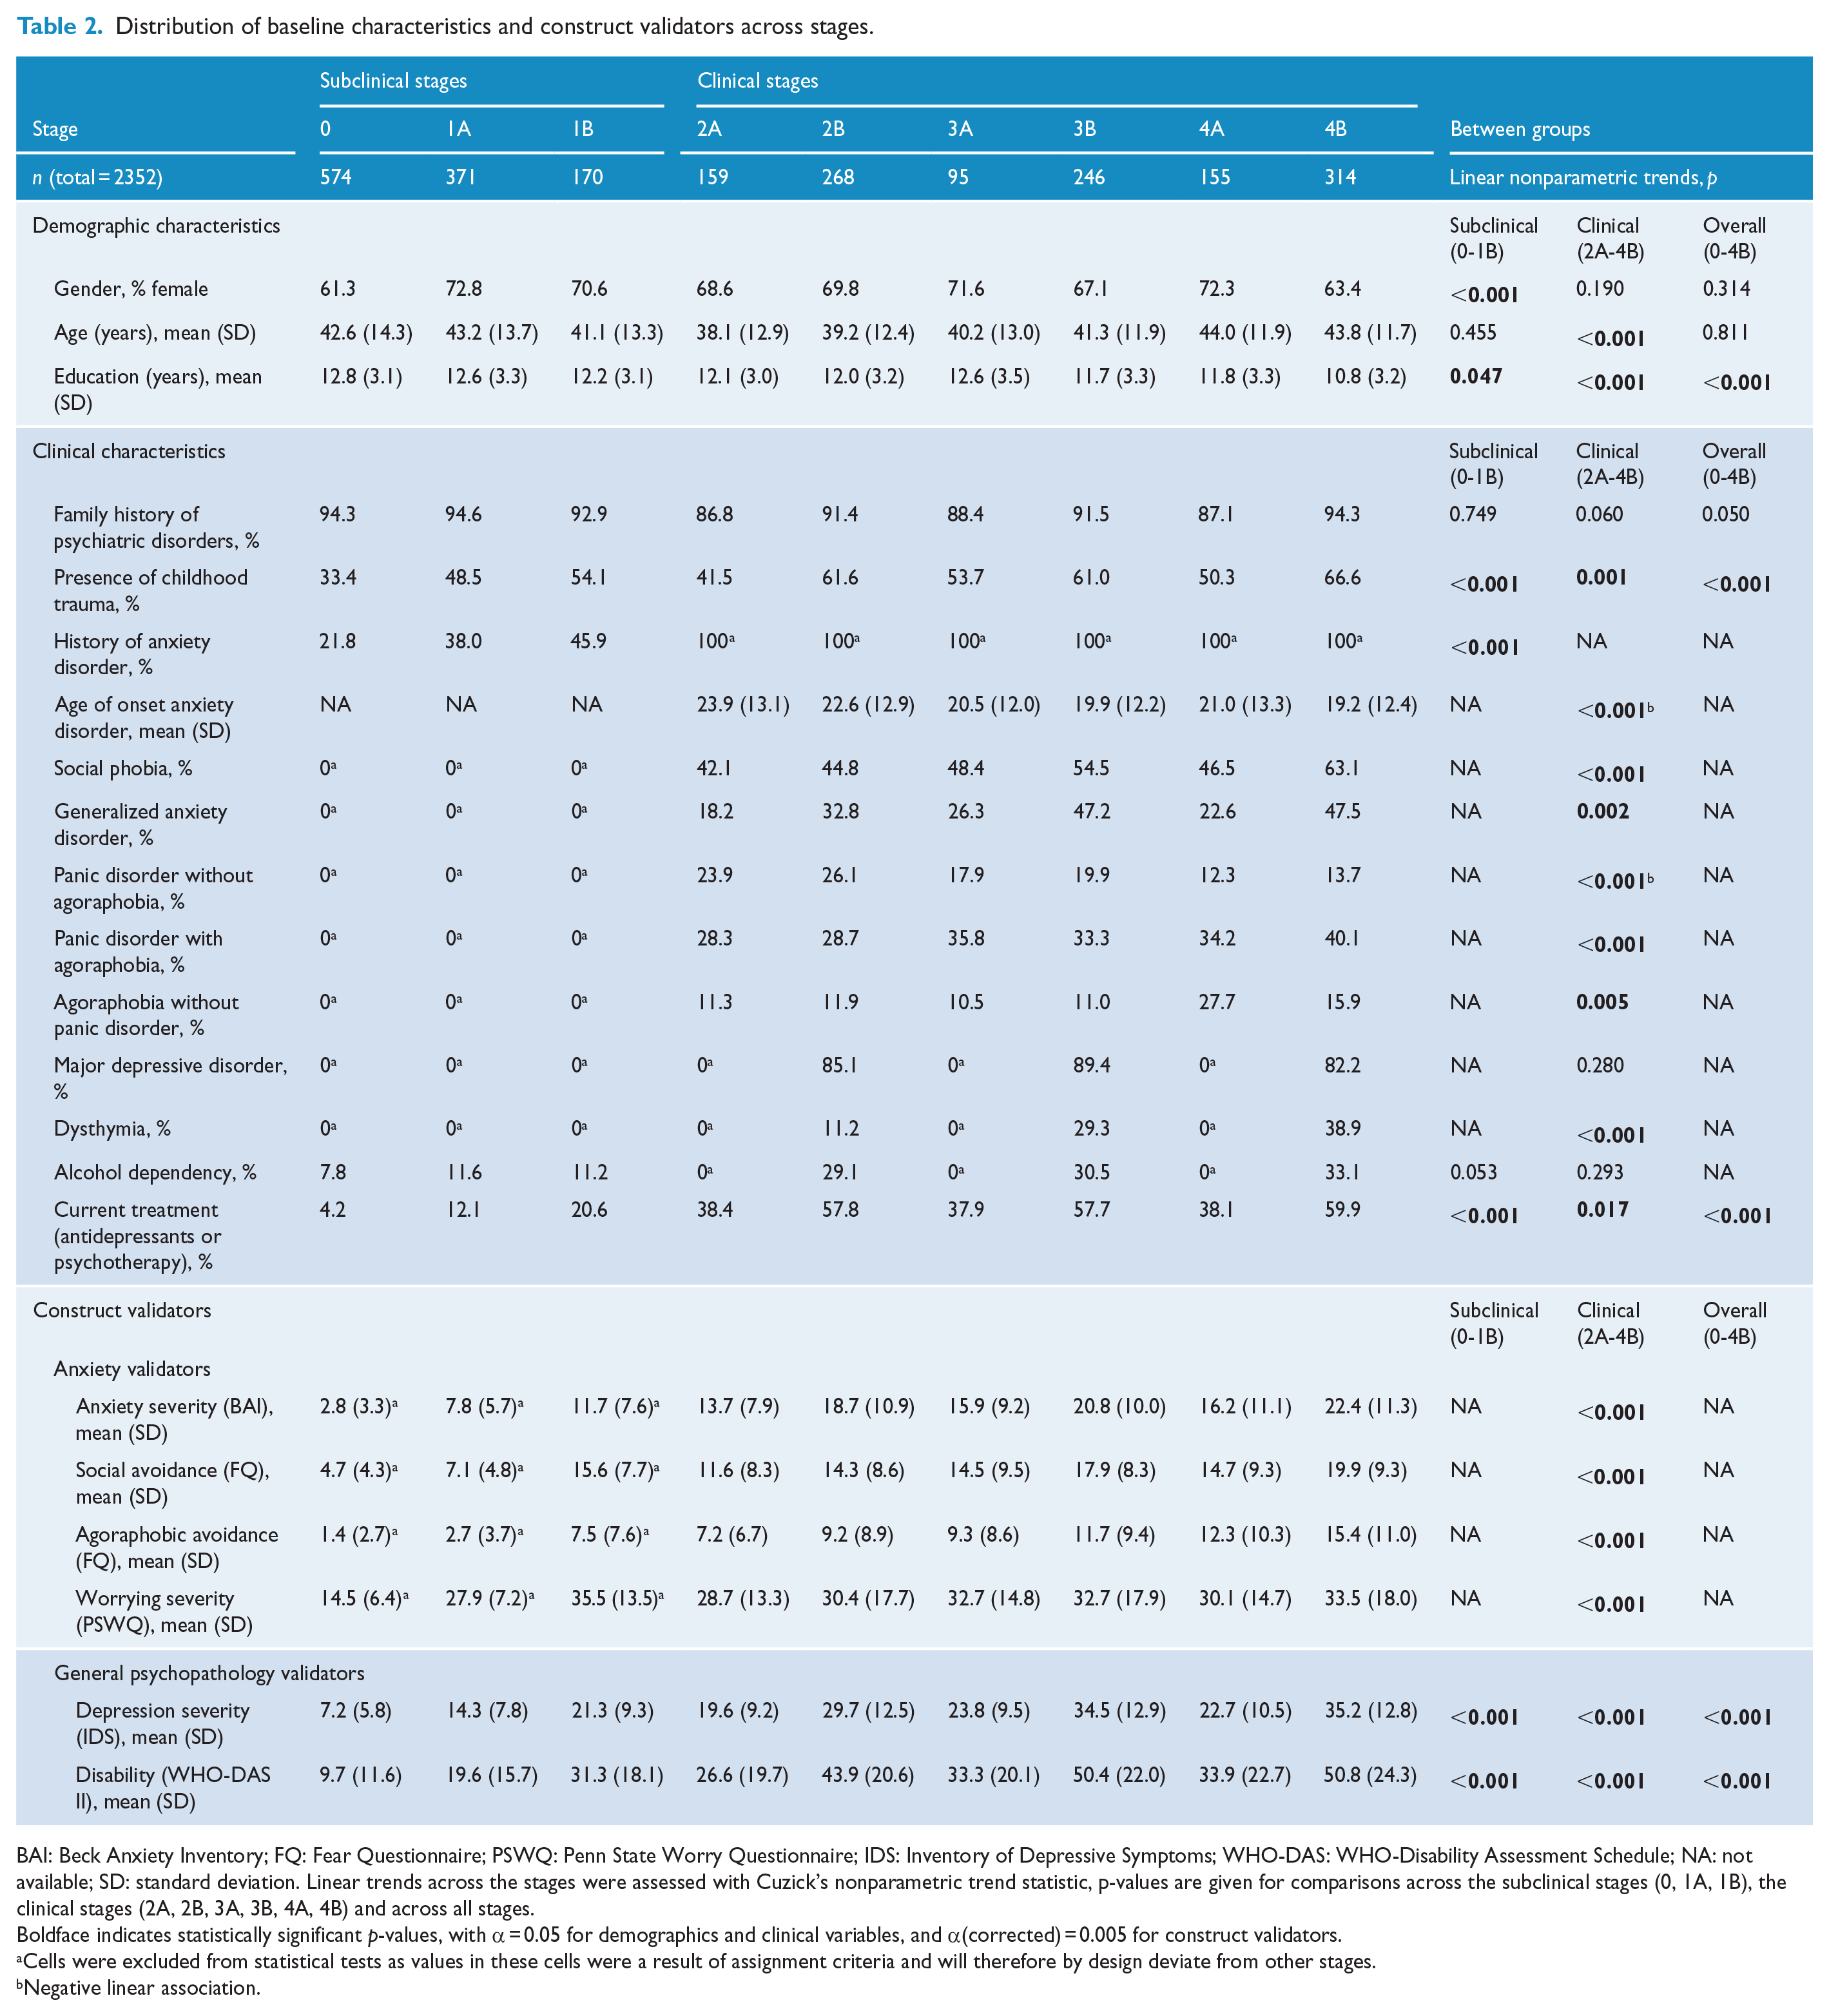
BAI: Beck Anxiety Inventory; FQ: Fear Questionnaire; PSWQ: Penn State Worry Questionnaire; IDS: Inventory of Depressive Symptoms; WHO-DAS: WHO-Disability Assessment Schedule; NA: not available; SD: standard deviation. Linear trends across the stages were assessed with Cuzick’s nonparametric trend statistic, p-values are given for comparisons across the subclinical stages (0, 1A, 1B), the clinical stages (2A, 2B, 3A, 3B, 4A, 4B) and across all stages.
Boldface indicates statistically significant p-values, with α = 0.05 for demographics and clinical variables, and α(corrected) = 0.005 for construct validators.
Cells were excluded from statistical tests as values in these cells were a result of assignment criteria and will therefore by design deviate from other stages.
Negative linear association.
Construct validation
We tested the assumption that with each successive stage at baseline, probabilities of unfavorable disease markers would increase. In all anxiety measures, this dose–response pattern was found, namely, increasing anxiety severity in higher stages. After Bonferroni correction, linear trends were significant for all construct validators. The only exception was stage 4A, which was associated with levels of severity comparable to subjects in stage 3A; for example, mean anxiety severity in stage 3A = 15.9 (SD = 9.24), in stage 4A = 16.2 (SD = 11.1); mean social avoidance in stage 3A = 14.5 (SD = 9.45), in stage 4A = 14.7 (SD = 9.31). For the general psychopathology measures, the patterns were somewhat different. There was a gradual increase in levels of general psychopathology until stage 3, after which they remained constant. As expected, comorbidity stages (2B, 3B and 4B) all showed substantially higher baseline severity scores than non-comorbid stages (2A, 3A and 4A). See Table 2 for means and standard deviations of these measures across stages at baseline.
Predictive validation
The second assumption we tested was that with each successive stage, longitudinal course would worsen. At 2-year follow-up, proportions of subjects with an anxiety disorder ranged from 2.7% (stage 0) to 68.0% (stage 4B). At 4-year follow-up, anxiety disorders were present in 3.0% (stage 0) to 59.0% (stage 4B) and at 6-year follow-up in 3.1% (stage 0) to 55.1% (stage 4B). These were incident disorders, recurrent disorders and persistent disorders. This amounts to 78.4 (2-year) to 47.5 (6-year) EPV. For all stages, proportions of anxiety disorders were lowest at 6-year follow-up, followed by 4-year and 2-year follow-up. Figure 2 shows GEE-derived age-adjusted ORs for the presence of follow-up anxiety disorders at different time-points, using the combined subclinical stages (0-1B) as comparison. Odds for having an anxiety disorder at follow-up followed a linear trend, with higher stages being at higher risk: at 6-year follow-up, presence of anxiety disorders for stage 4B: OR = 11.8 (95% confidence interval [CI] = [8.39, 16.6]), stage 4A: OR = 6.27 (95% CI = [4.10, 9.58]), stage 3B: OR = 5.60 (95% CI = [3.84, 8.15]), stage 3A: OR = 5.52 (95% CI = [3.31, 9.21]), stage 2B: OR = 3.30 (95% CI = [2.25, 4.85]) and stage 2A: OR = 2.45 (95% CI = [1.48, 4.04]) (see Figure 2(A)). This pattern was also present after 2-year and 4-year follow-up (Figure 2(A)).
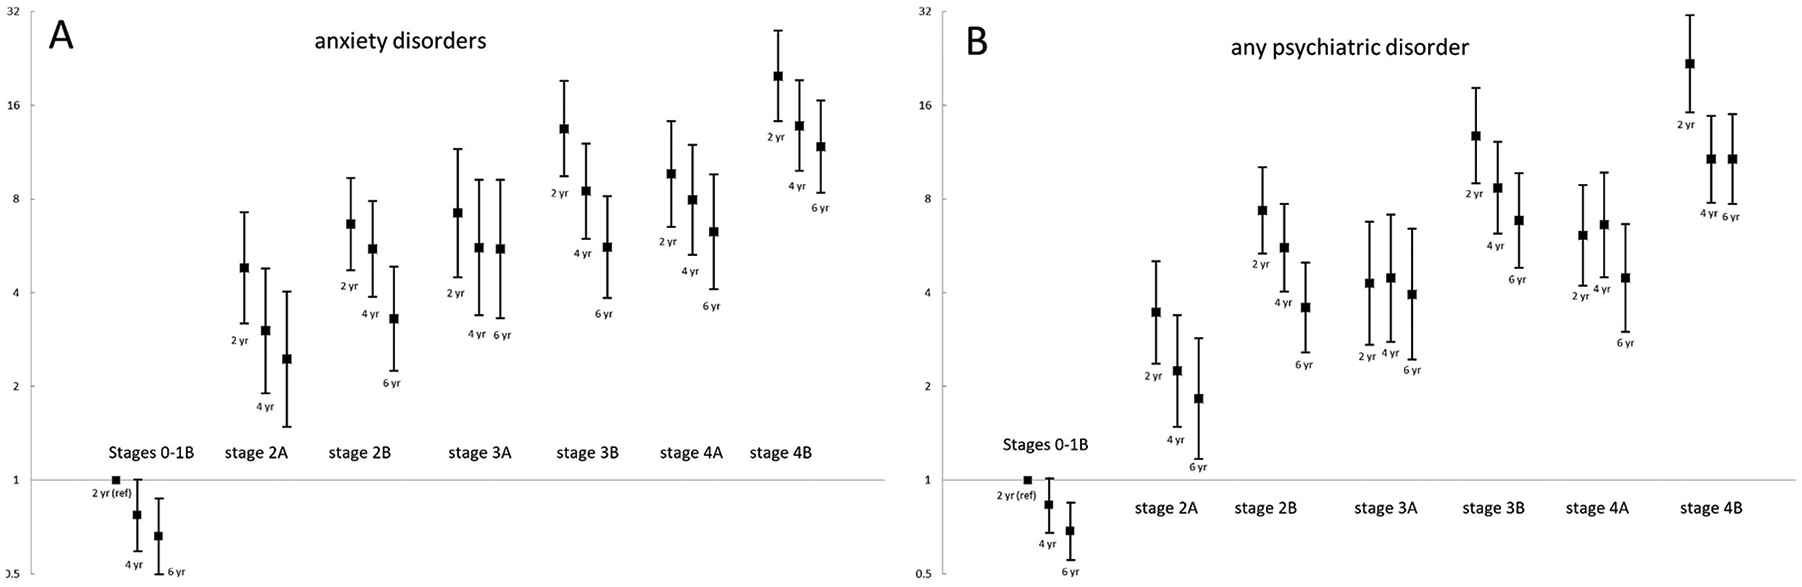
Odds ratios (bars representing 95% CI) for presence of any anxiety disorder (A) and any psychiatric disorder (B) at 2-, 4- and 6-year follow-up with combined subclinical stages 0-1B at 2-year follow-up as reference derived from age-adjusted generalized estimating equations.
Proportions of subjects having any psychiatric disorder at follow-up ranged from 6.5%–8.2% (stage 0) to 68.6%–81.8% (stage 4B). The same pattern as seen with anxiety disorder diagnoses emerged, with the difference that the comorbid stages (2B, 3B, 4B) consistently had the highest odds for having any psychiatric disorder at follow-up (see Figure 2(B)). For instance, at 6-year follow-up, the OR for the presence of any psychiatric disorder for stage 4B was 10.7 (7.70–15.0), for stage 4A OR = 4.47 (95% CI = [3.00, 6.65]), stage 3B OR = 6.82 (95% CI = [4.81, 9.67]), stage 3A OR = 3.93 (95% CI = [2.44, 6.41]), stage 2B OR = 3.59 (95% CI = [2.58, 5.00]) and stage 2A OR = 1.83 (95% CI = [1.17, 2.85]). See Supplemental eTable 1 for full GEE models.
Subjects in stage 0 had consistently low mean anxiety, depression and disability scores over time. For example, the mean estimated BAI score for stage 0 at baseline = 2.82 (95% CI = [2.16, 3.48]), at T2 = 2.98 (95% CI = [2.29, 3.67]), at T4 = 3.04 (95% CI = [2.35, 3.74]) and at T6 = 3.38 (95% CI = [2.67, 4.08]) (see Figure 3(A)). The mean anxiety, depression and disability scores in all other stages were significantly higher in comparison with stage 0 (all p < 0.01). Estimated means for stages 1B and 2A were not statistically different. Stages 2B, 3A and 4A did not differ significantly with regard to estimated mean anxiety, pathological worrying and social avoidance over time, but these stages all had lower scores over time than stage 3B (see Figure 3(A)–(C)). Estimated mean agoraphobic avoidance scores over time were most closely related to successive stages (see Figure 3(D)). The estimated mean levels of disability and depression over time were significantly higher in the comorbidity stages (2B, 3B, 4B) than in the anxiety-only stages (2A, 3A, 4A) (see Figure 3(E) and (F)).
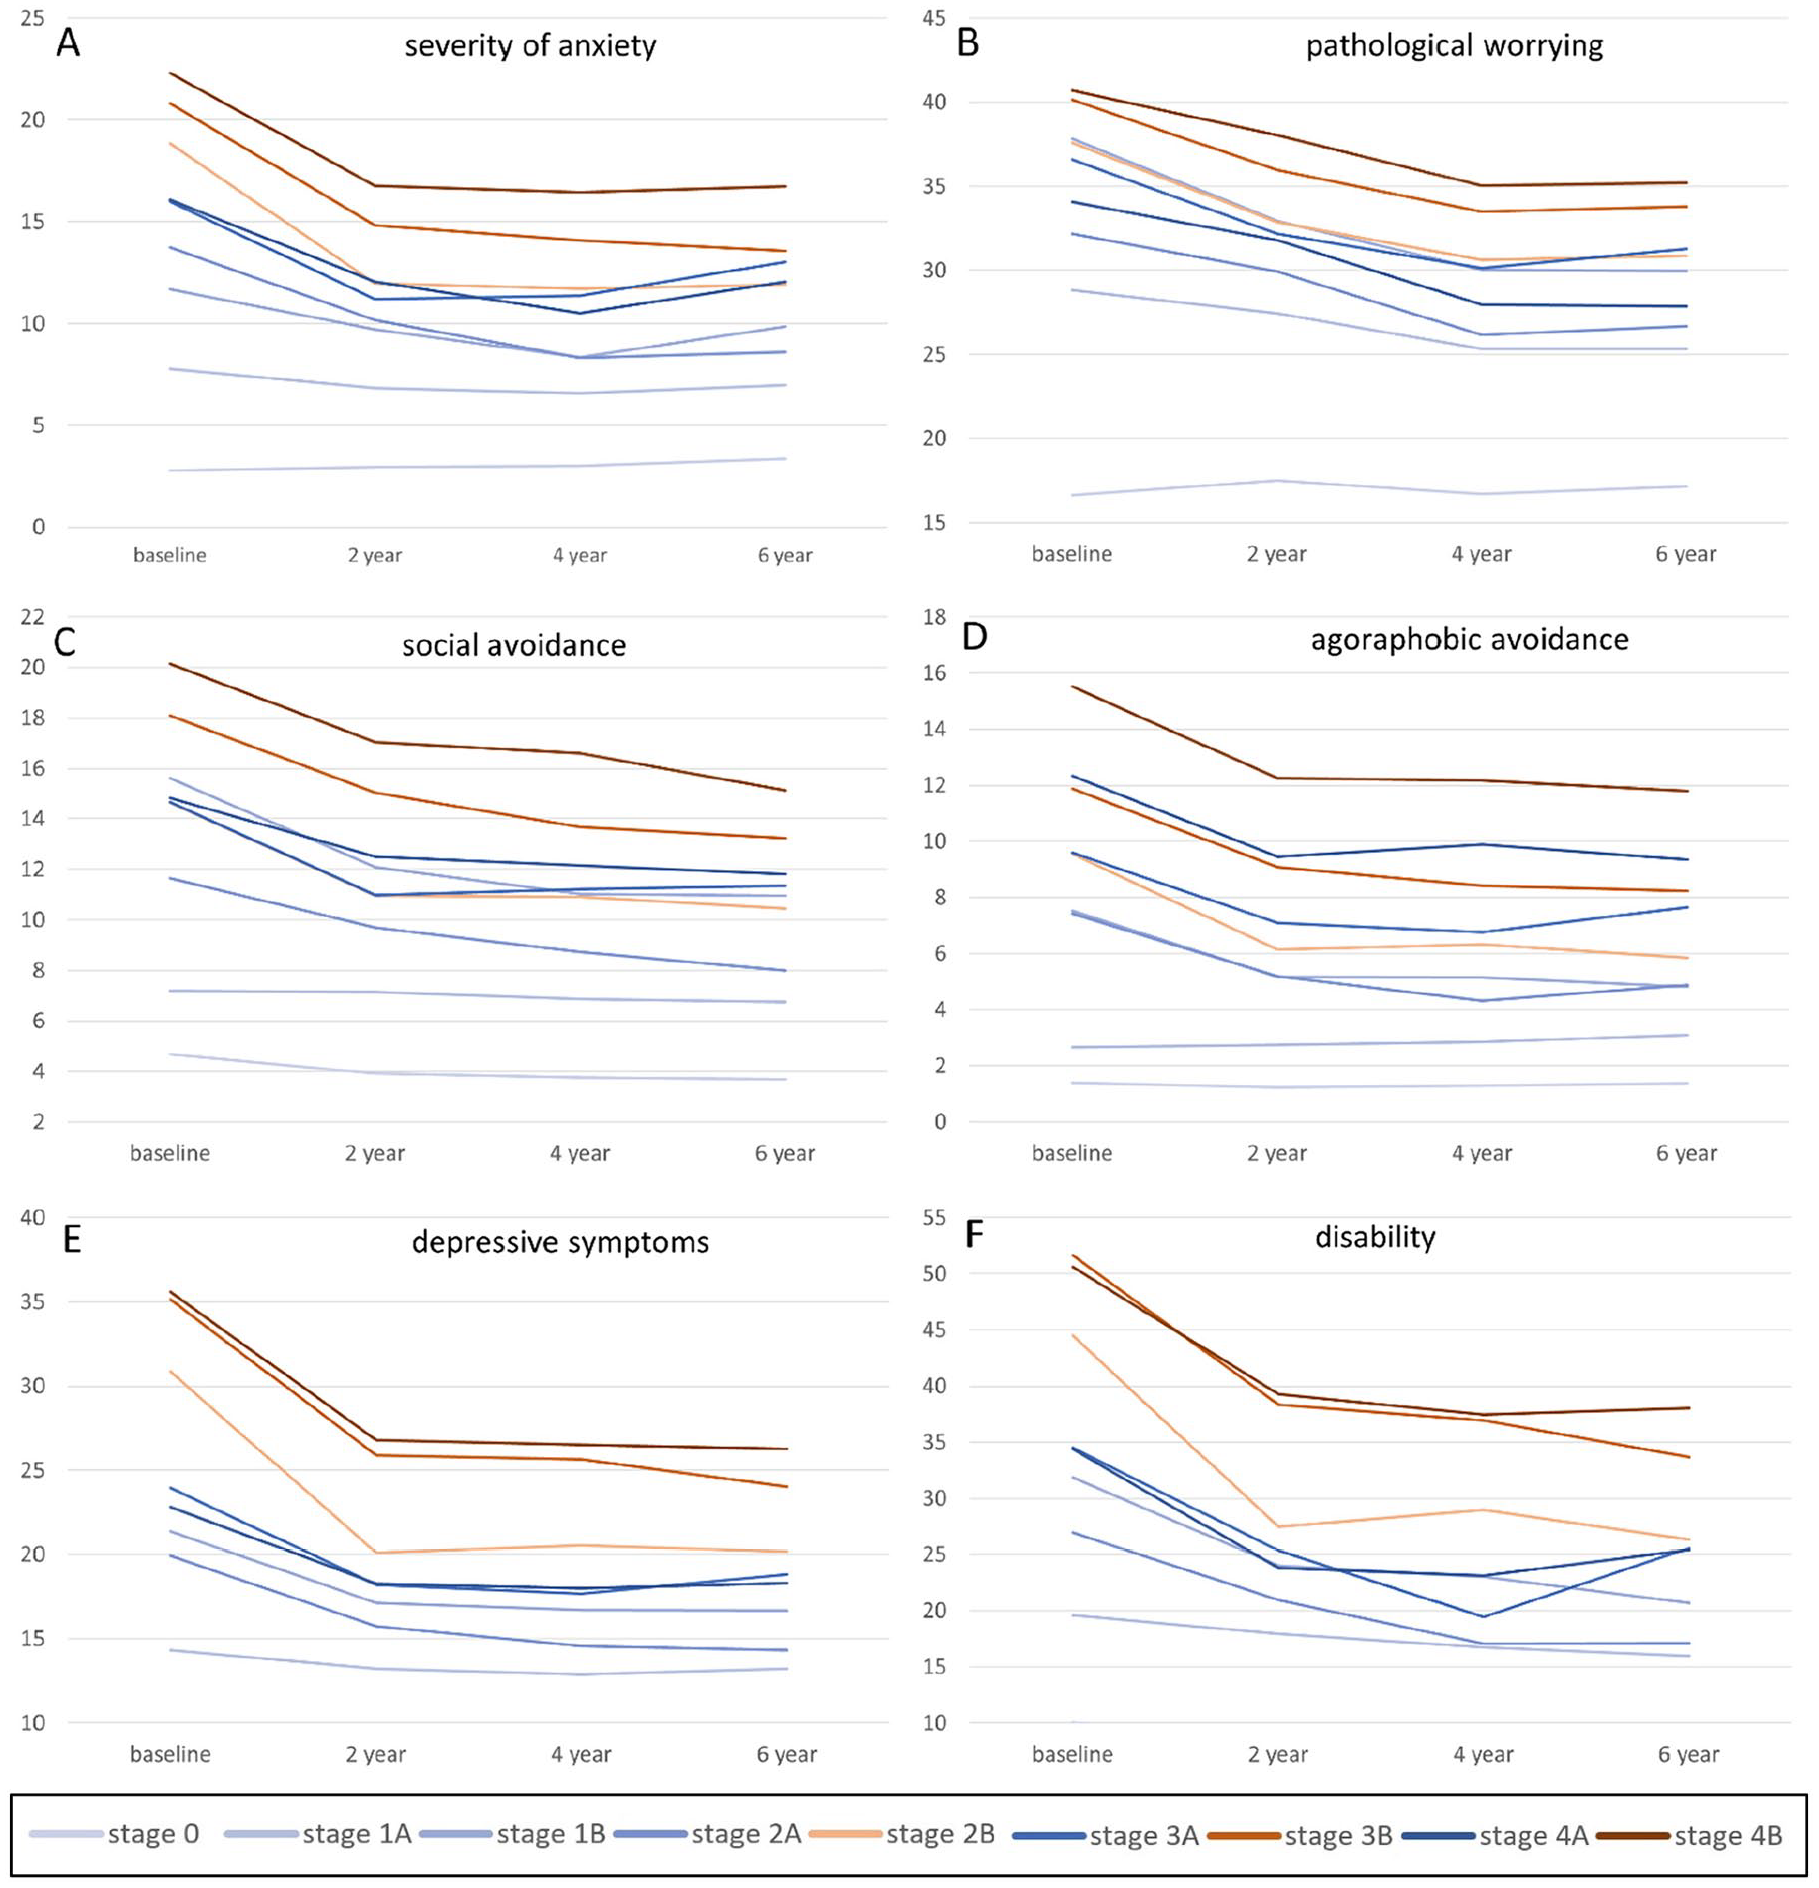
Estimated mean severity of anxiety (panel A), pathological worrying (panel B), social avoidance (panel C), agoraphobic avoidance (panel D), depressive symptoms (panel E) and disability (panel F) per stage at baseline, 2-, 4- and 6-year follow-up.
Sensitivity analysis
All included predictors uniquely contributed to the prediction of presence of 2-year follow-up anxiety disorders (all p-values < 0.001; see Supplemental eTable 2, model 1). Anxiety severity was the strongest predictor (OR for moderate to severe anxiety = 6.36; 95% CI = [4.00, 10.0]), while comorbidity had a relatively modest effect: OR = 1.49; 95% CI = [1.19, 1.92]). However, it should be noted that the effect of comorbidity on longitudinal course existed independently of other predictors. Therefore, the predictors used in the current staging algorithm are all deemed important individual predictors for anxiety course trajectories.
Discussion
In this study, we tailored McGorry’s clinical staging model to anxiety disorders and tested its construct and predictive validity in a heterogeneous anxiety disorders sample. First, the presence of construct validity was confirmed by showing that probabilities of unfavorable disease markers increased with each successive stage in the model. This suggests that this staging model is able to distinguish subgroups with increasing levels of disease progression. Second, predictive validity was demonstrated by worsening follow-up outcomes up to 6 years in higher baseline stages. All associations followed linear trends: severity of anxiety, depression and disability increased in higher stages. This implies that the process of staging can have value in long-term course prediction in anxiety disorders. It could thus be used as a tool to inform patients about their probable long-term prognosis. Some instructions for use in clinical practice are provided in the supplement. This model could therefore make an important contribution toward the goal of personalized medicine in anxiety disorders.
Different patterns emerged when comparing the different sets of validators: mean values for the anxiety measures followed the successive ordering of stages in the staging model more closely than the mean values of the general psychopathology measures. Subjects in the comorbidity stages (2B, 3B, 4B) had a worse overall longitudinal course compared with those in stages 2A, 3A and 4A. This corroborates the conclusion of other longitudinal studies that presence of comorbidity is associated with poorer long-term outcome (Lamers et al., 2011). The data suggest that, in all stages, comorbidity impacted the outcome in similar ways: each ‘B’ stage showed worse severity and longitudinal course in comparison with its ‘A’ counterpart. In addition, in some validators, presence of psychiatric comorbidity seemed to have a higher impact in comparison with anxiety duration. For instance, disability and depressive symptoms over a 6-year span were most prominent in stages 2B, 3B and 4B, whereas anxiety severity, pathological worrying and social avoidance over a 6-year span were most impaired in stage 4B followed by 3B.
Limitations
This study had several limitations. First, associations between the staging model and the validators were not perfectly linear; for instance, stages 3A and 4A showed similar symptom severity at baseline and at follow-up. This could imply that the criteria for stage assignment were not optimal and should be fine-tuned. For instance, in a previous study, threshold social anxiety disorder in young adults was sometimes assigned to stage 1B instead of stages 2 and onwards, as social anxiety disorder is hypothesized to be an early stage that will develop into more severe syndromes in a later stage (Clarke et al., 2012). Second, this study was limited by the inclusion of only five DSM-IV anxiety disorders. The presence of specific phobias was not assessed, even though it was shown that these disorders may serve as predictors of worse overall longitudinal course (Wardenaar et al., 2017). However, the simultaneous assessment of the anxiety disorders that were included is warranted, as these disorders share genetic vulnerability (Otowa et al., 2016), are highly comorbid (Lamers et al., 2011), generally show a comparable course (Batelaan et al., 2014) and show diagnostic instability over time (Hovenkamp-Hermelink et al., 2016; Scholten et al., 2016). Third, from a methodological perspective, the current results might represent an overestimation (i.e. optimism). Applying another external validation dataset or applying a bootstrapping approach might have resulted in more modest estimations on predictive power. However, the lowest EPVs in any of our binary predictive analyses were well above the suggested threshold of 20 (Austin and Steyerberg, 2017). As EPVs in our study were high, optimism is likely to be small. Furthermore, it remains unclear whether the current clinical staging model will be associated with underlying pathophysiological processes involved in etiology of anxiety disorders. Possibly, stage assignment criteria need to be refined to reflect underlying disease processes in the future. Finally, one of the major goals of clinical staging models is to derive more targeted interventions that prevent progression across stages of anxiety disorders (McGorry et al., 2018). However, we were not able to test the applicability of the current model in treatment decision-making, because NESDA is a naturalistic cohort study. This should be a priority in future research as increasing knowledge of effective stage-specific treatments can contribute significantly to the development of personalized medicine.
Future research
In staging models for depressive and bipolar disorders, anxiety disorders are viewed as a nonspecific prodromal phase, which could function as a gateway to development of these end-stage syndromes (Duffy, 2014). Conceptually, staging models for different end-stage syndromes can include similar nonspecific prodromal stages as this is in line with the transdiagnostic assumptions underlying staging models (Buckholtz and Meyer-Lindenberg, 2012; Scott et al., 2013). This implies that a person with subthreshold anxiety symptoms is considered to be at stage 1 of both an anxiety disorder and a bipolar disorder staging model. Further research should identify profilers that critically determine the pathways to various end-stage syndromes.
In this tailored staging model, patients with remitted anxiety disorder were assigned to a subclinical stage, making the model bidirectional. Due to the ‘waxing and waning’ longitudinal course of anxiety disorders, such a bidirectional model is most likely to fit best (McGorry et al., 2007). On the other hand, it is also plausible that patients with multiple episodes of anxiety disorders have a less favorable prognosis, suggesting a one-directional model. Future studies could compare bidirectional to one-directional staging models in anxiety disorders.
In our adaptation of McGorry’s clinical staging model, comorbidity was added as ‘B’ substages. The current results suggest that this approach is valid. However, future studies could compare anxiety disorder staging models with and without comorbidity substages, or with a different role in stage assignment for the presence of comorbidity, to evaluate this approach further. The current model could be refined by studying anxiety disorder relapses in subjects after remission. Supplementary validation of the current staging model could also be carried out by prospectively applying it to an anxiety disorders cohort, as is done in youth mental health care (Hickie et al., 2013; Purcell et al., 2014).
Improving longitudinal course predication in anxiety disorders might also be possible using other methodological approaches (Hasler et al., 2004; McGorry, 2013; Scott et al., 2013), such as machine learning algorithms (Iniesta et al., 2016), or network analysis (Borsboom et al., 2013). The advantage of clinical staging over these alternative approaches, however, is its reliance on simple clinical parameters that both clinicians and patients are familiar with (McGorry et al., 2006). In addition, staging models are widely used in other fields of medicine, which improves familiarity of patients and clinicians with these models and will thus aid their implementation of these models.
Conclusion
This study is the first attempt to tailor a staging model to anxiety disorders. The results show that such a model could be clinically meaningful. In this study, we not only predicted anxiety disorder specific phenomena but also adapted a transdiagnostic view by predicting ‘any psychiatric disorder’ at 2, 4 and 6 years. Both approaches were effective. This suggests that, in providing individual course prognosis, not only persistence of anxiety disorders should be considered but also other disorders such as depressive disorders and substance-use disorders. If these results could be replicated and fine-tuned, clinical stage assignment could improve the diagnostic process of patients with an anxiety disorder. The results from the current, first study on staging in anxiety disorders are promising. To evolve the field of individualized course prediction and treatment decision-making in anxiety disorders, clinical staging could definitely be the way to go.
Supplemental Material
supplement_Bokma_Aus_NZ – Supplemental material for A clinical staging approach to improving diagnostics in anxiety disorders: Is it the way to go?
Supplemental material, supplement_Bokma_Aus_NZ for A clinical staging approach to improving diagnostics in anxiety disorders: Is it the way to go? by Wicher A Bokma, Neeltje M Batelaan, Adriaan W Hoogendoorn, Brenda WJH Penninx and Anton JLM van Balkom in Australian & New Zealand Journal of Psychiatry
Footnotes
Declaration of Conflicting Interests
All authors have completed the unified competing interest form and declare that (1) no authors received support for the submitted work; (2) B.W.J.H.P. and A.J.L.M.v.B. received grants from the Dutch Scientific Organization (ZON-MW), B.W.J.H.P. received a grant from Johnson & Johnson, A.J.L.M.v.B. received grants from Fonds Psychische Gezondheid, Stichting VCVGZ, Servier and Lundbeck, outside the submitted work that could be perceived to constitute a conflict of interest; (3) no spouses, partners or children of any author have financial relationships that may be relevant to the submitted work; and (4) no authors have non-financial interests that may be relevant to the submitted work.
Funding
The author(s) disclosed receipt of the following financial support for the research, authorship and/or publication of this article: The infrastructure for the NESDA study (![]() ) has been funded through the Geestkracht Program of the Netherlands Organization for Health Research and Development (Zon-Mw, grant number 10-000-1002) and participating universities (VU University Medical Center, Leiden University Medical Center, University Medical Center Groningen).
) has been funded through the Geestkracht Program of the Netherlands Organization for Health Research and Development (Zon-Mw, grant number 10-000-1002) and participating universities (VU University Medical Center, Leiden University Medical Center, University Medical Center Groningen).
Supplemental material
Supplemental material for this article is available online.
References
Supplementary Material
Please find the following supplemental material available below.
For Open Access articles published under a Creative Commons License, all supplemental material carries the same license as the article it is associated with.
For non-Open Access articles published, all supplemental material carries a non-exclusive license, and permission requests for re-use of supplemental material or any part of supplemental material shall be sent directly to the copyright owner as specified in the copyright notice associated with the article.