
Abstract
Objective:
Blood biomarkers of neuronal injury such as neurofilament light (NfL) show promise to improve diagnosis of neurodegenerative disorders and distinguish neurodegenerative from primary psychiatric disorders (PPD). This study investigated the diagnostic utility of plasma NfL to differentiate behavioural variant frontotemporal dementia (bvFTD, a neurodegenerative disorder commonly misdiagnosed initially as PPD), from PPD, and performance of large normative/reference data sets and models.
Methods:
Plasma NfL was analysed in major depressive disorder (MDD, n = 42), bipolar affective disorder (BPAD, n = 121), treatment-resistant schizophrenia (TRS, n = 82), bvFTD (n = 22), and compared to the reference cohort (Control Group 2, n = 1926, using GAMLSS modelling), and age-matched controls (Control Group 1, n = 96, using general linear models).
Results:
Large differences were seen between bvFTD (mean NfL 34.9 pg/mL) and all PPDs and controls (all < 11 pg/mL). NfL distinguished bvFTD from PPD with high accuracy, sensitivity (86%), and specificity (88%). GAMLSS models using reference Control Group 2 facilitated precision interpretation of individual levels, while performing equally to or outperforming models using local controls. Slightly higher NfL levels were found in BPAD, compared to controls and TRS.
Conclusions:
This study adds further evidence on the diagnostic utility of NfL to distinguish bvFTD from PPD of high clinical relevance to a bvFTD differential diagnosis, and includes the largest cohort of BPAD to date. Using large reference cohorts, GAMLSS modelling and the interactive Internet-based application we developed, may have important implications for future research and clinical translation. Studies are underway investigating utility of plasma NfL in diverse neurodegenerative and primary psychiatric conditions in real-world clinical settings.
Keywords
Introduction
There has been a great deal of research on blood-based biomarkers for neurological and neurodegenerative conditions, with implications for clinical trials and clinical translation to improve early diagnosis, care and treatment. Neurofilament light chain (NfL) has been demonstrated to be a highly sensitive biomarker of neuronal injury in diverse conditions (Bridel et al., 2019; Eratne et al., 2020, 2022b, 2022c; Gaetani et al., 2019, 2021; Khalil et al., 2018). NfL is of particular interest as a diagnostic biomarker, as it may help distinguish disorders with significant neuronal degeneration, from those without. Distinguishing neurodegenerative dementias from primary psychiatric disorders (PPD) is a frequent clinical diagnostic dilemma and one associated with uncertainty, misdiagnosis, and negative impacts for patients and healthcare systems (Kang et al., 2023; Loi et al., 2022; Tsoukra et al., 2022; Woolley et al., 2011).
One of the most challenging clinical distinctions, associated with some of the highest diagnostic uncertainty/instability and misdiagnoses, is distinguishing PPD from behavioural variant frontotemporal dementia (bvFTD), a neurodegenerative condition associated with personality, behavioural and psychiatric changes (Ducharme et al., 2020; Eratne et al., 2022b; Kang et al., 2023; Tsoukra et al., 2022). Previous studies have investigated blood and cerebrospinal fluid (CSF) NfL in bvFTD compared to PPD (Al Shweiki et al., 2019; Ashton et al., 2021; Katisko et al., 2020; Vijverberg et al., 2017), and in bvFTD and range of other neurodegenerative conditions compared to PPD and non-progressive/phenocopy syndromes (Eratne et al., 2020, 2022b, 2022c; Loi et al., 2022), finding significantly elevated levels in neurodegenerative disorders including bvFTD, compared to PPD. There remain significant gaps in our understanding of NfL levels in large, well characterised cohorts of severe PPD that can often present as or ‘mimic’ conditions like bvFTD, such as bipolar affective disorder (BPAD), MDD, and schizophrenia, which have overlapping clinical features and are common initial misdiagnoses or prodromes of bvFTD, and/or are associated themselves with cognitive and neuroimaging abnormalities.
None of the previously mentioned studies used large normative samples. There is increasing interest in use of very large reference cohorts, to facilitate more precise interpretation of individual levels, improving upon and moving beyond coarse age-binned binary cut-offs (Benkert et al., 2022). Improved understanding of models based on large reference cohorts, will have additional important implications for future research and clinical translation.
Findings have been mixed from the few studies that investigated blood NfL in PPD. Higher levels were seen in major depressive disorder (MDD) compared to controls in one study (Bavato et al., 2021), but not in another (Ashton et al., 2021). Higher levels were seen in bipolar depression (Aggio et al., 2022). Some studies reported no differences between controls and schizophrenia and clozapine-treated schizophrenia (Al Shweiki et al., 2019; Bavato et al., 2021; Eratne et al., 2022a), while one study reported slightly higher levels in schizophrenia and clozapine-treated patients (Rodrigues-Amorim et al., 2020). Psychosis due to Anti-NMDA receptor encephalitis had higher levels, compared to psychosis due to primary psychiatric illness (Guasp et al., 2022). Improved understanding of NfL in a diverse range of PPD will be critical for broad clinical translation into diverse clinical settings.
Aim 1 was to compare plasma NfL in bvFTD to PPD that can often appear like or ‘mimic’ bvFTD: bipolar affective disorder (BPAD), MDD, and schizophrenia
Aim 2 was to use a sophisticated model of percentiles of NfL across the lifespan based on a large reference range cohort of healthy controls, to interpret and compare NfL levels in PPD and bvFTD. This model, Model 1, will be used to develop an interactive web-based application to allow visualisation of an individual’s NfL level compared to this large reference cohort, and individualised centiles and z-scores. This would facilitate future research relevant to diagnostic and clinical utility, and a potential tool to interpret an individual patient’s NfL in clinic.
Aim 3 was to investigate plasma NfL in a range of PPD, compared to each other and to controls. Most previous studies that focused on PPD, did not include weight or BMI as a covariate, shown to be inversely associated with blood NfL levels (Benkert et al., 2022; Eratne et al., 2022a; Manouchehrinia et al., 2020). As secondary additional aims, the impact of weight was explored with a model that did not include weight (Model 2), and a model that did (Model 3). This extended upon Aim 2 and Model 1 to determine sensitivity of comparisons/analyses to weight and using different control groups, again important for future research and clinical translation.
Methods
Participant recruitment and data
Participant samples and data were included from four patient cohorts and two control groups, detailed below.
Cohort 1, bipolar affective disorder
Baseline (pre-intervention) samples and data were collected during a 16 week, three-arm, double-blind, randomised control trial (RCT) of adjunctive mitochondrial agents and N-acetylcysteine for bipolar depression (Berk et al., 2019). Participants were recruited between 2013–2015 and were 18+ years old, met DSM-IV-TR diagnostic criteria for BPAD (assessed via structured clinical interview), experiencing a bipolar depressive episode of at least moderate severity (n = 121).
Cohort 2, major depressive disorder
Baseline (pre-intervention) samples and data were collected during a 12-week, two-arm, double-blind RCT of adjunctive minocycline for unipolar depression (Dean et al., 2014, 2017). Participants were recruited between 2013–2015 and were 18+ years old, met DSM-IV diagnostic criteria for unipolar depression (structured clinical interview), experiencing a depressive episode of at least moderate severity (n = 42).
Cohort 3, treatment-resistant schizophrenia (TRS)
Participants were from the Cooperative Research Centre (CRC) Psychosis Study, a cross-sectional study that recruited people aged 18–65 years from inpatient and outpatient services in Melbourne, Australia, between 2012–2017 (n = 82), who were on clozapine and had a diagnosis of treatment-resistant schizophrenia (TRS), defined as failure to respond to adequate trials of two or more antipsychotics, as previously described (Bousman et al., 2019; Eratne et al., 2022a; Mostaid et al., 2017).
Cohort 4, behavioural variant frontotemporal dementia (bvFTD)
Twenty-two patients were recruited from Eastern Cognitive Disorders Clinic, Eastern Health, Melbourne, Australia, a specialist cognitive neurology service with expertise in diagnosis and management of bvFTD. Included in this study were patients who met diagnostic criteria for probable or definite bvFTD based on comprehensive gold-standard expert multidisciplinary and multimodal investigations including structural and functional imaging, previously described (Ooi et al., 2022).
Control Group 1, local control group
Samples and data were pooled from healthy people (n = 96) with no current or past psychiatric or neurological illness, from the CRC Psychosis Study (healthy controls age-matched to TRS, and healthy parents and siblings of participants with TRS), described previously (Eratne et al., 2022a).
Control Group 2, large reference normative control group
Data was available from 1,926 people aged 5–90 years, with no history or clinical symptoms or signs of neurological disorder, pooled from eight cohorts and described previously (Simrén et al., 2022).
Common data from all studies/cohorts included diagnosis, age, sex, and weight (where available). For Cohorts 3 and 4, and Control Groups 1 and 2, there was no: significant renal impairment or renal impairment diagnosis, severe/uncontrolled diabetes or other general medical conditions, and no known stroke, head injury, within at least 12 months of recruitment. This data was not available for Cohorts 1 and 2. Detailed information on recruitment and eligibility criteria have been published (Berk et al., 2019; Bousman et al., 2019; Dean et al., 2014, 2017; Eratne et al., 2022a; Mostaid et al., 2017; Ooi et al., 2022; Simrén et al., 2022).
All studies that contributed data and samples to this study, had ethical approval at the relevant Human Research Ethics Committees. All participants provided written informed consent prior to participation. This study, part of The Markers in Neuropsychiatric Disorders Study (The MiND Study, https://themindstudy.org), was approved by the Melbourne Health Human Research Ethics Committee (MH/HREC2020.142).
Sample analysis
Plasma aliquots from all samples were stored at −80°C. For Cohorts 1–4 and Control Group 1 samples were randomised before analysis, and analyses blinded to diagnosis. Plasma NfL levels were measured on Quanterix SR-X and HD-X analysers using Simoa NF-Light kits, according to the manufacturer’s recommendations.
Statistical analysis
Statistical analyses were performed using R v4.2.2 (2022-10-31). Given the already recruited cohorts and pre-determined sample sizes, power calculations were not performed in advance. Detailed review of variables and data across the different cohorts was performed to ensure data harmonisation, comparisons, and pooling. For Aim 1 and Aim 3, general linear models (GLMs) were used to examine relationships between NfL, diagnostic group, and relevant clinicodemographic variables. For these models, log10-transformed NfL was entered as the dependent variable. Independent variables were diagnostic group (Control Group 1 as reference), age, sex, and weight (where available). For Aim 3, GLMs were performed with and without weight to investigate the contribution to overall results. 95% confidence intervals were computed (nonparametric bootstrapping, 1000 replicates), statistical significance defined as any confidence interval not including the null (at 95% level). Receiver operator characteristic (ROC) curves were computed to estimate area under the curve (AUC), sensitivity, and specificity of NfL in distinguishing between groups. Optimal cut-off was determined using Youden’s method. For Aim 2, all patient cohorts and Control Group 1 were compared to the large reference cohort, Control Group 2. Z-scores were calculated from age-adjusted percentiles from Control Group 2, derived using generalised additive models for location, scale, and shape (GAMLSS). Single-sample t-tests were used to test the null hypothesis that the mean z-score was 0 (i.e. no difference/equal to the mean of Control Group 2). Welch Two Sample two-tests were used to compare z-scores between groups. The GAMLSS model was used to develop the web-based application. Model residuals were inspected for normality and homoscedasticity.
Results
The study included 245 participants with PPDs: 121 BPAD, 42 MDD, 82 TRS, ranging 20–79 years of age (Table 1), 22 participants with bvFTD (mean age 66 years, range 43–80), 96 participants in Control Group 1 (mean age 45 years, range 18–77), and 1,926 participants in Control Group 2 (mean age 54 years, range 5–90). bvFTD was the oldest group (mean 66 years). MDD patients were older (mean 55 years) than BPAD and TRS (44 and 40 years, respectively). TRS and bvFTD had fewer females (28% and 18%, respectively), compared to the other groups (all above 50%). Weight data was not available for bvFTD and Control Group 2. Participants with TRS, all of whom were on clozapine, were heavier (mean weight 95.8 kg) compared to BPAD (84.3 kg), MDD (84.6 kg), and Control Group 1 (77.3 kg), the most likely explanation being clozapine-related weight gain.
Study demographics and plasma neurofilament light levels.
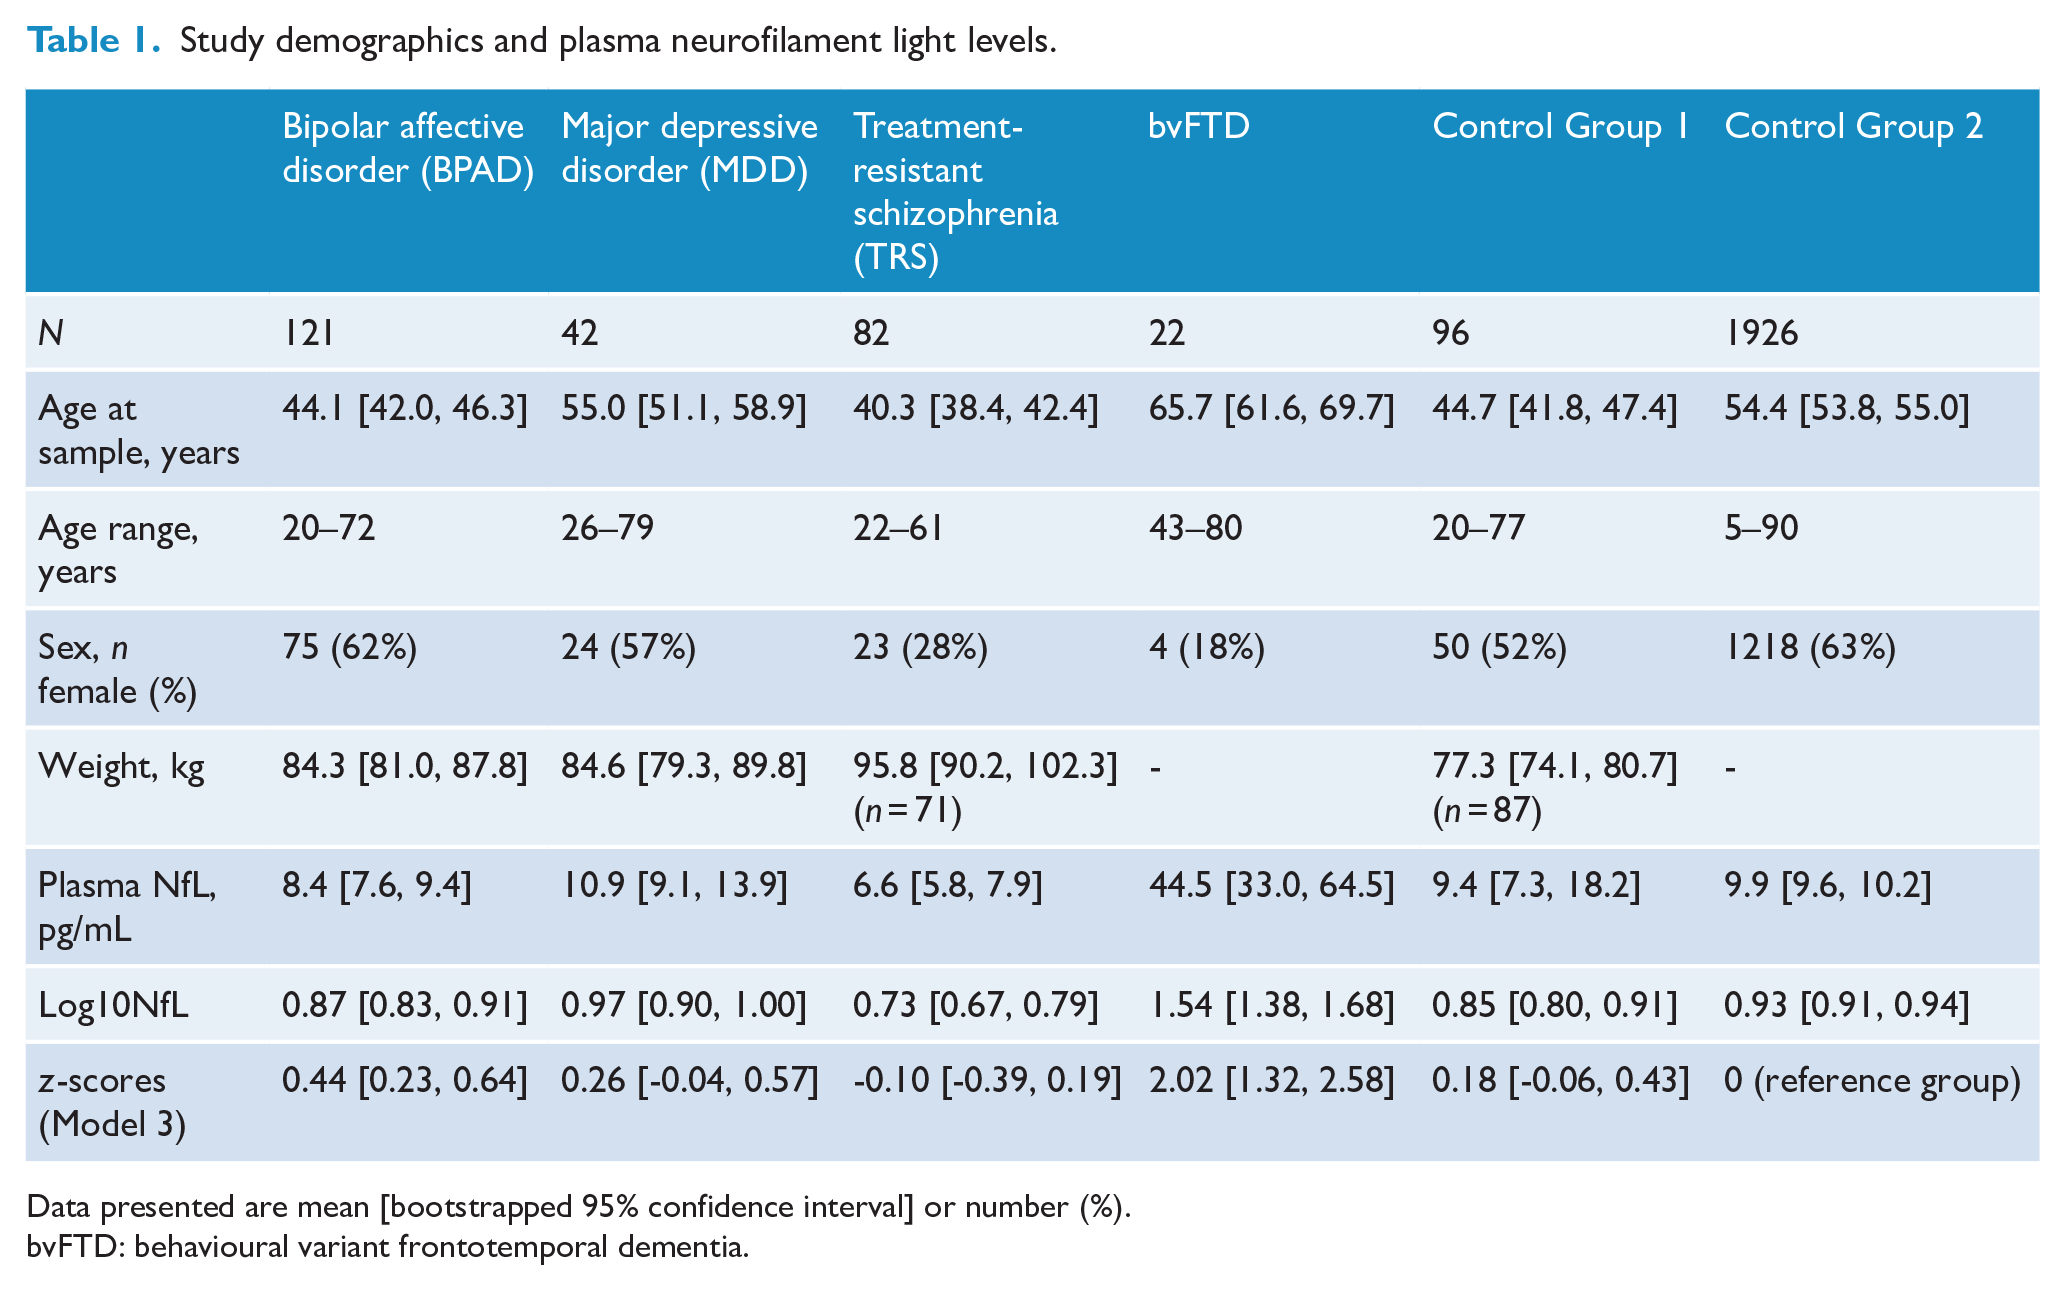
Data presented are mean [bootstrapped 95% confidence interval] or number (%).
bvFTD: behavioural variant frontotemporal dementia.
Aim 1: plasma NfL in behavioural variant frontotemporal dementia compared to primary psychiatric disorders
As demonstrated in Table 1 and Figure 1, highest plasma NfL levels were seen in bvFTD (mean NfL, M = 44.5 pg/mL, 95% confidence interval [33.0, 64.5]) and were approximately four times higher than all other groups (all mean levels < 11 pg/mL).
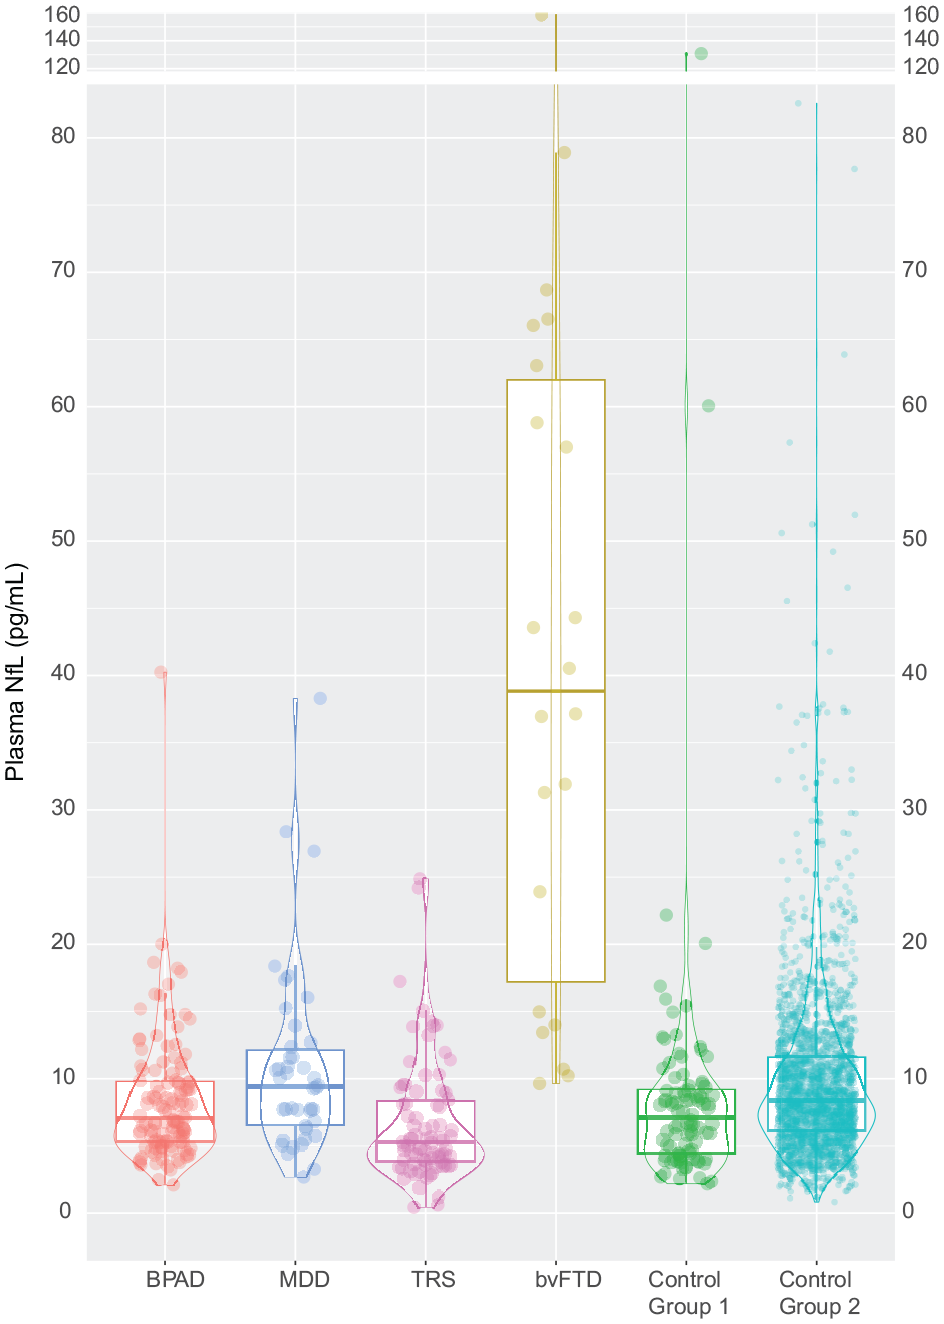
Plasma NfL levels in primary psychiatric disorders, behavioural variant frontotemporal dementia, and controls.
A GLM to compare log NfL levels in bvFTD to all other groups, adjusting for age and sex, demonstrated statistically significant and large differences: BPAD (β = 1.66 [1.03, 2.28], p < 0.001), MDD (β = 1.80 [1.09, 2.39], p < 0.001), TRS (β = 1.98 [1.36, 2.62], p < 0.001), Control Group 1 (β = 1.78 [1.10, 2.38], p < 0.001), and Control Group 2 (β = 1.94 [1.35, 2.51], p < 0.001).
ROC curve analyses were performed to assess plasma NfL distinguishing bvFTD from other groups (Figure 2). Plasma NfL distinguished bvFTD from all psychiatric disorders, with high accuracy (AUC = 0.95 [0.91, 0.99]). An optimal cut-off of 13.3 pg/mL resulted in 86% specificity, 88% sensitivity. Diagnostic performance remained high even when restricting psychiatric disorders to the same age range as the bvFTD group (43–80 years): AUC 0.91 [0.85, 0.98], 13.3 pg/mL cut-off, 86% specificity, 78% sensitivity (and a cut-off of 22 resulted in 73% specificity, but higher sensitivity 95%). Additional details are available in Supplementary Material Table 1.
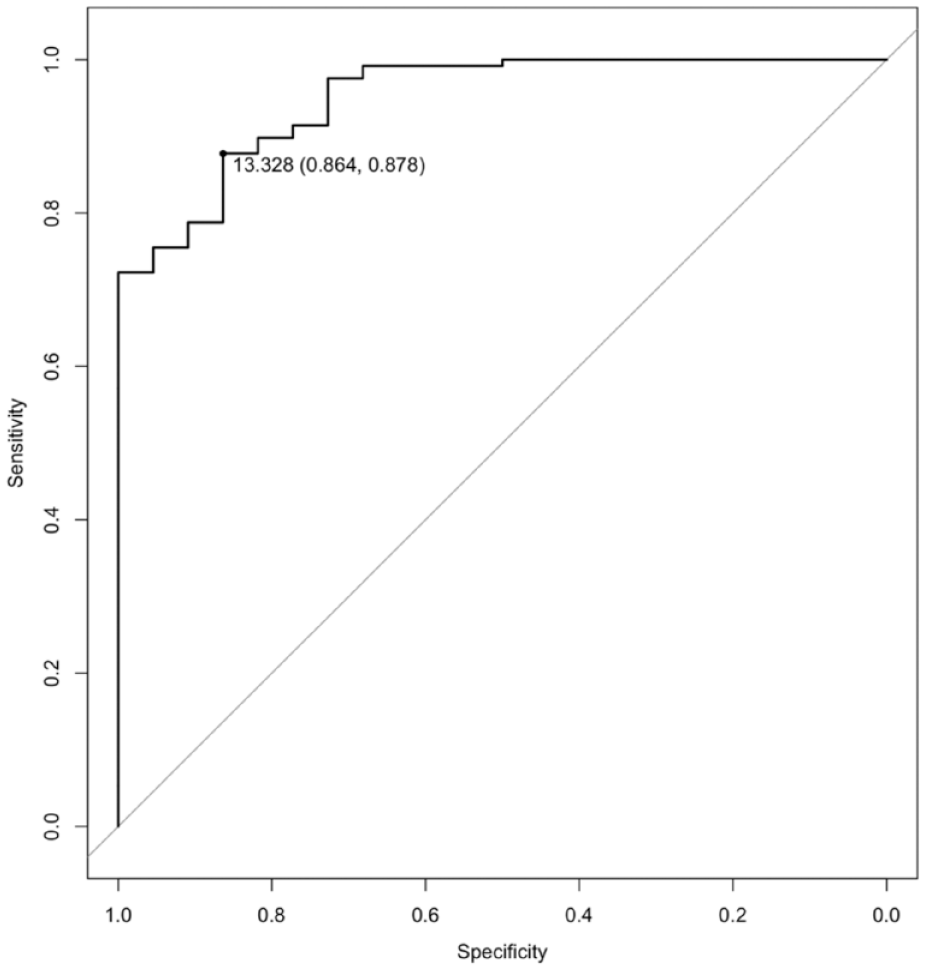
Receiver operator curve (ROC) curve for neurofilament light chain to distinguish behavioural variant frontotemporal dementia from primary psychiatric disorders.
Aim 2: plasma NfL in all groups compared to large reference normative control cohort (GAMLSS model, Model 1)
To explore the utility of a large normative control data set, age-adjusted percentiles for plasma NfL were derived from the reference cohort Control Group 2, using GAMLSS. The centile plot of this model, across most of the lifespan, is demonstrated in Figure 3.
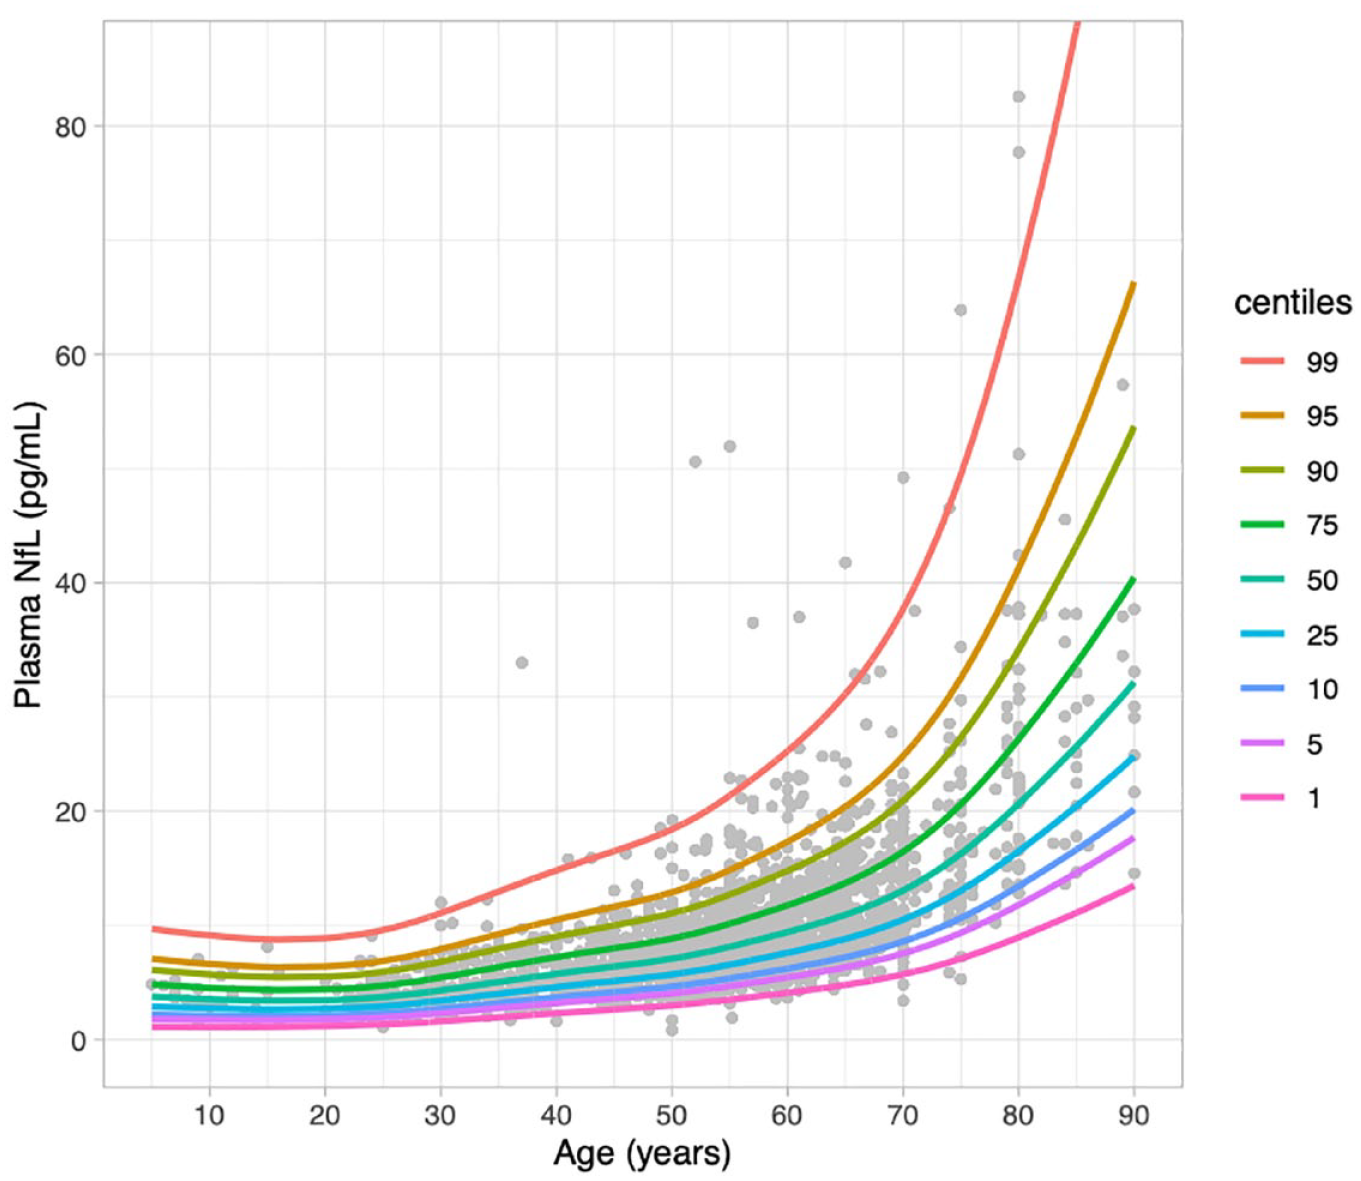
Percentiles derived from generalised additive models for location, scale, and shape, from 1926 healthy controls, Control Group 2 (Simrén et al., 2022).
To investigate differences, z-scores for individuals in every cohort were computed from this reference cohort model. As demonstrated in Table 1 and Figure 4, highest z-scores were in bvFTD (M = 2.02 [1.32, 2.58]). bvFTD was significantly greater than Control Group 2, and the effect was large (difference = 2.02 [1.41, 2.62], p < 0.001; Cohen’s d = 1.47 [0.85, 2.07]). bvFTD was greater than BPAD, MDD, TRS, Control Group 1 (differences = 1.58, 1.75, 2.02, 1.84, respectively), and all with large effect sizes (Cohen’s d = 1.25 [1.48, 1.58, 1.43], respectively).
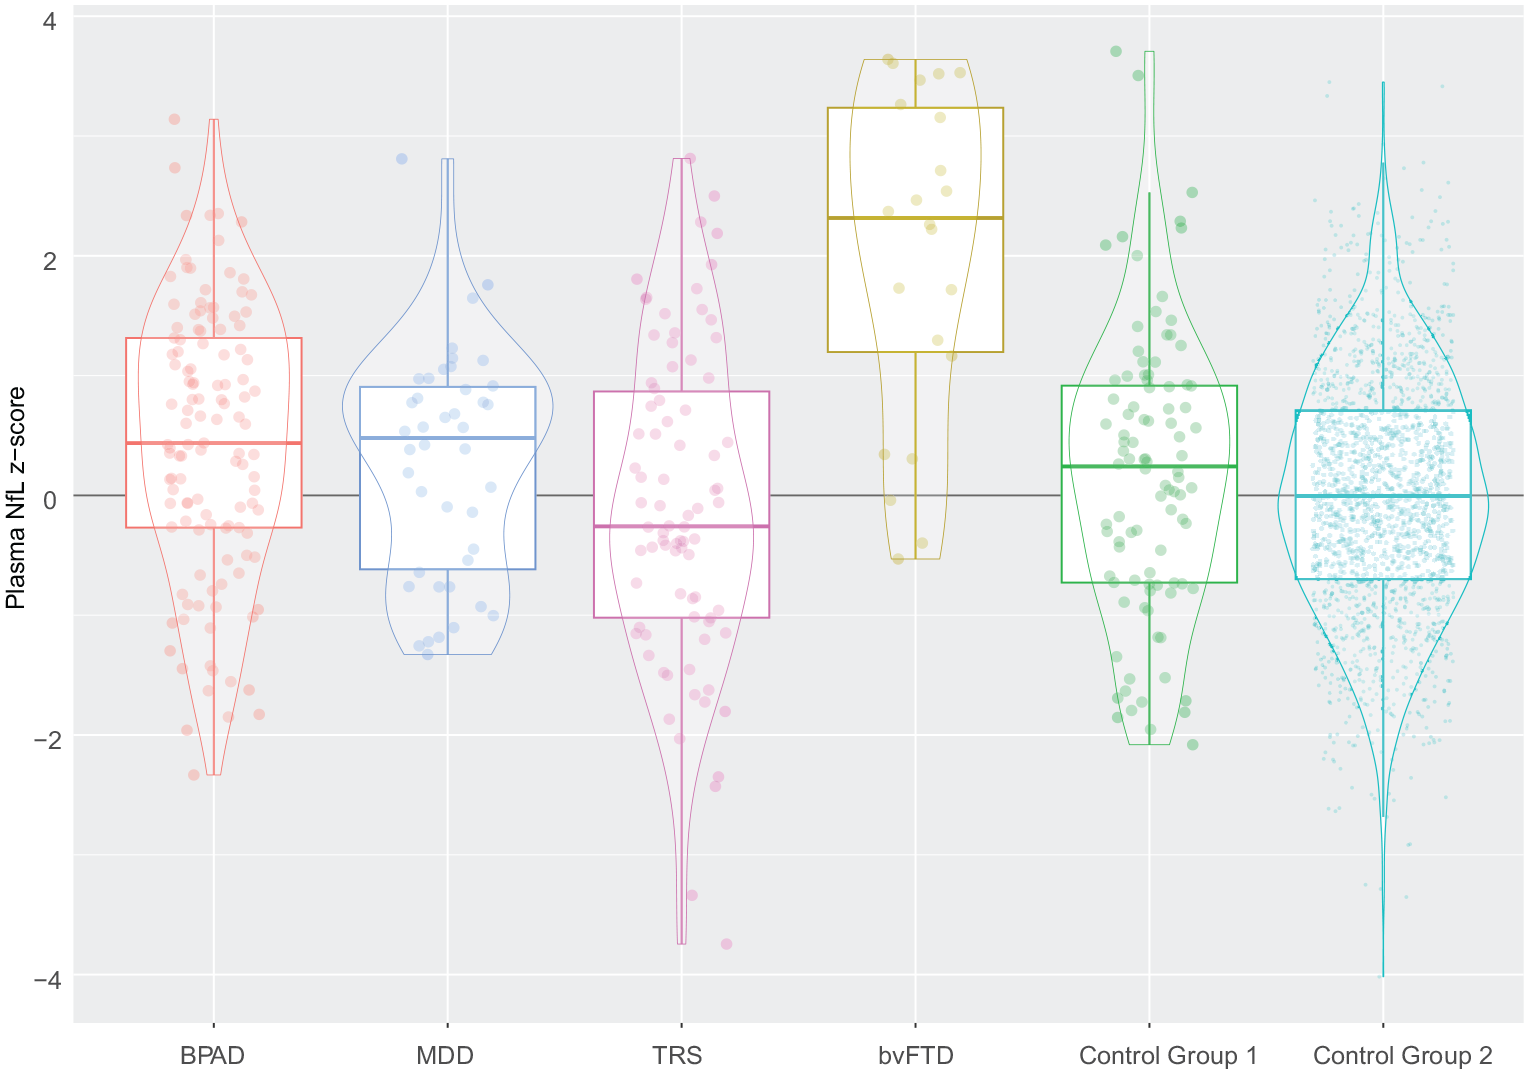
Z-scores (compared to Control Group 2) of plasma NfL levels in primary psychiatric disorders, behavioural variant frontotemporal dementia, and controls.
Focusing on PPDs, the mean z-score for BPAD was greater than Control Group 2, suggesting a small effect (mean z-score 0.44 vs 0, difference = 0.44 [0.23, 0.64], p < 0.001; Cohen’s d = 0.39 [0.20, 0.57]). BPAD was also greater than TRS, again suggesting a small effect (mean z-score 0.44 vs -0.10, difference = 0.54 [0.19, 0.90], p = 0.003; small effect Cohen’s d = 0.44 [0.15, 0.73]). Z-scores in the other groups (MDD, TRS, and Control Group 1), were not different to Control Group 2.
Aim 3: plasma NfL in primary psychiatric disorders
Before adjusting for age, raw NfL in psychiatric disorders were highest in MDD (mean M = 10.9 pg/mL 95%CI [9.1, 13.2]), with lowest levels in TRS (M = 6.6 pg/mL [5.8, 7.6]). However, these were also the oldest and youngest groups, respectively (mean age 55 years vs 40). GLMs performed to control for these age differences and derive adjusted/estimated marginal means, to compare differences between psychiatric disorders and controls, are detailed below. For exploratory analyses on the impact of weight as a covariate, two GLMs were performed: one without weight (Model 2), and one including weight (Model 3).
Model 2 (GLM without weight)
A GLM adjusting for age and sex (without weight) was used to compare mean log NfL differences between psychiatric disorders and Control Group 1. No differences were seen between BPAD and Control Group 1 (estimated marginal mean log10NfL, EMM, 0.98 95%CI:[0.93, 1.00] vs 0.95 [0.91, 0.98], p = 0.24), and MDD and Control Group 1 (EMM 0.94 [0.89, 1.00] vs 0.95 [0.91, 0.98]), p = 0.83). In Model 2, TRS had lower levels than Control Group 1 (EMM 0.89 [0.85, 0.93] vs 0.95 [0.91, 0.98], p = 0.030). Comparing psychiatric groups to each other, levels were not different between MDD and BPAD (EMM 0.94 [0.89, 1.00] vs 0.98 [0.93, 1.00], p = 0.41). Levels were also lower in TRS compared to BPAD (EMM 0.89 [0.85, 0.93] vs 0.98 [0.93, 1.00], p = 0.004), and TRS compared to MDD (EMM 0.89 [0.85, 0.93] vs 0.94 [0.89, 1.00], p = 0.042).
Model 3 (GLM including weight)
Adding weight to the GLM, resulted in no significant differences between TRS and MDD (EMM 0.80 [0.75, 0.84] vs 0.85 [0.78, 0.86], p = 0.20), and between TRS and Control Group 1 (EMM 0.80 [0.75, 0.84] vs 0.82 [0.78, 0.86], p = 0.45), different to results from Model 2. Including weight showed statistically higher NfL levels in BPAD compared to Control Group 1 (EMM 0.88 [0.84, 0.91] vs 0.82 [0.78, 0.86], p = 0.028). Levels remained statistically significantly lower in TRS compared to BPAD (EMM 0.80 [0.75, 0.84] vs 0.88 [0.84, 0.91], p = 0.020).
Weight had a small effect (β =-0.01 [-0.02, -0.01], p < 0.001). Sex was not significant in Model 2 (β = 0.04 [-0.14, 0.22], p = 0.640), but was in Model 3 (β = 0.19 [0.02, 0.36], p = 0.028). Sensitivity analyses were performed, excluding sex as a covariate, finding no impact on the overall findings. As expected, age had the highest coefficients in both Models 2 and 3 (β = 0.57 [0.51, 0.65], p < 0.001, and β = 0.61 [0.54, 0.68], p < 0.001, respectively).
ROC curve analyses demonstrated that although these statistically significant differences were found in Models 2 and 3, plasma NfL did not demonstrate high diagnostic utility to distinguish between TRS and BPAD (AUC 0.66 [0.58, 0.74], 5.6 pg/mL cut-off, 72% sensitivity, 59% specificity), TRS and MDD (AUC 0.74 [0.65, 0.83], 6.2 pg/mL cut-off, 79% sensitivity, 63% specificity). Plasma NfL did not accurately distinguish BPAD from Control Group 1 (AUC 0.46 [0.38, 0.53]).
Notably, Model 1 (z-scores from a large reference control group, without weight), resulted in similar findings to the model comparing to a smaller local control group, and including weight (Model 3) – i.e. Model 1, like Model 3, found differences between BPAD and Controls, and between BPAD and TRS.
Discussion
There were three main findings from this study. First, significantly higher plasma NfL levels were seen in bvFTD compared to primary psychiatric disorders and controls, and plasma NfL demonstrated high diagnostic accuracy in distinguishing bvFTD from PPD. Second, GAMLSS modelling and z-scores using a large reference control group, performed just as well as models using local controls that included weight, and outperformed models that did not include weight, while also allowing for more precise interpretation and visualisation of individual levels by facilitating z-score and percentiles across the lifespan. Third, slightly higher group NfL levels were found in BPAD compared to controls, and BPAD compared to TRS.
Finding elevated plasma NfL levels in bvFTD compared to a large group of well-characterised PPD (including to our knowledge, the largest blood NfL BPAD cohort), extends the previous literature. The strong diagnostic performance of plasma NfL to distinguish bvFTD from PPD, supports the clinical use of a relatively easily accessible blood biomarker, to assist in this challenging, clinical distinction (Al Shweiki et al., 2019; Ducharme et al., 2020; Eratne et al., 2022b; Katisko et al., 2020; Ooi et al., 2022). This is of high relevance to a diverse range of clinicians and clinical settings. While this study was not focused only on patients presenting to clinical settings for assessment of possible neurodegenerative disorders, unlike our previous studies (Eratne et al., 2020, 2022c; Kang et al., 2023), studies investigating generalisability to diverse clinical settings are underway.
The robust performance of Model 1 for comparisons, based on a large reference cohort (Simrén et al., 2022), equalling or outperforming other models using locally recruited controls and including weight as a covariate, has important potential implications. Not only could there be significant improvements in accuracy of comparisons and interpretations for future research and clinical purposes, but significant efficiencies and cost reductions may be possible for future studies by potentially not requiring local control group recruitment, and instead focusing on facilitating data sharing and pooling. Z-scores provide useful information on the degree of deviation and therefore strength/confidence in interpreting an individual level, allowing for a more precision interpretation, mitigating some of the limitations of age-binned cut-offs and binary interpretation of ‘normal’ or ‘abnormal’ based on being above or below the cut-off, especially given the non-linear relationship and increasingly sharp change in slopes of NfL with age (Figure 3). We developed an interactive web-based application (https://themindstudy.org/apps), allowing input of an individual’s age and plasma NfL level, providing estimated centiles and z-scores and visualisation on the centiles reference chart, compared to the large reference cohort. This builds on similar applications developed recently (Benkert et al., 2022; Vermunt et al., 2022), but to our knowledge ours is the first application to use GAMLSS modelling for plasma NfL and providing both individualised percentiles and z-scores. This application could be used for academic and research interests and will be used in studies underway to investigate the clinical and diagnostic utility and validity of such tools, as well as feasibility and utility for clinicians. One potential implementation in routine clinical care in the future, could be where the clinician uses such an application, akin to using growth charts, to help quickly facilitate a precision interpretation of an individual’s NfL level (demonstrated with examples in Figure 5).
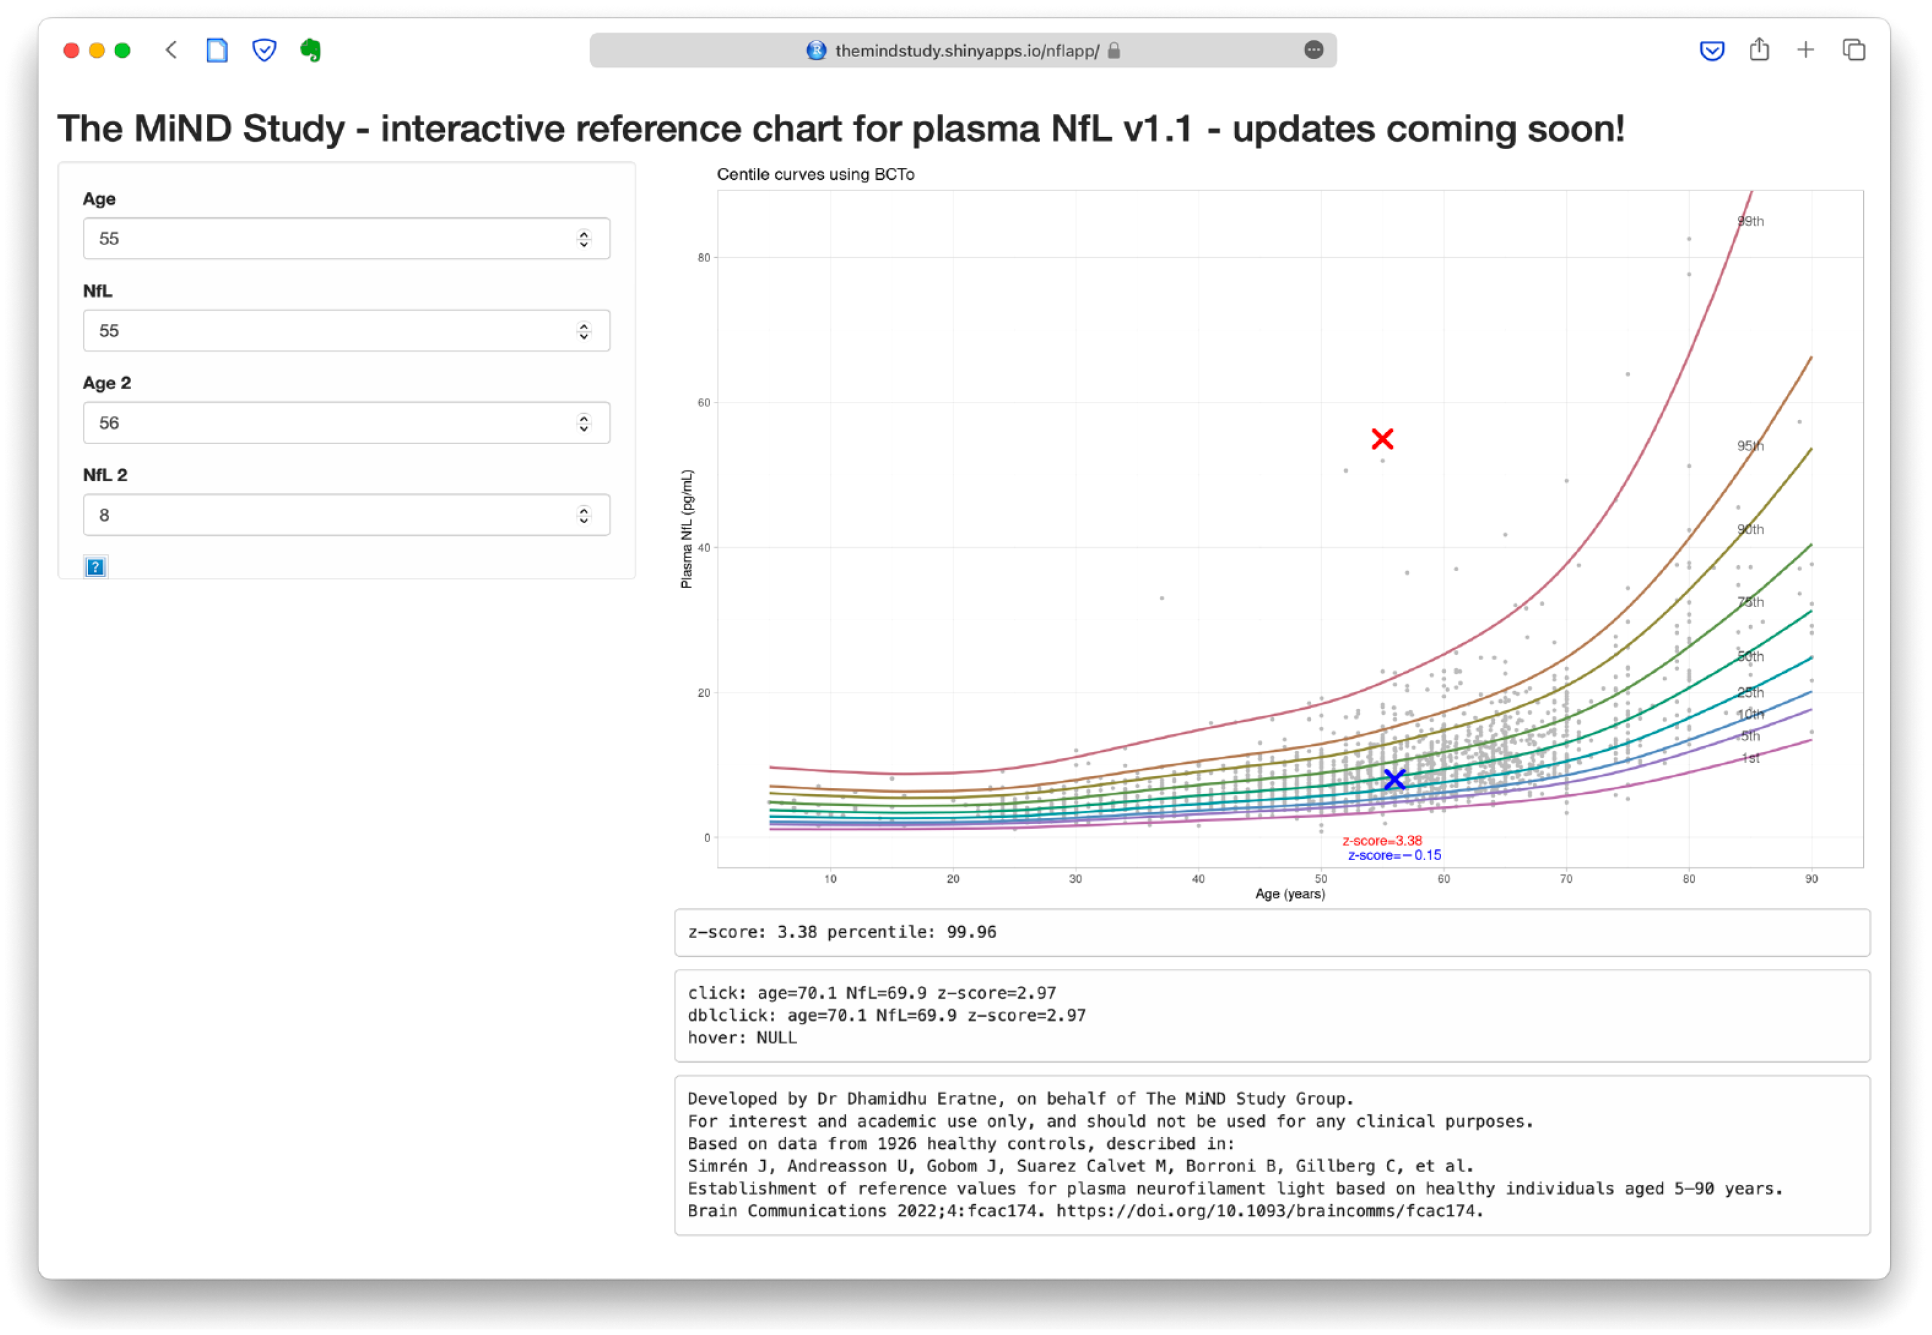
The interactive web-based application.
We found that Model 1, using the large control reference data set without weight, had the same overall results as analyses from specifically recruited local controls and when weight was included as a covariate (Model 3). Of note, Model 1 avoided some of the spurious findings of a model using local controls that did not include weight (i.e. Model 2, which suggested lower levels in TRS compared to controls and MDD). The finding that weight may not be required, when using a large control data set and using GAMLSS modelling such as in Model 1, requires further investigation, but has potential important implications.
While there is growing evidence of weight and other factors (e.g. APOE ε4 allele status) influencing plasma NfL levels, the overall impact of these is relatively small (Akamine et al., 2020; Fitzgerald et al., 2022), and smaller than the large differences seen between bvFTD and PPDs. Considering clinical translation, we speculate that if a clinician has to consider and input only simple and easily/immediately obtainable variables for many patients – such as age, sex, and plasma NfL level – especially where there are a lack of significant comorbidities such as renal impairment, would be more feasible for busy clinicians in primary care and via telehealth/remote assessments, could have implications for laboratories reporting on plasma NfL levels, reducing the potential for variability introduced by weight measurements in different clinical and research settings. An important limitation was the lack of weight data in all groups, and further research is still needed to understand whether other variables such as renal function need to be included, particularly for older people. Recent studies have demonstrated higher NfL levels in people with chronic kidney disease (Akamine et al., 2020; Dittrich et al., 2023; Polymeris et al., 2022). While there were no patients with severe renal impairment in any of the cohorts (nor renal impairment listed under their medical comorbidities), we did not have renal function, so it is possible that some participants had some degree of renal impairment. We did not have APOE ε4 allele data. Studies have found slightly higher NfL levels in APOE ε4 heterozygotes and homozygotes (Malek-Ahmadi et al., 2023); others have not found differences (Chatterjee et al., 2022; Sjögren et al., 2000). While none of the patients with bvFTD were deemed to have clinically significant small vessel ischaemic disease based on gold standard assessments, we cannot exclude the possibility for some. To further investigate and extend our findings, it is important that future studies incorporate weight, APOE ε4 status, neuroimaging, renal function into analyses and modelling, and to specifically investigate the clinical utility of including these variables, compared to just a minimum set (e.g. age, sex, plasma NfL, +/− renal function).
We identified statistically higher NfL levels in BPAD, compared to controls, and compared to TRS. This is in the largest group of BPAD to date, to our knowledge. Aggio et al found elevated serum NfL in bipolar depression (Aggio et al., 2022), although their control group was not age-matched and the difference between raw/unadjusted mean levels between BPAD and controls was much larger (9.13 vs 4.28 pg/mL), compared to our study (8.4 pg/mL in BPAD, vs 9.4 and 9.9 pg/mL in Control Groups 1 and 2, respectively). Elevated CSF NfL levels in BPAD have previously been described (Jakobsson et al., 2014; Rolstad et al., 2015). Our finding of elevated levels may suggest a mild degree and/or slow rate of neuronal injury in BPAD, greater than in controls/healthy ageing, but less than clearly neurodegenerative disorders such as bvFTD and Alzheimer’s disease (Ashton et al., 2021). Future research in BPAD with serial NfL levels, associations with inflammation/neuroinflammation biomarkers, neuroimaging, medications/treatments, different stages/phases of illness (e.g. bipolar mania), and longitudinal comprehensive follow-up, will be valuable. Importantly, while there were statistically significant differences between BPAD and control and TRS groups, differences and effects were small, there was significant overlap between groups, and correspondingly poor performance on ROC curve analyses. Therefore, plasma NfL to distinguish BPAD from other primary psychiatric conditions has no clinical utility, while the diagnostic utility to distinguish BPAD from bvFTD, remains high.
Conclusion
This study demonstrated the diagnostic utility of plasma NfL to distinguish bvFTD from PPD, building the accumulating evidence base for a simple blood test to assist with this common yet challenging diagnostic dilemma, of high relevance to a broad range of clinicians. In addition, this study found no significant differences between MDD, TRS and controls, and small elevations in BPAD compared to controls, adding to our understanding of these disorders and evidence suggesting a lack of significant neuronal injury and degeneration (axonal in particular) in PPD. The web-application demonstrates how visualisation of an individual’s NfL level and age, using a large reference cohort and sophisticated modelling, moves beyond coarser age-based binary cut-offs and starts to facilitate individualised and precise medicine interpretation required for best translation into real-world clinical care. Studies are underway to investigate the clinical and diagnostic utility of plasma NfL and the application, including other clinical variables in modelling, in diverse neurodegenerative and primary psychiatric conditions in real-world primary care, and specialist clinical settings.
Supplemental Material
sj-docx-1-anp-10.1177_00048674231187312 – Supplemental material for Plasma neurofilament light in behavioural variant frontotemporal dementia compared to mood and psychotic disorders
Supplemental material, sj-docx-1-anp-10.1177_00048674231187312 for Plasma neurofilament light in behavioural variant frontotemporal dementia compared to mood and psychotic disorders by Dhamidhu Eratne, Matthew Kang, Charles Malpas, Steve Simpson-Yap, Courtney Lewis, Christa Dang, Jasleen Grewal, Amy Coe, Hannah Dobson, Michael Keem, Wei-Hsuan Chiu, Tomas Kalincik, Suyi Ooi, David Darby, Amy Brodtmann, Oskar Hansson, Shorena Janelidze, Kaj Blennow, Henrik Zetterberg, Adam Walker, Olivia Dean, Michael Berk, Cassandra Wannan, Christos Pantelis, Samantha M Loi, Mark Walterfang, Samuel F Berkovic, Alexander F Santillo and Dennis Velakoulis in Australian & New Zealand Journal of Psychiatry
Footnotes
Acknowledgements
The authors acknowledge the contribution of the following people: Associate Professor Chad Bousman, Professor Ian Everall, and Associate Professor Mahesh Jayaram. Finally, the authors thank all the participants and their families for their participation.
Author Contributions
Statistical Analysis Conducted by Dr Dhamidhu Eratne; A/Prof Charles Malpas; and Dr Steve Simpson-Yap.
Authors’ Note
The corresponding author had full access to all the data in the study and had final responsibility for the decision to submit for publication.
Declaration of Conflicting Interests
The author(s) declared the following potential conflicts of interest with respect to the research, authorship, and/or publication of this article: O.H. has acquired research support (for the institution) from ADx, AVID Radiopharmaceuticals, Biogen, Eli Lilly, Eisai, Fujirebio, GE Healthcare, Pfizer, and Roche. In the past 2 years, he has received consultancy/speaker fees from AC Immune, Amylyx, Alzpath, BioArctic, Biogen, Cerveau, Eisai, Fujirebio, Genentech, Novartis, Novo Nordisk, Roche, and Siemens. M.W. has received research support from Eli Lilly, Bristol-Myers Squib, Pfizer, Roche, Vtesse, and Actelion. He has also received consultancy/speaking fees from Biomarin, Actelion, Mallinckrodt and Orphan Pharmaceuticals. A.J.W. has received grant/fellowship support from the Trisno Family Gift and Deakin University. H.Z. has served at scientific advisory boards and/or as a consultant for Abbvie, Acumen, Alector, Alzinova, ALZPath, Annexon, Apellis, Artery Therapeutics, AZTherapies, CogRx, Denali, Eisai, Nervgen, Novo Nordisk, Optoceutics, Passage Bio, Pinteon Therapeutics, Prothena, Red Abbey Labs, reMYND, Roche, Samumed, Siemens Healthineers, Triplet Therapeutics, and Wave, has given lectures in symposia sponsored by Cellectricon, Fujirebio, Alzecure, Biogen, and Roche, and is a co-founder of Brain Biomarker Solutions in Gothenburg AB (BBS), which is a part of the GU Ventures Incubator Programme (outside submitted work). K.B. has served as a consultant and at advisory boards for Acumen, ALZPath, BioArctic, Biogen, Eisai, Julius Clinical, Lilly, Novartis, Ono Pharma, Prothena, Roche Diagnostics, and Siemens Healthineers; has served at data monitoring committees for Julius Clinical and Novartis; has given lectures, produced educational materials and participated in educational programmes for Biogen, Eisai and Roche Diagnostics; and is a co-founder of Brain Biomarker Solutions in Gothenburg AB (BBS), which is a part of the GU Ventures Incubator Programme, outside the work presented in this paper.
Funding
The author(s) disclosed receipt of the following financial support for the research, authorship, and/or publication of this article: The authors acknowledge the financial support of the CRC for Mental Health. The Cooperative Research Centre (CRC) programme is an Australian Government Initiative. The authors acknowledge the CRC Scientific Advisory Committee, in addition to the contributions of study participants, clinicians at recruitment services, staff at the Murdoch Children’s Research Institute, staff at the Australian Imaging, Biomarkers and Lifestyle Flagship Study of Aging, and research staff at the Melbourne Neuropsychiatry Centre, including coordinators Merritt, A., Phassouliotis, C., and research assistants, Burnside, A., Cross, H., Gale, S., and Tahtalian, S. Participants for this study were sourced, in part, through the Australian Schizophrenia Research Bank (ASRB), which is supported by the National Health and Medical Research Council of Australia (Enabling Grant N. 386500), the Pratt Foundation, Ramsay Health Care, the Viertel Charitable Foundation and the Schizophrenia Research Institute. We thank the Chief Investigators and ASRB Manager: Carr, V., Schall, U., Scott, R., Jablensky, A., Mowry, B., Michie, P., Catts, S., Henskens, F., Pantelis, C., Loughland, C. We acknowledge the help of Jason Bridge for ASRB database queries. The authors are grateful for assistance from Brett Trounson and Dr Christopher Fowler and the team at The Florey Oak St Biobank.
A.J.W. was supported by a Trisno Family Fellowship, funded in part by an NHMRC CRE (1153607). C.P. was supported by a National Health and Medical Research Council (NHMRC) Senior Principal Research Fellowship (1105825), an NHMRC L3 Investigator Grant (1196508). H.Z. is a Wallenberg Scholar supported by grants from the Swedish Research Council (#2022-01018), the European Union’s Horizon Europe research and innovation programme under grant agreement No 101053962, Swedish State Support for Clinical Research (#ALFGBG-71320), the Alzheimer Drug Discovery Foundation (ADDF), USA (#201809-2016862), the AD Strategic Fund and the Alzheimer’s Association (#ADSF-21-831376C, #ADSF-21-831381C, and #ADSF-21-831377C), the Bluefield Project, the Olav Thon Foundation, the Erling-Persson Family Foundation, Stiftelsen för Gamla Tjänarinnor, Hjärnfonden, Sweden (#FO2022-0270), the European Union’s Horizon 2020 research and innovation programme under the Marie Skłodowska-Curie grant agreement No 860197 (MIRIADE), the European Union Joint Programme – Neurodegenerative Disease Research (JPND2021-00694), and the UK Dementia Research Institute at UCL (UKDRI-1003).
KB is supported by the Swedish Research Council (#2017-00915 and #2022-00732), the Swedish Alzheimer Foundation (#AF-930351, #AF-939721 and #AF-968270), Hjärnfonden, Sweden (#FO2017-0243 and #ALZ2022-0006), the Swedish state under the agreement between the Swedish government and the County Councils, the ALF-agreement (#ALFGBG-715986 and #ALFGBG-965240), the European Union Joint Programme for Neurodegenerative Disorders (JPND2019-466-236), the Alzheimer’s Association 2021 Zenith Award (ZEN-21-848495), and the Alzheimer’s Association 2022-2025 Grant (SG-23-1038904 QC). This study was also supported by MACH MRFF RART 2.2, NHMRC (1185180), and Psychiatry and Rehabilitation Division, Region Skåne, Sweden. The role of these funding sources was to support research study staff and biosample analyses.
ORCID iDs
Supplemental Material
Supplemental material for this article is available online.
References
Supplementary Material
Please find the following supplemental material available below.
For Open Access articles published under a Creative Commons License, all supplemental material carries the same license as the article it is associated with.
For non-Open Access articles published, all supplemental material carries a non-exclusive license, and permission requests for re-use of supplemental material or any part of supplemental material shall be sent directly to the copyright owner as specified in the copyright notice associated with the article.