
Abstract
Objective:
Investigating diurnal variation in the timing of suicidal behaviours offers opportunity to better understand its various proximal risk factors. Acute use of alcohol is a potent proximal risk factor for suicidal behaviour, though the nature of this risk is poorly understood. The aim of this study was to compare the diurnal variation in time of poison ingestion between deliberate self-poisonings that involve alcohol versus those that do not.
Methods:
A retrospective analysis of consecutive presentations to a toxicology service following deliberate self-poisoning, 1996–2016. An independent samples Kolmogorov–Smirnov test was performed to test the null hypothesis that the diurnal distribution of poison ingestion time was equal across self-poisonings that did and did not involve alcohol co-ingestion. Presence of circadian rhythmicity was established using cosinor analysis.
Results:
A total of 11,088 deliberate self-poisoning records, for 7467 patients (60.8% females), were included in the analysis. In all, 31.3% of the total records involved alcohol co-ingestion. Distribution of exposure time was significantly different between deliberate self-poisonings that did and did not involve alcohol (p < 0.001). The alcohol co-ingestion group showed a significantly greater prominent peak with poisoning occurring later in the evening (~20:00 hours) compared to poisonings that did not involve alcohol (~18:00 hours).
Conclusion:
This study exposed the differential diurnal patterns in deliberate self-poisoning according to the presence of alcohol co-ingestion. This analysis adds to the accumulating evidence that suicidal behaviour that involves alcohol co-ingestion represents a distinct subtype, which may be driven by alcohol consumption patterns in society. This also means that this large proportion of deliberate self-poisonings may not otherwise have occurred if it were not for alcohol consumption, underscoring the importance of drug and alcohol services for alcohol-related self-harm.
Introduction
Investigating circadian variation in the onset of suicidal behaviours (suicidal thoughts, non-fatal suicide attempts, and suicide deaths) offers opportunity to understand its various proximal risk factors. Proximal risk is the moment where a distal suicide risk is propelled into an immediate action of attempted or completed suicide. Both suicide attempts and suicide deaths display significant and fairly consistent circadian patterns (Altamura et al., 1999; Caracciolo et al., 1996; Manfredini et al., 1994; Motohashi, 1990), though an in-depth understanding of these rhythms is limited. To date, the interpretation of circadian patterns related to suicidal behaviour is largely focused on various intrinsic circuitry that also fluctuates with the biological clock, such as mood and stress. While there is no doubt that such intrinsic changes play a role in the timing of a suicidal act, there are also a number of other external risk factors that (a) interact with the biological clock, (b) are known proximal drivers of suicide and (c) whose timing may be more amenable to intervention. Acute use of alcohol is one such potent proximal risk factor for suicidal behaviour (Conner et al., 2014). Co-ingestion of alcohol is involved in around one-third of completed suicides and an even greater number of suicide attempts (Conner et al., 2014).
There is an emerging view that the acute involvement of alcohol represents a clinically distinct, and potentially even phenotypically distinct, type of suicidal behaviour (Chachamovich et al., 2012; Fudalej et al., 2009; Moustgaard et al., 2014). Suicidal behaviour driven by patterns of alcohol use is distinct from highly premeditated actions that occur regardless of whether alcohol is involved (Bagge et al., 2015). This is supported by noted associations between cultural drinking norms and alcohol-related suicidal behaviours. In a US study of over 50,000 suicides, there were positive associations found between suicides with a positive blood alcohol concentration and density of alcohol outlets (Giesbrecht et al., 2015). Sex differences are also indicative of this relationship – males, who more commonly use and misuse alcohol, are also more likely to have alcohol acutely involved in suicide compared to females (Kaplan et al., 2013; Pompili et al., 2010).
Given that drinking is a cultural practice with clear circadian variation, the timing of suicidal behaviours that involve alcohol is an area of significant interest. In Australia, excessive alcohol consumption commonly takes place after work hours and on weekends (Lloyd et al., 2013). Hence, these are times where suicidal behaviour that is driven by alcohol would most commonly occur. Moreover, circadian variations in sensitivity to acute use of alcohol are also apparent, which suggest that there may be particular times of the day that alcohol has the greatest biological influence on the initiation of suicidal behaviour. For example, studies in rats and humans have shown that circadian rhythmicity modulates various physiological, cognitive, and psychological effects of alcohol on the body (Brick et al., 1984; Devaney et al., 2003; Liu et al., 2000), and the pattern of alcohol intake (Spanagel et al., 2005).
Deliberate self-poisoning (DSP) is the leading cause of attempted suicide, and a strong predictor of future suicide (Finkelstein et al., 2015). Furthermore, self-poisoning is the method most commonly associated with alcohol co-ingestion (Boenisch et al., 2010). In our associated toxicology services, alcohol is one of the most commonly co-ingested agents in non-fatal DSPs (Buckley et al., 2015). DSPs, like suicide attempts more generally, display a circadian pattern (Manfredini et al., 1994) and we have recently observed raw differences in the timing of poisonings that involve alcohol in our associated toxicological services (Chitty et al., 2016). While the influence of co-ingested alcohol on timing of DSP specifically has not been thoroughly explored, there have been studies to investigate its role in the timing of self-harming behaviour more generally (Blenkiron et al., 2000; Hawton et al., 2007; Valtonen et al., 2006). These previous studies by others and ourselves were not designed to measure specific differences in the circadian patterns associated with alcohol co-ingestion. Although all studies found that acute use of alcohol is associated with episodes that are more likely to occur ‘later’ – the definition of which varied between 17:00 and 03:00 hours (Blenkiron et al., 2000; Chitty et al., 2016; Hawton et al., 2007; Valtonen et al., 2006). Hence, supporting the idea that societal alcohol consumption patterns may influence the timing of self-harm.
Thoroughly investigating the timing and circadian patterns of DSP that involve co-ingested alcohol, and how (or if) they differ from non-alcohol-related events, has the potential to further knowledge in three ways: (a) to better define alcohol-related suicidal behaviour as a distinct subtype, (b) to determine the degree to which alcohol-related DSPs are driven by cultural drinking norms and (c) to identify certain circadian ‘risk periods’ where alcohol consumption may have the greatest biological influence on the timing of suicidal behaviour.
Aims of the study
We aim to provide a circadian analysis that differentiates DSPs into those that involve co-ingestion of alcohol versus those that do not involve alcohol. We hypothesize that those that involve the co-ingestion of alcohol will display a significantly different circadian pattern to those that do not, and this will be largely attributed to the 24-hour pattern of alcohol consumption in Australia, with peak consumption occurring in the early to late evening.
Methods
Database
Data were acquired from a cohort study from 1987 to June 2016 of consecutive poisoning presentations to a tertiary toxicology service (Buckley et al., 1999, 2015). In 1996, the database underwent a major revision, so to provide the most consistent representation of DSP, we have only used data since 1996. The toxicology service has direct clinical responsibility for all adult poisoned patients in all hospitals in an Australian region covering a population of around 500,000. A comprehensive 24-hour per day toxicology service is provided and data are routinely recorded on all patients who present to hospital for poisoning (Buckley et al., 2015). A structured data collection form is used for prospective collection of information on patient demography, all drugs and doses ingested, co-ingested substances, regular medication, the type of poisoning (e.g. intentional, unintentional), and details of management (Buckley et al., 1999). Presentation time is recorded as the time that the patient presented at any healthcare service for their poisoning (including the ambulance). In this study, if presentation time was absent from the record (~9% of total cases), then admission time was used, which was the time that the toxicology service was consulted and assumed care of the patient. The ingestion time is the time the poison(s) were ingested as reported by the patient or admitting doctor in the emergency department. Often, these times are only reasonable estimates based on how long prior to presentation the poison was ingested (e.g. ‘approximately 1 hour ago’).
From 1996 to 2013, data were entered routinely into a fully relational research Microsoft Access (Microsoft Corp., Redmond, US) database separate to the hospital’s main medical record system. From 2014 onward, similar data were entered into a Filemaker database. A clinical toxicologist reviews the information for all admissions weekly, and any additional information is obtained from the medical record within a week of hospital discharge. The Hunter New England Area Health Service Human Research Ethics Committee has approved this study.
Inclusion criteria and coding
Figure 1 shows the inclusion flow diagram for the sample from the database. Records were analysed if they satisfied the following inclusion criteria:
The poisoning was deliberate,
Patient was aged over 18 years of age at the time of admission,
Time between ingestion and presentation time ⩽24 hours,
The record had available data for ingestion time and presentation time.
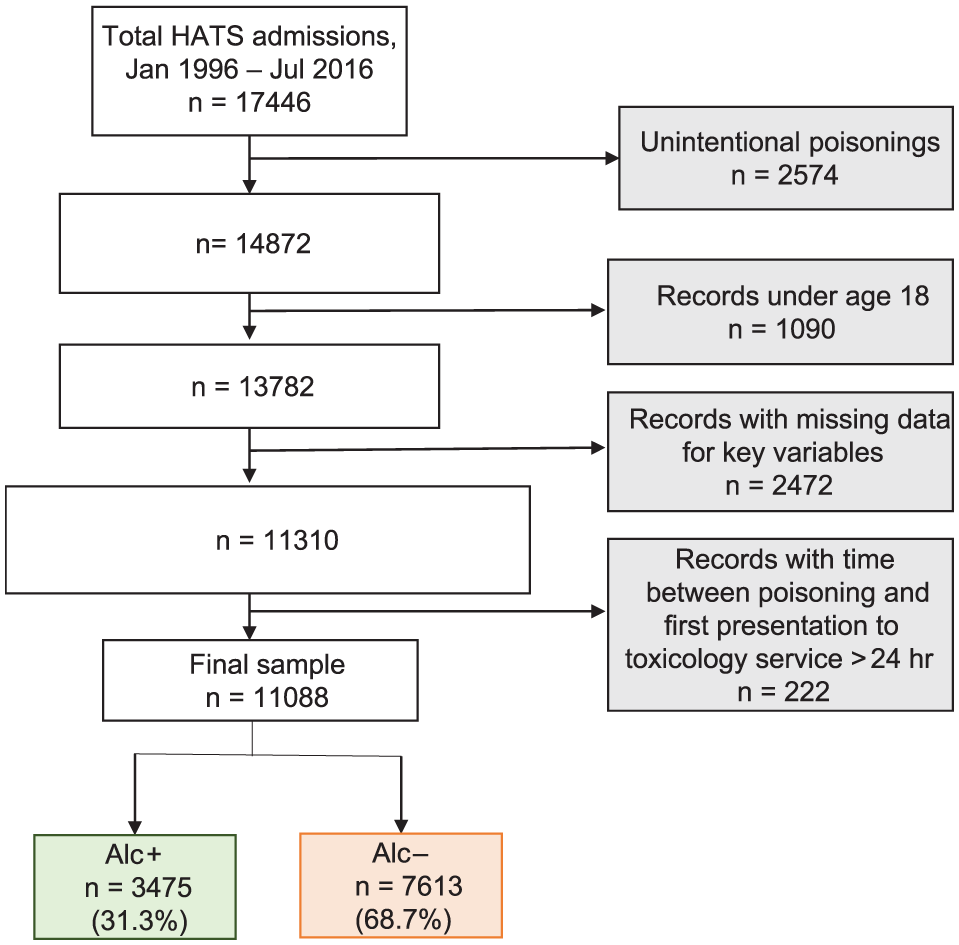
Flow diagram of patient inclusion. Time to hospital calculated as time between reported ingestion time and time of hospital presentation, or hospital admission if hospital presentation time was missing. Incomplete time data included records where estimate poison ingestion time or time of hospital presentation and admission were missing.
Eighteen years is the legal age for alcohol consumption in Australia, and hence was chosen as a cut-off as to not introduce potential bias associated with alcohol accessibility. Time between poison ingestion and first presentation to toxicology service (‘time to presentation’) was grouped into 15-minute bins (e.g. cases presenting to the toxicology service within 15 minutes of poison ingestion were binned into the 0- to 15-minute category). In order to provide the best estimate of ingestion time, we limited the time between reported ingestion and service presentation to 24 hours, as those beyond this timeframe do not represent acute poisonings and are less likely to be accurate. Repeat presentations to the toxicology service (i.e. one patient with more than one DSP admission) were included in analyses. If a patient identified himself or herself as transgender, their preferred sex was used for sex analyses.
Admissions were coded into alcohol groups, those who did co-ingest alcohol (Alc+) and those who did not (Alc−), based on whether alcohol was reported as, or determined to be, an ingested substance in the DSP. Records were grouped into 24 increments of 1 hour (e.g. 01:00 to 01:59 binned into the 1:00 a.m. category) according to the ingestion time. Records were also separated into month of the year and day of the week of ingestion, followed by further coding into whether ingestion occurred on a weekday (Monday–Friday) or a weekend (Saturday or Sunday).
Data analysis
To assess group differences in patient characteristics, data were analysed using a t-test or chi-square, where appropriate. The Mann–Whitney was used to compare time to presentation between Alc+ and Alc−. Initially, in order to examine distribution of ingestion times, ingestion time (24 hour) was plotted against total number of records in each hour bin as a percentage of the total number of records in that group. Visual inspection of time plots was conducted separately for Alc+ and Alc−. Day of the week was plotted against total number of records in each hour bin as a percentage of the total number of records in that group. Once visual patterns were established, an independent samples Kolmogorov–Smirnov test was performed to test the null hypothesis that distribution of ingestion time/day was equal across Alc+ and Alc−. Using the same methods, a within-group analysis was conducted to investigate whether other potential determinants had an effect on the poisoning pattern, including sex and whether the poisoning occurred on a weekend or weekday.
In order to investigate whether month of year influenced the circadian patterns of poisonings within each group, the Kruskal–Wallis test was used to determine whether there were any significant differences in the distribution of ingestion time between months – in other words, whether the timing of DSPs shifted according to time of year.
Cosinor analysis was used to examine differences in the circadian parameters between the groups. These parameters are as follows: the rhythm adjusted mean, amplitude of oscillation, acrophase and the period. Using the known period value (24 hour), the cosinor fit was obtained with linear regression by the method of least squares. The unknown parameters that best fit the cosine wave of the time series are then derived (Refinetti et al., 2007). Circadian rhythmicity was established for Alc+ vs Alc− (using R version 3.2.3 and Stata version 14.2 [Stata Corp., College Station, US]).
Results
Sample demographics
A total of 11,088 DSP admissions for 7467 patients were included in the analysis. Of the 7467 patients included, 4540 (60.8%) patients were female. Patients were aged 18–97 years (mean, 35.8 years; median, 34 years; interquartile range: Q1 – 25, Q2 – 34, Q3 – 45). Alcohol was co-ingested in 3475 (31.3%) of the 11,088 total included admissions.
Time between ingestion and first presentation to toxicology service
There was a longer time to presentation to toxicology service for Alc− compared to Alc+ (p < 0.001).
Distribution statistics
Table 1 shows the distribution of Alc+ and Alc− DSP by time. The majority of DSPs occur between 18:00 and 23:00 hours, with a peak in the raw data at 20:00 hours. The radar plot (Figure 2) shows the differences between groups with peak in ingestion time in the Alc+ sample, also seen at 20:00 hours, whereas the raw data peak for Alc− is less pronounced and occurred at 18:00 hours.
Number and proportion of deliberate self-poisonings per time bin (Jan 1996–June 2016).
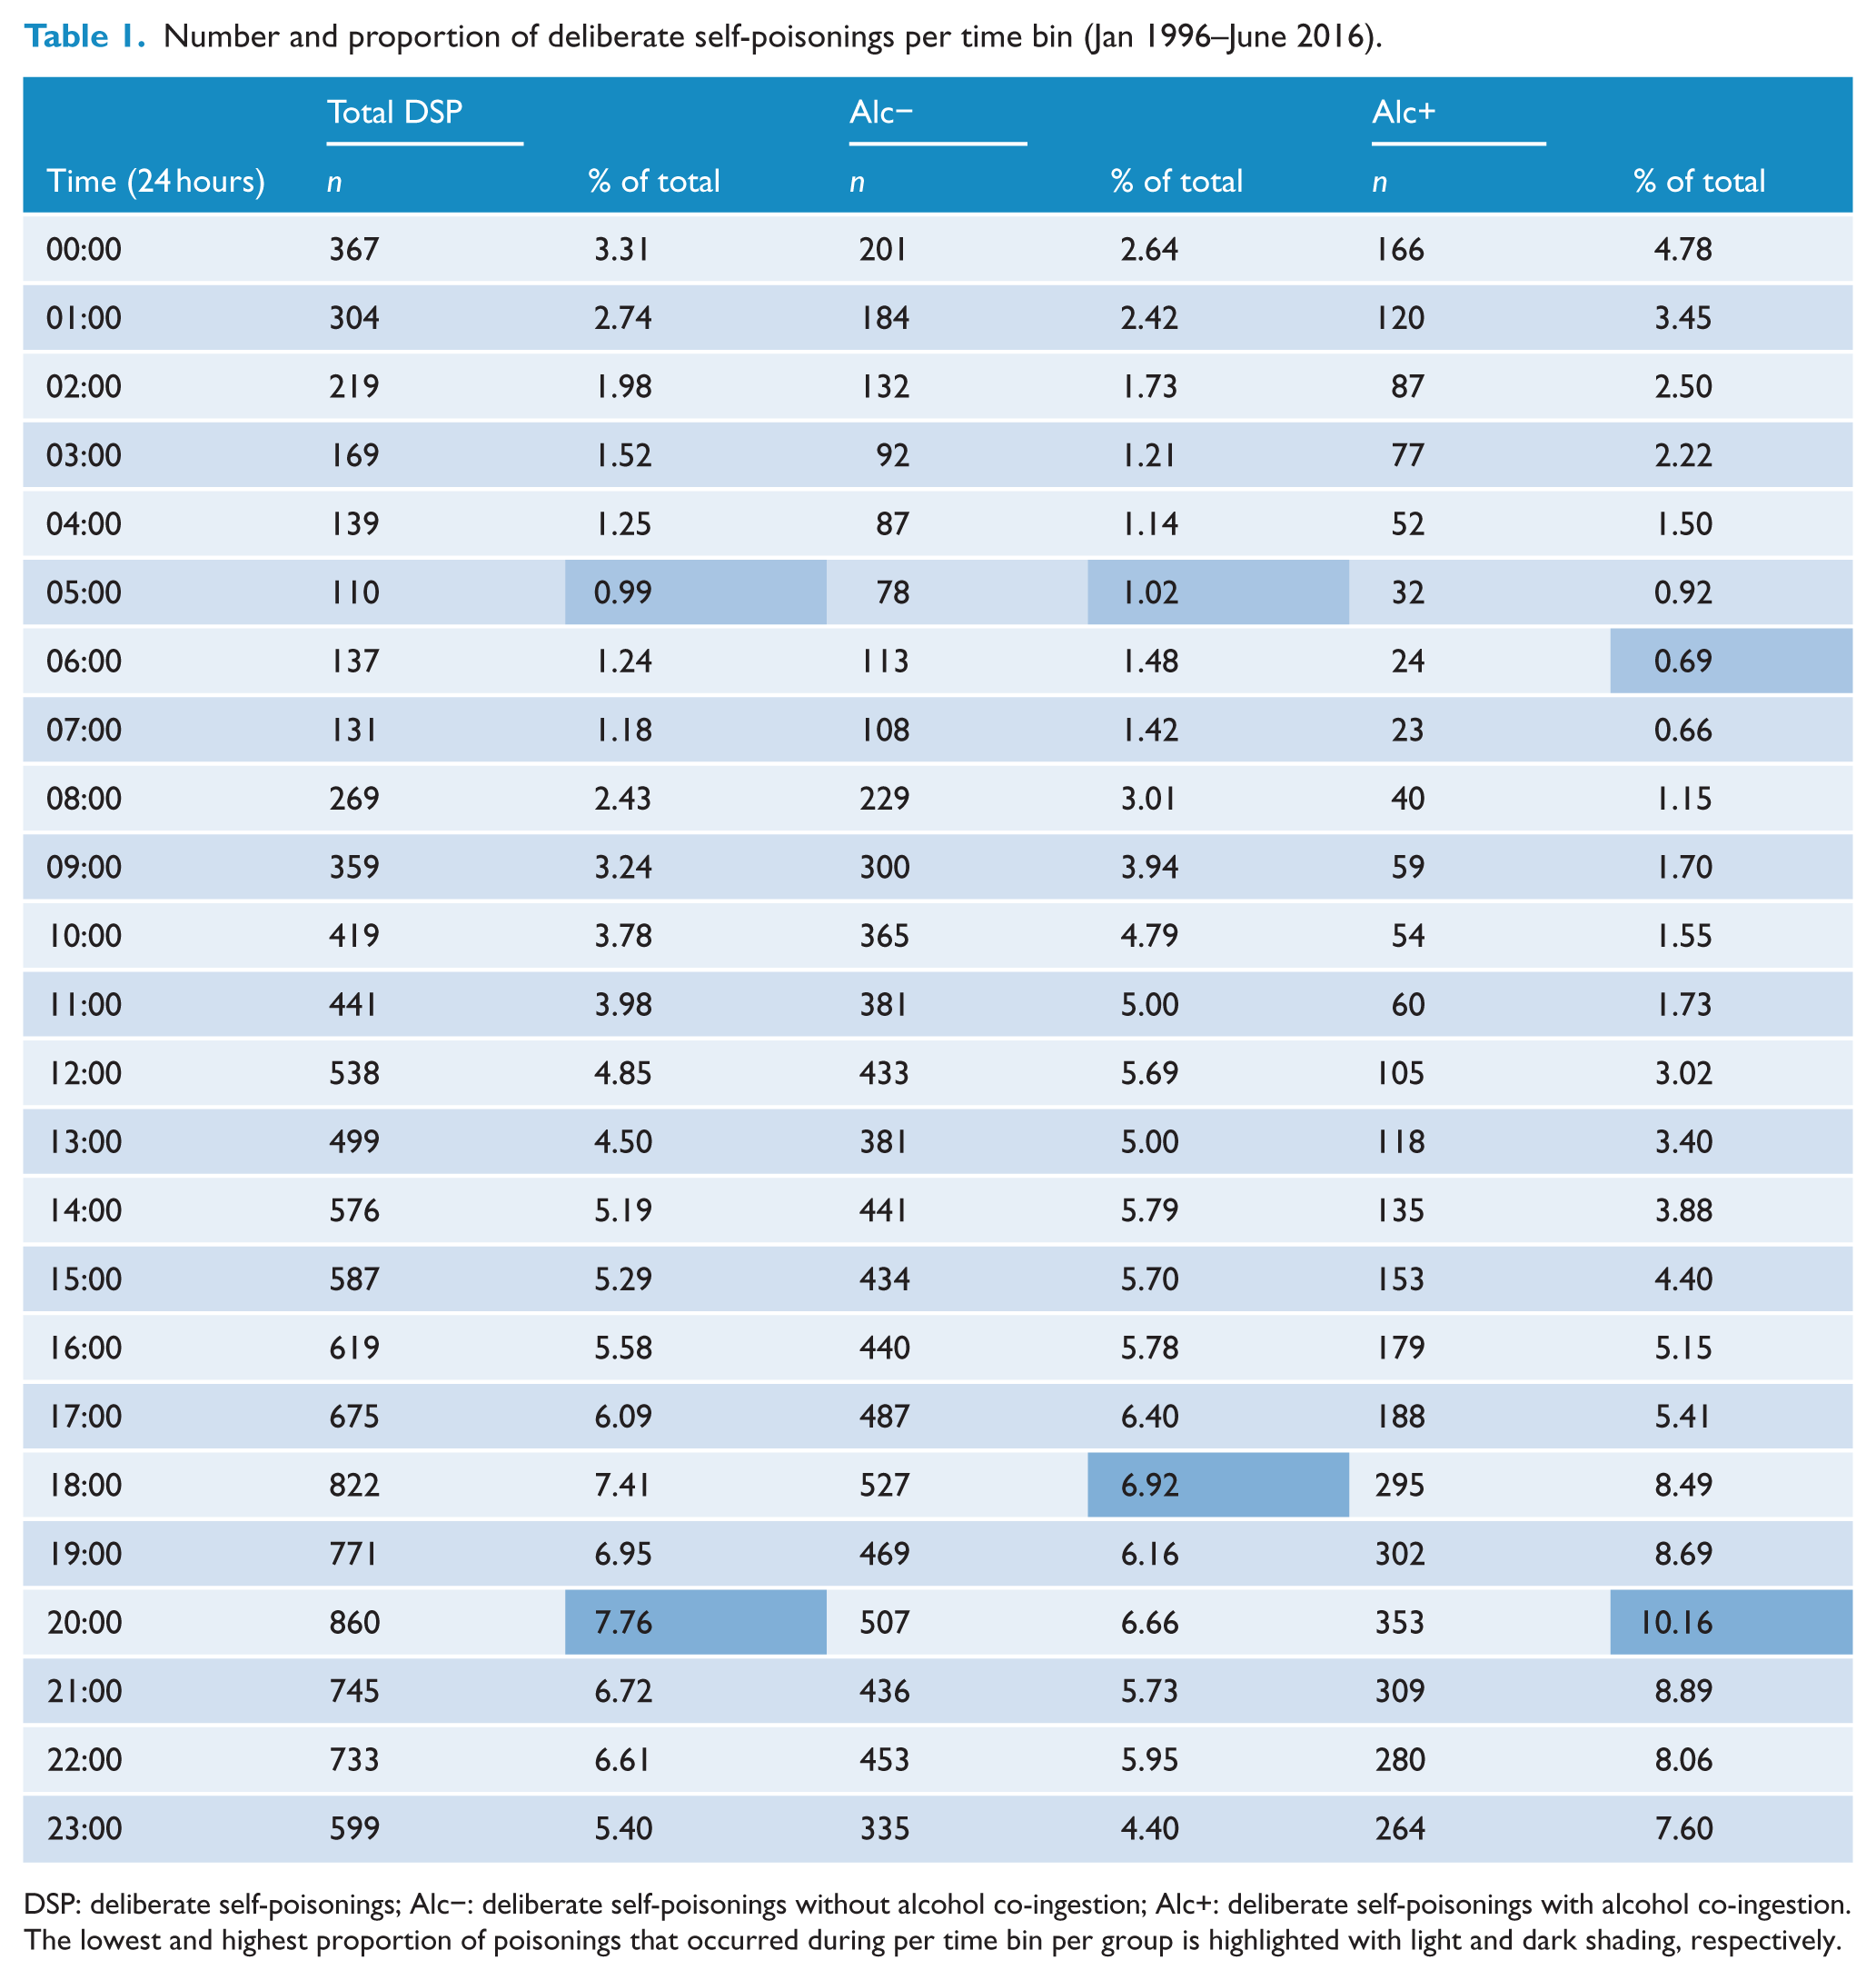
DSP: deliberate self-poisonings; Alc−: deliberate self-poisonings without alcohol co-ingestion; Alc+: deliberate self-poisonings with alcohol co-ingestion.
The lowest and highest proportion of poisonings that occurred during per time bin per group is highlighted with light and dark shading, respectively.
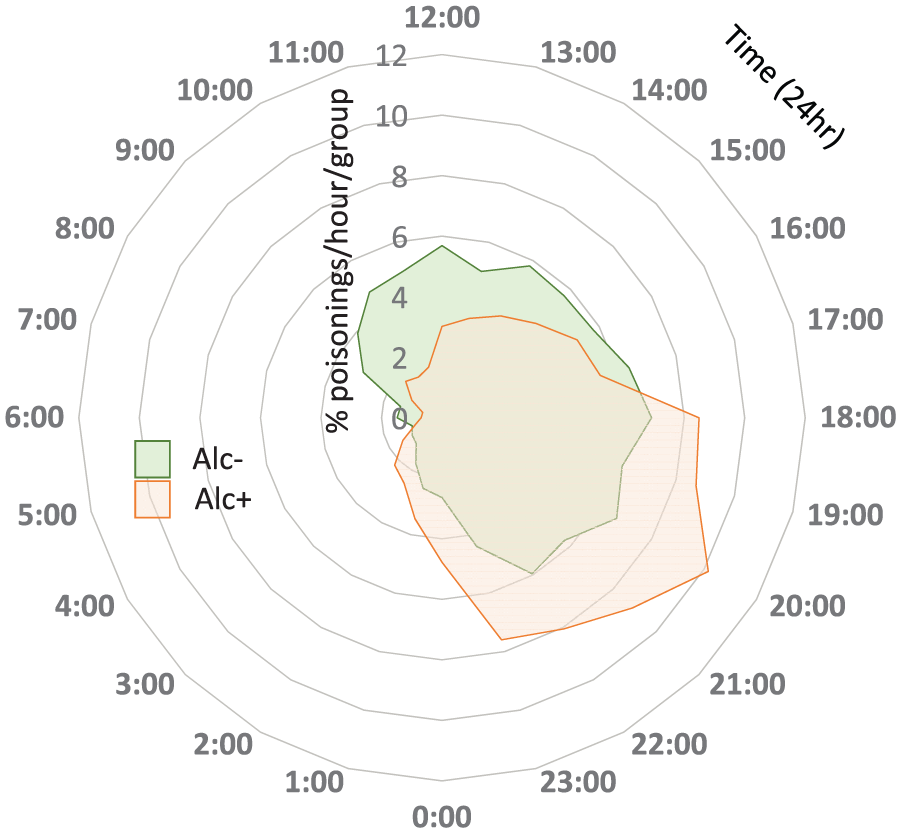
Raw distributions of ingestion time. Radar plot showing percentage of poisonings/group/hour (e.g. poison ingestion for 1.65% of the Alc− group occurred at 2:00 a.m.). Time is represented clockwise on the external axis. Percentage is represented on concentric axes. The two-sample K-S test identified that the distribution of time of ingestion was significantly different between Alc− and Alc+ (p < 0.001).
The K-S test identified that the distribution of ingestion time was significantly different between Alc− and Alc+ (p < 0.001). Distributions according to alcohol group and sex are shown in Supplementary Material 1. There were no within-group differences in sex distribution of ingestion times. The distribution according to day was significantly different between Alc+ and Alc−, χ2(6) = 39.1, p < 0.001, with a higher percentage of Alc+ poisonings occurring on Saturday and a lower percentage occurring on Monday and Tuesday (Supplementary Material 2). Within the Alc+ group, the K-S test identified a significant difference in ingestion time between weekend and weekday ingestions (higher proportion occurring on the weekend) (Supplementary Material 3).
The Kruskal–Wallis test did not identify significant differences in the distribution of ingestion time between months of the year for Alc+, χ2(11) = 7.61, p > 0.05, or Alc−, χ2(11) = 8.62, p > 0.05 (Figure 3).
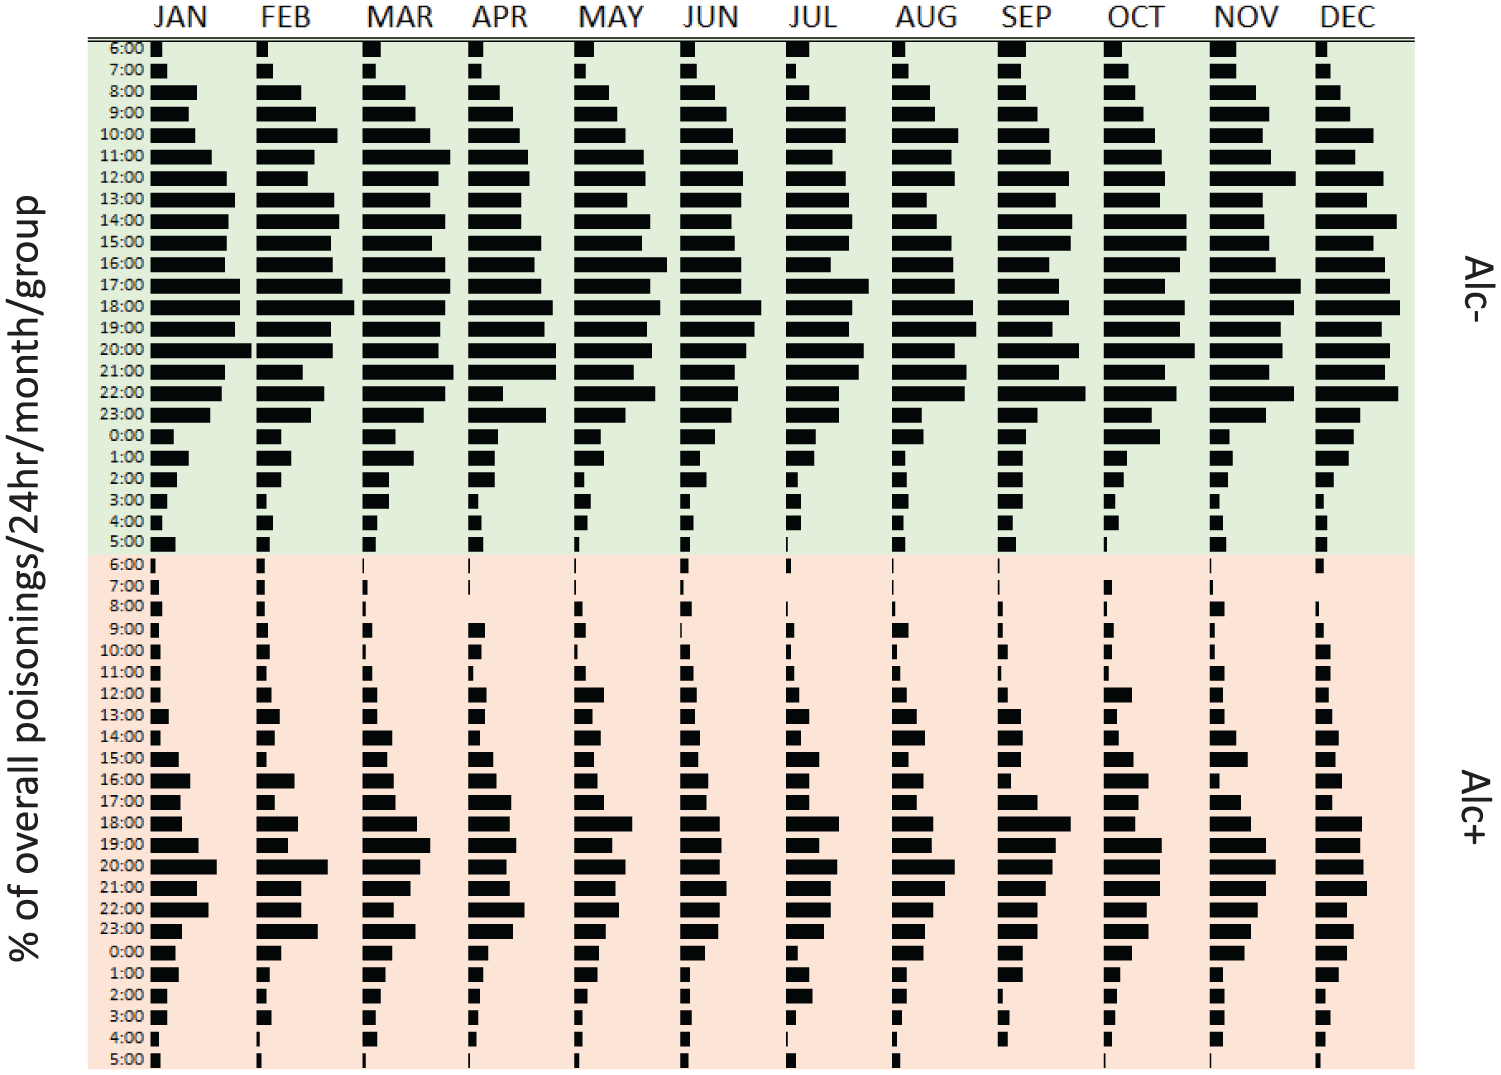
Percentage of overall poisonings that occurred per time/month/group, separated according to alcohol group (Alc+, Alc−). Bars represent the distribution of poisonings overall that occurred per 24 hour time/month/group. Sum of all bars equal 100% (e.g. 0.05% of all poisonings between 1996 and 2016 were Alc− and occurred at 06:00 hours in January).
Cosinor analysis
The cosinor model had a good fit to the raw data (r2 = 0.95) (Figure 4). The amplitude and mean of the curve were calculated as the percent of the mean number of DSPs/hour for each group, the acrophase was calculated in radians. The Wald statistic demonstrated that Alc+ and Alc− groups differed significantly in mean (0.20; 95% confidence interval [CI] = [0.19, 0.21]; p < 0.001), amplitude (0.27; 95% CI = [0.26, 0.28]; p < 0.001) and acrophase (–2.36; 95% CI = [–2.37, –2.35]; p < 0.001). This can be observed visually via inspection of the raw distributions (Figure 2) and the cosine curves (Figure 4). The Alc− group ingestion times across the day vary by less than 20%, whereas the Alc+ group demonstrates a prominent peak at 20:00 hours.
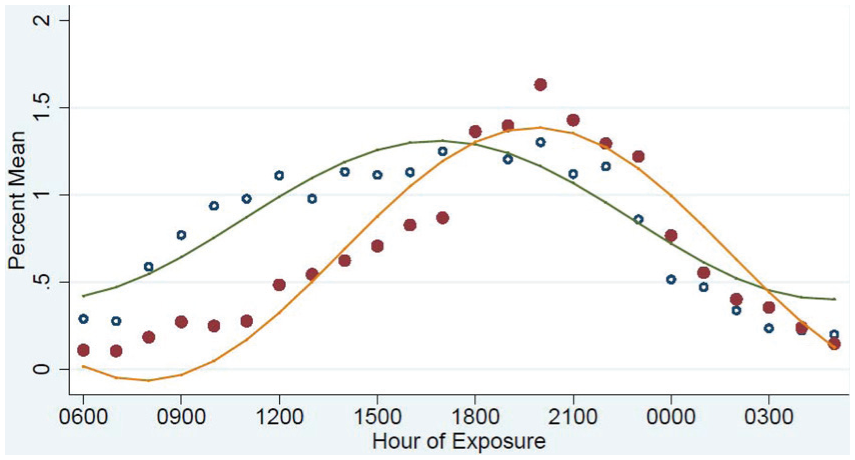
Fitted cosinor curves. Fitted cosinor curves for Alc+ (orange line represents fitted curve, red solid dots represent observed values) and Alc− (green line represents fitted curve, blue circles represent observed values). Hourly mean for observed counts was calculated as a percent of overall mean for that group.
Discussion
This study has shown clear circadian patterns of DSP, and significant differences between Alc+ and Alc−. Our Alc− results agree with previous studies looking at attempted suicide, also finding a peak at approximately 18:00 hours (De Maio et al., 1982; Manfredini et al., 1994; Motohashi, 1990). This consistency is quite remarkable, and we agree with previous researchers that this may be related to chronobiological changes in serotonergic activity (Manfredini et al., 1994). The cosine curve for the Alc− closely resembles the general wake and sleep cycle; ingestion times slowly rising from 06:00 to 09:00 hours and then plateauing for much of the day until 23:00 hours when the rates decrease again, down to a minimum at 05:00 hours. In contrast, the pattern observed for Alc+ DSP shows a more prominent diurnal pattern, and this is reflected in the difference between the parameters. The peak time of poison ingestion is 20:00 hours for Alc+ compared to 18:00 hours for Alc−, and the much higher amplitude of the Alc+ circadian pattern reflects the higher predominance of this peak.
These results suggest that the timing of Alc+ DSPs is in line with cultural drinking norms in Australia – with peak ingestion times on weekends and after work hours (Lloyd et al., 2013). On the other hand, categorizing cases according to sex – a major biological difference – did not show differences in ingestion time in either the Alc+ or the Alc− group (Supplementary Material 1). This highlights the primary influence of acute alcohol on the timing of DSP. Furthermore, there was no difference in timing of ingestions across month of year, which potentially suggests that external light/dark cues (i.e. changes in sunlight hours throughout the year) do not play a key role, and surprisingly, nor do seasonal drinking patterns (i.e. increased alcohol consumption during the festive season). The only Alc+ within-group difference was observed between weekend and weekday distributions, with early morning ingestions (i.e. 00:00–04:00 hours) more prominent on the weekend (Supplementary Material 3). This within-group difference again reflects environmental drivers, rather than biological ones, as in Australia, alcohol consumption continues into early morning hours more prominently on the weekend than during the week. Perhaps better understanding of these findings can come from drawing on the timing of other alcohol-related behaviours, such as non-intentional poisoning involving alcohol (i.e. recreational poisoning) and alcohol-fuelled violence. Our previous analysis of recreational poisoning admissions, some of which included alcohol co-ingestion, also showed peak hospital presentation on weekends and were more likely to occur between 18:00 and 06:00 hours than other types of poisonings (i.e. deliberate, accidental, etc.) that did not involve alcohol (Chitty et al., 2016), highlighting that alcohol-related DSPs share greater similarities in terms of timing to non-intentional recreational poisonings than to Alc− DSPs. Alternatively, the predominant increase in alcohol-fuelled violence seen on weekends in Australia (Briscoe and Donnelly, 2001; Morgan and McAtamney, 2009) is of far greater magnitude than that of alcohol-related DSPs seen in the present study. Hence, alcohol-related DSPs might not necessarily reflect binge drinking practices, but ‘regular’ alcohol consumption patterns.
With results that suggest cultural drinking patterns play a role in the relationship between alcohol and DSP, support for tightening liquor licensing may be warranted. That said, significant changes to Newcastle’s liquor licensing in 2008 did not disrupt the upward trajectory of alcohol-related DSPs between 1996 and 2013 noted in our previous HATS study (Chitty et al., 2016). The reasons behind this could be related to the aim of these licensing changes (which involved tightening of responsible service of alcohol regulations and reduced trading hours), which was to reduce violence as a result of binge drinking (Kypri et al., 2014), underscoring again that perhaps the amount of alcohol consumption associated with DSP is not as great as that associated with alcohol-related violence and therefore legislation that specifically targets binge drinking may not influence this behaviour. Further study is required to investigate the level of intoxication involved with DSPs.
Researchers have hypothesized that Alc+ suicide attempts are characterized by lower premeditation and intent compared to Alc− – though only when alcohol is not used to facilitate the suicidal behaviour by reducing inhibitions (Bagge et al., 2015). The use of alcohol as a facilitator is an especially relevant concept when considering DSP, as alcohol may be perceived as a substance that can increase the toxicity of the poison or to mask its taste. However, a recent study has shown that almost 75% of suicide attempts that involve alcohol do not use it as a facilitator (Bagge et al., 2015). This is supported by our results – if alcohol was only used as a facilitator, it would not display a significantly different circadian pattern to Alc−. Furthermore, that the mean time until presentation was shorter for co-ingested alcohol DSP may also represent underlying intent – with those who have less intent to seriously harm themselves more likely to seek rapid medical attention. The Alc− curve, on the other hand, may be construed as an indicator of more consistent intent, showing a plateaued curve that seems to be related to waking hours.
Although the Alc+ results follow cultural drinking patterns, there are also biological considerations worth noting. The prominent Alc+ peak could also represent a time of the day when the risk of suicidal behaviour under the influence of alcohol is heightened. Indeed, research has shown that response to alcohol in humans is influenced by circadian rhythms in terms of core body temperature (Devaney et al., 2003), cognition (Liu et al., 2000) and driving performance (Horne and Baumber, 1991). Another possible biological pathway between alcohol and timing of self-harm is through the serotonergic system. This neural system shows significant circadian variation (Matheson et al., 2015) is heavily implicated in impulsive suicide attempts (Verkes et al., 1996) and is acutely affected by alcohol consumption (i.e. consumption behaviour, intoxicating effects, tolerance, withdrawal and reward).
The interpretations of this study should be considered in light of limitations, as the toxicology database was not designed to answer questions surrounding the relationship between alcohol use and DSP. We do not have information on many aspects of the alcohol use that would be beneficial for our analysis, including the timing of alcohol use in relation to the DSP, the blood alcohol concentration and the patient’s motivation for drinking on the day of the attempt. This is important information and an opportunity for further research.
In conclusion, this analysis adds to the accumulating evidence that Alc+ and Alc− represent different types of suicidal behaviour: Alc+ driven by alcohol consumption patterns in society and, as such, potentially representing episodes with less premeditation and intent. Importantly, this means that this large proportion of DSP may not have otherwise have occurred if it were not for alcohol consumption. This supports potential utility of alcohol or substance misuse services in for DSP treatment, as highlighted in the Royal Australian and New Zealand College of Psychiatrists clinical practice guideline for the management of self-harm (Carter et al., 2016).
Footnotes
Acknowledgements
The authors would like to thank the many people that have contributed to the Hunter Area Toxicology Service database since 1987, including past registrars, advanced trainees, fellows, nursing staff, research assistants and computer programmers.
Declaration of Conflicting Interests
The authors declare that there is no conflict of interest. N.A.B. (Discipline of Pharmacology, University of Sydney) and G.K.I. (Clinical Toxicology Research Group, University of Newcastle) had full access to all the data in the study and take responsibility for the integrity of the data and the accuracy of the data analysis. K.M.C. and K.K. (Discipline of Pharmacology, University of Sydney) conducted and are responsible for the data analysis. K.M.C. had the final responsibility for the decision to submit the paper for publication. The statistical analyses were performed at the University of Sydney.
Funding
An Australian National Health and Medical Research Council (NHMRC) Program Grant supported this work (NHMRC; Grant number: 1055176). An NHMRC Early Career Fellowship funds K.M.C. (Grant number: 1122362); G.K.I. is funded by an NHMRC Senior Research Fellowship (NHMRC; Grant number: 1061041). The funding organization played no part in the design and conduct of the study; collection, management, analysis and interpretation of the data; nor in the preparation, review or approval of the manuscript.
References
Supplementary Material
Please find the following supplemental material available below.
For Open Access articles published under a Creative Commons License, all supplemental material carries the same license as the article it is associated with.
For non-Open Access articles published, all supplemental material carries a non-exclusive license, and permission requests for re-use of supplemental material or any part of supplemental material shall be sent directly to the copyright owner as specified in the copyright notice associated with the article.