
Abstract
Background:
Loneliness has many negative physical and mental health ramifications and is most prevalent among vulnerable social groups. However, little is known about how loneliness is grouped within the population and the characteristics of those groups.
Methods:
We conducted a Latent Profile Analysis on 18,264 participants from the fifth wave of the New Zealand Attitudes and Values Study to identify the number of distinct loneliness profiles in the population. Secondary analyses then determined the representation of various demographic and psychosocial characteristics of participants within each profile.
Results:
Analyses identified four distinct loneliness profiles: ‘high-loneliness’ (5.7%), ‘low-loneliness’ (57.9%), ‘appreciated outsiders’ (29.1%; who received acceptance from others but felt like social outsiders) and ‘superficially connected’ (7.2%; who showed the opposite pattern). ‘High-loneliness’ were the most introverted, emotionally unstable and poorest in wellbeing. ‘Appreciated outsiders’ and ‘superficially connected’ had moderate wellbeing, but ‘appreciated outsiders’ were relatively higher in wellbeing despite greater introversion and neuroticism.
Conclusion:
This research provides a typology of loneliness in New Zealand and identifies groups more likely to experience loneliness. The ‘appreciated outsiders’ and ‘superficially connected’ profiles provide fresh insight into how loneliness may manifest and the relative influences of quality and quantity of social contacts on wellbeing.
Introduction
In New Zealand, 36.1% of people over the age of 15 report feeling lonely at least some of the time (Ministry of Social Development, 2016), and those most likely to report significant loneliness tend to belong to vulnerable social groups, such as the young, old, impoverished, chronically ill and mentally unwell (Smith, 2015). This is of critical concern as loneliness is notably associated with poor mental health outcomes (Statistics New Zealand, 2013), particularly with depression (Alpass and Neville, 2003; Cacioppo et al., 2006; Hawkley and Cacioppo, 2010; Heinrich and Gullone, 2006; Mahon et al., 2006). Indeed, Cacioppo et al. (2010) found that loneliness predicted subsequent increases in depression but depression did not predict escalation of loneliness, which suggests that loneliness may be a key contributor to the onset of depression. This is supported by research demonstrating that loneliness significantly mediates the anxiety–depression relationship, with loneliness potentially resulting from anxiety and subsequently triggering depressive symptoms (Ebesutani et al., 2015).
Loneliness has also been linked to other negative mental health outcomes, including social anxiety (Heinrich and Gullone, 2006; Lim et al., 2016; Mahon et al., 2006), obsessive–compulsive disorder (Timpano et al., 2014), cognitive decline (Hawkley and Cacioppo, 2010) and paranoia (Jaya et al., 2017; Lim et al., 2016). Furthermore, persistent loneliness has been associated with a variety of negative health outcomes and behaviours, including physical health problems (Andersson, 1998; Cacioppo and Cacioppo, 2014; Newall et al., 2014), poor sleep (Cacioppo and Cacioppo, 2014; Heinrich and Gullone, 2006), alcohol consumption (Arpin et al., 2015; Stickley et al., 2013), smoking (Stickley et al., 2013) and increased mortality (Cacioppo and Cacioppo, 2014; Hawkley and Cacioppo, 2010; Holt-Lunstad et al., 2010, 2015).
These associations place loneliness as a key factor when considering the aetiology, maintenance and treatment of mental health disorders. As such, understanding how loneliness manifests in the population is likely to be of considerable utility to the mental health profession. However, little is known about the diverse ways in which members of the population feel loneliness and whether meaningful groups of individuals can be identified based on their loneliness experiences. This research develops a typology of loneliness in New Zealand that investigates the specifics of how loneliness is experienced and its association with demographic and psychosocial characteristics.
Loneliness occurs when an individual perceives his or her social relationships as insufficient or unsatisfying (Peplau and Perlman, 1982; Pinquart and Sorensen, 2001), and it is often experienced as a longing for others which the individual finds aversive or emotionally distressing (Cacioppo et al., 2015; McWhirter, 1990; Weiss, 1973). Notably, loneliness is not equivalent to being alone. Loneliness requires subjective appraisal of one’s social situation as deficient, whereas being ‘alone’ is an objective matter (see Heinrich and Gullone, 2006; Peplau and Perlman, 1982). Accordingly, loneliness and social isolation are only weakly correlated (Coyle and Dugan, 2012), and lonely and non-lonely people do not differ in the nature of their daily activities or the amount of time they spend with others (Heinrich and Gullone, 2006). More specifically, a person could be alone but desire solitude, and therefore not feel lonely (Andersson, 1998; Cacioppo et al., 2015; McWhirter, 1990). Similarly, a person could have many social connections, but still feel lonely if those relationships do not meet his or her needs for companionship and support.
While there have been many studies examining the demographic and psychosocial correlates of loneliness (e.g. Andersson, 1998; Heinrich and Gullone, 2006; Mahon et al., 2006; Stickley et al., 2013) and surveys estimating the proportions of lonely individuals in the New Zealand population (e.g. Statistics New Zealand, 2013), to our knowledge no previous study has investigated whether there are qualitatively distinct subgroups of loneliness within the New Zealand population. This study uses Latent Profile Analysis (LPA) to develop a typology of loneliness utilizing data from the New Zealand Attitudes and Values Study (NZAVS), a large and nationally representative sample of New Zealanders.
The present research
The goals of this research were twofold. First, we aimed to identify a typology of loneliness in the New Zealand population. We used LPA to analyse responses to three survey items assessing perceived loneliness in NZAVS participants in order to identify distinct loneliness profiles in the population. Second, we aimed to identify the demographic and psychosocial factors that characterized participants’ membership to the identified profiles (e.g. whether participants with poor wellbeing are overrepresented in a possible ‘high-loneliness’ profile). In particular, we selected 22 variables to act as auxiliary variables. The first 11 of these variables were typical demographic and socio-structural variables, including those that have previously demonstrated associations with loneliness (e.g. age, socio-economic deprivation; Heinrich and Gullone, 2006; Luhman and Hawkley, 2016; Statistics New Zealand, 2013; Stephens et al., 2010). The other 11 variables comprised five wellbeing indicators selected based on their consistent relationship with loneliness (e.g. Cacioppo and Cacioppo, 2014; Hawkley and Cacioppo, 2010; Statistics New Zealand, 2013; Yalçin, 2015), and six personality dimensions included based on research on personality determinants of loneliness (e.g. Levin and Stokes, 1986).
The predictions for each of these variables can be found in Supplementary Table S1 and were pre-registered via the Open Science Framework (osf.io). Regarding the first research aim, we made no a priori prediction regarding the number of loneliness profiles that will emerge from the data. However, the LPA was expected to identify at least two loneliness profiles within the New Zealand population: a ‘high-loneliness’ profile and a ‘low-loneliness’ profile comprising participants scoring, respectively, high and low across all three loneliness items.
Methods
Sampling procedure
This research utilized data from Time 5 (2013) of the NZAVS, a nation-wide study that has been assessing the socio-political attitudes of New Zealanders each year since 2009 (for more information, see www.nzvalues.org).
Participants
In total, 18,264 participants completed the NZAVS at Time 5 (2013). The mean age of the sample was 47.66 years (standard deviation [SD] = 14.07), 62.8% were female (n = 11,460) and 85.5% identified as being in the New Zealand European majority ethnic group (n = 15,607). The NZAVS data are generally representative of the New Zealand population compared to the 2013 New Zealand census, although they oversampled women and majority ethnic group members (Sibley, 2014). For further information on sample demographics and representativeness, see Supplementary Material (Table S2).
Measures
Loneliness
Loneliness was measured using three items originally constructed for the NZAVS to measure ‘felt belongingness’ based on Cutrona and Russell’s (1987) Social Provisions scale and other belongingness measures. The three items are as follows: ‘I know that people in my life value and accept me’, ‘I feel like an outsider’ and ‘I know that people around me share my values and beliefs’ (M = 2.94, SD = 1.03; Cronbach’s α = 0.58).
These items form an appropriate measure of loneliness because of the strong overlap between felt belongingness and felt loneliness (e.g. Malone et al., 2012) and because these items overlap with items from commonly used measures of loneliness. To illustrate, the first item overlaps with Zavaleta et al.’s (2017) measure of internal social isolation (e.g. ‘People in my life care about me’ and ‘I often feel rejected’). The second item overlaps with items from the Revised UCLA Loneliness Scale (e.g. ‘I feel left out’ and ‘I feel isolated from others’; Russell et al., 1980). The third item also overlaps the Revised UCLA Loneliness Scale (e.g. ‘I have a lot in common with the people around me’; Russell et al., 1980) as well as the De Jong Gierveld Loneliness Scale (e.g. ‘I find my circle of friends and acquaintances too limited’; ‘De Jong Gierveld and Tilburg, 2006). For further detail regarding correspondence between our measure and accepted loneliness scales, see Supplementary Material (Table S3). Items were recoded such that high scores on the measure were indicative of greater loneliness.
Auxiliary variables
We included a number of auxiliary variables to examine differences in the demographics of the identified loneliness profiles, listed here and described in full in the Supplementary Material (Table S4). We included 11 demographic and socio-structural measures: age, gender, ethnicity, socio-economic deprivation, employment status, parental status, relationship status, education level, urban versus rural residence, hours per week spent watching television and hours per week spent using Facebook. We included five measures of wellbeing: self-rated health, self-esteem, psychological distress, life satisfaction and perceived social support. We also included six personality traits measured using the Mini-IPIP6 (Sibley et al., 2011): extraversion, neuroticism, agreeableness, conscientiousness, openness to experience and honesty-humility.
Results
Profiles of loneliness
We conducted an LPA to investigate the different ways in which loneliness manifests in the population. This approach allows us to model potential groupings of loneliness and assess how well models with different numbers of profiles fit the data.
We tested different models with a range of latent profiles from 1 to 7, with 1 used as the baseline profile model. The sample-size-adjusted Bayesian Information Criterion (BIC) appeared to plateau around four latent profiles. In addition, a four-profile solution had the highest entropy of the groups after this plateau (0.82) and fit the data significantly better than a three-profile solution (Lo–Mendell–Rubin-adjusted likelihood ratio test = 1970.689, p < 0.001; see Supplementary Table S5 for detailed results of LPA indicators). In sum, a four-profile solution was the most parsimonious and best-fitting model, as depicted in Figure 1.
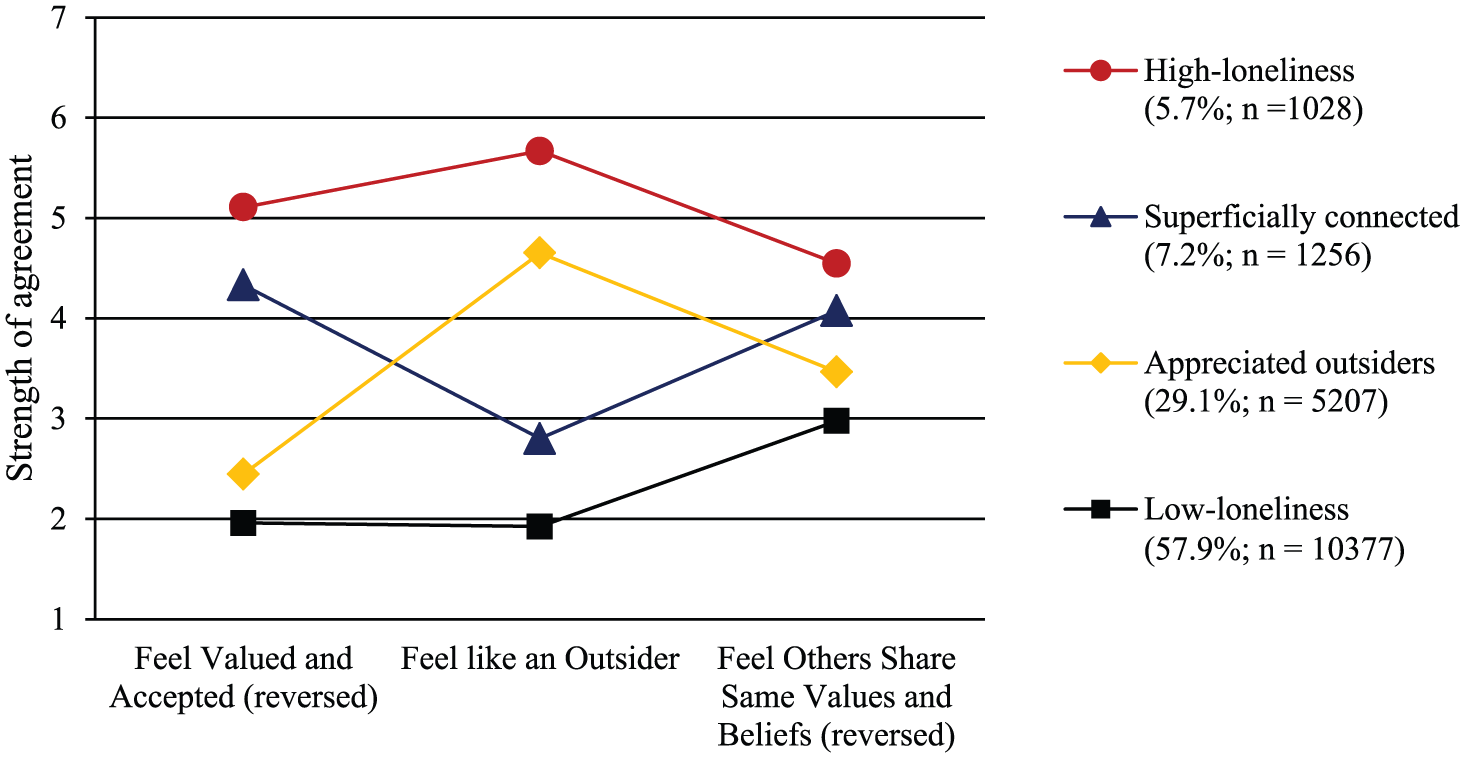
Latent Profile Analysis of loneliness in the New Zealand population using the three items: ‘I know that people in my life value and accept me’ (reverse coded); ‘I feel like an outsider’; and ‘I know that people around me share my values and beliefs’ (reverse coded).
The majority of people (around 58%) scored low on all three loneliness items, indicating a very slight tendency to feel lonely and falling into a ‘low-loneliness’ profile. In contrast to this, roughly 6% of the population scored high on all three loneliness items and fell into a ‘high-loneliness’ profile. These profiles reflect our a priori prediction that most likely two profiles would emerge, one high and one low in loneliness. The remaining two profiles demonstrated medium overall loneliness scores. However, these profiles displayed divergent tendencies in their ratings of the individual scale items, particularly the first two.
Around 30% of New Zealanders reported high identification with the statement ‘I feel like an outsider’ but also agreed with the sentiment ‘I know that people in my life value and accept me’. This suggests a group of individuals who feel like societal outsiders but experience acceptance and appreciation, likely provided by close, meaningful relationships. Consequently, we named this group the ‘appreciated outsiders’. In contrast, approximately 7% of New Zealanders were characterized by an inverse pattern, lacking identification with the item ‘I know that people in my life value and accept me’ yet also with the item ‘I feel like an outsider’. This alludes to a group of individuals who feel socially included but lack appreciation and acceptance from others. We labelled this profile ‘superficially connected’. Finally, it is worth noting that while scores on items 1 and 2 showed marked differences, there was less differentiation between item 3 scores across the four profiles.
Socio-structural and psychological characteristics of the loneliness profiles
As a large number of auxiliary variables were included in the LPA, we focus only on the seven which demonstrated moderate-to-strong approximate effect sizes (r > 0.30, as calculated using chi-square to r conversion; see supplementary Table S7). These included five wellbeing indicators (i.e. self-rated health, self-esteem, psychological distress, life satisfaction and perceived social support) and the personality dimensions of neuroticism and extraversion. All other auxiliary variables demonstrated approximate effect sizes less than 0.30.
Wellbeing indicators
A clear pattern is visible regarding the five wellbeing indicators, with the high-loneliness profile showing lower wellbeing outcomes, the low-loneliness profile showing greater wellbeing outcomes and other loneliness profiles showing intermediate levels of wellbeing. We detail the findings below.
Self-rated health
All four profiles showed significantly different levels of self-rated health (χ2(3, 17,900) = 1752.000, p < 0.001; see Figure 2(a)). The most satisfactory health was reported by the ‘low-loneliness’ profile (M = 5.418, standard error [SE] = 0.010), followed by the ‘appreciated outsiders’ (M = 4.864, SE = 0.017) and the ‘superficially connected’ profiles (M = 4.633, SE = 0.030), with the ‘high-loneliness’ profile reporting the lowest health (M = 4.307, SE = 0.038). This suggests that the lonelier an individual is, the more likely they are to perceive themselves as in poor health.
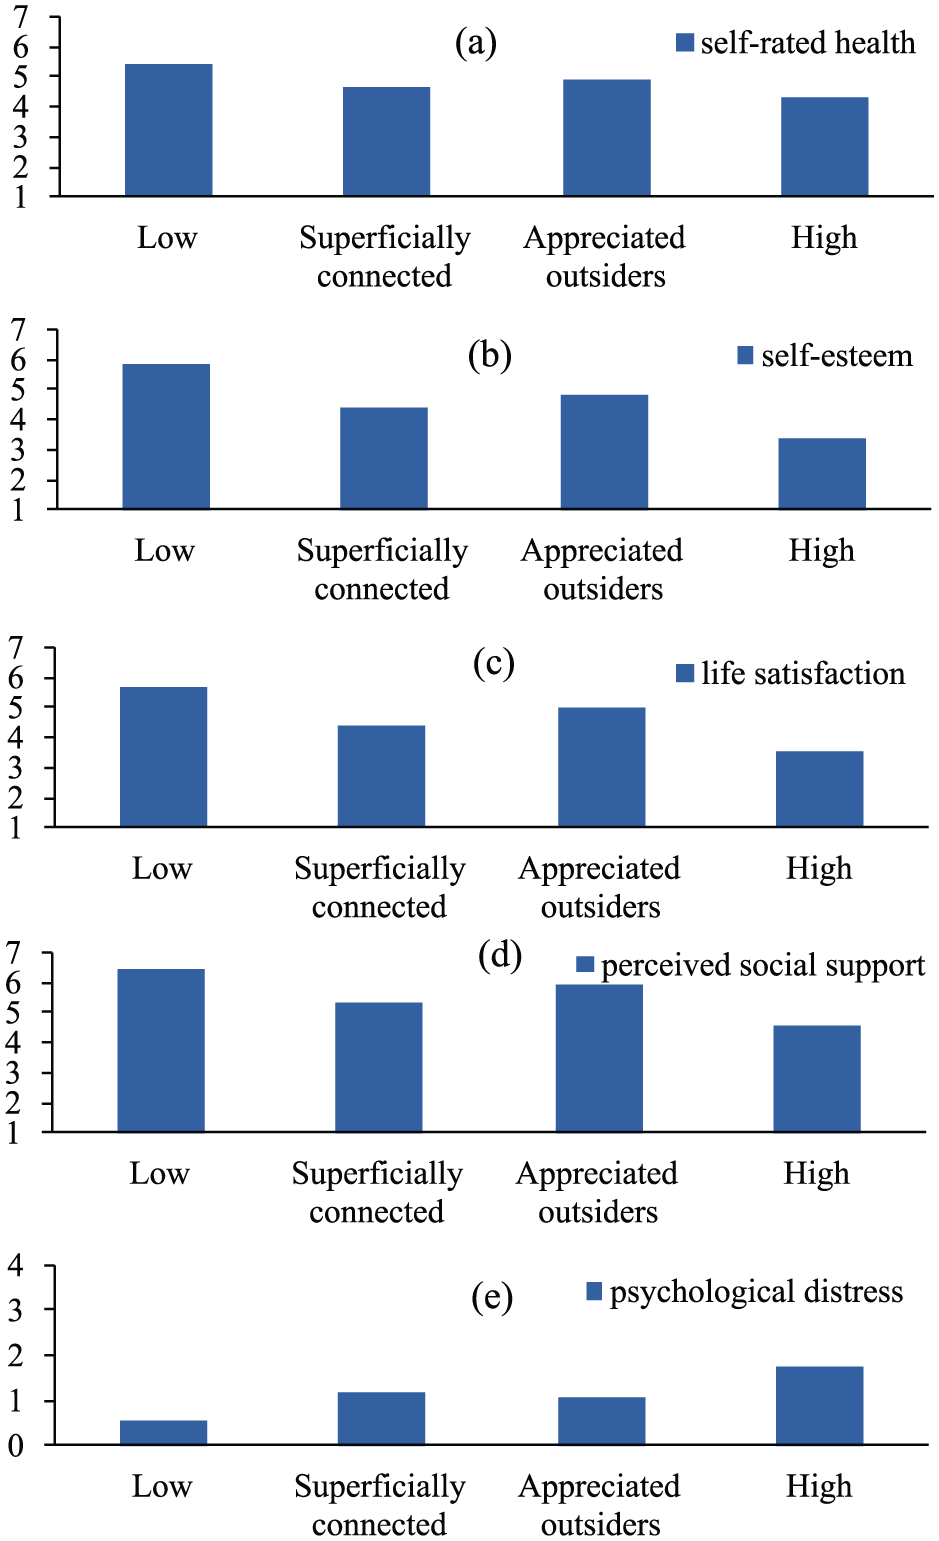
Means for the wellbeing variables of (a) self-rated health, (b) self-esteem, (c) psychological distress, (d) life satisfaction and (e) perceived social support across the four identified loneliness profiles.
Self-esteem
Self-esteem showed significant differences across all four profiles (χ2(3, 17,904) = 10,732.604, p < 0.001; see Figure 2(b)). As expected, the highest self-esteem was reported by the ‘low-loneliness’ profile (M = 5.877, SE = 0.008), while the lowest levels were reported by the ‘high-loneliness’ profile (M = 3.404, SE = 0.033). The other profiles reported intermediate levels of self-esteem: ‘appreciated outsiders’ (M = 4.815, SE = 0.015) and ‘superficially connected’ (M = 4.409, SE = 0.023). This indicates that lonelier individuals are more likely to have lower self-esteem.
Life satisfaction
There were significant differences in life satisfaction between all four profiles (χ2(3, 17,310) = 4844.271, p < 0.001; see Figure 2(c)). The greatest life satisfaction was reported by the ‘low-loneliness’ profile (M = 5.681, SE = 0.009), followed by the ‘appreciated outsiders’ (M = 4.980, SE = 0.016), ‘superficially connected’ (M = 4.424, SE = 0.029) and ‘high-loneliness’ profiles (M = 3.557, SE = 0.041). These results demonstrate that greater loneliness is associated with lower life satisfaction.
Perceived social support
The differences in perceived social support between all four profiles were significant (χ2(3, 17,347) = 3754.378, p < 0.001; see Figure 2(d)). The ‘low-loneliness’ profile perceived themselves as the most socially supported (M = 6.470, SE = 0.007). The next highest social support was perceived by the ‘appreciated outsiders’ profile (M = 5.957, SE = 0.015) and then the ‘superficially connected’ profile (5.340, SE = 0.028). The ‘high-loneliness’ profile reported the lowest perceived social support (M = 4.600, SE = 0.044). This indicates that lonely individuals perceive themselves as lacking social support.
Psychological distress
All four profiles significantly differed in their degree of psychological distress (χ2(3, 17,881) = 5128.624, p < 0.001). The ‘high-loneliness’ profile reported the greatest psychological distress (M = 1.756, SE = 0.025), followed by the ‘superficially connected’ (M = 1.175, SE = 0.017) and ‘appreciated outsiders’ profiles (M = 1.090, SE = 0.009). The ‘low-loneliness’ profile reported the lowest psychological distress (M = 0.576, SE = 0.004). This implies that the lonelier an individual is, the more likely they are to experience psychological distress.
Personality dimensions
Only two personality traits predicted the loneliness profiles with a medium-to-large effect size. Figure 3 depicts the results for neuroticism and extraversion detailed below.
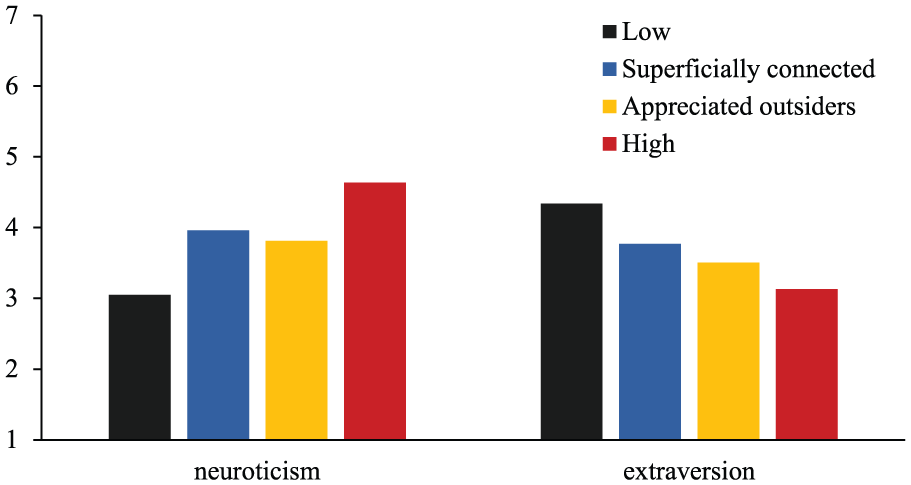
Mean levels of neuroticism and extraversion across the four identified loneliness profiles.
Neuroticism
All four profiles differed in their levels of neuroticism (χ2(3, 17,904) = 4340.979, p < 0.001; left part of Figure 3). The ‘high-loneliness’ profile showed the highest levels of neuroticism (M = 4.638, SE = 0.030), while the ‘low-loneliness’ profile exhibited the lowest (M = 3.045, SE = 0.010). The ‘superficially connected’ (M = 3.962, SE = 0.025) and ‘appreciated outsiders’ profiles (M = 3.810, SE = 0.014) had intermediate positions. This suggests that lonelier people tend to have more neurotic personalities.
Extraversion
Extraversion showed significant differences across all four profiles (χ2(3, 17,905) = 2902.534, p < 0.001; right part of Figure 3). The ‘low-loneliness’ profile reported being the most extraverted (M = 4.337, SE = 0.011), followed by the ‘superficially connected’ (M = 3.768, SE = 0.027) and ‘appreciated outsiders’ profiles (M = 3.504, SE = 0.015). The ‘high-loneliness’ profile presented as the most introverted (M = 3.129, SE = 0.031), which indicates that more lonely people tend to be less extraverted than less lonely people.
Discussion
The goals of this study were to establish a model of latent profiles that best characterized loneliness in the New Zealand population, and determine whether the identified loneliness profiles were differentiated by demographic and psychosocial characteristics. The LPA determined that a four-profile solution provided the best fit for the data.
As anticipated, the analysis identified ‘high-loneliness’ and ‘low-loneliness’ profiles. On average, those in the ‘high-loneliness’ profile had the lowest scores on measures of wellbeing. This finding is consistent with prior research associating loneliness with poor self-rated health (Cacioppo and Cacioppo, 2014; Stickley et al., 2013; Yang and Victor, 2008), low self-esteem (Heinrich and Gullone, 2006; Vanhalst et al., 2013; Yalçin, 2015), psychological distress (e.g. anxiety, depression; Cacioppo and Cacioppo, 2014; Hawkley and Cacioppo, 2010; McWhirter, 1990; Stickley et al., 2013; Victor and Yang, 2012), life satisfaction (Statistics New Zealand, 2013) and perceived social support (Mahon et al., 2006; Yalçin, 2015). Moreover, individuals in the ‘high-loneliness’ profile were the most introverted and emotionally unstable, in keeping with previous work showing that neuroticism and introversion demonstrate strong positive associations with loneliness (Levin and Stokes, 1986) and negative associations with felt belongingness (Stronge et al., 2015). In contrast, individuals in the ‘low-loneliness’ profile had better wellbeing and were more extraverted and emotionally stable.
Two further profiles emerged comprising individuals who had loneliness scores between those of the ‘high’ and ‘low’ profiles. These two profiles mirrored each other in their response patterns to the loneliness items, but were primarily distinguished by their responses to items 1 and 2 (see Figure 1). The ‘appreciated outsiders’ were characterized by their sense of being social outsiders despite feeling accepted and valued by others, whereas the ‘superficially connected’ felt socially included but reported lacking acceptance and appreciation from others. One indication of the circumstances underlying these distinct profiles comes from the pattern of associations with extraversion (see Figure 3). As the ‘appreciated outsiders’ were more introverted, they may struggle to maintain a large number of social connections and instead prefer to cultivate fewer, more profound relationships, which could explain their perception of being social outsiders. In contrast, the more extraverted ‘superficially connected’ group may spend their time maintaining a broader circle of shallow relationships and forgo deeper connections. Consistent with this, the ‘superficially connected’ reported lower perceived social support than the ‘appreciated outsiders’, indicating they do not feel they can depend on their social relationships.
The wellbeing of individuals in these two intermediary profiles was between that of the high and low profiles. However, the ‘appreciated outsiders’ emerged significantly better off on all markers of wellbeing than the ‘superficially connected’. This would suggest that possessing close, meaningful relationships may be a more decisive factor in maintaining wellbeing than a sense of social inclusion. This possibility is consistent with assertions in previous literature that it is the quality of social relationships, rather than the quantity, that is important for wellbeing (e.g. Antonucci and Akiyama, 1991; Shiovitz-Ezra and Leitch, 2010).
Such findings have implications for the welfare of New Zealanders. The ‘high-loneliness’, ‘appreciated outsiders’ and ‘superficially connected’ groups were all marked by poorer wellbeing than the ‘low-loneliness’ group, which demonstrates the negative ramifications loneliness has for a person’s mental health outcomes. Future research, including those that develop interventions, should consider the distinct experiences of these profiles in order to target appropriate individuals in an effective manner. For example, some individuals (such as the ‘superficially connected’) who have numerous connections may appear to not experience loneliness when they actually are lonely and suffer poorer wellbeing than those who may come across as lonelier due to possessing fewer, more meaningful connections (i.e. the ‘appreciated outsiders’).
Strengths and limitations
This study offers the first typology of loneliness in the New Zealand population. Previous literature has typically classified lonely individuals either along a single dimension (i.e. from low to high; Ministry of Social Development, 2016; Statistics New Zealand, 2013; Stephens et al., 2010) or dichotomously (i.e. lonely or not lonely; Yang and Victor, 2008). Our research extends this in two ways. First, the current research allows two experiences of loneliness to be understood as distinct despite their overall scores being quantitatively equivalent. This highlights that loneliness is a multidimensional construct which may be experienced by two individuals in qualitatively different ways and for unique reasons. Second, LPA uses the data to guide formation of the most appropriate latent profile model, thereby encompassing more of the variation in loneliness and providing a more faithful representation of the data.
However, there are also limitations to this research. In utilizing the NZAVS, a pre-existing survey designed to assess multiple constructs, we were restricted in our choice of measures to ones which were typically altered or shortened from the original instruments. Specifically, our measure for loneliness was originally developed to index ‘felt belongingness’. Although the substantial overlap with items from other established loneliness scales supports our use of this measure, it was not intended to evaluate loneliness and does not allow loneliness to be assessed as a multidimensional construct (see Cacioppo et al., 2015; McWhirter, 1990). For example, our measure does not capture the ‘attachment’ aspect of loneliness (Weiss, 1973) that represents the need for deep, meaningful connections with others. A more comprehensive assessment of characteristics of loneliness will likely improve the classification of loneliness profiles.
Further research is needed regarding the profiles identified herein, particularly the ‘appreciated outsiders’ and ‘superficially connected’. While the nature and correlates of loneliness have been studied before, the pattern of the intermediary profiles is novel and warrants further study. Given that our sample was predominantly European, it is also necessary to ascertain whether these profiles hold for minority cultural groups. Our results showed that ethnicity (comparing New Zealand European with other ethnicity) was not a main auxiliary variable in explaining the observed loneliness profiles, but it is possible that these profiles are bound relatively more to European cultural values and that Māori or Pasifika are better represented by an alternative typology.
Finally, associations with the auxiliary variables do not allow for any causal inference, including the possibility of bidirectional causality. For instance, chronic loneliness may prompt the onset of depression; however, depression often involves a tendency to isolate oneself which may in turn cause loneliness. If this were the case, these variables would need to be understood as both risk factors – in which case vulnerable groups can be identified – and consequences of loneliness – in which case overcoming loneliness should be considered during treatment. However, as discussed earlier, Cacioppo et al. (2010) have demonstrated that this relationship is unidirectional, with loneliness predicting depression. Nonetheless, a good direction for future longitudinal research is to conduct Latent Transition Analyses that assess the likelihood of people changing from one loneliness profile to another over time.
Conclusion
Loneliness has significant links to poor mental health outcomes, and so it is valuable to understand its expression and associated factors among New Zealanders. This study identified a four-profile typology of loneliness in New Zealand which indicated that the most lonely profile was relatively more represented by people who had poor health, lacked social support, felt psychologically distressed, had low self-esteem and life satisfaction, and were more introverted and emotionally unstable. Notably, two loneliness profiles were distinguished that under a one-dimensional model of classification would have been combined. While overall loneliness in these profiles was quantitatively similar, their experience of loneliness was qualitatively different. We propose that this is due to differences in ‘quality vs quantity’ of their social connections, supported by the differences in the characteristics and levels of wellbeing in these groups. More generally, these profiles were consistent with the proposition that close, meaningful relationships are protective against loneliness. The consistent differences between the four loneliness profiles highlight the important link between meaningful social interaction and good psychological health – a critical concern for the assessment and treatment of mental disorder.
Footnotes
Acknowledgements
We would like to thank Laina Isler for her assistance with statistical analysis. This research was part of H.H.-E.’s summer project, supervised by T.L.M. and funded by Victoria University of Wellington. H.H.-E. helped design the study, completed the preregistration, conducted statistical analyses and wrote the first draft. T.L.M. designed the study and coordinated the project. M.D.H. advised on statistical analysis. C.G.S. provided the data for analysis. All authors contributed to editing the manuscript.
Declaration of Conflicting Interests
The author(s) declared no potential conflicts of interest with respect to the research, authorship and/or publication of this article.
Funding
The author(s) received no financial support for the research, authorship and/or publication of this article.
References
Supplementary Material
Please find the following supplemental material available below.
For Open Access articles published under a Creative Commons License, all supplemental material carries the same license as the article it is associated with.
For non-Open Access articles published, all supplemental material carries a non-exclusive license, and permission requests for re-use of supplemental material or any part of supplemental material shall be sent directly to the copyright owner as specified in the copyright notice associated with the article.