
Abstract
Alzheimer's disease (AD) accounts for approximately 60–70% of the burden of dementia [1]. Vascular disease accounts for 15–30% and may occur concurrently with AD (‘mixed dementia’) [2]. The incidence of AD is known to increase exponentially with age [3]. Hence it is often assumed that the structural ageing of the New Zealand population over the coming decades will be accompanied by a ‘tidal wave’ of dementia [4]. Yet this may not be so, for two reasons.
First, future cohorts of older people will be better educated than their predecessors. There is some evidence that AD risk is lower among the well educated, although whether this reflects higher socioeconomic position or ongoing cognitive stimulation is not certain [5], [6]. Also, there is growing evidence that AD responds to the same behavioural and biological risk factors as atherosclerotic cardiovascular disease, whether or not because of concurrent vascular pathology [7]. Despite the growing obesity and type 2 diabetes epidemics (the latter in particular being a relatively well-established risk factor for cognitive impairment and dementia) [8], this implies that AD may be at least partially preventable through cardiovascular risk reduction. That is, it is plausible that the age-specific incidence rates of AD (or the ‘mixed’ component of AD) may decline over the next decade if effective preventive interventions can be implemented, leading to a downshift in the population's cardiovascular risk distribution and increased participation by older people in physical and cognitive activity. Second, although currently available cholinesterase inhibitors are only of limited effectiveness, and then only for a relatively small subgroup of patients [9], it is plausible that more effective drugs (not necessarily restricted to the cholinergic system), capable of significantly and sustainably slowing the progression of AD, will become available over the next decade. The combination of effective prevention strategies (delaying disease onset) and drug treatment (delaying disease progression) may be able to ameliorate – at least in part – the increase in population AD burden that must otherwise result from unmodifiable demographic trends (i.e. the increase in size and ageing of the population).
Ferri et al. provided estimates of and forecasts for the global prevalence of dementia and AD through a Delphi consensus of 12 international experts, who independently reviewed the literature and then iterated their conclusions until consensus was reached [10]. A quantitative approach was adopted by Brookmeyer et al. who built an incidence to prevalence model for estimating and forecasting the prevalence of AD [11]. This model allows for changing demographics and the introduction of interventions to delay disease onset or progression, and is available to researchers through the web (www.biostat.jhsph.edu/project/globalAD/index.htm).
The objective of the present study was to utilize the Brookmeyer model, with some modifications, to estimate the current (2006) burden of AD in the New Zealand population, and project this burden out to 2031 under a range of future scenarios involving (non)availability of effective prevention and/or treatment strategies. A projection horizon of 25 years was selected because technological developments beyond this are not realistically foreseeable. Possible improvements in social support or models of care for AD patients and their informal carers were not included.
Methods
Model
We applied the methodology of Brookmeyer et al. [11] to obtain estimates of current and future prevalence rates of AD for persons over 60, which were then applied to population estimates and projections from Statistics New Zealand (SNZ). The prevalence rates were obtained from a discrete time Markov model that allows for multiple disease states (Figure 1) [11]. In the model, individuals transition from the healthy state to early stage AD and then to late-stage disease. In any state (healthy, early stage or late-stage disease), individuals are at (varying) risk of death. Transition probabilities are specified for all possible flows; these may depend on age and calendar year, so capturing cohort effects.
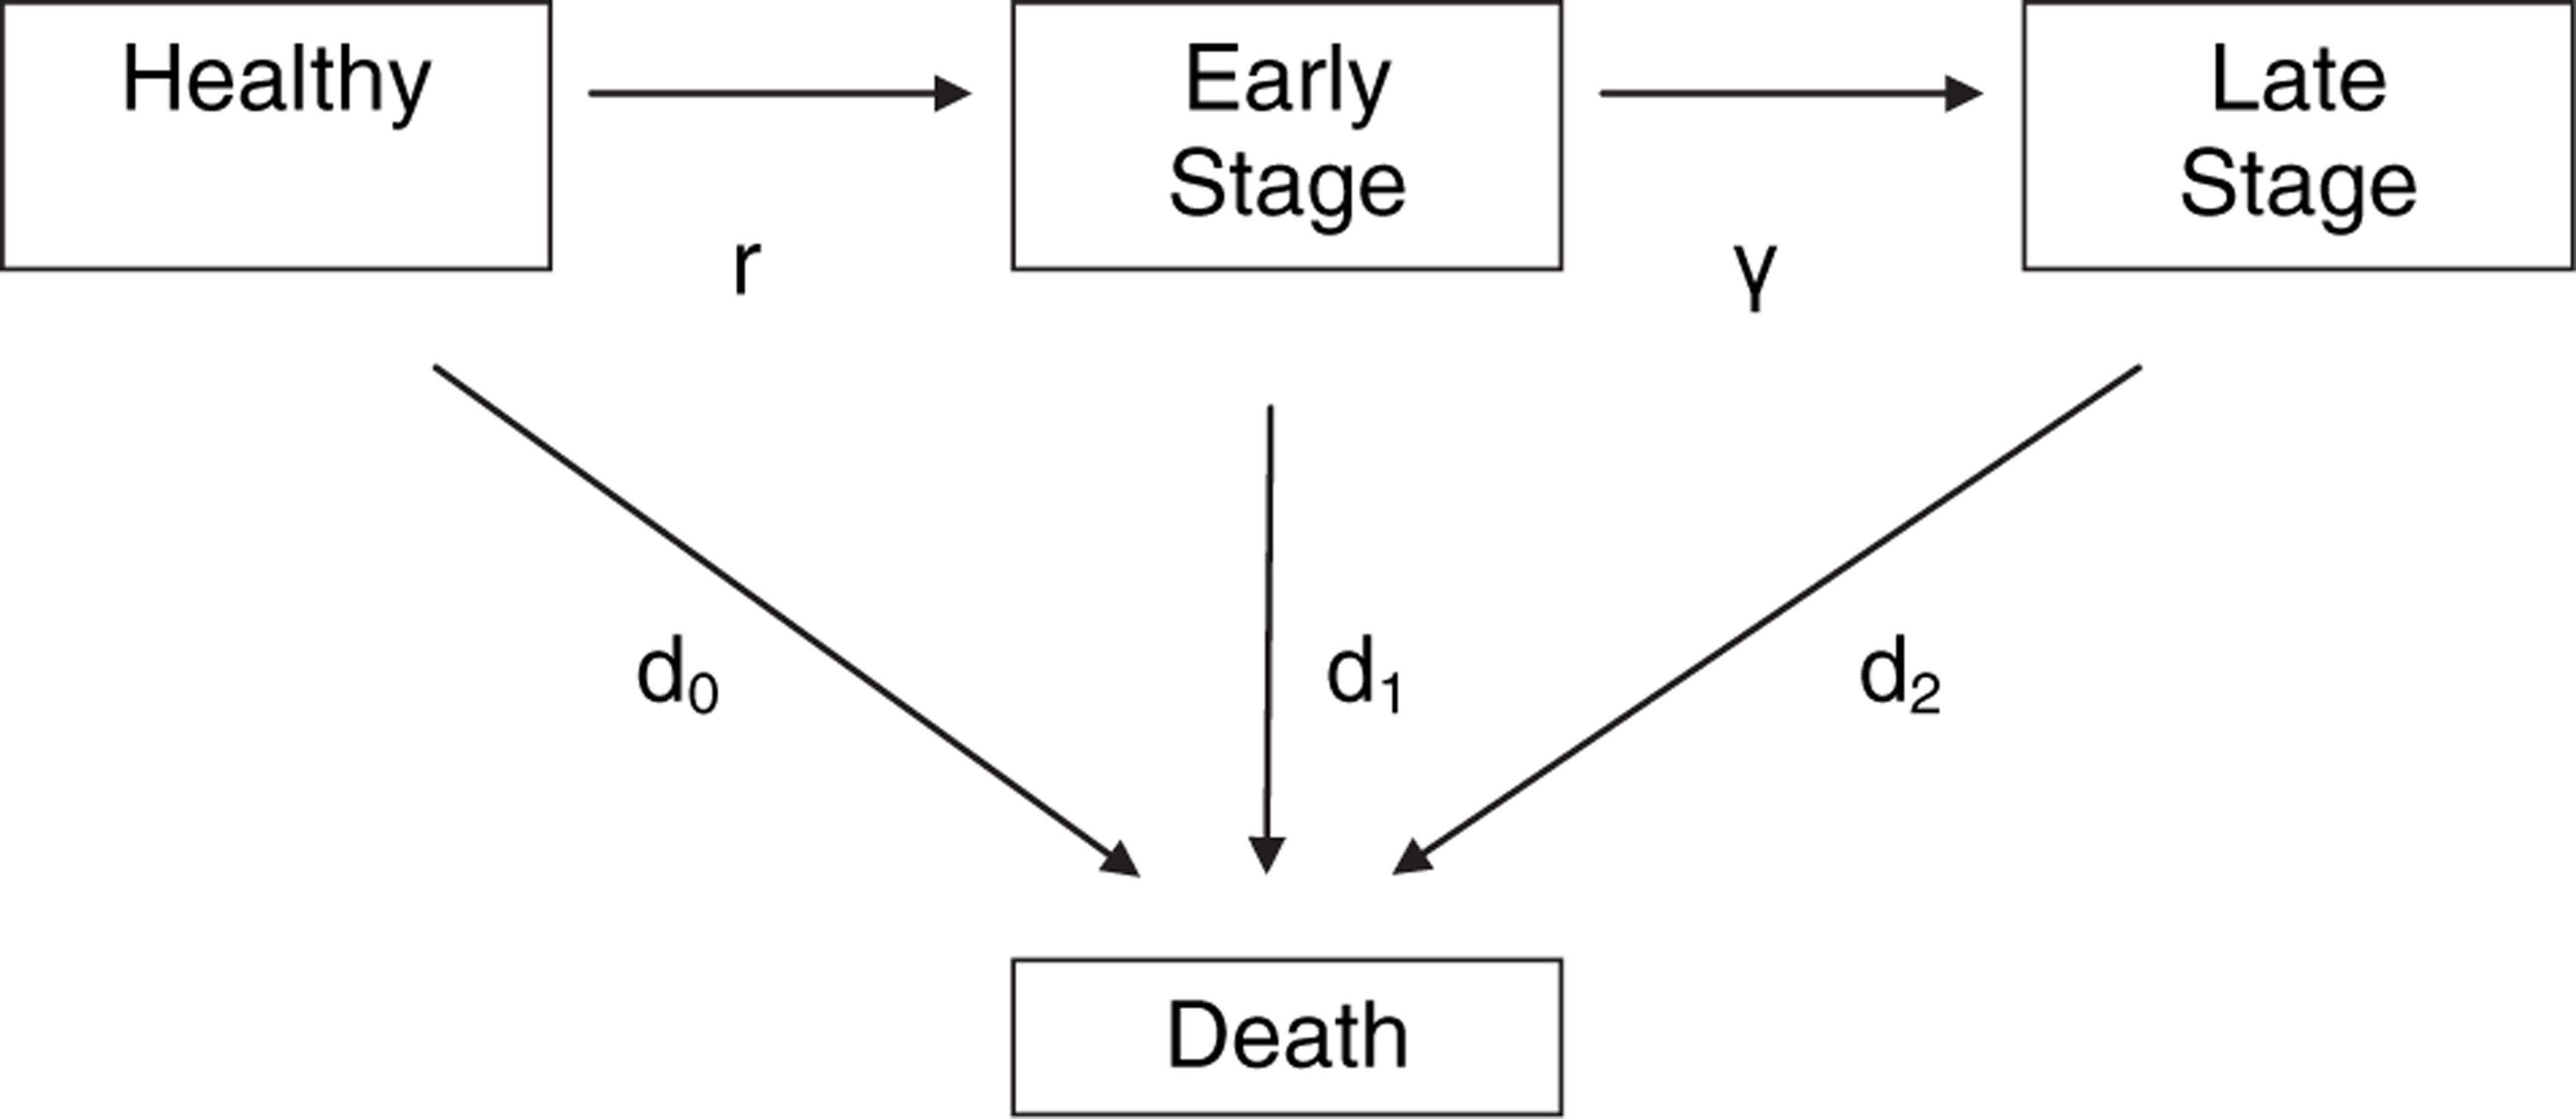
Multistage disease model. d0, mortality rates for healthy persons; d1, mortality rates for persons in early stage disease; d2, mortality rates for persons in late-stage disease; γ, progression; r, incidence. Source: Johnson et al. [12].
There is no universally accepted stage classification for AD. We use a two-stage model. Early stage disease is defined by the presence of clinical dementia (memory loss, impaired judgement, decreased ability to carry out everyday tasks such as shopping and household budgeting), but the person is capable of living independently at home and requires no assistance with self-care. Late-stage disease is defined by the need for 24 h supervision and assistance with self-care (such as feeding, dressing and toileting) and implies residential care (or the need for such placement). Note that, in terms of the widely used Clinical Dementia Rating Scale [13], early stage corresponds to mild dementia and late stage to the sum of moderate and severe dementia.
Data (model inputs)
Population estimates and projections
Estimated resident population by age (from 60 years) and sex in the base year (2006) were obtained from SNZ. Series 5 (medium fertility, mortality and migration assumptions) population projections to 2031 were obtained from the same source.
Alzheimer's disease incidence rates
In the absence of any usable New Zealand estimates, we used estimated incidence rates based on a systematic review of 27 published cohort studies of AD [11], mainly from Europe and North America. The incidence rates are assumed to grow exponentially with age. Specifically, we assumed that the model for the incidence rates as a function of age is:
Incidence rate per 100 person-years at age t = 0.132 e0.121(t–60)
This equation implies that the incidence of AD doubles approximately every 5.7 years (after age 60). We assume that this model for the incidence rates does not change with calendar year.
A key finding from the Brookmeyer et al. study is that there is no significant geographic difference in the doubling time of AD incidence, suggesting that any observed variation in incidence rates across geographic regions largely reflects differences in diagnostic criteria or thresholds [11]. Despite this finding, we acknowledge that the absolute incidence rates derived from this formula may be inaccurate for New Zealand. But we expect that the proportionate increases in incidence rates with age are consistent with other geographic locations, at least in the industrialized world. Given this uncertainty about the incidence rates, sensitivity analysis around these estimates was carried out.
Alzheimer's disease progression rates
Few if any New Zealand studies on the time to nursing home placement of people living with AD are available. We therefore relied instead on a meta-analysis carried out by Jorm and Jolley [14], from which it is estimated that the average duration between mild to severe disease is 6 years. This translates to an annual transition probability from early to late stage of γ = 0.167.
We considered the empirical data to be insufficient at this time to characterize γ more precisely by age, sex or calendar year. Again, the uncertainty in the progression rates was quantified by sensitivity analysis.
Background mortality rates
All-cause mortality rates by age and sex for 2006, and projections (series 5) to 2031, were obtained from SNZ. Series 5 projections were used because these assume moderate rates of mortality decline, which are considered most plausible. This projection corresponds to an average annual percentage decline in mortality of approximately 1.0% at all ages.
Excess mortality risk from AD
Brookmeyer et al. suggested an additive model for the excess risk of mortality from AD within the multi-stage disease model [11]. A more thorough description and justification for this additive model can be found in Johnson et al. [12]. Specifically, it is estimated that once persons transition into the late stage of disease, the effect is to add 11% to their background mortality rate. In order to calibrate our model against median dementia survival times recently estimated by Xie et al. [15], we further assumed that transitioning into the early stage of disease is associated with half this excess risk of death (i.e. this transition adds 5.5% to the background mortality rate).
Projection scenarios
The demographic scenario (scenario D) assumes no change in age-specific incidence or progression rates. Population AD burden grows as a result of demographic trends only (i.e. the increase in population size and ageing). This represents our pessimistic scenario, although an even more pessimistic scenario driven by the growth of the obesity/diabetes epidemic is not implausible (but is not modelled here).
The first intervention scenario (scenario P) assumes that effective prevention strategies (leading to cardiovascular risk reduction) are introduced now (2008) and become effective by 2011. As a result, the relative risk of disease incidence falls by one-quarter starting in 2011. This is represented in the model by multiplying the incidence rates by 0.75 for years 2011–2031. This corresponds to a delay in age of disease onset of 2 years on average, considered to be close to the maximum plausible in the short term, especially in the face of increasing type 2 diabetes prevalence.
The second intervention scenario (scenario T) models the availability of effective drugs (not necessarily improved cholinesterase inhibitors) for treatment of early stage AD by 2011. As a result, the relative risk of disease progression falls by one-quarter from that date. This is represented in the model by multiplying the progression rate from early to late-stage disease by 0.75 for the years 2011–2031. This corresponds to a 2 year delay in progression from early to late-stage disease, on average. Given the relatively limited effect of current drugs, this again probably represents the maximum plausible effect in the short term.
The third scenario (scenario C) models the combined impact of both of the aforementioned interventions, and so constitutes our optimistic scenario. We consider that the pessimistic and optimistic scenarios probably bracket the plausible range of outcomes over the projection period.
Model calibration and validation
We have few exogenous sources of empirical data against which to calibrate or validate the model output. Nevertheless, the modelled late-stage AD prevalence estimates for 2006 are compared with the latest available administrative data from rest homes and nursing homes. Prevalence estimates from the 1996 Postcensal Disability Survey (SNZ) are also compared, as are estimates of AD-attributable deaths from the New Zealand Health Information Service's Mortality Collection (i.e. deaths coded to ICD-10 F01-F04, for the years 2002–2004).
Results
2006 estimates
While incidence rates (Table 1) are the same for both men and women, incidence counts are approximately 60% higher in women, reflecting the feminization of old age. In total, the model estimates that >6600 people develop AD each year at present, almost one-quarter before age 75. For men the incidence peaks in the 80–84 age group while for women the peak is slightly older, in the 85–89 age group.
Alzheimer's disease, modelled 2006 estimates
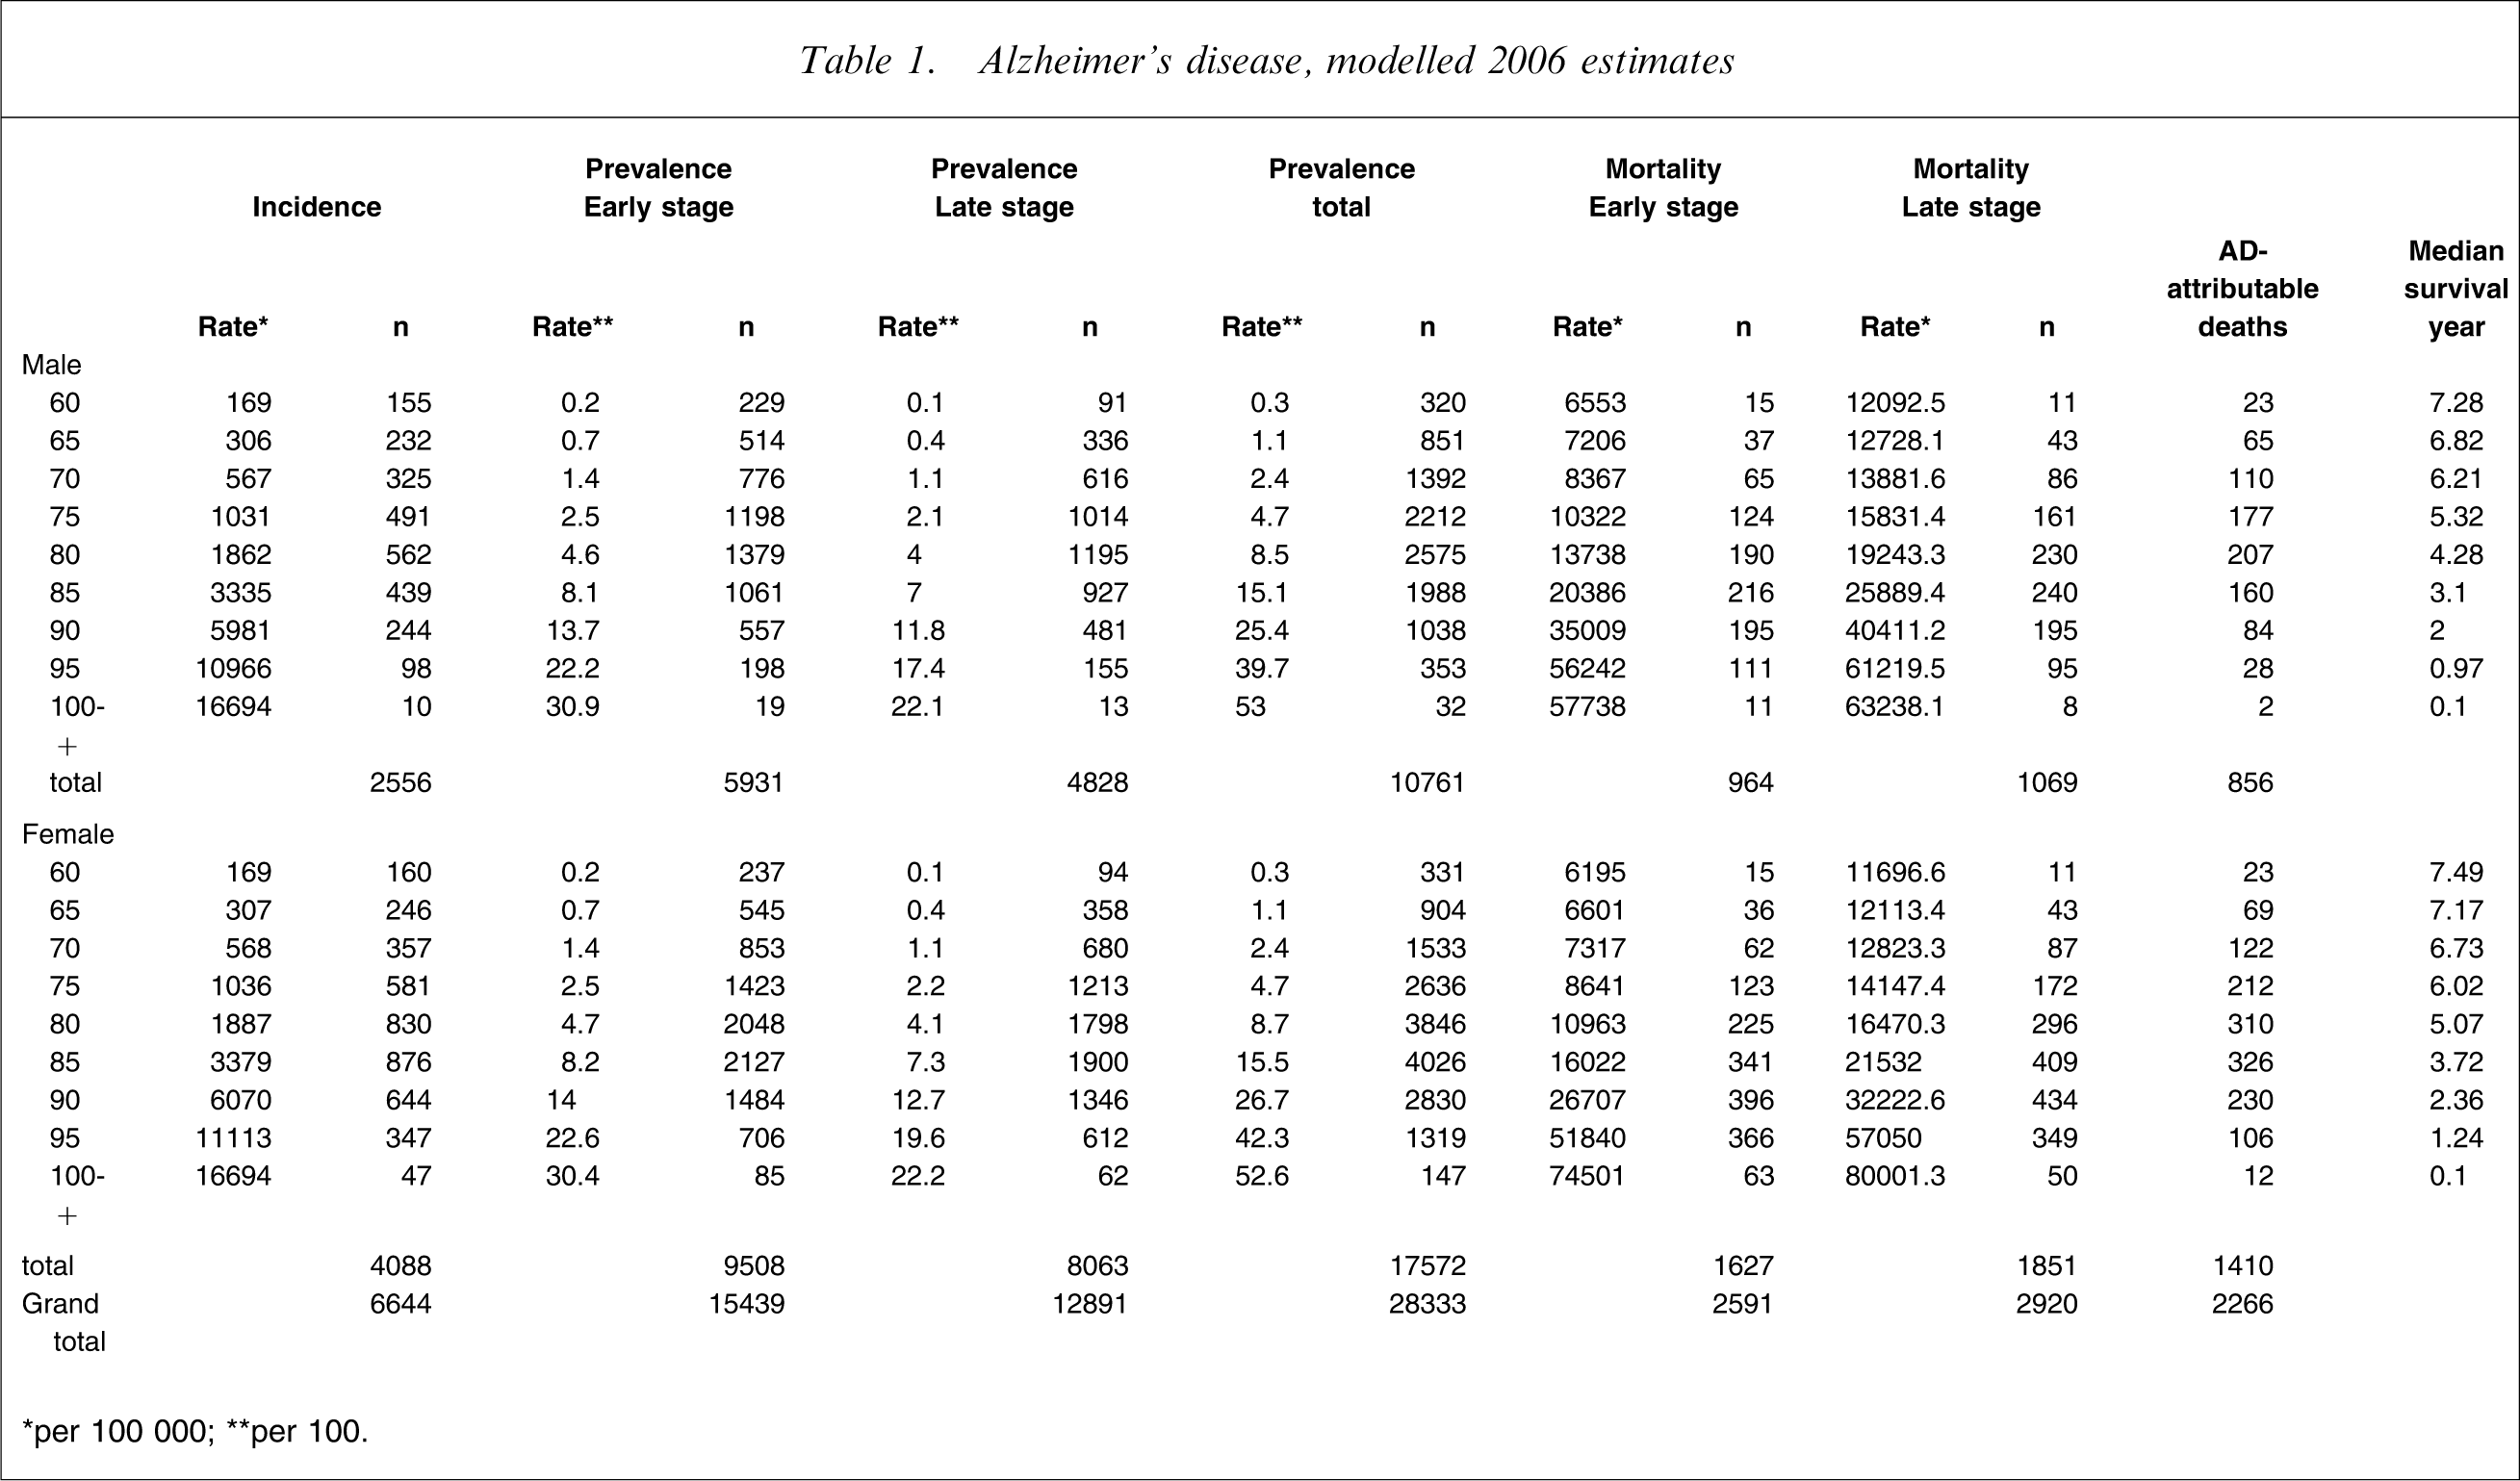
∗per 100 000; ∗∗per 100.
Prevalence rates (Table 1) are again similar for both sexes at younger ages, while a small female excess emerges at older ages. As with incidence, prevalence rates increase more or less exponentially with age, from 1.1% in the 65–69 age group to 4.7% in the 75–79 age group and 15.2% in the 85–89 age group. Again, total prevalence count is approximately 60% higher in women, and for the same reason. In total, the model estimates that approximately 28 300 people are currently living with AD, approximately 55% (approx. 15 500) in the early stage and 45% (just under 13 000) in the late stage of the disease. Approximately one-quarter of early stage and one-fifth of late-stage patients (both sexes) are under 75 years of age. Peak age for men is 80–84 years and women, 85–89 years (both stages), as for incidence.
The model estimates (Table 1) approximately 2300 excess deaths among people with AD in 2006, approximately two-thirds in women and one-third in men. This is approximately 40% of all deaths occurring among people living with AD (i.e. overall, AD almost doubles the instantaneous risk of dying).
2031 projections
We present only summarized projections for prevalence (Tables 2–4; Figure 2) because this variable is of most relevance for needs-based service planning (incidence and attributable mortality projections are available from the first author on request).
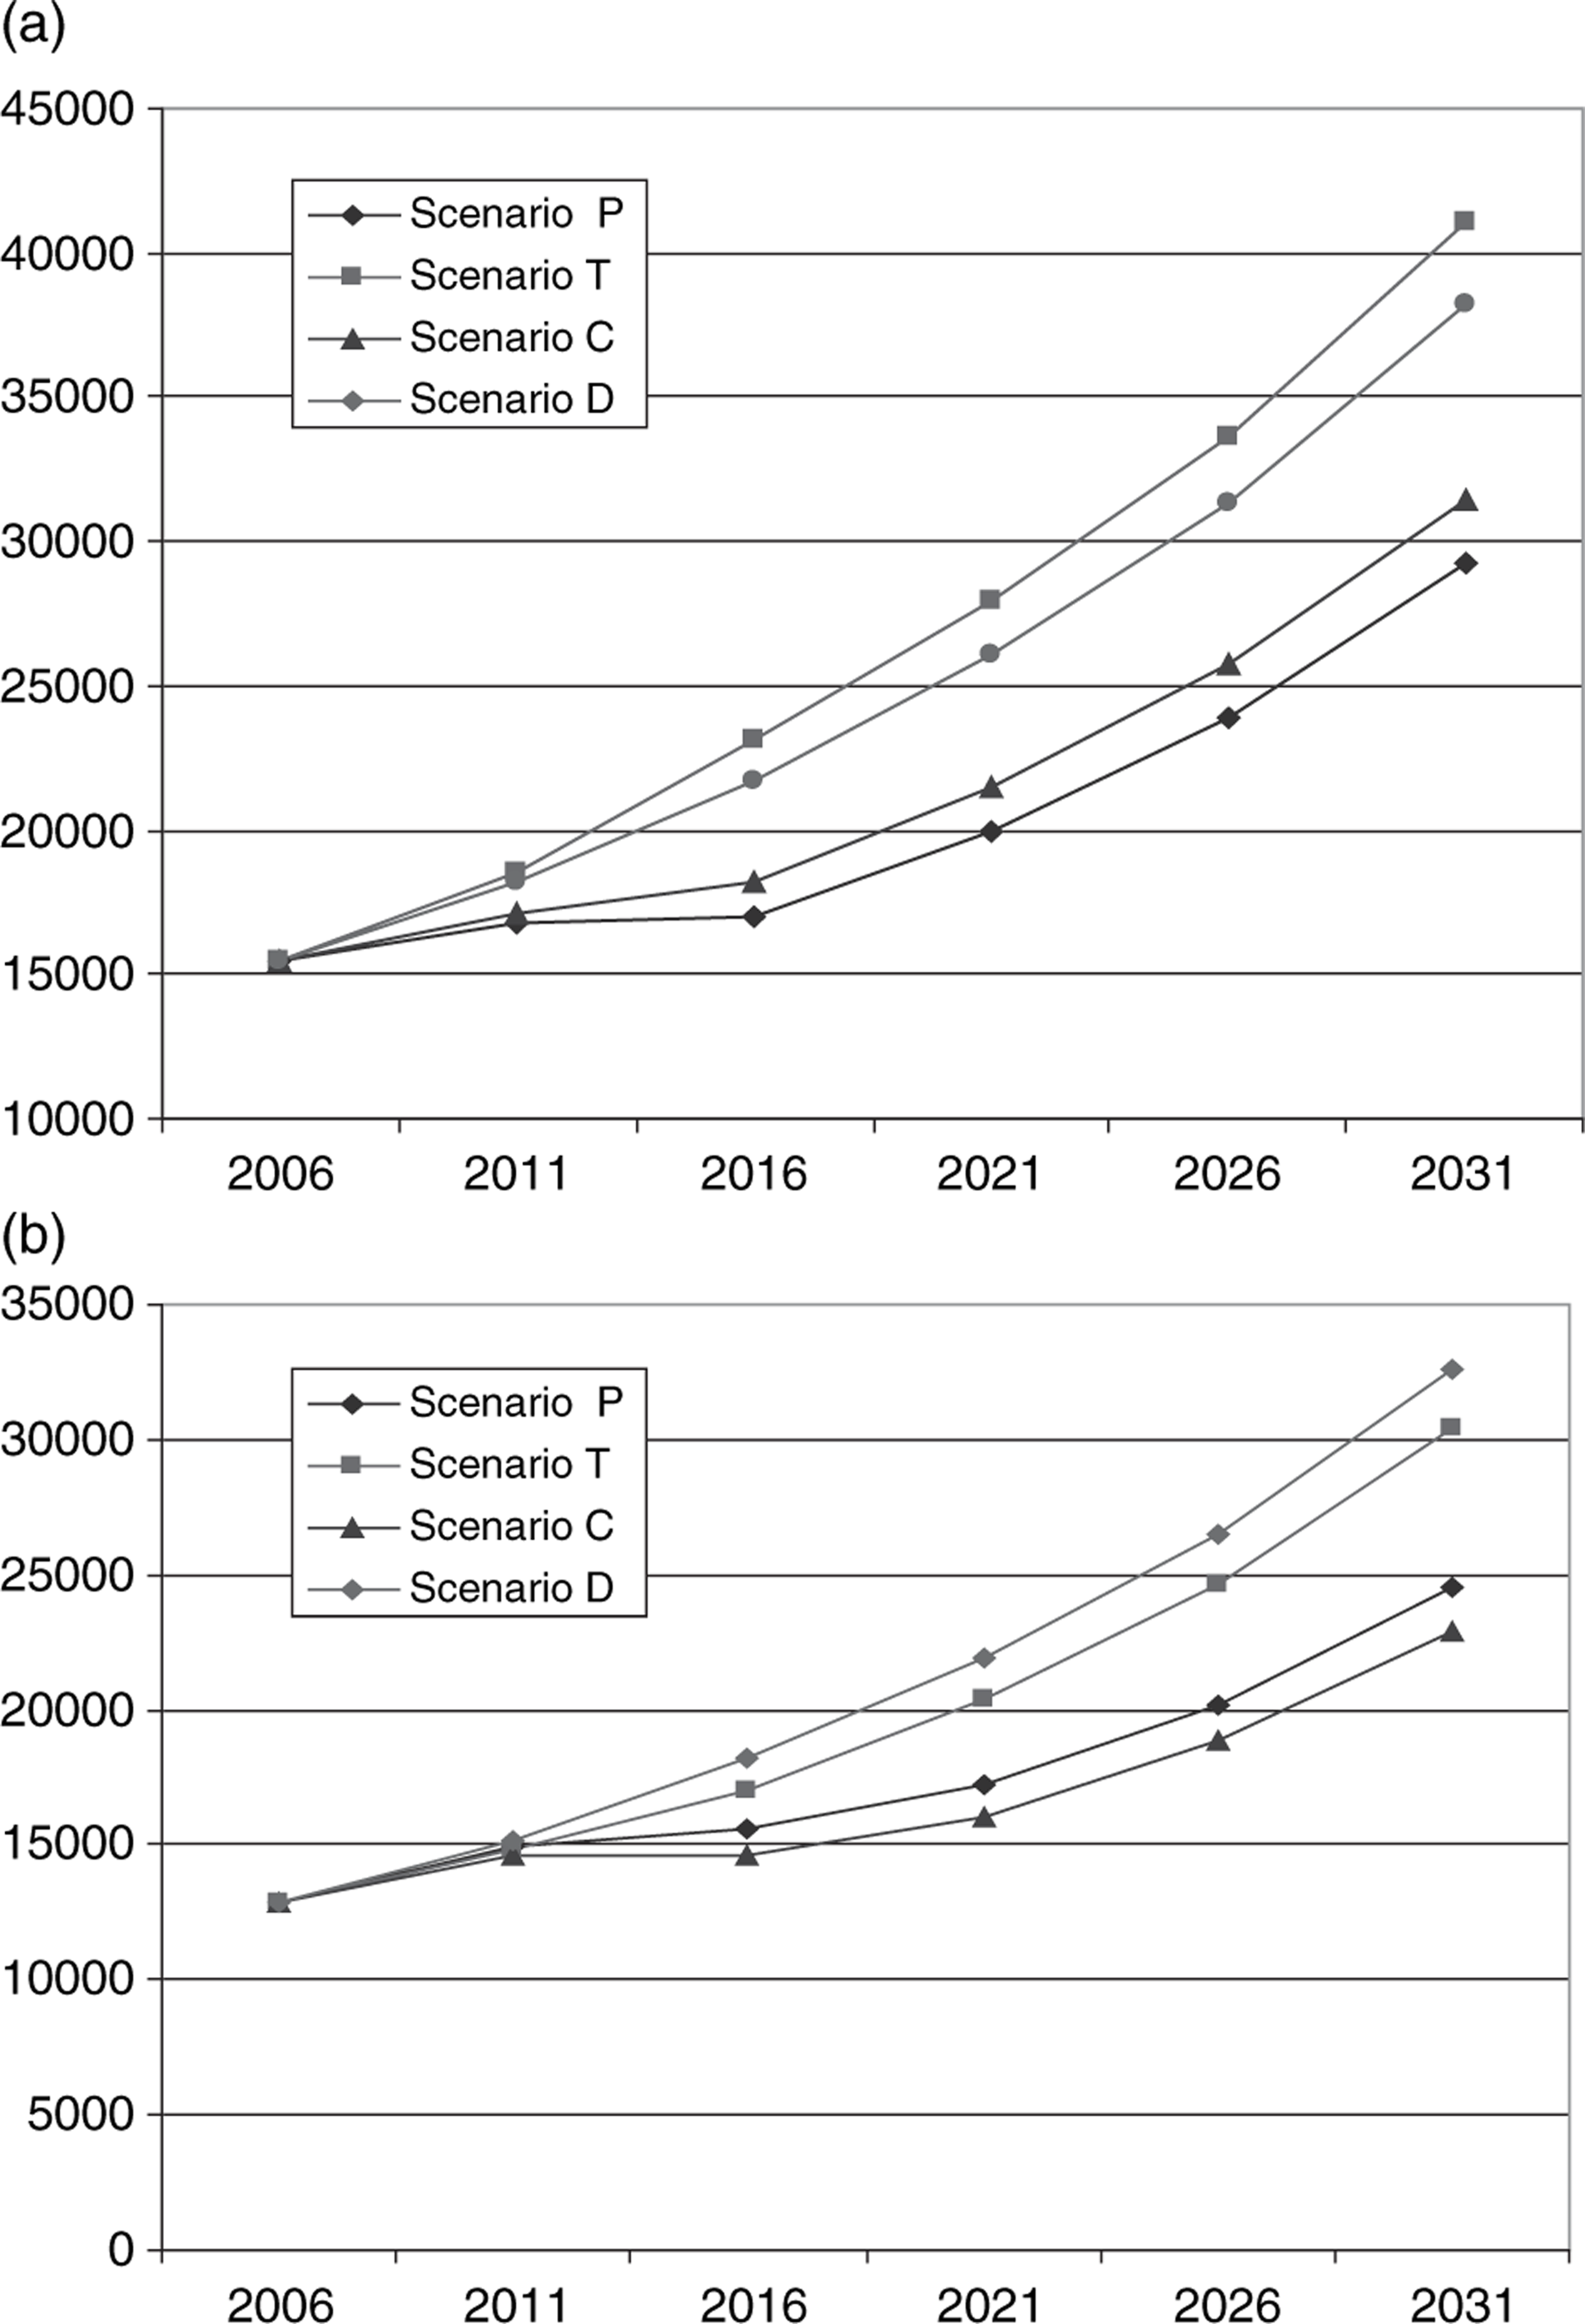
Prevalence projections by disease stage (sexes pooled). (a) Early stage prevalence (n); (b) late-stage prevalence (n). C, combined; D, demographic; P, prevention; T, treatment.
Early stage prevalence (n)
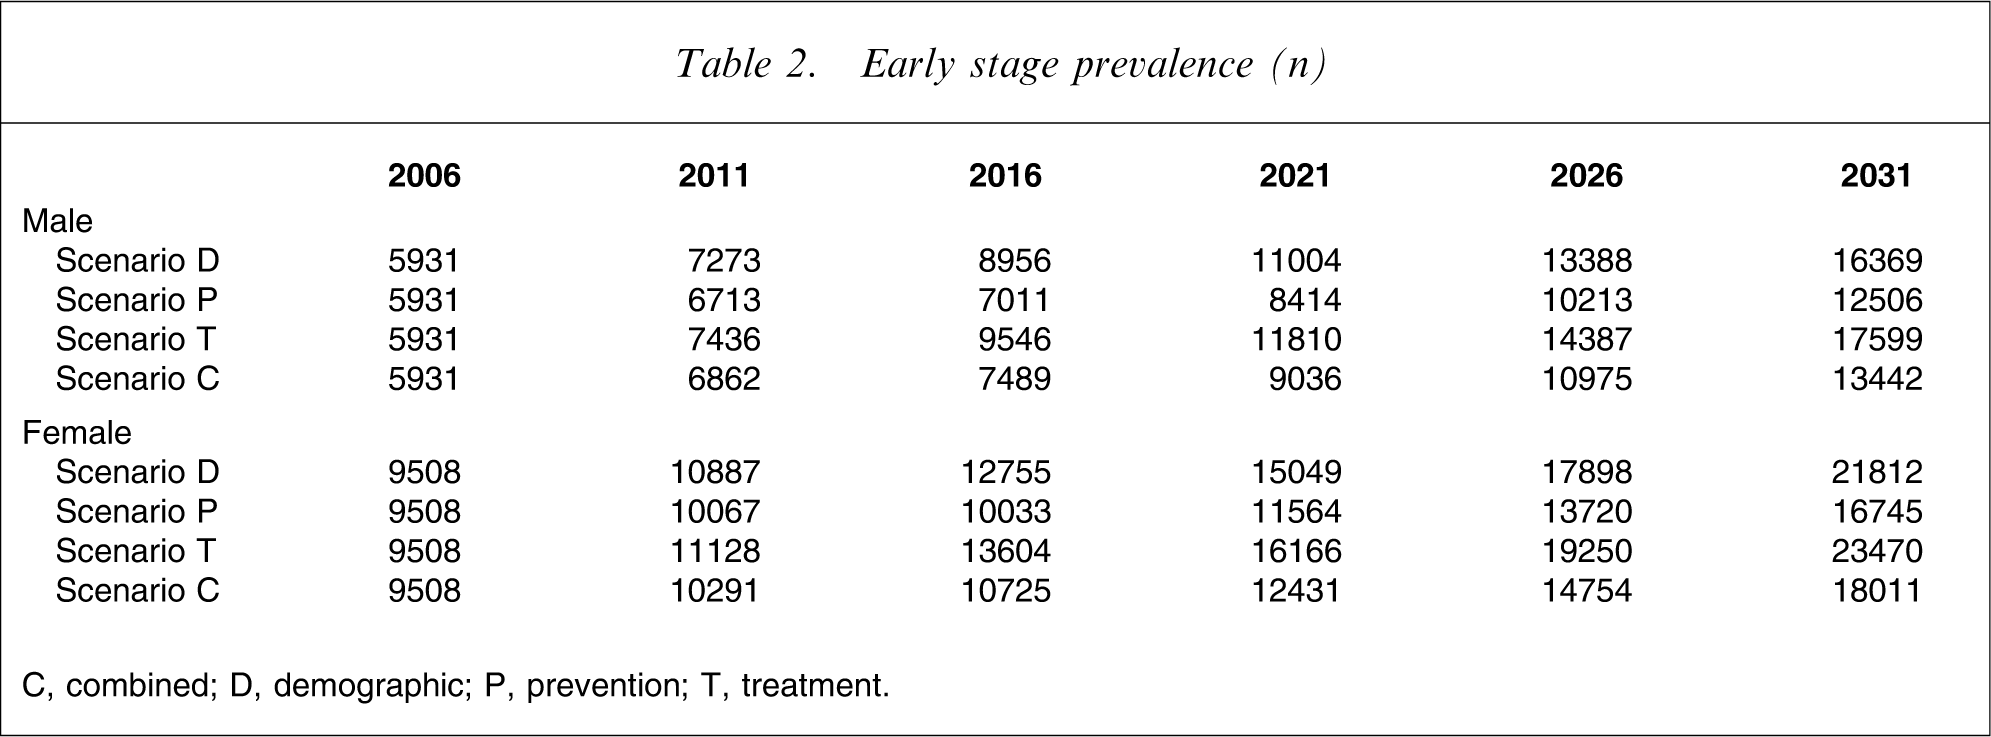
C, combined; D, demographic; P, prevention; T, treatment.
Late-stage prevalence (n)
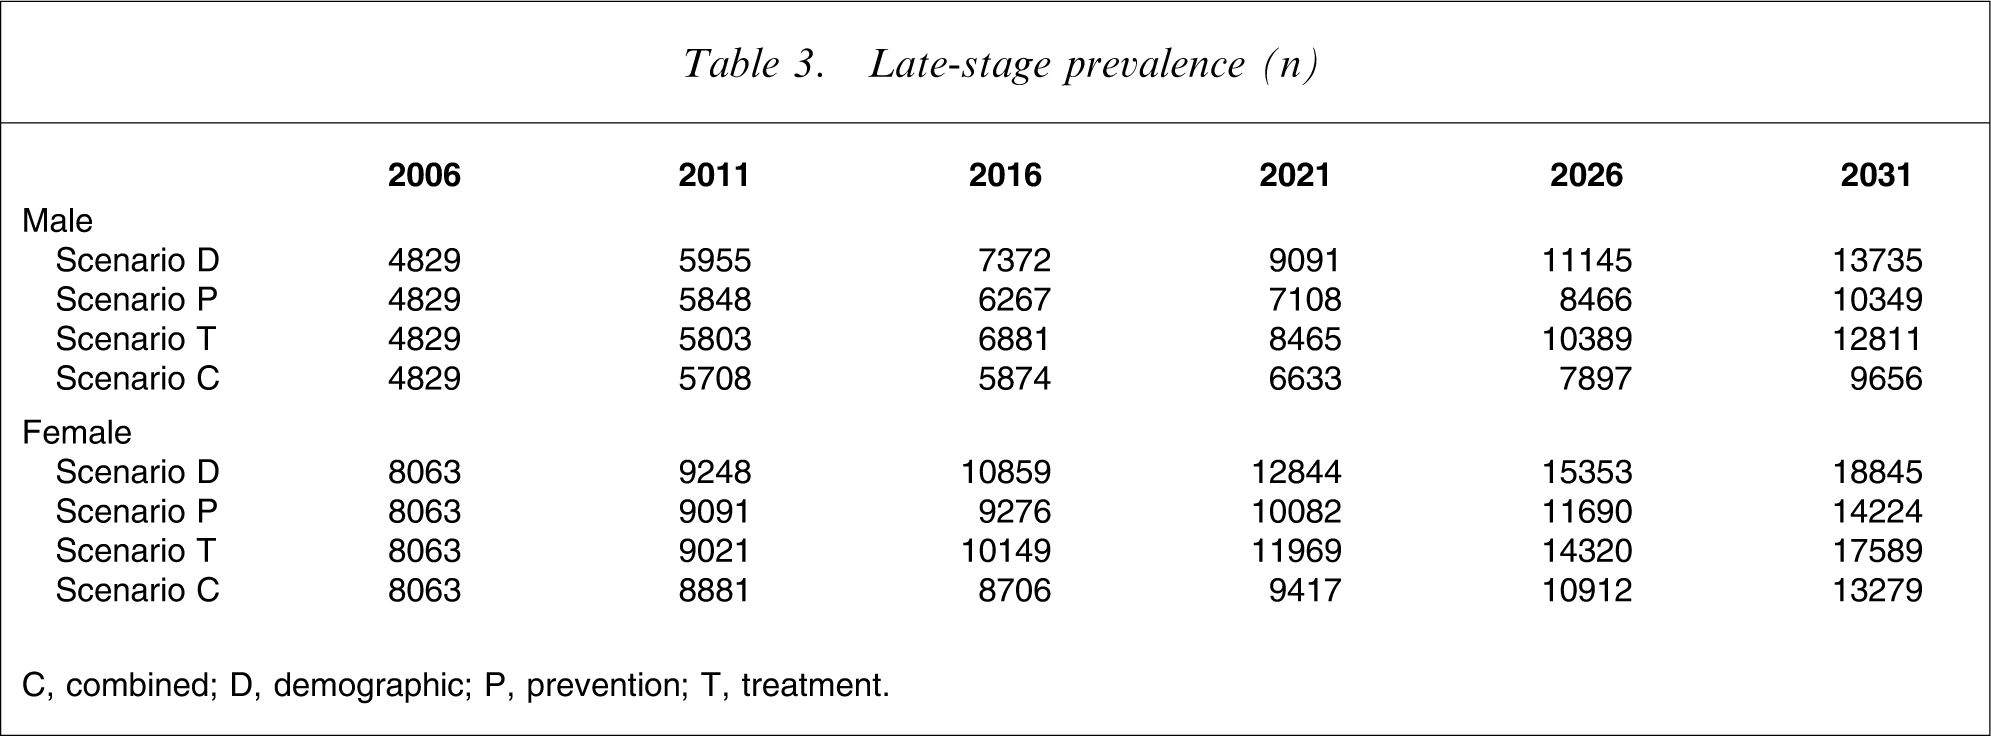
C, combined; D, demographic; P, prevention; T, treatment.
Total prevalence (n)
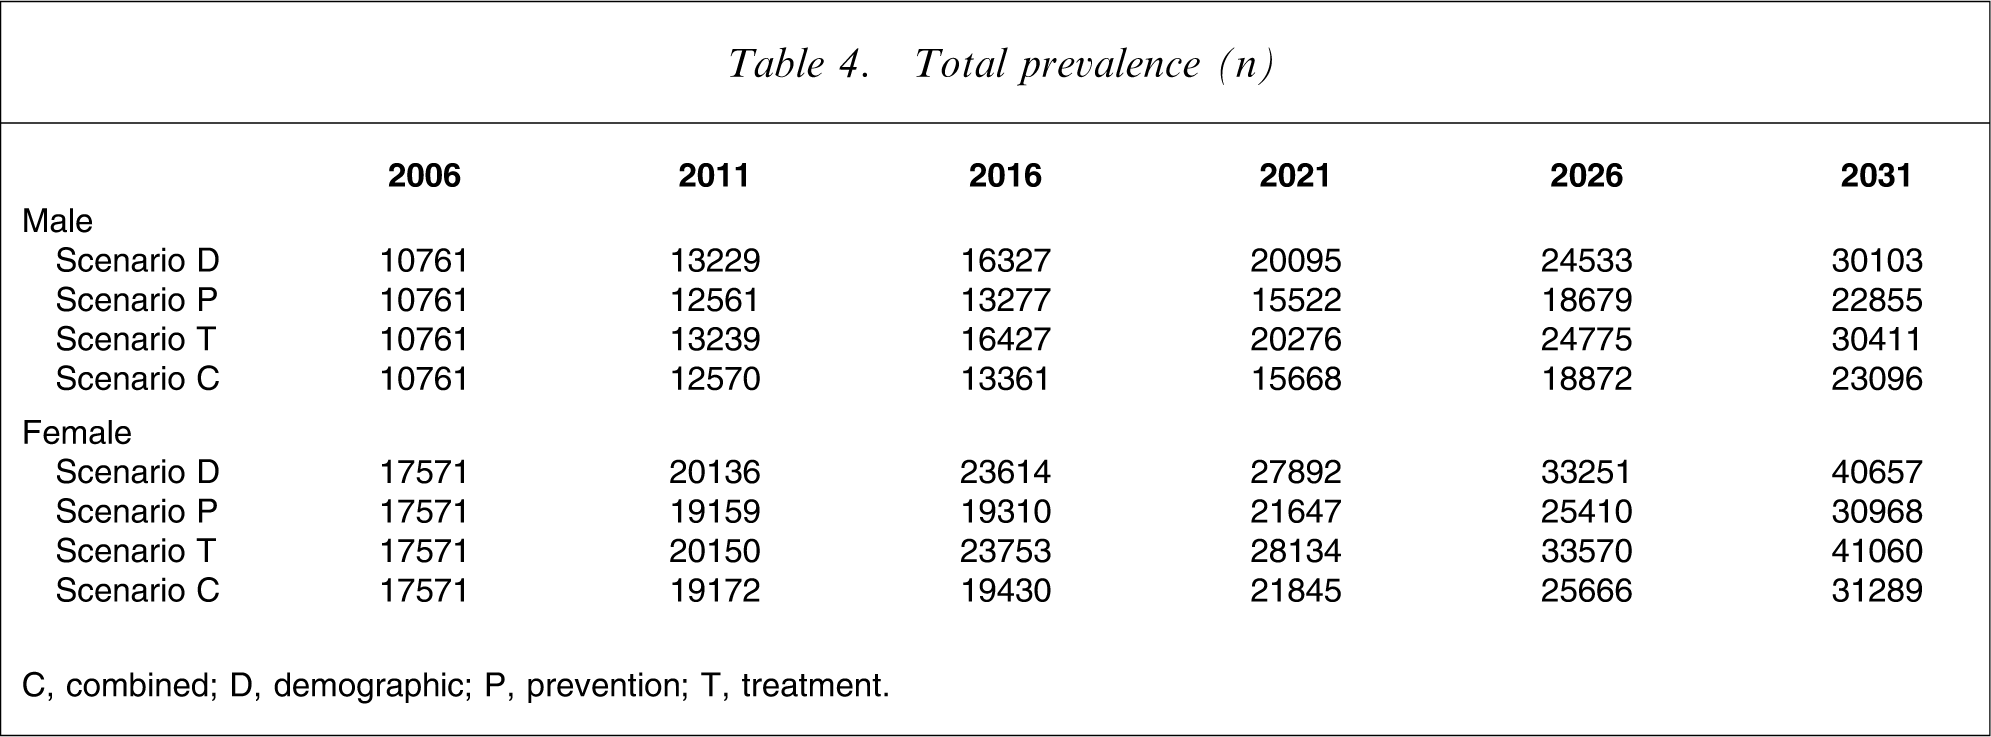
C, combined; D, demographic; P, prevention; T, treatment.
Scenario D (the demographic or base case scenario) indicates that the prevalence of AD is likely to increase 2.5-fold purely as a result of demographic forces (increasing population size and structural population ageing), with the ratio of early to late-stage disease remaining stable (at approx. 55:45).
Under scenario P (preventive interventions implemented from 2011 leading to a 2 year delay in disease incidence), the increase in prevalence out to 2031 is only 1.9-fold, a 40% reduction in the cumulative prevalence growth from 2006. There is no change in stage distribution under this scenario.
Under scenario T (therapeutic interventions implemented from 2011 leading to a 2 year delay in disease progression), prevalence increases slightly more than in the base case (scenario D). But the severity distribution of patients is altered: instead of an early: late-stage ratio of 55:45, the ratio increases to approximately 60:40. That is, although early stage prevalence reaches approximately 7.5% more by 2031 under this scenario than under the base case, late-stage prevalence is approximately 6.5% less (Figure 2).
The combined scenario (scenario C) captures the benefits of both interventions. Overall prevalence growth is curtailed, albeit not as much as in scenario P, and a shift in stage distribution is achieved, much as in scenario T. Thus under scenario C, early stage prevalence in 2031 is approximately 18% less than in the base case (scenario D), while late-stage prevalence is approximately 30% less (Figure 2). This equates approximately to a 40% relative reduction in early stage growth and a 55% relative reduction in late-stage growth.
The proportionate changes in early and late-stage prevalence under the different scenarios can usefully be expressed as estimated annual percentage changes (growth rates), assuming linearity over the projection period – which Figure 2 shows is indeed a reasonable assumption (Table 5).
Estimated annual percentage change in prevalence, 2006–2031
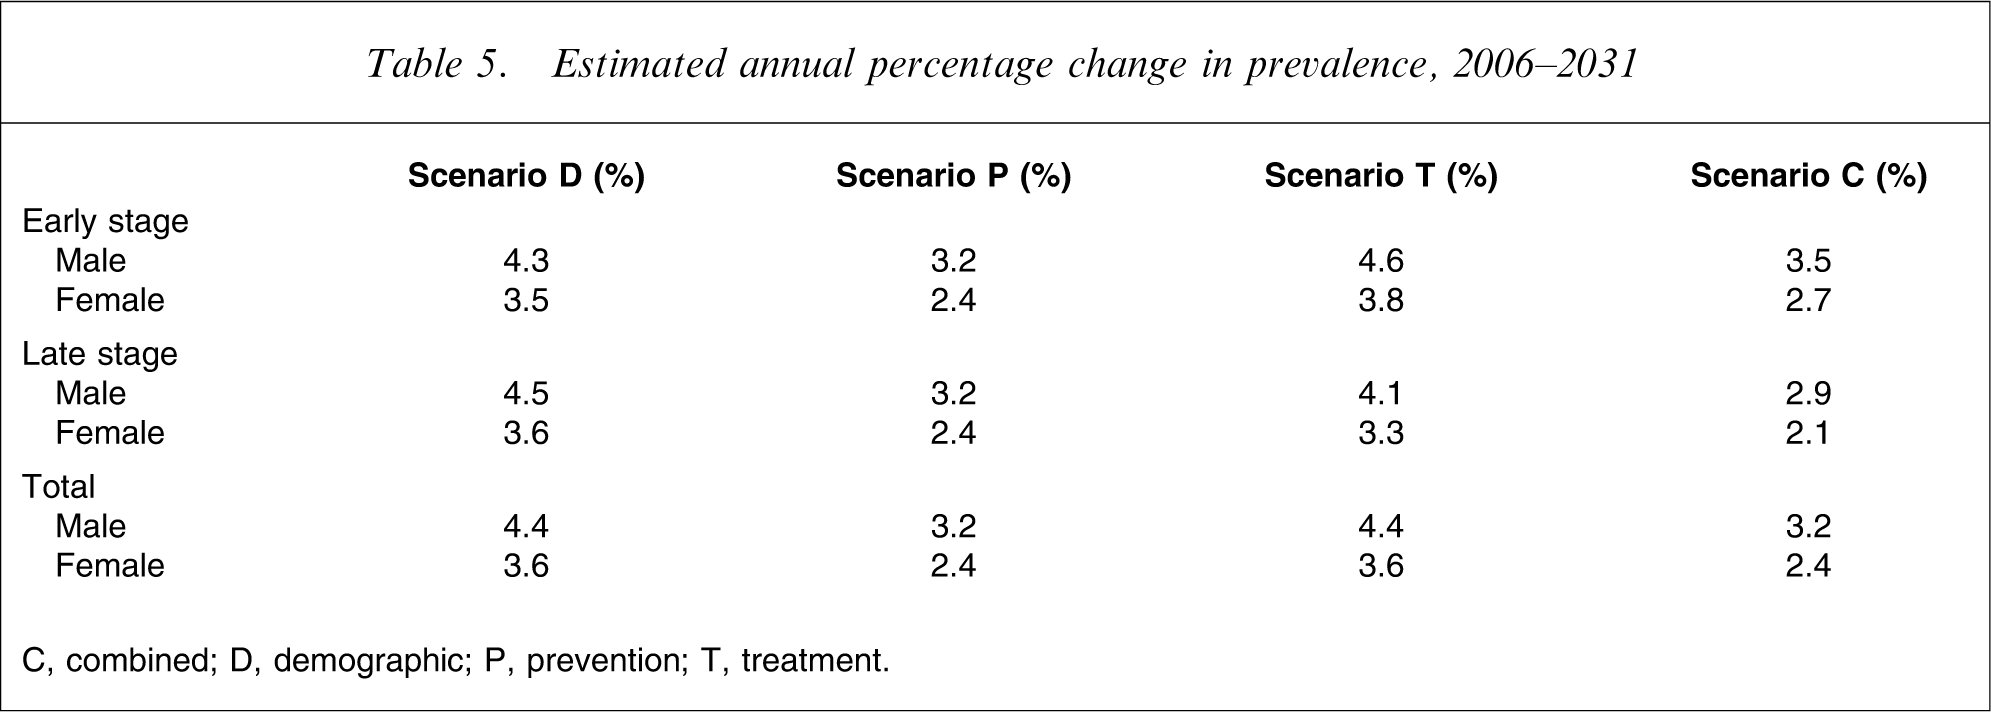
C, combined; D, demographic; P, prevention; T, treatment.
Table 5 shows that AD prevalence is predicted to grow at 4.4% per year for men and at 3.6% per year for women over the projection period, propelled purely by population ageing and increase in population size (scenario D). Similar growth rates apply to both early and late-stage disease.
An average 2 year delay in age of disease onset (scenario P) reduces all growth rates to 3.2% (male) or 2.4% (female), a reduction in growth rates of one-quarter or one-third, respectively.
By contrast, an average 2 year delay in rate of disease progression (scenario T) has opposing effects on early and late-stage growth rates. Early stage growth rates increase to 4.6% (male) and 3.8% (female), while late-stage growth rates decrease correspondingly, to 4.1% and 3.3%, respectively. Thus the overall growth rates are unaffected.
Finally, the combination of effective preventive and therapeutic interventions (scenario C) yields early stage growth rates almost as low as those in scenario P (3.5% and 2.7% for men and women, respectively), together with late-stage growth rates lower than those in any alternative scenario (2.9% and 2.1% in men and women, respectively).
Discussion
Planning to meet the needs of people with dementia requires information on the number of people currently living with this condition and the likely future growth in their number; their present and likely future distribution by stage or severity of dementia; their current and future social circumstances, including availability of informal carers; and the effectiveness (and cost-effectiveness) of existing and possible future health technologies and models of care. Families, friends and neighbours of people with dementia are also affected, whether as informal carers or in other roles, and their needs must also be addressed in service planning.
We have utilized an incidence to prevalence model that allows us to forecast the prevalence of AD and evaluate the impact of potential preventive and therapeutic interventions. We estimate the current (2006) prevalence of AD to be approximately 28 000 people, >40% with late stage disease. Furthermore, we expect the AD burden to increase 2.5-fold (150%) over the next 25 years as a result of population growth and structural ageing. It is not implausible that the increase could be even greater, depending on the future evolution of the obesity and consequential type 2 diabetes epidemics. Our model indicates, however, that plausible improvements in prevention and treatment may prevent up to half of this projected increase while simultaneously shifting the severity distribution of dementia towards the less severe end of the disability spectrum.
How reliable are these estimates and projections? While we are aware of no comparable New Zealand studies, the 2006 Postcensal Household Disability Survey and companion Disability Survey of Residential Facilities estimated that 33 700 adults had an intellectual or cognitive disability [16], which is consistent with our total prevalence estimate for AD. Furthermore we know from administrative records that almost 30 000 people are currently in residential care [17], approximately half to two-thirds with dementia, which is consistent with our estimate for late-stage AD. Finally, our modelled prevalence and future prevalence growth rates agree closely with those estimated recently for the UK [18] and other developed countries [11]. The present results are also consistent with an earlier Australian study, although that study modelled dementia rather than AD, did not differentiate disease by stage, and covered a different projection period [19].
Our model estimates approximately 2300 AD-attributable deaths per year (in 2006). By contrast, only approximately 690 deaths per year are coded to dementia on the New Zealand Health Information Service Mortality Collection. Underrecording of dementia as a cause of death is well known, with many deaths incorrectly attributed to pneumonia or other causes. Thus our model indicates that AD may in fact be the third leading cause of death in New Zealand, after coronary heart disease (approx. 6000 deaths) and stroke (approx. 2500 deaths).
One advantage of our methodology is the ability to undertake simulations, so allowing different futures to be foreseen. Our simulations suggest that a plausible improvement in prevention (higher levels of physical activity, better diet, smoking cessation, control of blood pressure, cholesterol and glucose, and maintenance of social engagement and cognitive stimulation) could reduce the anticipated demographically driven growth in the AD burden by up to 40%. Interestingly, our model demonstrates that improvements in treatment, if acting alone, would actually increase the prevalence of AD (by increasing survival time with AD without reducing incidence) – but at the same time would shift the severity distribution healthwards, so reducing the prevalence of late-stage disease. The combination of plausible preventive and therapeutic interventions, delaying both disease onset and disease progression by approximately 2 years each, could reduce the projected demographically driven increase in early stage prevalence by almost 40% while simultaneously reducing late-stage disease prevalence by >50%.
How feasible are these interventions? The evidence that onset of AD can be delayed, for example, by cardiovascular risk reduction [20] or prophylactic use of anti-inflammatory drugs such as ibuprofen [21], is accumulating, but population-level impact is difficult to estimate. Similarly, although several therapeutic drugs are currently being trialled, effectiveness and availability remain uncertain. Unlike the demographic scenario, therefore, the intervention scenarios should be considered to be illustrative rather than predictive.
Limitations
Like all modelling, the present study has limitations reflecting uncertainty in the input data and the model assumptions. The major source of uncertainty is the set of input incidence rates. There is increasing evidence, however, that variation in cross-national AD incidence may be less than previously believed, at least across the industrialized world. Furthermore, even if the absolute values are inaccurate for New Zealand, the relative (proportionate) changes across the different scenarios should be more robust. Sensitivity analysis confirms this expectation (data not shown). Also, while our assumption of exponentially increasing incidence is unlikely to hold for extreme age groups (>90 years), this has little impact on overall counts.
A second source of uncertainty is the input disease progression rate. If average dwell time in the early stage is estimated at, for example, 4 rather than 6 years, total prevalence would be approximately 10% lower than estimated in the base case, while the proportion of patients in the late stage would be slightly higher (data not shown).
A third source of uncertainty is the excess risk of mortality associated with dementia (early and late stage). Sensitivity analysis again confirms that the model output in terms of prevalence is relatively unresponsive to this variable.
A final source of uncertainty is the population projections. SNZ produces different series of these, based on different assumptions about future trends in fertility, migration and mortality. The series 5 projections, which are based on medium assumptions for all three variables, have proven reasonably accurate in the past and are likely to perform satisfactorily over the relatively short projection horizon used in the present study.
Policy and monitoring implications
Our model confirms that substantial growth in the burden of AD must be planned for the coming 25 years (and beyond). Plausible innovations in prevention and (to a lesser extent) treatment could potentially halve this demographically driven increase, according to our model. This would mean that the burden of AD doubles over this period, instead of increasing 2.5-fold; and this is probably the best that can be expected.
Clearly, the implications of these projections for patients, informal carers, the psychogeriatric workforce, and health and social care planners and funders are profound. New models of care and service configurations may be necessary [17], [22]. Better coordination and higher standards for home care, day care, respite care, residential care and specialist services (such as memory clinics) will also be required [23]. Perhaps the single most important improvement needed is earlier and more accurate diagnosis of AD and related dementia syndromes by primary care physicians [24]. One tool that could assist in ensuring that all patients receive both a timely diagnosis and high quality post-diagnosis care is the establishment of comprehensive and regularly updated dementia registers in primary health organizations (PHOs) [25]. With virtually the whole population now enrolled in a PHO, these registers would also provide better empirical estimates of dementia prevalence (as well as incidence and survival) than are possible from existing surveys and administrative data collections. This would in turn allow our model to be refined and the uncertainty around the estimates and projections (especially in absolute terms) to be reduced, so enhancing the added value of the model for evidence-informed policy and planning.
Footnotes
Acknowledgements
This paper is published with the approval of the Deputy Director General (Health and Disability Systems Strategy Directorate), New Zealand Ministry of Health. Opinions expressed, however, are the authors’ own and do not necessarily reflect the Ministry's policy advice.