
Abstract
Objective:
Common mental disorders are the most common reason for long-term sickness absence in most developed countries. Prediction algorithms for the onset of common mental disorders may help target indicated work-based prevention interventions. We aimed to develop and validate a risk algorithm to predict the onset of common mental disorders at 12 months in a working population.
Methods:
We conducted a secondary analysis of the Household, Income and Labour Dynamics in Australia Survey, a longitudinal, nationally representative household panel in Australia. Data from the 6189 working participants who did not meet the criteria for a common mental disorders at baseline were non-randomly split into training and validation databases, based on state of residence. Common mental disorders were assessed with the mental component score of 36-Item Short Form Health Survey questionnaire (score ⩽45). Risk algorithms were constructed following recommendations made by the Transparent Reporting of a multivariable prediction model for Prevention Or Diagnosis statement.
Results:
Different risk factors were identified among women and men for the final risk algorithms. In the training data, the model for women had a C-index of 0.73 and effect size (Hedges’ g) of 0.91. In men, the C-index was 0.76 and the effect size was 1.06. In the validation data, the C-index was 0.66 for women and 0.73 for men, with positive predictive values of 0.28 and 0.26, respectively
Conclusion:
It is possible to develop an algorithm with good discrimination for the onset identifying overall and modifiable risks of common mental disorders among working men. Such models have the potential to change the way that prevention of common mental disorders at the workplace is conducted, but different models may be required for women.
Introduction
Common mental disorders (generally defined as depressive and anxiety disorders, sometimes with the addition of common forms of substance abuse) are viewed as a major and increasing public and occupational health issue as they cause high levels of distress for those who experience them and their relatives, as well as considerable financial costs to society. In almost all developed countries, common mental disorders have now taken over from musculoskeletal problems as the leading cause of incapacity benefits and sickness absence, creating a huge cost to industry, society and the individuals effected (Harvey et al., 2009).
In an effort to reduce this burden, governments have supported increases in clinical services for mental disorder. However, despite this investment, the prevalence of mental disorders has not changed (Kessler et al., 2005). Evidence suggests that even in the unlikely event of adequate treatments being available to all who need them, there will only be a 40% reduction in the disease burden of common mental disorders (Andrews et al., 2004). The prevalence of disease is a combination of incidence and duration. So, to reduce its prevalence, interventions need to focus not only on a condition’s duration (i.e. through treatment) but also on reducing the number of new cases or relapses through prevention efforts (Jacka et al., 2013).
The workplace may be a good setting for prevention programmes as employers are motivated to financially support prevention activities, and it is a place where many members of society spend much of their waking hours (Mykletun and Harvey, 2012). The workplace brings together the two opposing paradigms in mental health: (a) ‘toxic work-stress’, and (b) ‘good work is good for your health’. The former proposes that the focus of workplace mental health intervention should be on increasing the skills to manage work-related stressors or making structural and design changes to reduce the stressors, while the latter focuses on the relevance of the workplace as a source of social support and self-realization (Czabala et al., 2011; Mykletun and Harvey, 2012). Unfortunately, wide-scale implementations of mental health prevention programmes in the workplace have been impeded by the uncertainty about what programmes are most effective and how to identify those most in need of prevention efforts (Joyce et al., 2016). There is good evidence that a range of prevention interventions can decrease the incidence of depression by 25–50% (Cuijpers et al., 2012), but the vast majority of the evidence-based initiatives depend on identifying a high-risk group for selected intervention (Beekman et al., 2010). However, to date, there is no agreed way in which to quantify the overall mental health risk among working individuals.
Estimating overall risk across a range of vulnerability and protective risk factors followed by health promotion/risk profile targeting interventions or recommendations is widely accepted as the basis of much primary indicated and selected prevention in developed countries for cardiovascular and metabolic diseases (Dapp et al., 2011; Maron et al., 2008; Nagykaldi et al., 2013). Conversely, there are few risk algorithms for the onset of mental disorders (Bellon et al., 2011; King et al., 2008, 2011; Moreno-Peral et al., 2014; Wang et al., 2014), and none have been developed specifically for working people. A range of modifiable environmental and individual risk factors have been identified for poor mental health in employees, but these have almost exclusively focused on workplace factors as they have been derived from occupational cohorts (Henderson et al., 2011). Furthermore, they are subject to a number of specific selection and other biases, for example, they are often based around government employees, that limit generalisability (Glozier et al., 2010). As such, developing a potentially broadly applicable risk algorithm and profile requires data from a large population-based cohort of working people with a broad range of both work and non-work factors, adequate response rates and follow-up, and preferably participants unaware of the aim to study such risks to ameliorate response bias. The Household, Income and Labour Dynamics in Australia Survey (HILDA) study provides just such a resource. In this study, we aimed to develop and validate a risk prediction algorithm for the onset of common mental disorders among employed people.
Methods
We followed the recommendations made by the TRIPOD statement (Transparent Reporting of a multivariable prediction model for Prevention Or Diagnosis) (Moons et al., 2015) by non-randomly splitting a sample for the development and validation of the prediction model. This process uses a frequentist approach, regression, which, although potentially falsely promoting one model of many with similar predictive properties, enables a comprehensible algorithm to be developed and then tested.
Study design and data sources
We conducted a secondary data analysis of the HILDA, a large, longitudinal, nationally representative household panel. Since 2001, it has conducted survey waves on annual basis (Watson and Wooden, 2010, 2012). Data are collected through both self-reported and a personal interview with a specific household member. It has been used primarily for socioeconomic purposes in Australian policy-making. The two most recent waves (at the time of the study, waves 11 and 12) formed the basis of this project
Participants
HILDA has two population samples: the original one that started in 2001 (wave 1) and a top-up sample that was introduced in 2011 (wave 11). A total of 17,612 Australians aged 15 years and above participated in wave 11. There was a household response rate of 69% in wave 11.
Among those who answered wave 11, we selected those who (a) were followed up in wave 12, (b) did not have any common mental disorder at wave 11 as defined by the mental health score derived from the 36-Item Short Form Health Survey (SF-36) at wave 11 and (c) did not have missing data in the outcome variable (i.e. SF-36) at both baseline and follow-up. There were no gender differences at baseline between those with complete SF-36 and those with missing data, although they tend to be younger (52.27 vs 50.54 years old; p < 0.009): At follow-up, there were more men with missing SF-36 data (24.12% vs 21.53%; p < 0.015) than women, and those with missing SF-36 data were younger (52.68 vs 50.72; p < 0.0041). However, the differences were small and were statistically different mostly due to the large sample size.
This final sample of 6189 participants was split into two: (a) the training (development) database and (b) the validation database. Simple random selection minimises variability between the two samples, risking an overly positive result from the validation sample (Moons et al., 2015). To avoid this, we split the sample by state/territory to maximise variability, stratified by gender. The training database included participants from New South Wales, Northern Territory, Queensland and South Australia, while people from Victoria, Western Australia, Tasmania and the Australian Capital Territory (ACT) formed the base for the validation database. As a consequence, we ended up with four subsamples (Figure 1):
Training database women: 1763 participants;
Training database men: 1905 participants;
Validation database women: 1173 participants;
Validation database men: 1348 participants.
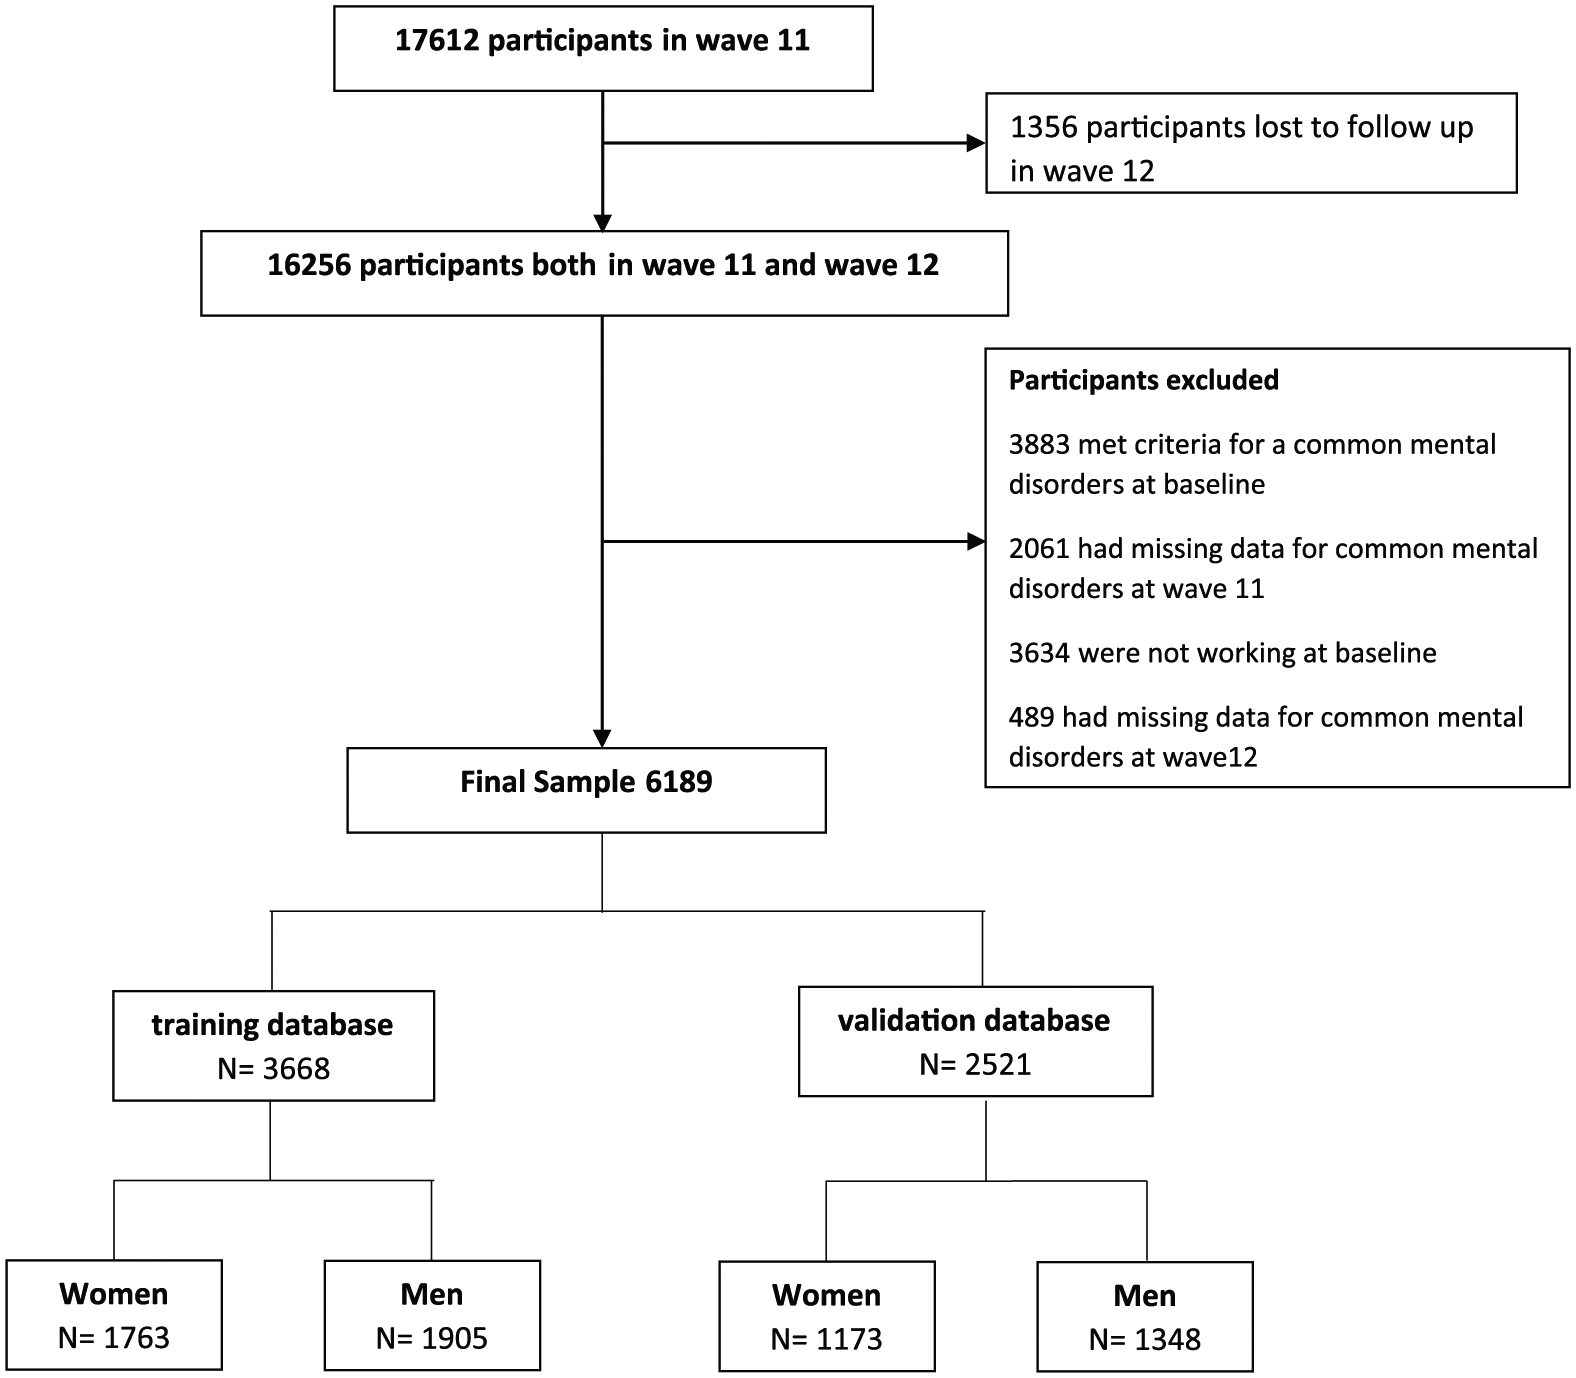
Flow diagram.
Sample size
We did not calculate a formal sample size, as the HILDA study is an ongoing study with a fixed number of participants. However, it has been suggested that a prediction model requires at least 10 events per candidate variable and at least 100 participants with the outcome for the validation (Moons et al., 2015). Previous analyses have estimated that incidence of a new episode of common mental disorders is between 10% and 15%. Therefore, both our sample and the number of events meet these recommendations (Moons et al., 2015).
Outcome predicted: common mental disorder
Common mental disorders have previously been shown to be ascertainable in Australia using the mental component score (MCS) of the SF-36 questionnaire (Butterworth and Crosier, 2004), which is administered each year in HILDA. To calculate the MCS, we followed standard procedures and transformed each of the eight SF-36 subscales to a 0–100 scale (McHorney et al., 1993, 1994; Ware and Sherbourne, 1992). Scoring algorithms were applied to produce the MCS, using the Australian norms (ABS, 1997). Although the time frame of SF-36 is the past 4 weeks, low scores on the mental component of SF-36 and its short form (SF-12, derived from SF-36) are highly correlated with 1-year prevalence of common mental disorders in different contexts, including Australian populations (Gill et al., 2007; Kristjansdottir et al., 2011; McCallum, 1995; Vilagut et al., 2013; Windsor et al., 2006). In a study using data from the Australian National Survey of Mental Health and Wellbeing, a score of 45 on the MCS was the best cut-off for depression (area under a curve [AUC]: 0.92) and a score of 50 for anxiety disorders (AUC: 0.83) (Gill et al., 2007). To avoid false-positives, and being aware that participants in HILDA tended to report slightly lower MCS scores than other Australian health surveys (Butterworth and Crosier, 2004), we followed a restrictive approach and considered that a person was experiencing a common mental disorder if his or her SF-36 MCS was ⩽45.
Predictors
Most of the HILDA questions were taken or slightly modified from surveys undertaken by the Australian Bureau of Statistics, the Australian Institute of Health and Welfare or were made ad hoc in consultation with a group of experts. Based on previously published studies of mental health risk algorithms (Bellon et al., 2011; King et al., 2008, 2011; Moreno-Peral et al., 2014; Wang et al., 2014), we selected the following potential risk/protective factors.
Demographics and socioeconomic status: age, education, marital status, type of employment, having English as a second language, being born outside of Australia and being from Aboriginal and Torres Strait Islander background;
Health: smoking behaviour, drinking behaviour, body mass index (BMI), physical activity and self-reported chronic illness;
History of a common mental disorder in the 2 years prior to baseline defined as having met the same criteria in either of the two previous waves of HILDA (9 and 10). In the case of participants coming from the top-up sample in wave 11 (30%), this information was imputed (see missing data section).
Potential life stressors: Being a carer; Stressful life events in the past 12 months assessed with 17 questions and based on the list developed by Holmes and Rahe (Summerfield et al., 2015); Financial hardship was assessed using eight questions, assessing prosperity taking into account needs and responsibilities, and if the person had problems paying bills, rent or mortgage; or had pawned or sold something to get money, buy food or heat the home; or had to ask friends or organisations for help.
Work factors: Job satisfaction in 6 areas: pay, job security, the work itself, the numbers of hours, flexibility and total; Union membership; Psychosocial work characteristics: based on 21 questions derived from the Job Content Questionnaire (Robert and Karasek, 1979).
Satisfaction with different life domains: home, finances, safety, community, health, neighbourhood, free time, life, partner (if applicable) and the way tasks are divided at home (if applicable);
Questions related to the perception of personal control over life: assessed with the questionnaire developed by Pearlin and Schooler to try and elucidate reports of autonomy and control and/or discriminatory behaviour (Summerfield et al., 2015);
Aspects of social capital: neighbourhood trust, frequency of social contacts and being a member of a club;
Social support: assessed with 10 items, with the first 7 items coming from Henderson et al. and the last 3 items from Marshall and Barnett (Summerfield et al., 2015).
Statistical analysis
All the analysis and data imputation were performed using STATA 13SE and stratified by gender.
Missing data
As others have done when building risk algorithms (Bellon et al., 2011; King et al., 2008; Moreno-Peral et al., 2014), we excluded those participants with missing data for the outcome variable (i.e. the SF-36). Any missing value in the predictors was imputed using multiple imputations with chained equations under a missing at random (MAR) framework. We generated 30 imputed samples. Estimates for the analysis were combined using Rubin’s (1987) rules.
Model building
The training databases were used to build the model and perform the internal validation. The potential variable list was too extensive to be included in the model in one step, taking into account our sample size and the guide of at least 10 events per variable. As such, for the main models, we chose baseline predictors that, in unadjusted analysis of the a priori chosen variables, were associated with the outcome with a p value <0.2 (Greenland, 1989). We assessed autocorrelation and, for highly correlated variables, included them in a separate, restricted, multivariate model and selected the variables that had a p value <0.2. This resulted in an initial list of 34 candidate variables for women and 31 for men.
The prediction algorithm was developed using a logistic regression model. We acknowledge that there are other methods for developing risk algorithms, such as classification trees, neural networks, genetic programming, random forests and vector machine learning techniques, that are receiving increasing attention. However, we decided to use regression modelling as this is the most used method (so, we will be able to compare our results with others) and because concerns have been raised related to the transparency of these methods (Moons et al., 2015). We developed the model in the imputed databases using backward procedures, removing those with the weakest association (i.e. highest p value) step by step to obtain a more parsimonious model, until all the remaining variables had a p value <0.1 (Moons et al., 2015). We then sequentially included each variable that was excluded in prior steps to test whether the final model performance could be improved. These variables were included in the final model if their p value was <0.1 and their presence enhanced the model, comparing AUC values (Moons et al., 2015).
The two core psychometrics when developing a risk algorithm are (a) discrimination and (b) calibration. Discrimination, which measures how well an algorithm distinguishes (discriminates) individuals with and without the outcome of interest, is commonly assessed by C-index (Tripepi et al., 2010a), which, for a dichotomous outcome, is the same as the receiver operating characteristic (ROC). We calculated the C-index as proposed by Copas (1983) to adjust for over-fitting of our prediction model. Calibration is the ability of a risk model to correctly estimate the probability of a given event across the whole range of prognostic estimates (Tripepi et al., 2010b). We assessed the goodness of fit of the final risk model by grouping individuals into deciles of risk and comparing the observed probability of developing common mental disorders within these groups with the average risk. We calculated the effect sizes using Hedges’ g index (Cooper et al., 1994) for the difference in log odds of predicted probability between participants in each decile who were later observed to develop a common mental disorder and those who were not. We report the threshold values of risk score and the associated sensitivity and specificity values. We also calculated Youden’s index (J = sensitivity + specificity − 1). We used the C-index, Hedges’ g and a comparison of predicted vs observed probability of common mental disorders to evaluate the performance of the trained model in the validation databases.
Results
The participant flow and inclusion are shown in Figure 1. Wave 11 had 17,612 participants. A total of 1356 (8%) persons with information in wave 11 were lost to follow-up in wave 12. Those lost to follow-up were more likely to be younger, male, divorced or widowed; have lower education; not working; and from an Aboriginal and/or Torres Strait Islander (ATSI) background. However, those lost to follow-up in wave 12 had a lower probability of meeting the criteria for a common mental disorder in wave 11 (i.e. they were healthier). Indeed, although not statistically significant, those with a chronic health condition had a lower probability of be missed at follow-up.
The removal of those lost to follow-up resulted in a sample of 16,256 participants that we were able to link from wave 11 to wave 12. In total, 10,067 did not meet inclusion criteria of working, had no common mental disorder at wave 1, and had common mental disorder data at wave 2 (Figure 1). This resulted in a final sample of 6189 participants, which was split into (a) the training database (development) and (2) the validation database and stratified by gender.
Participants
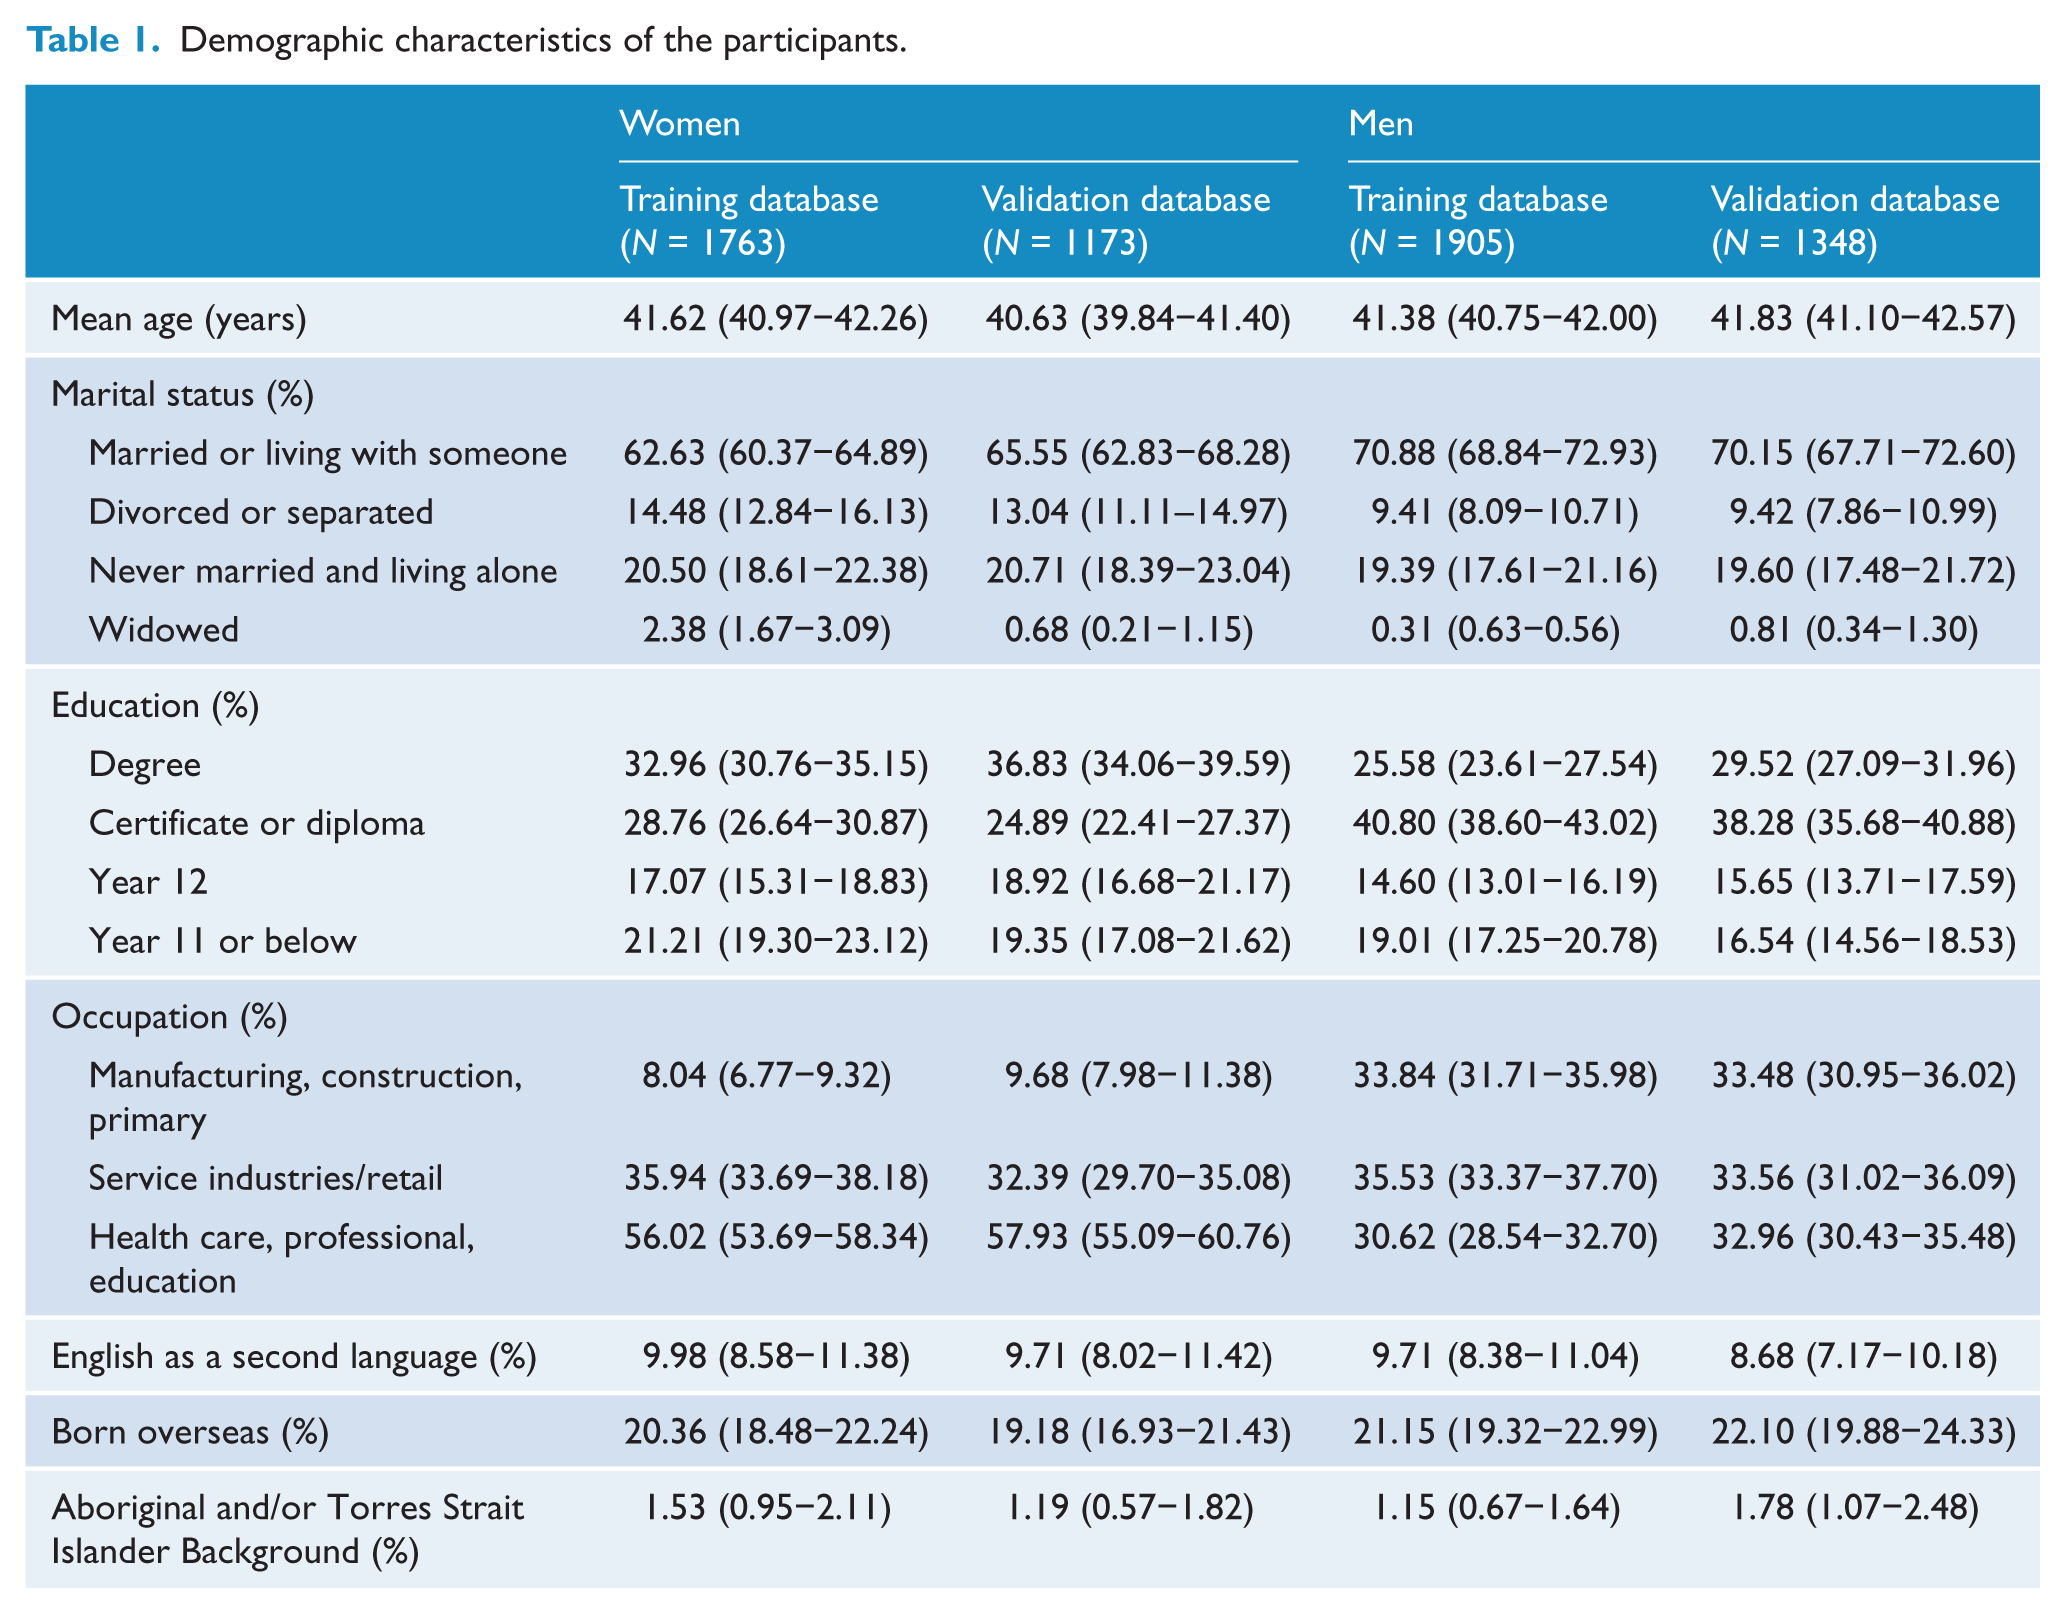
The characteristics of the participants in the training and validation datasets, stratified by gender, are shown in Table 1. There were fewer married women than men and a higher proportion of women with a high educational degree. More men were working in primary industries (e.g. farming, mining) or construction, while more women were working in the health care, education or professional sector. Men and women were similar in age, ATSI background, being born overseas or having English as a second language. For both men and women, there were no systematic differences between participants in the development and validation datasets. In the women’s development dataset, 242 (13.7%) developed a common mental disorder. In the validation data, 182 (15.0%) developed a common mental disorder over the 1-year follow-up period. A total of 203 (10.7%) and 140 (10.4%) developed a common mental disorder in the men’s training and validation database, respectively.
Demographic characteristics of the participants.
Prediction models
Women
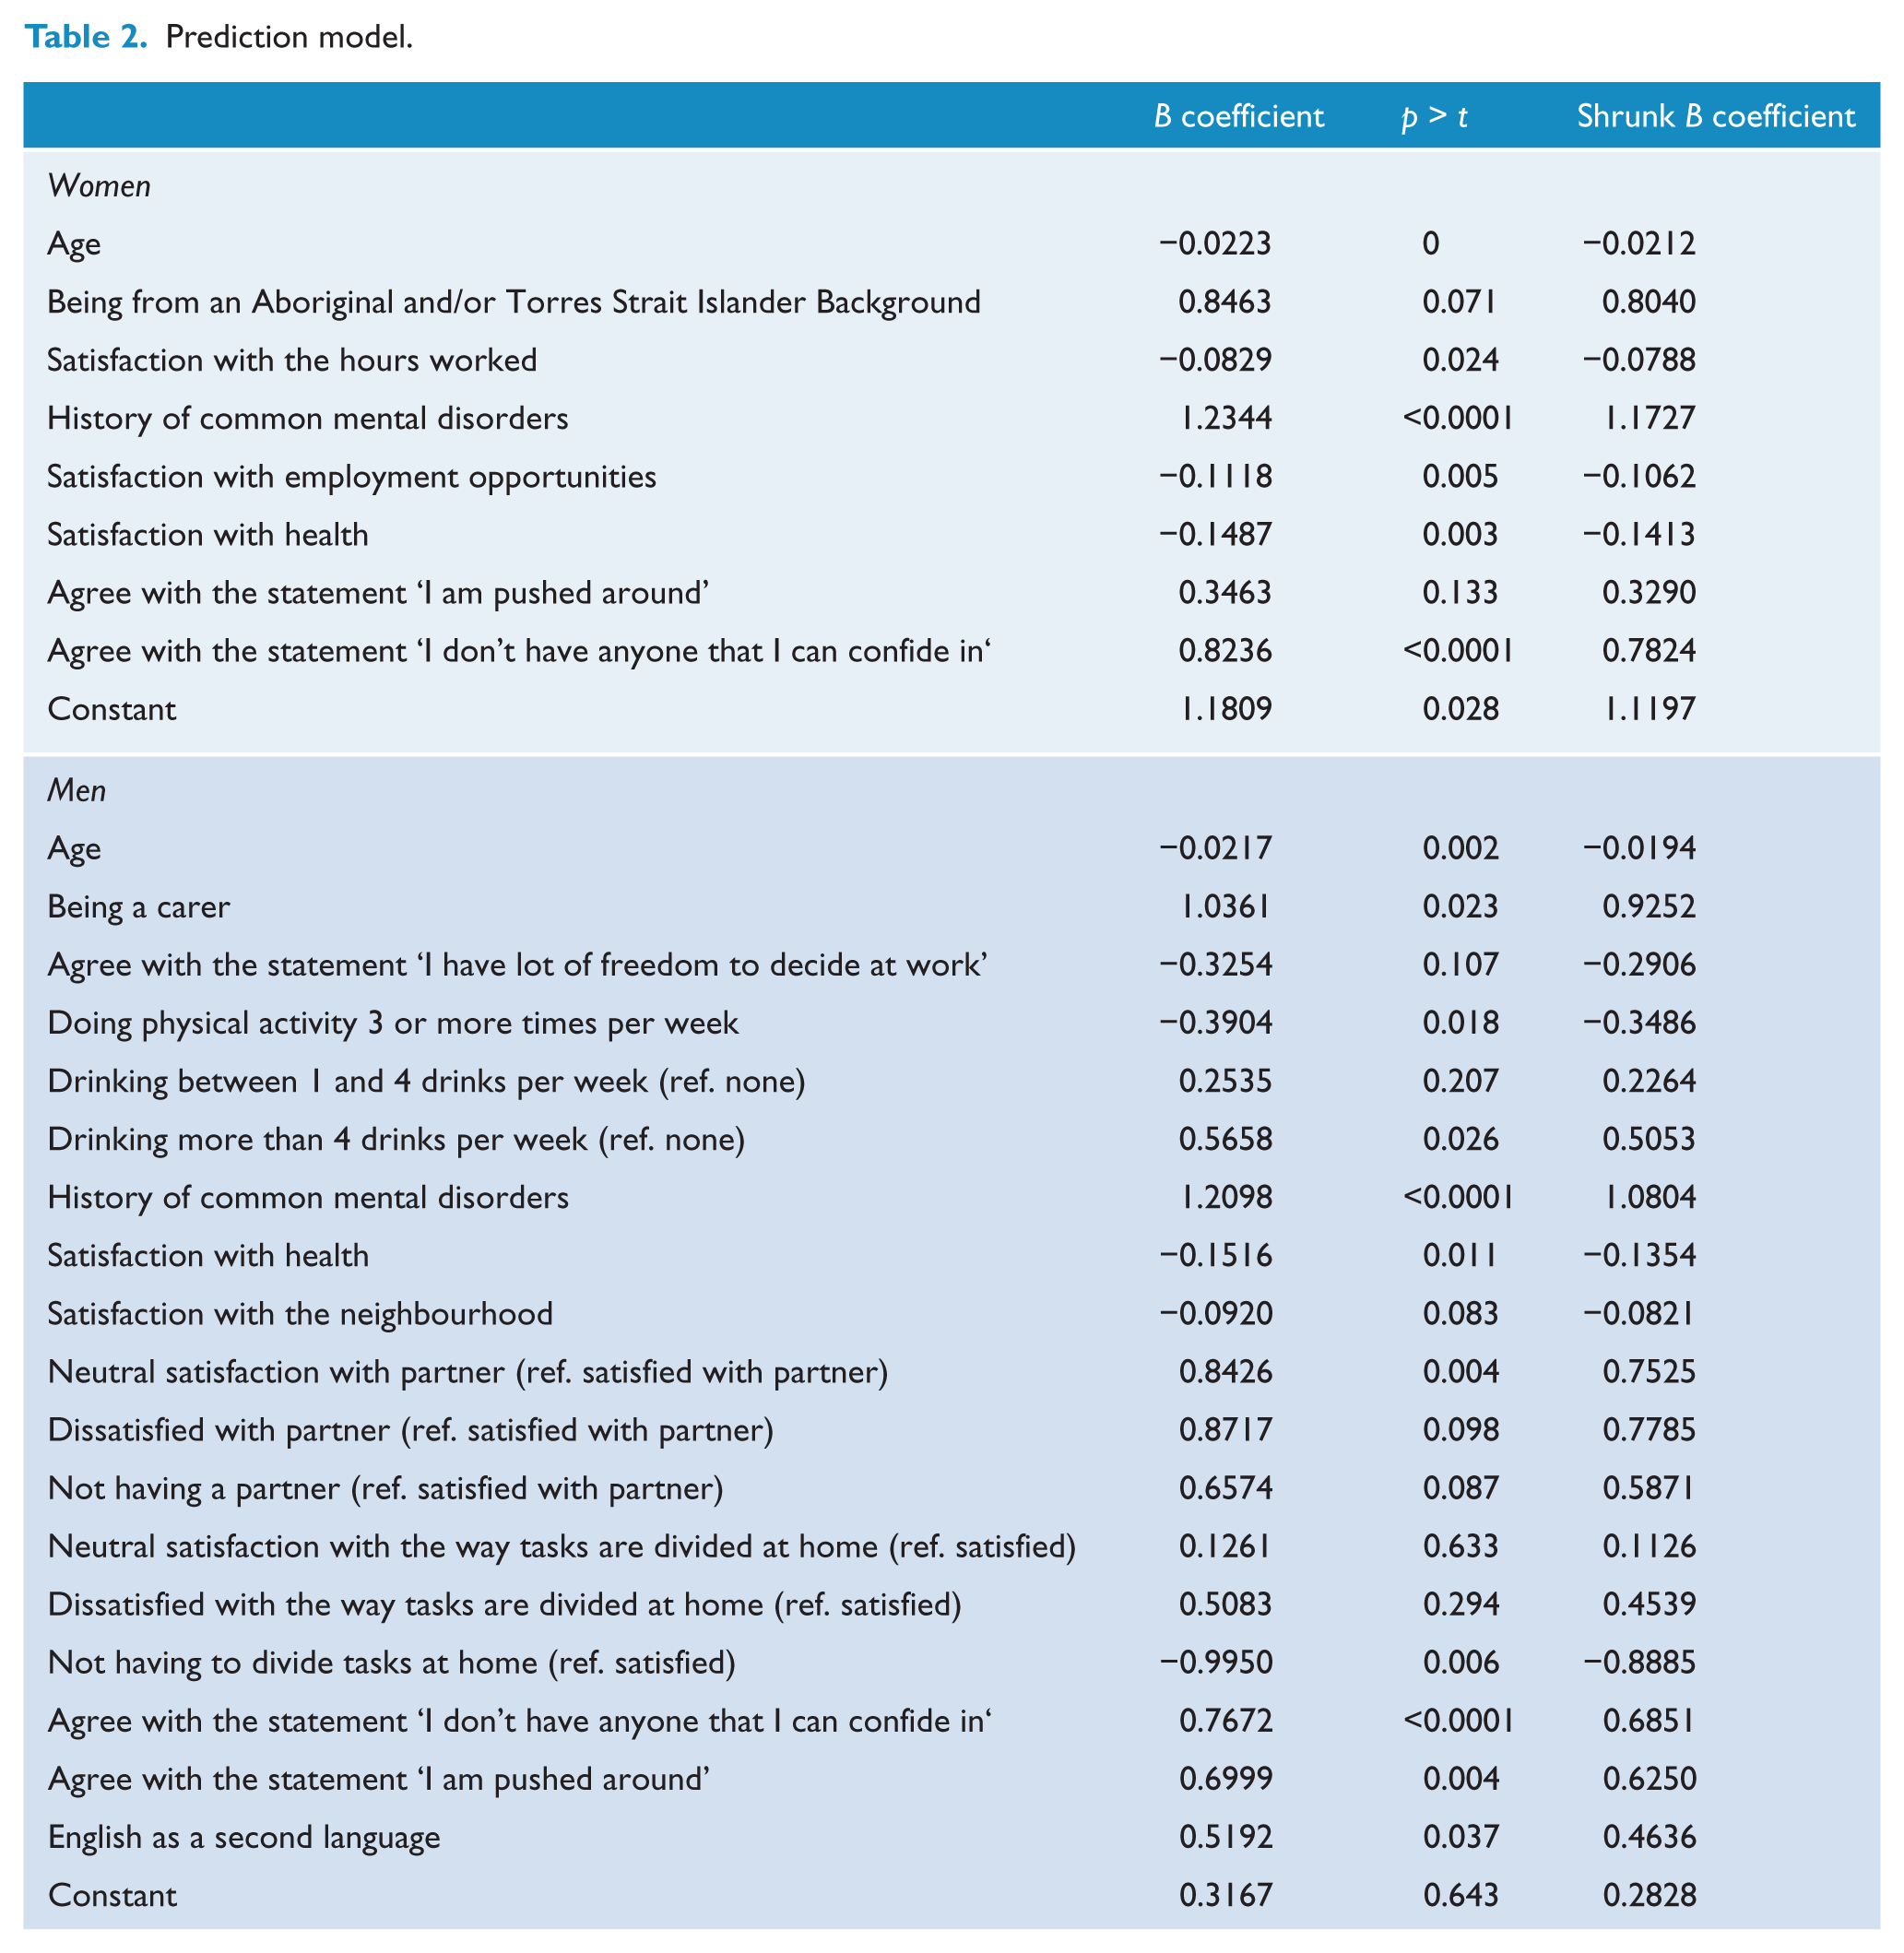
The final prediction model for women included eight variables (Table 2). The C-index (discrimination) and effect size (Hedges’ g, calibration) were 0.73 (95% confidence interval [CI] = [0.72, 0.74] and 0.91 (95% CI = [0.86, 0.96]), respectively. The calibration showed an accurate goodness of fit, except in groups 7 and 8 (Figure 1 in Supplemental File 1). The predicted probability cut-point of 14.26% was associated with the greatest Youden’s J statistic which had limited sensitivity (62.7%) but greater specificity (74.8%) and a positive predictive value (PPV) of 0.28 (see Table 3).
Prediction model.
Specificity and sensitivity values of different cut-offs.
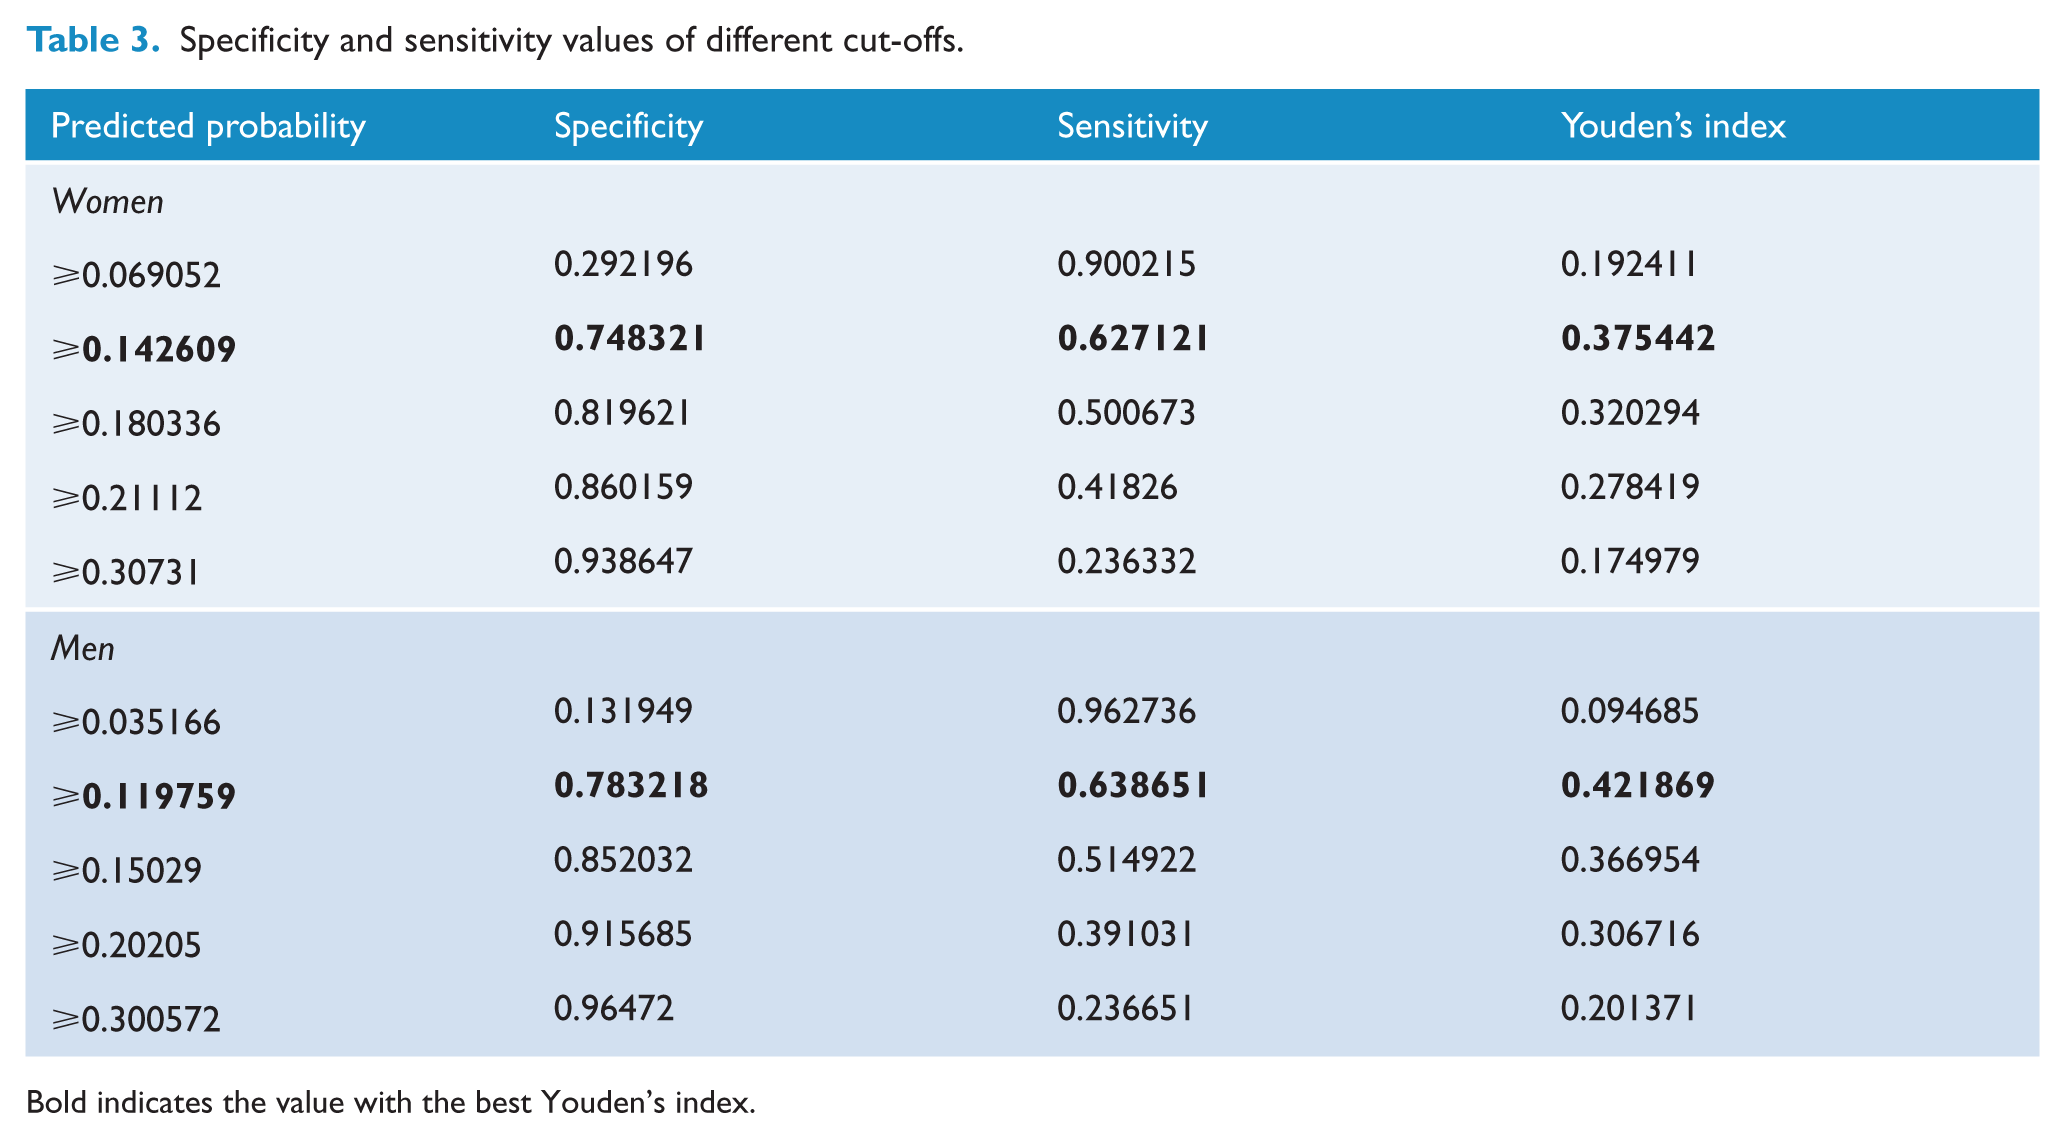
Bold indicates the value with the best Youden’s index.
We evaluated the prediction algorithm developed for women in the validation database using the shrunk regression coefficients. The shrinkage factor was 0.95 (see Table 2). The C-index and effect size (Hedges’ g) were 0.66 (95% CI = [0.64, 0.68]) and 0.64 (95% CI = [0.57, 0.70]), respectively. This suggests that the algorithm did not work as well in the validation database. We visually compared the predicted versus the observed risk of common mental disorders by decile risk groups (Figure 2 in Supplemental File 1). In general, the predicted risk did not agree with the observed risk, except in the highest decile groups 8−10, where accuracy improved.
Men
The final model for men included 13 predictors (Table 2). The C-index and effect size (Hedges’ g) were 0.76 (95% CI = [0.74, 0.77]) and 1.06 (95% CI = [1.01, 1.12]), respectively. In this case, the calibration showed a good fit, with almost perfect agreement in all groups except decile 9 (Figure 3 in Supplemental File 1). The predicted probability with the greatest Youden’s J statistic was 11.99%, which again had limited sensitivity (63.87%), good specificity (78.32%), and a PPV of 0.26 (see Table 3).
The shrinkage factor in the men’s model was 0.89 (see Table 2). We applied the shrunken coefficients in the validation database: the C-index was 0.73 (95% CI = [0.72, 0.75]) and Hedges’ g was 1.04 (95% CI = [0.97, 1.11]). The calibration plot showed limited agreement between the observed and the predicted value in the lowest decile groups, but good agreement in the highest decile groups (Figure 4 in Supplemental File 1).
Scenarios
Table 4 shows some examples of the varieties of participants scoring at increasing levels of predicted probability of common mental disorders on the score algorithm and the impact on predicted risk by changing mutable factors.
Examples.
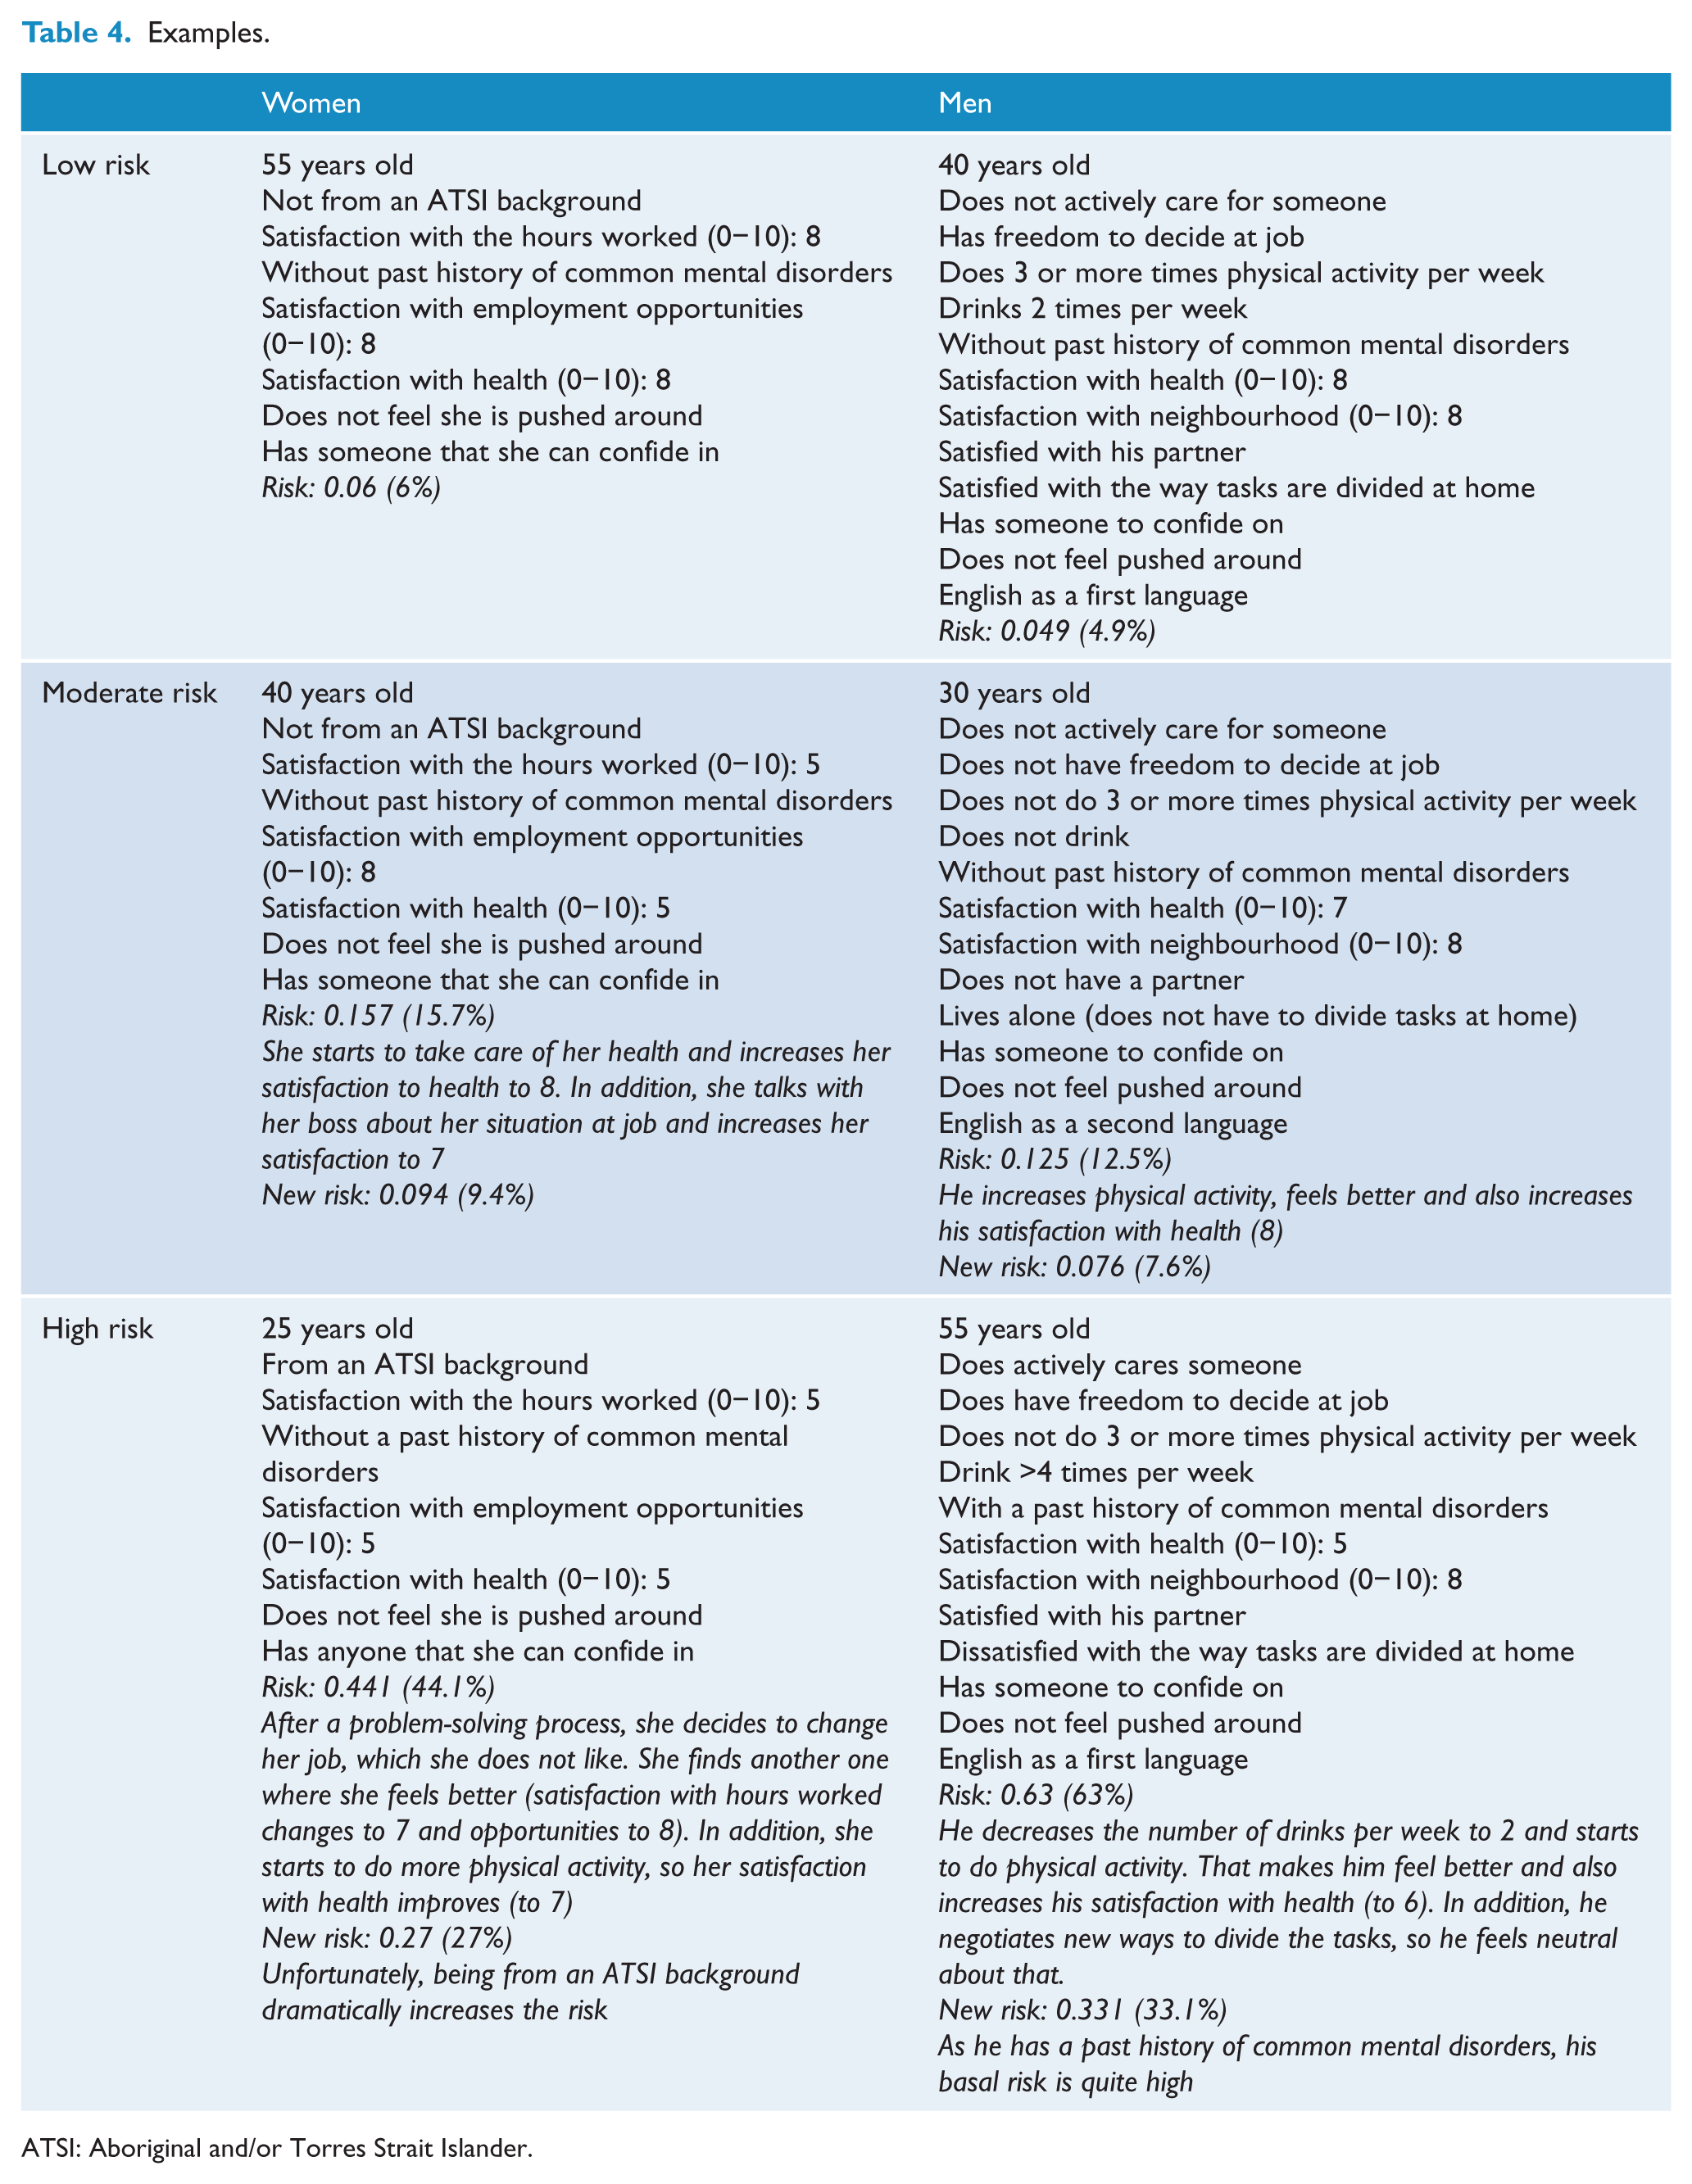
ATSI: Aboriginal and/or Torres Strait Islander.
Discussion
To the best of our knowledge this is the first prediction algorithm for the onset of common mental disorders developed specifically for a working population. The prediction algorithm developed for men had an adequate performance in both the training and the validation samples. In contrast, the model developed in women, although showing relatively fair indices in the training database, did not work well in the validation database. Despite this, the C-statistic is similar to well-known, widely used and, in some cases, health service mandated cardiovascular algorithms such as Framingham and SCORE, which have reported C-statistics from validation databases ranging from 0.57 to 0.91 (Damen et al., 2016). The PPVs at risks with the best Youden’s indices (those set at risk values of 0.14 for women and 0.11 for men) were also equal to the PPVs derived for the cardiovascular risks of 20% or more using the Framingham Index for cardiovascular disease (Artigao-Rodenas et al., 2013).
While the algorithms classified those with higher risk well, which is the main aim of such models, they had some problems adequately classifying those with lower risk. In other words, the algorithms had better specificity than sensitivity. This may be useful for ruling in, as a positive result when the specificity is high signifies a high probability of developing a common mental disorder (for instance, scores >0.20, where specificity is more than 0.85 in women and 0.90 in men). However, following this same cut-off, a score <0.20 would not rule out the possibility that the person would develop a common mental disorder. In any case, as these algorithms are intended to be used in non-clinical settings, such as the workplace, we have preferred to minimise the false-positives. In practical terms, however, the use of such algorithms allows three approaches. By providing an individual with their modifiable risks, this may empower them to promote behavioural change. If the overall risk level is high, this person may be more motivated if the risk is communicated effectively as the high specificity of our algorithm suggests it is highly probable that the person would develop a common mental disorder. Identification of higher risk individuals could enable targeting of individual/group secondary prevention interventions, for which a range of interventions, such as cognitive behavioural therapy–based stress management, appear to be effective (Joyce et al., 2016). Given there will false-negatives and false-positives, particularly in females, organisations can use the estimations of the proportion of their workforce with a risk profile in aggregated ways to determine how to allocate resources to more universal or targeted approaches.
We found that age, the presence of a common mental disorder in the past 2 years, satisfaction with health, not having someone to confide in and feeling ‘pushed around’ in life were common predictors of the onset common mental disorder among both women and men. Health and social support have been consistently linked with better mental health in numerous studies. The strong predictor of being ‘pushed around’ would seem to be a good proxy for either experiences of discrimination (a strong risk factor in Predict (King et al., 2008)) or for the degree of autonomy one has in life generally, the latter linked to aspects often termed ‘resilience’ at work (Weinstein and Ryan, 2011). However, men and women differed in several factors: health-related habits such as higher alcohol intake (risk) and greater frequency of physical activity (protective) were significant for men but not for women. Similarly, and somewhat surprisingly, being a carer of someone, satisfaction with one’s partner and the way that tasks are divided at home were factors associated with the onset of common mental disorders in men, but not in women. These factors seem to be contrary to expectations but may relate to changes in traditional/stereotypical roles. Alternatively, it may be that such situations are still expected for women, but not for men, making their presence more of a risk among men as they impose a role beyond the archetypal norms. Different psychosocial work risks also affected men and women: While for men having freedom to decide what to do at work, but not, for example, hours worked, appeared an important factor, women dissatisfied with the number of hours worked and the employment opportunities were at greater risk. Finally, English as a second language was a risk factor in men. Although being from an ATSI background was only found to be a risk factor for women, we did not have enough variability in the sample to introduce this variable in the equation, so we are not sure about the overall impact. People from an ATSI background report a higher prevalence of common mental disorder than other Australians, which can be a reflection of the cultural disruption experimented by Aboriginal societies (Parker, 2010), so this factor needs to be addressed in future projects.
The risk factors identified in this study of working individuals are somewhat different from those previously identified in studies of other adult populations. In the algorithms developed from the Predict study in European primary care (Bellon et al., 2011; King et al., 2008; Moreno-Peral et al., 2014) and from the Canadian National Population Health Service (NPHS) (Wang et al., 2014), age, past history of common mental disorders and satisfaction with health were also important. In the Predict study, education was an important predictor for both the onset of depression and anxiety, while in our study it was not. Wang et al., however, did not include education in their model. Surprisingly, neither our study nor the Predict study found life events to be an important enough predictor of common mental disorders to be included in the final algorithms. However, in the NPHS, a major financial crisis and changing a job for a worse one were important predictors for women, while being physically attacked and a partner having an unwanted pregnancy were for men. The major differences between this study and previous risk algorithms developed were our ability to assess the impact of a wide range of job-related predictors, which have been consistently identified as significant risks for common mental disorder (Harvey et al., 2017; Stansfeld and Candy, 2006) and that our sample were all employed. This may account for some differences, as low education and negative life events are more common in those not working. Having different risk factors appears not to be the exception, but the rule, when developing prediction models even in other areas such as cardiovascular health and diabetes (Damen et al., 2016).
Limitations
This study has several limitations. First, we performed a secondary analysis of a study that did not aim to develop a prediction algorithm for the onset of common mental disorders, so not all the predictors suggested by the literature were available. For example, we did not have good measures of discrimination or personality factors, although some measures, as identified above, might be seen as proxies. In addition, our dependent measure, common mental disorder, was derived from the SF-36 MCS, which is not a disease-specific assessment or a screener specifically developed to screen for mental disorders. However, it has shown good psychometric properties in ascertaining common mental disorders in the Australian population (Gill et al., 2007) and may be more applicable to population health than clinically derived measures. Conversely, secondary analysis of available databases is an efficient way of generating new evidence and alleviates the potential response bias inherent in specific studies. Second, data about the potential predictors were collected by means of self-report and therefore are highly subjective. Nevertheless, how people feel and perceive reality is core to the development of common mental disorders, such as anxiety and depression, and has, in the case of work-related factors, been shown to be more relevant than objective measures (Glozier et al., 2010). Third, there were a number of participants lost to follow-up. Although we have imputed all the missing values for any predictor, we elected not to impute the dependent variable. The relative poor performance of the algorithm in the lowest and medium risk groups in the external validation may be related to the fact that in our study, those lost to follow-up were, indeed, those who were healthier at baseline.
Implications
The predicted probability of one person developing common mental disorders can be calculated from the equations in Table 2, using the constant and the shrunk coefficients. However, this is complicated to do unless automated. One option for implementation would be to embed the risk algorithm for the onset of common mental disorders in employed people, together with recommendations according to the different level and profile of risk, into a personal eHealth or decision support tool platforms, much as with clinical desktop tools for cardiovascular disease risk. This could empower people to implement behavioural change to reduce their risk, by addressing modifiable factors, without fear of being stigmatised or need for help seeking, similar to some on-line self-help strategies to prevent depression (Buntrock et al., 2016; Sander et al., 2016). A decision support tool could be used by occupational health or organisational professionals in order to know more about the level and profile of risk for common mental disorders of their clients, giving them the opportunity to target selective preventive strategies. Indeed, a prevention strategy based on a similar risk algorithm has recently shown to be effective to reduce the incidence of major depression episodes in primary care attendees (Bellon et al., 2016). It is hoped that the risk algorithm presented in this paper could be used as the basis for similar interventions in the workplace. This approach based on the individual risk, however, needs to be combined with universal measures that target the social determinants of mental health, such as workplace culture. De-identified aggregate risk data may also be useful to employers in considering whether and how they address the challenges of enabling a mentally healthy workplace.
These are the first prediction algorithms for the onset of common mental disorders in Australia and the first, worldwide, specific for workers. Further studies are needed to refine these algorithms (especially for women) and to evaluate their usefulness for workplace-based prevention initiatives. These potential different uses, by workers seeking to take more control over their risk, occupational health professionals, or organisations, raise ethical and privacy challenges that we are addressing in current implementation studies.
Footnotes
Acknowledgements
The authors acknowledge and thank the data custodians and participants of the HILDA study. They are also grateful to Prof. Michael King, Prof. Irwin Nazareth and Prof. Juan Bellón for their useful recommendations during the planning of the statistical analysis. Research material can be accessed by contacting any of the corresponding authors.
Declaration of Conflicting Interests
The author(s) declared no potential conflicts of interest with respect to the research, authorship and/or publication of this article.
Ethical approval
The authors assert that all procedures contributing to this work comply with the ethical standards of the relevant national and institutional committees on human experimentation and with the Helsinki Declaration of 1975, as revised in 2008.
Funding
The author(s) disclosed receipt of the following financial support for the research, authorship, and/or publication of this article: This project was developed in partnership with beyondblue with donations from the Movember Foundation.
References
Supplementary Material
Please find the following supplemental material available below.
For Open Access articles published under a Creative Commons License, all supplemental material carries the same license as the article it is associated with.
For non-Open Access articles published, all supplemental material carries a non-exclusive license, and permission requests for re-use of supplemental material or any part of supplemental material shall be sent directly to the copyright owner as specified in the copyright notice associated with the article.