
Abstract
Objective:
Structural and functional brain alterations in major depression disorder (MDD) are well studied in cross-sectional designs, but little is known about the causality between onset and course of depression on the one hand, and neurobiological changes over time on the other. To explore the direction of causality, longitudinal studies with a long time window (preferably years) are needed, but only few have been undertaken so far. This article reviews all prospective neuroimaging studies in MDD patients currently available and provides a critical discussion of methodological challenges involved in the investigation of the causal relationship between brain alterations and the course of MDD.
Method:
We conducted a systematic review of studies published before September 2015, to identify structural magnetic resonance imaging (MRI) studies that assess the relation between neuronal alterations and MDD in longitudinal (⩾1 year) designs.
Results:
Only 15 studies meeting minimal standards were identified. An analysis of these longitudinal data showed a large heterogeneity between studies regarding design, samples, imaging methods, spatial restrictions and, consequently, results. There was a strong relationship between brain-volume outcomes and the current mood state, whereas longitudinal studies failed to clarify the influence of pre-existing brain changes on depressive outcome.
Conclusion:
So far, available longitudinal studies cannot resolve the causality between the course of depression and neurobiological changes over time. Future studies should combine high methodological standards with large sample sizes. Cooperation in multi-center studies is indispensable to attain sufficient sample sizes, and should allow careful assessment of possible confounders.
Background
With a lifetime prevalence of 16% (Kessler et al., 2003), major depressive disorder (MDD) has been identified as a leading cause of disability worldwide and is considered to become second contributor, after ischemic heart disease, to global burden by the year 2020 (Murray and Lopez, 1997; Whiteford et al., 2013). Despite considerable efforts in understanding the etiology of MDD, there are still many unanswered questions regarding the influences of environment and genetics, and their interaction, on the onset and course of disease. The investigation of neurobiological underpinnings provides an opportunity to understand the interplay between risk factors and the course of MDD.
Among the structural brain changes repeatedly associated with MDD are reduced hippocampal volume (Campbell et al., 2004; McKinnon and Yucel, 2009; MacQueen and Frodl, 2011; Schmaal et al., 2015; Stratmann et al., 2014; Zhao et al., 2014) and gray matter alterations in prefrontal cortical regions, particularly the anterior cingulate cortex (ACC) and medial frontal regions (Bora et al., 2012; Du et al., 2012; Lai, 2013; Redlich et al., 2014). Findings concerning the amygdala have been more inconsistent, with reduced amygdala volume associated with genetic risk factors for depression rather than depression itself (Romanczuk-Seiferth et al., 2014). Functional magnetic resonance imaging (fMRI) repeatedly revealed hyperactivity of the amygdala to negative emotional stimuli (Groenewold et al., 2013; Sheline et al., 2001; Stuhrmann et al., 2013; Suslow et al., 2010), hypoactivity of the nucleus accumbens (Liu et al., 2011; Redlich et al., 2015; Zhang et al., 2013), and alterations in activation of prefrontal areas in depression (Dannlowski et al., 2009; Phillips et al., 2003; Rive et al., 2013). Despite all gathered knowledge on structural and functional brain alterations in MDD, little is known about the causality between onset and course of depression on the one hand, and neurobiological changes over time on the other. This is due in particular to the lack of longitudinal studies in larger, well-characterized samples.
Theories on the relationship between the course of depression and neurobiological changes compete. On the one hand, some researchers argue that brain changes are present before the onset of depression and therefore display a predisposition and trait-factor for the disorder. Support for this notion comes from research on the neurobiological underpinnings of genetic or environmental risk factors for MDD. For instance, brain anatomy, and particularly the volume of stress-sensitive structures such as the hippocampus, was reported to be highly genetically determined (Glahn et al., 2012), with heritability rates estimated as high as 80%. Furthermore, several putative genetic risk variants have been associated with hippocampal structure (e.g. Baune et al., 2012a, 2012b; Dannlowski et al., 2014, 2015). Environmental risk factors, most prominently childhood maltreatment, also appear to alter limbic and prefrontal brain structures in healthy subjects, similar to findings in MDD patients (Dannlowski et al., 2012; Opel et al., 2014; Teicher et al., 2009). If such markers are indeed shaped by genetic and/or early environmental risk factors which are present prior to the onset of the disorder, patients might show such neurostructural aberrations before disease onset, and pre-morbid brain alterations might be a moderating factor between the presence of risk constellations and the onset of depression.
However, others believe that brain changes observed in MDD patients are consequences of depression, and therefore rather represent a state factor. Thus, the neurotoxicity hypothesis states that acute depression initiates neurobiological changes that in turn lead to extended activation of the hypothalamic–pituitary–adrenal (HPA) axis, resulting in prolonged and repeated cortisol release. In consequence, hypercortisolism can lead to decreased neurogenesis, accelerated apoptosis and dendritic retraction in different brain regions (Sapolsky, 1996). These ideas are supported by studies showing that hippocampal atrophy is associated with the time spent in untreated depressive states (Sheline et al., 2003), and that such morphometric markers resolve with antidepressant medication (Arnone et al., 2013) or electroconvulsive therapy (ECT; Dukart et al., 2014; Redlich et al., 2016).
As presented above, there are findings supporting both theories and therefore the relationship of depression and brain alterations seems to be bidirectional. It remains a challenge to assess the respective weight of the factors in favor of a state point of view and those supporting a trait point of view.
Many cross-sectional studies tried to approach this debate, most of these focusing primarily on hippocampal volume changes. Main findings reveal smaller hippocampal volume to be associated with chronic depression (Shah et al., 1998), a longer course of illness (Bell-McGinty et al., 2002), a larger total number of recurrent episodes (Videbech and Ravnkilde, 2004), and an earlier age of depression onset (MacMaster and Kusumakar, 2004). These findings indicate structural changes to be dependent on the course of depression, and therefore provide more support for the state point of view. Inconsistent results come from cross-sectional studies of changes in amygdala volume (Frodl et al., 2002; Sheline et al., 1998). However, cross-sectional studies merely allow speculations about a causal relationship, since only correlative statements can be drawn. In order to explore the directionality of the relationship between depression and brain changes, longitudinal studies are desperately needed, but only few have been conducted so far.
Therefore, the aim of this paper is to systematically review the data on longitudinal brain changes in the course of depression. Based on available research, this review hopes to shed some light into the state-trait debate, by providing a critical discussion about methodological challenges and by indicating future directions associated with the investigation of the causal relationship between brain alterations and the course of MDD.
Methods
We conducted a database search of journal articles published before September 2015 via PubMed and PsychINFO to identify relevant neuroimaging studies focusing on longitudinal data in major depression. A combination of the following search terms was used in both databases: ‘depressive’ OR ‘depression’ AND ‘follow-up’ OR ‘longitudinal’ OR ‘prospective’ OR ‘year’ AND ‘MRI’ OR ‘imaging’. We had a return of 385 and 442 results, respectively. Studies were limited to English language publications. We further examined the reference lists of all studies identified for inclusion to check for potentially useful studies not identified by the search terms.
Studies were included if (1) structural magnetic resonance imaging (MRI) was conducted at minimally two points of time, (2) duration between two scans was minimally 1 year, (3) more than one subject was investigated (no case studies), (4) MDD was diagnosed by instruments based on Diagnostic and Statistical Manual of Mental Disorders (DSM) criteria and (5) no studies on bipolar patients were included. We initially intended to include functional MRI, but found only three studies employing fMRI in longitudinal designs with 1-year duration or more (Heller et al., 2013; Opmeer et al., 2015; Wang et al., 2015). This is why we focused only on studies with structural brain changes.
Results
In total, 15 studies metall criteria and were included in the subsequent review.
Sample characteristics
Table 1 gives an overview about the sample characteristics. The majority of studies were based on small sample sizes of 38 patients or less (n = 11). Only 4 studies comprised large samples of 89 patients or more. All but 4 studies included healthy control (HC) subjects in their longitudinal design. Importantly, most studies (n = 9) investigated older participants (mean age > 59), whereas the remainder included patients with a mean age under 50 (n = 6). The gender distribution in all studies corresponded to the distribution of MDD in the general population, thus, with a higher proportion of women.
Sample characteristics.
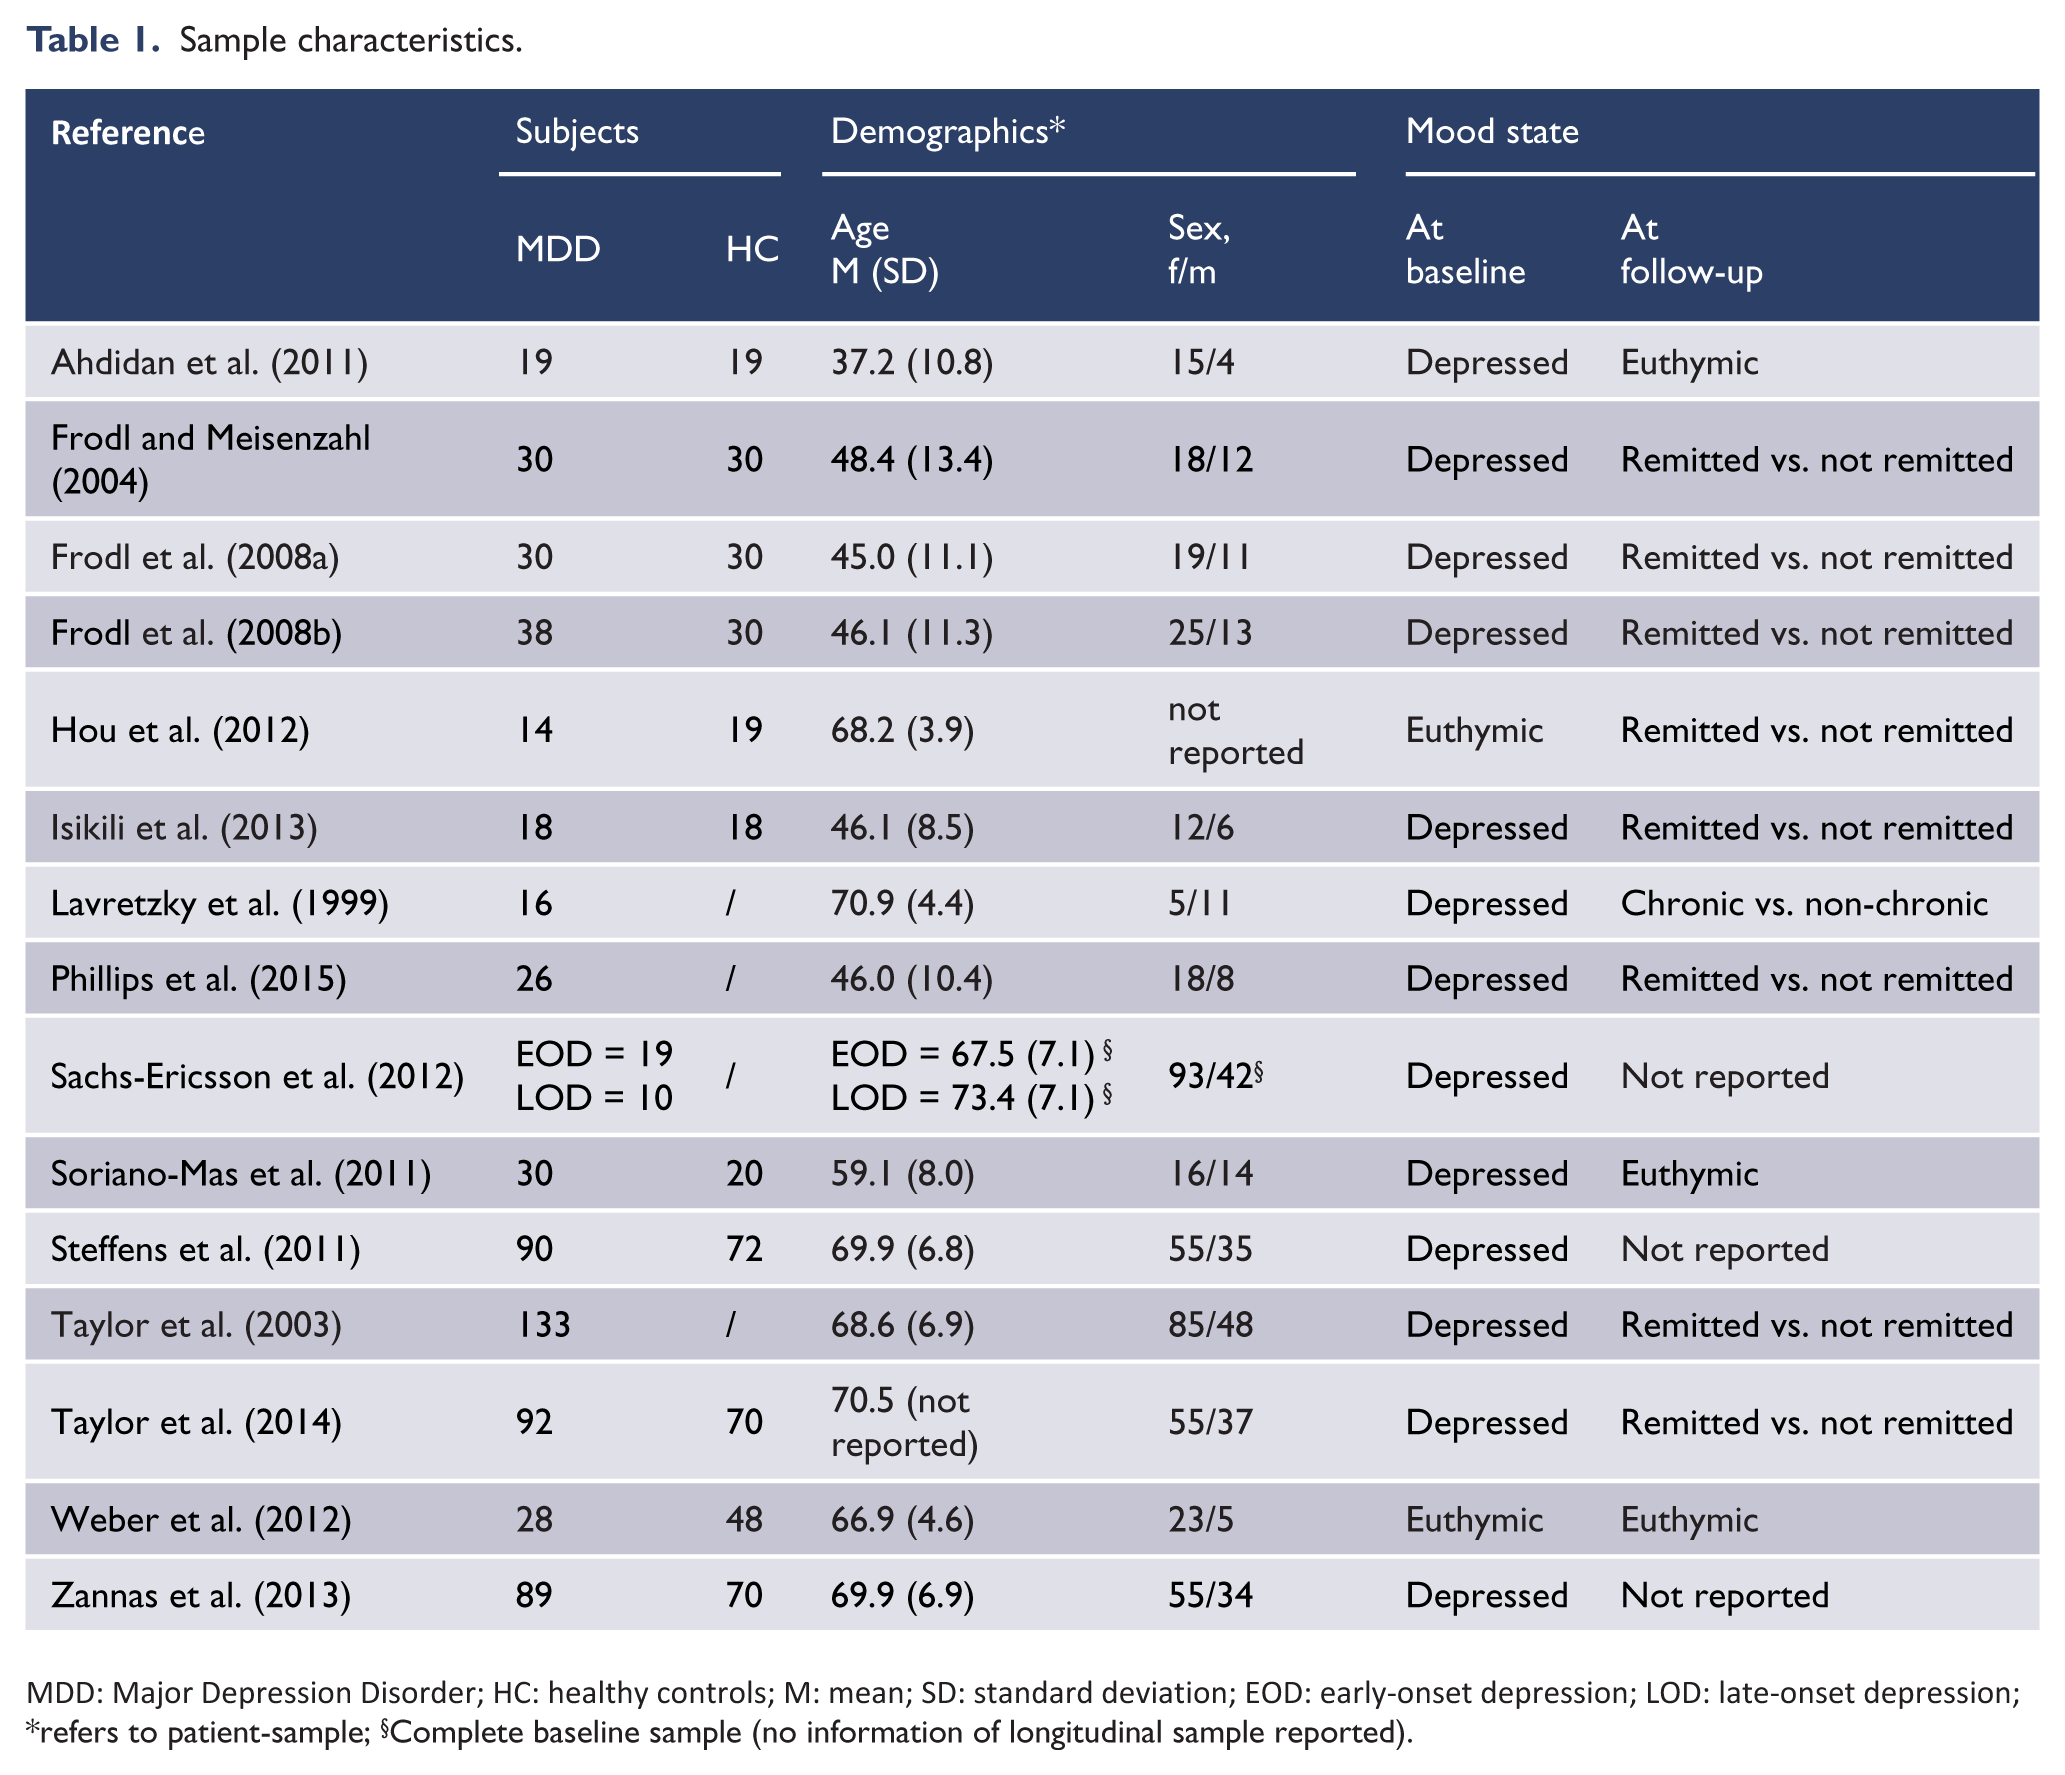
MDD: Major Depression Disorder; HC: healthy controls; M: mean; SD: standard deviation; EOD: early-onset depression; LOD: late-onset depression;
refers to patient-sample;
Complete baseline sample (no information of longitudinal sample reported).
Studies varied regarding the patient’s mood state at baseline and follow-up. Except for two euthymic samples (Hou et al., 2012; Weber et al., 2012), all patient groups were depressed at baseline. Four studies included inpatients only (Ahdidan et al., 2011; Frodl and Meisenzahl, 2004; Frodl et al., 2008a, 2008b); the others recruited outpatients or did not report the source of their samples. More variety is evident at follow-up, with eight studies dividing patients into remitted and non-remitted (Frodl and Meisenzahl, 2004; Frodl et al., 2008a, 2008b; Hou et al., 2012; Isıklı et al., 2013; Phillips et al., 2015; Taylor et al., 2003, 2014), three studies only including remitted patients (Ahdidan et al., 2011; Soriano-Mas et al., 2011; Weber et al., 2012) and three studies that did not assess or report the mood state at follow-up (Sachs-Ericsson et al., 2013; Steffens et al., 2011; Zannas et al., 2013).
Studies differed widely with respect to psychiatric comorbidities. Four studies excluded any comorbid disorder (Isıklı et al., 2013; Soriano-Mas et al., 2011; Taylor et al., 2003, 2014), three only excluded psychotic disorders, bipolar disorder and lifetime substance dependence (Phillips et al., 2015; Sachs-Ericsson et al., 2013; Steffens et al., 2011), while the rest did not report comorbidities.
Assessment instruments
Table 2 gives an overview about the assessment instruments. All patients were diagnosed by instruments that were based on either Diagnostic and Statistical Manual of Mental Disorders, Third Edition (DSM-III) or Diagnostic and Statistical Manual of Mental Disorders, Fourth Edition (DSM-IV) criteria. Most studies used the Structured Clinical Interview for DSM-IV (SCID, n = 8) or the Diagnostic Interview Schedule (DIS, n = 5), whereas two studies did not report the applied method.
Assessment instruments.
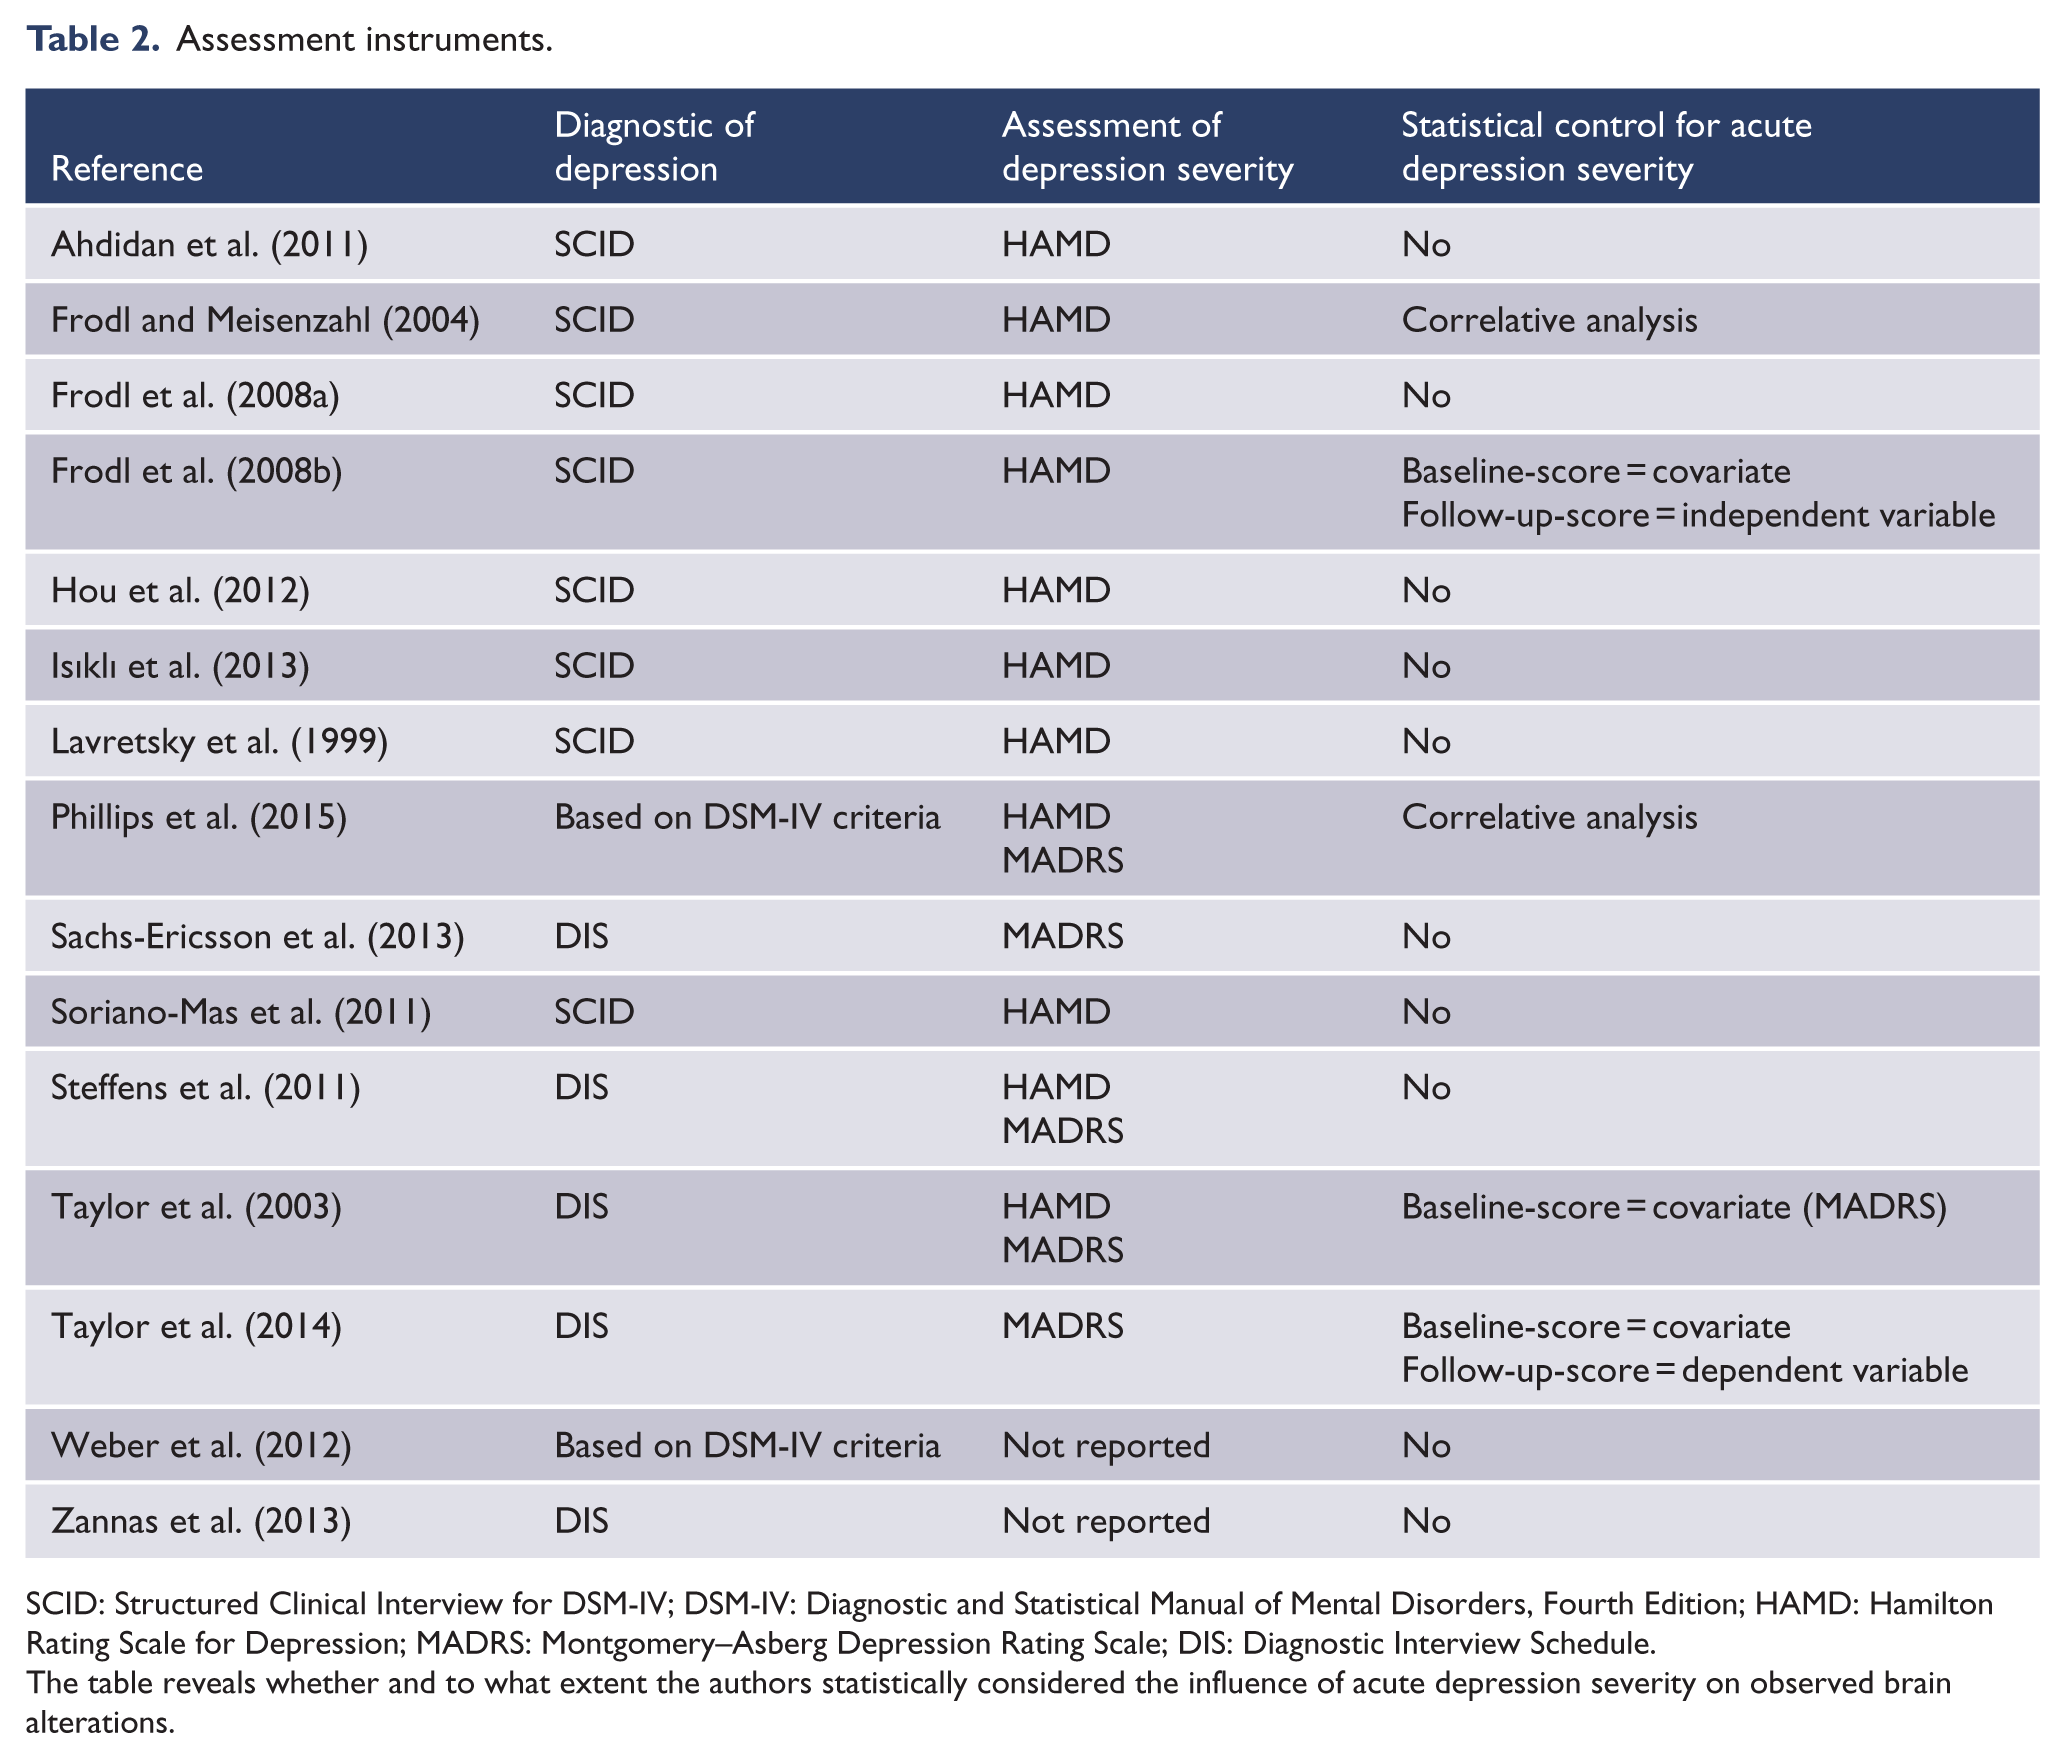
SCID: Structured Clinical Interview for DSM-IV; DSM-IV: Diagnostic and Statistical Manual of Mental Disorders, Fourth Edition; HAMD: Hamilton Rating Scale for Depression; MADRS: Montgomery–Asberg Depression Rating Scale; DIS: Diagnostic Interview Schedule.
The table reveals whether and to what extent the authors statistically considered the influence of acute depression severity on observed brain alterations.
Instruments assessing physical health status, cognitive impairment, life stress, social support, personality, or neuropsychological functioning varied widely. In this review, we only focus on instruments addressing depression. Depression severity was assessed by either the Montgomery–Asberg Depression Rating Scale (MADRS, Montgomery and Asberg, 1979) or the Hamilton Rating Scale for Depression (HAMD, Hamilton, 1960), two commonly used and valid instruments. Only two studies did not capture depression severity at all but rather focused on the investigation of brain changes in relation to personality and cognition (Weber et al., 2012), or to life stress and genetic risk factors (Zannas et al., 2013). It is important to mention that in most cases depression severity was used for diagnostic purposes, providing cut-off scores to evaluate inclusion criteria, or dividing patients into remitted and non-remitted patients at follow-up. Only few studies (n = 3) included the severity score as a dependent or independent variable in the statistical analysis (Frodl et al., 2008b; Taylor et al., 2003, 2014), or at least correlated the severity score with changes in brain regions (Frodl and Meisenzahl, 2004; Phillips et al., 2015).
Assessment of clinical course
Table 3 gives an overview about the assessment of the clinical course. For an evaluation of the relationship of depression and changes in brain regions, it is important to capture the course of disorder during the follow-up interval and the clinical course before baseline assessment, in addition to the mood state at the times of assessment. Among the variables collected in the studies were age of onset of depression, lifetime number of episodes, cumulative duration of illness, number of relapses during follow-up, and time to remission after treatment initiation. The last two variables intend to cover the course during follow-up, but only have been collected in one study (Soriano-Mas et al., 2011). Five studies did not explore any of these variables (Sachs-Ericsson et al., 2013; Steffens et al., 2011; Taylor et al., 2003, 2014; Zannas et al., 2013), two studies record the age of onset, but did not consider this variable any further in the analysis (Hou et al., 2012; Lavretsky et al., 1999), and another two studies only gave a descriptive summary (Soriano-Mas et al., 2011; Weber et al., 2012). Two studies investigated differences in these variables between patients who remitted at follow-up and patients that failed to achieve remission (Frodl et al., 2008b; Phillips et al., 2015). Other strategies for taking these clinical variables into account were correlative investigations between the course of disorder and changes in brain volume (Ahdidan et al., 2011; Frodl and Meisenzahl, 2004; Frodl et al., 2008a), or, in one study, an analysis of covariance to investigate the influence of age at onset of depression and duration of illness on hippocampal volume changes (Isıklı et al., 2013).
Assessment of clinical course and treatment of depression.
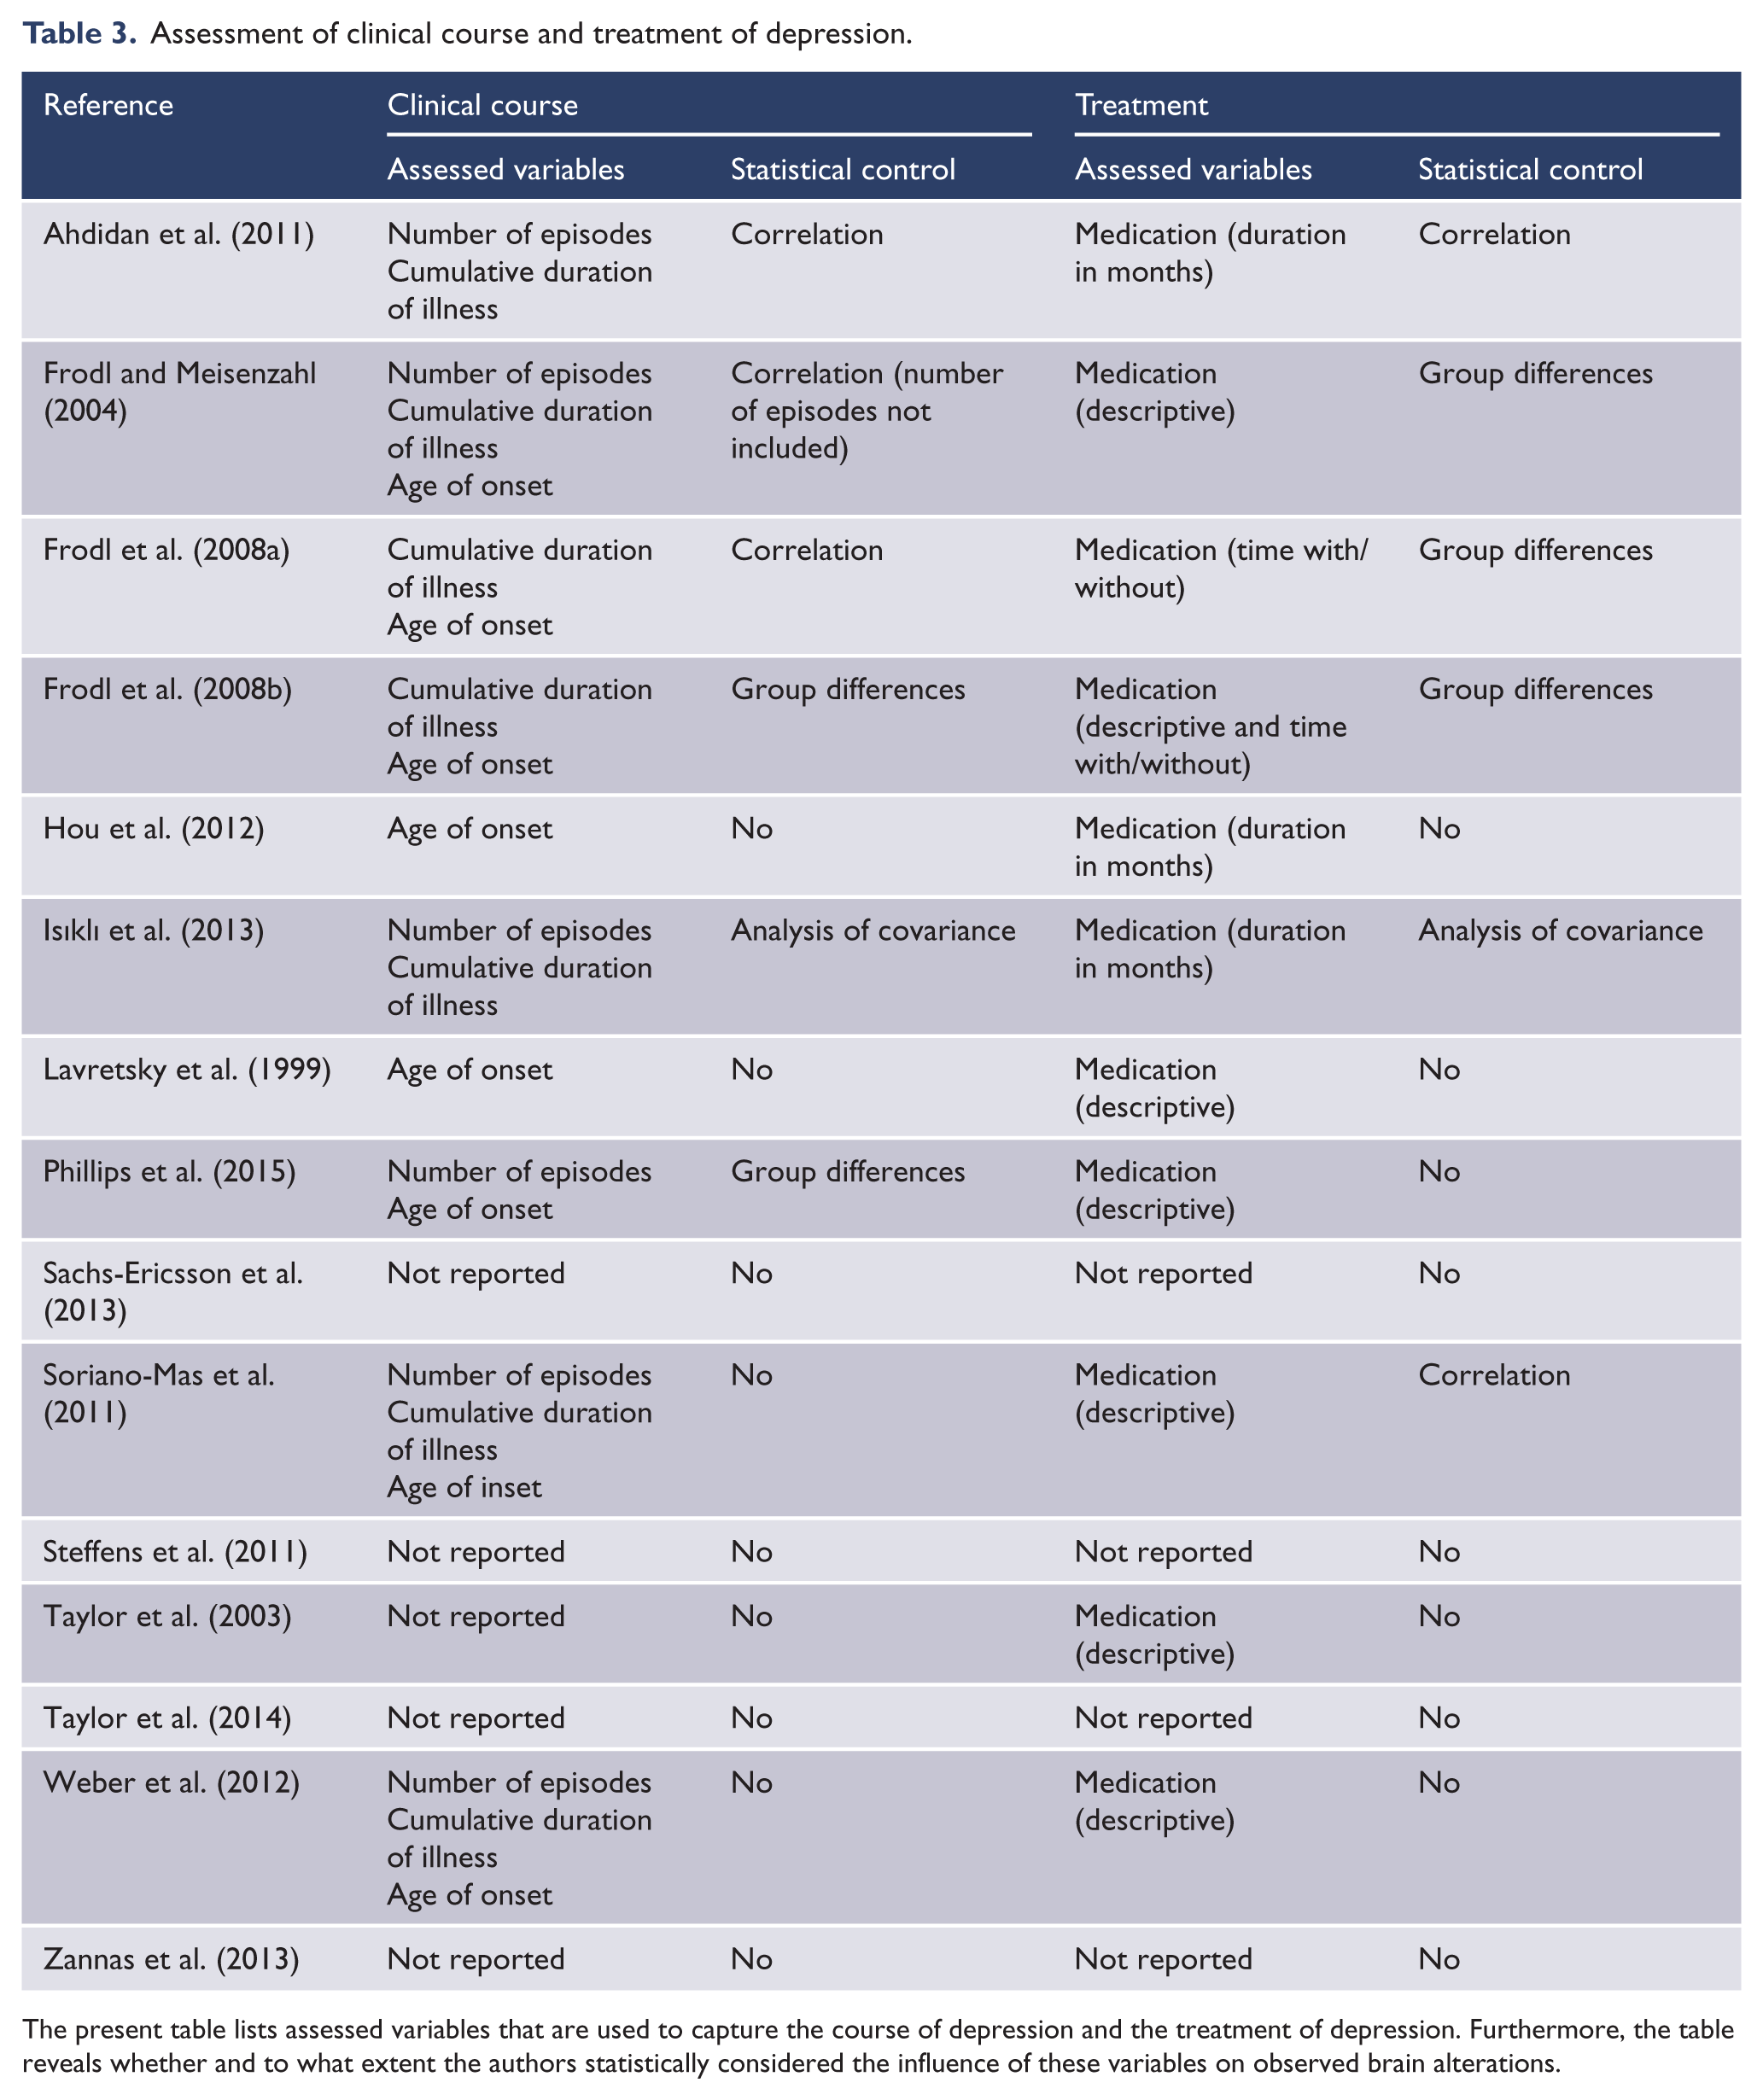
The present table lists assessed variables that are used to capture the course of depression and the treatment of depression. Furthermore, the table reveals whether and to what extent the authors statistically considered the influence of these variables on observed brain alterations.
Moreover, it is important to control for treatment-related effects on brain changes from psychotropic drug treatment, psychotherapy, ECT or other forms of treatment. One study included patients that received ECT during follow-up but did not consider this for their analysis (Ahdidan et al., 2011). The majority did not report ECT and five studies defined ECT explicitly as exclusion criterion (Frodl and Meisenzahl, 2004; Frodl et al., 2008a, 2008b; Hou et al., 2012; Phillips et al., 2015). Notably, not even a single study provided any information regarding psychotherapy. Nine studies carefully documented the distribution of medication in the patient groups, but did not include this in their analysis (Hou et al., 2012; Lavretsky et al., 1999; Phillips et al., 2015; Sachs-Ericsson et al., 2013; Soriano-Mas et al., 2011; Steffens et al., 2011; Taylor et al., 2014; Weber et al., 2012; Zannas et al., 2013), thus providing no information concerning their influence on brain changes. Some studies (Frodl and Meisenzahl, 2004; Frodl et al., 2008a, 2008b; Taylor et al., 2003) investigated whether patients who were remitted at follow-up differed from non-remitted patients, and thus indirectly examined whether brain changes between these groups could be due to group differences in medication treatment. Two studies assessed the correlation between the time under treatment and brain changes (Ahdidan et al., 2011; Soriano-Mas et al., 2011). One study conducted an analysis of covariance to investigate the effect of treatment duration with antidepressants on volume changes (Isıklı et al., 2013). None of the studies considered the doses of medication.
To summarize, variables characterizing the course of depression before baseline or between imaging sessions were only available in a fraction of the selected studies and these variables were poorly investigated in the context of structural brain changes. Regarding treatment factors, while some information regarding medication was available, the included studies widely failed to provide a thorough assessment of antidepressant treatment and to associate treatment variables with structural brain changes over time. Thus, the role of treatment-related factors was massively neglected in currently available longitudinal MRI studies in depression, and information regarding psychotherapy was missing completely.
MRI procedures
It is important to evaluate methodological aspects regarding MRI data acquisition (see Table 4 for an overview). One obvious problem arises from the use of (partially) different scanners at baseline and follow-up (Ahdidan et al., 2011; Phillips et al., 2015; Sachs-Ericsson et al., 2013; Taylor et al., 2003), providing clear methodological challenges to the interpretability of follow-up data. Moreover, most studies were implemented on 1.5-Tesla scanners, with only one study conducted with a 3-Tesla scanner. Segmentation strategies varied largely between the studies. Most studies used (semi-)automatic segmentation approaches (n = 6). In case of manual segmentation (n = 5), most often two raters were used to assess inter-rater and intra-rater reliability. Only five studies used voxel-based approaches, three studies used voxel-based morphometry (VBM) and two tensor-based morphometry (TBM).
MRI procedures.
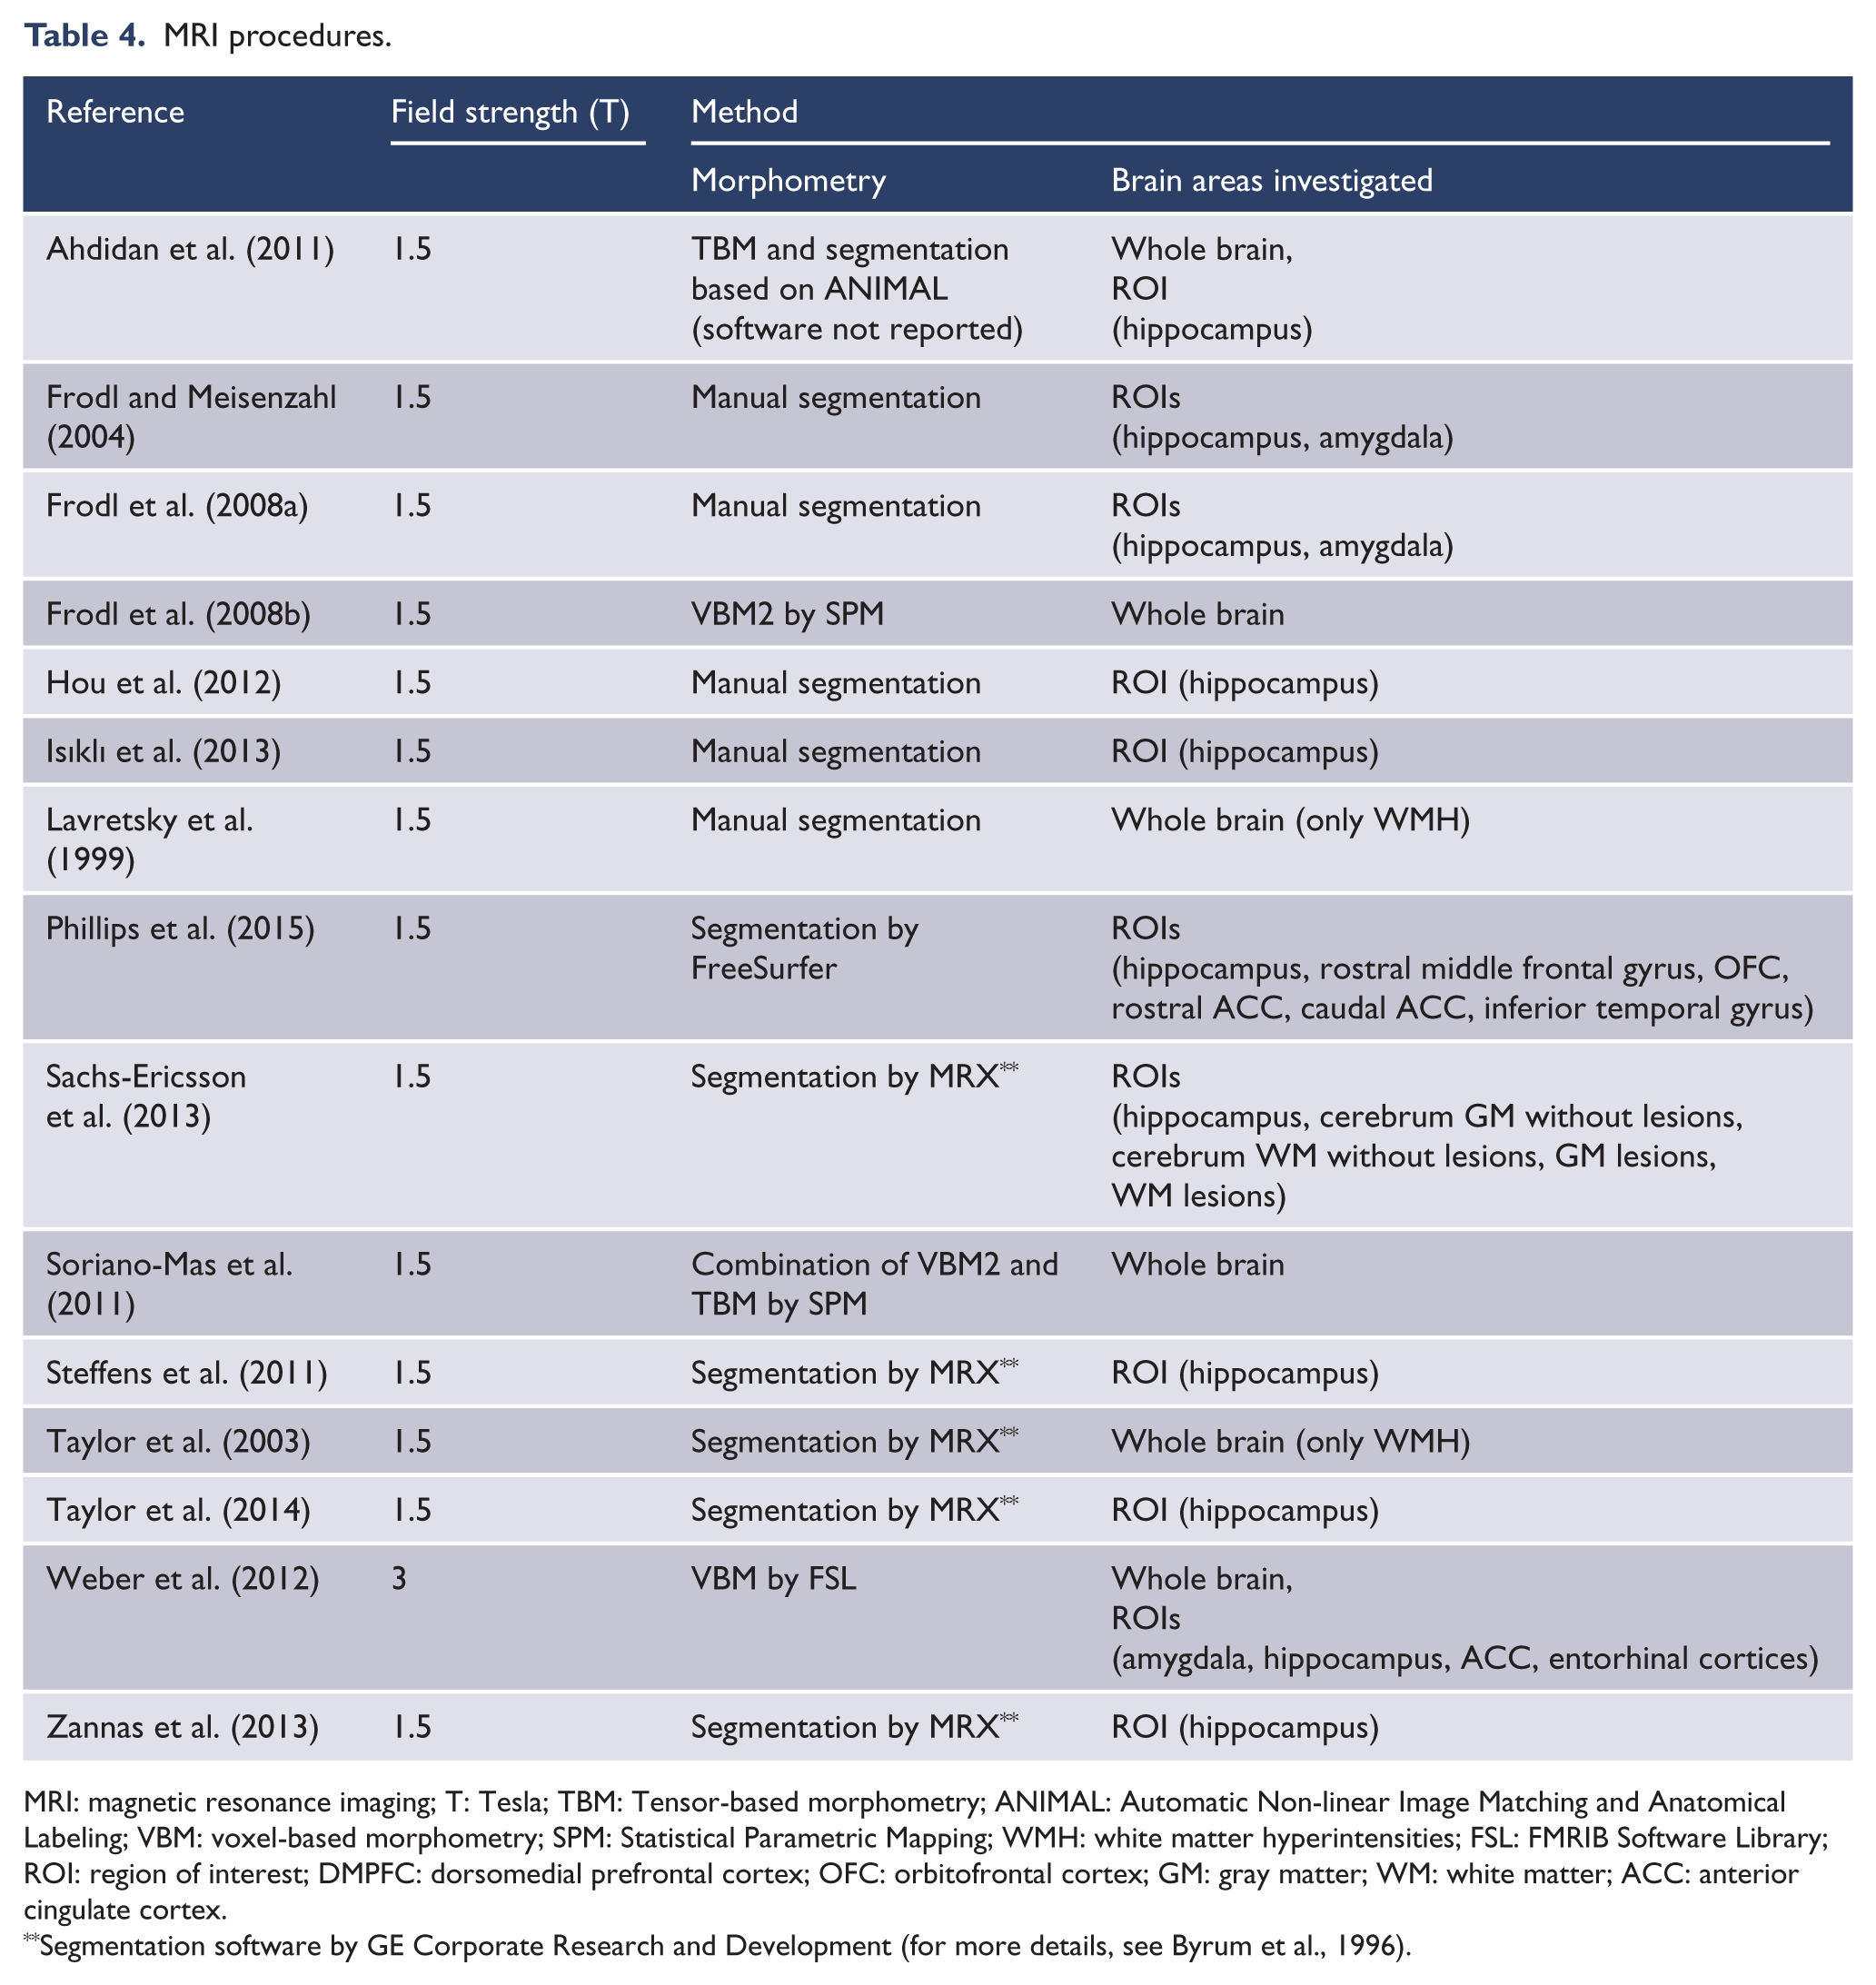
MRI: magnetic resonance imaging; T: Tesla; TBM: Tensor-based morphometry; ANIMAL: Automatic Non-linear Image Matching and Anatomical Labeling; VBM: voxel-based morphometry; SPM: Statistical Parametric Mapping; WMH: white matter hyperintensities; FSL: FMRIB Software Library; ROI: region of interest; DMPFC: dorsomedial prefrontal cortex; OFC: orbitofrontal cortex; GM: gray matter; WM: white matter; ACC: anterior cingulate cortex.
Segmentation software by GE Corporate Research and Development (for more details, see Byrum et al., 1996).
Most studies used a-priori regions of interest, mainly because segmentation algorithms only included a fixed set of structures instead of all available anatomical data from the structural scans. The most frequently investigated structure was the hippocampus (n = 12), followed by whole-brain approaches (n = 6), the amygdala (n = 3) and the ACC (n = 2).
Main findings
As expected from the heterogeneity of sample characteristics, study designs, MRI and clinical assessment methods, the reported findings diverge massively according to study goal, investigated regions, and type of analyses conducted. Table 5 gives detailed report about the main results of each study. The majority of studies (n = 8) focused on brain changes over time and distinguished between remitted and non-remitted patients at follow-up (Frodl and Meisenzahl, 2004; Frodl et al., 2008a, 2008b; Hou et al., 2012; Isıklı et al., 2013; Phillips et al., 2015; Taylor et al., 2003, 2014). Most of these (n = 6) found stronger brain alterations in non-remitted compared to remitted patients. More precisely, two studies revealed normalized brain regions (primarily hippocampus, cortical thickness in the rostral middle frontal gyrus, orbitofrontal cortex [OFC], inferior temporal gyrus) after remission (Hou et al., 2012; Phillips et al., 2015) and four studies found brain changes to be less progressed (hippocampus, anterior cingulum, dorsomedial prefrontal cortex [DMPFC], dorsolateral prefrontal cortex [DLPFC], white matter hyperintensities [WMH]) in remitted subgroups (Frodl et al., 2008b; Isıklı et al., 2013; Taylor et al., 2003, 2014). The most prominent finding was less decline in hippocampal volume (n = 5) in remitter, while alterations in other brain regions (rostral middle frontal gyrus, OFC, inferior temporal gyrus, ACC, DMPFC, DLPFC) were observed only once (Frodl et al., 2008b; Phillips et al., 2015).
Main findings.
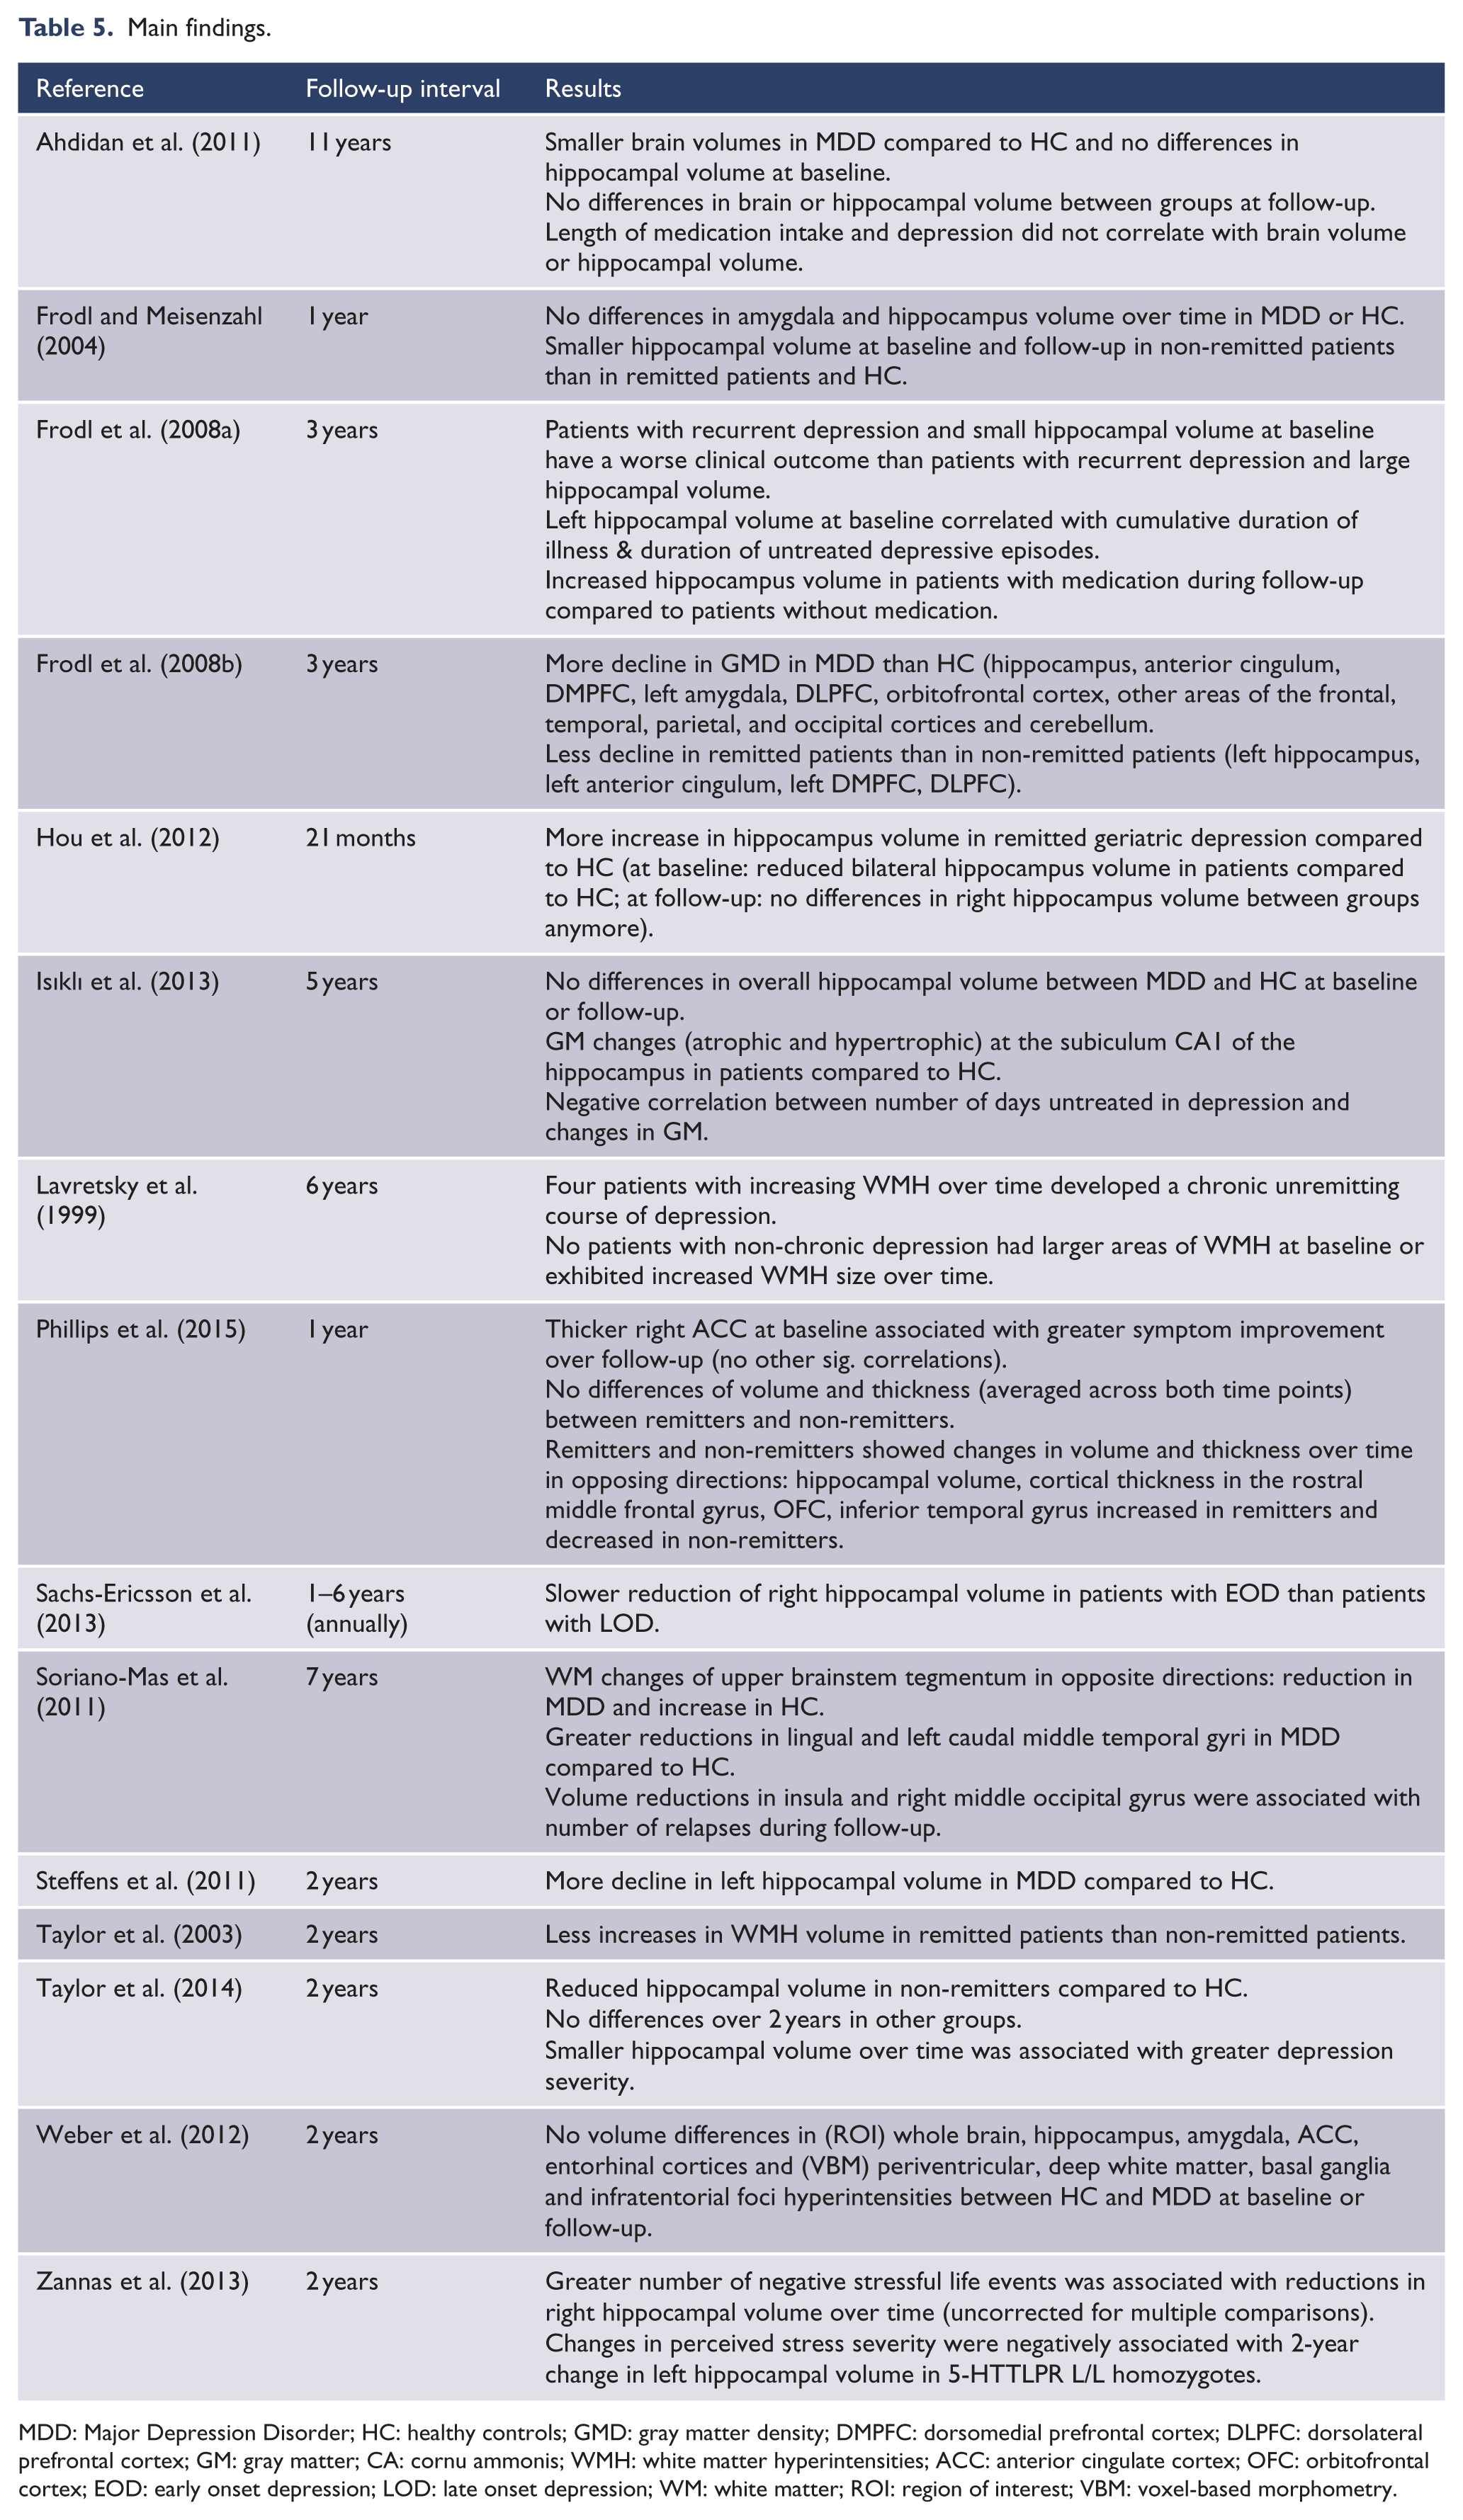
MDD: Major Depression Disorder; HC: healthy controls; GMD: gray matter density; DMPFC: dorsomedial prefrontal cortex; DLPFC: dorsolateral prefrontal cortex; GM: gray matter; CA: cornu ammonis; WMH: white matter hyperintensities; ACC: anterior cingulate cortex; OFC: orbitofrontal cortex; EOD: early onset depression; LOD: late onset depression; WM: white matter; ROI: region of interest; VBM: voxel-based morphometry.
Additional support for the idea that brain alterations depend on mood state comes from studies that included only remitted patients at follow-up. Some observed that reduced brain volumes in MDD at baseline had disappeared at follow-up (Ahdidan et al., 2011); others found that larger volume reductions were associated with the number of relapses during follow-up, and thus with more time spent in a depressive mood state (Soriano-Mas et al., 2011). One study found that hippocampus volume at baseline predicted the outcome at follow-up (Frodl and Meisenzahl, 2004). In that case, non-remitter showed smaller hippocampal volume at baseline than remitter, which could not be explained by differences in age at depression onset or duration of illness. Two studies reported the same tendency, but pointed out that differences at baseline assessment might be due to a longer duration of depression before baseline (Frodl et al., 2008a), or found further progression of volume reductions during follow-up in non-remitter compared to remitter (Lavretsky et al., 1999). One study detected reductions in the left hippocampus after 2 years in previously depressed patients, but did not control for clinical variables (Steffens et al., 2011).
Finally, three studies did not inform about brain alterations in relation to depressive state. One study found no differences between MDD and HCs neither at baseline nor at follow-up (Weber et al., 2012). Another study discovered reductions in the right hippocampal volume in association with perceived stress, but only in a specific genotype group (Zannas et al., 2013). Sachs-Ericsson et al. (2013) focused on differences in hippocampal volume reductions between early onset depression and late onset depression, and found a slower reduction in early onset than in late onset patients.
A differentiated view to the main results is required that considers the differences in sample sizes and age. A separate monitoring of studies with young samples and those with old samples did still not allow clear conclusions. In younger samples, four out of six studies found a strong influence of the current mood state on brain changes (Ahdidan et al., 2011; Frodl et al., 2008b; Isıklı et al., 2013; Phillips et al., 2015). Results in older aged groups remain very heterogeneous. Brain alterations and depression seem to be associated, but whether this is influenced by the current mood state (Hou et al., 2012; Taylor et al., 2003, 2014) or the time spent in depression (Soriano-Mas et al., 2011; Steffens et al., 2000) does not become clear. Only four studies comprise large samples of 89 patients or more and all were restricted to older subjects. The majority indicate an association between brain alterations and depressive state (Taylor et al., 2003, 2014) or time spent in depression (Steffens et al., 2000), thus, qualifying the heterogeneity in the old sample and supporting the idea that depression has an influence on brain alterations.
Discussion
The present paper aimed to systematically review all studies on longitudinal brain changes in the course of depression that met specified criteria. Results show that currently available research largely fails to resolve the causality between the course of depression and neurobiological changes over time, but might be able to shed some light on the topic. As expected, neither the state point of view nor the trait point of view is fully compatible with the presented evidence, and a combination of both theories appears more realistic. However, there was a tendency toward a stronger influence of the depressive state (acute or remitted) on brain-volume outcomes, than of pre-existing brain changes on depressive outcome, which would be in line with a state point of view.
Contribution to the relationship between depression and brain alterations
Most studies showed that brain changes are not independent of current mood state, and found smaller progress or even normalization of volume reductions in remitted patients. These results agree with the neurotoxicity hypotheses: remission stops the increased cortisol release, which in turn prevents continued damage to brain structures. In contrast, non-remitted patients experience further toxic cortisol release, and therefore reveal more brain atrophy. It is not surprising that the most common result is a reduction in hippocampal volume, considering that the hippocampus is highly stress sensitive (McEwen, 1999). It should be noted that most studies exclusively selected the hippocampus as target region, and therefore these results are probably biased.
Evaluating the presented results, some additional methodological aspects should be discussed that might diminish the significance of findings. As stated above, several studies included older participants. It is known that brain atrophy progresses steadily with advancing age (Resnick et al., 2003), which represents a strong confounder when studying depression-related brain changes. Most studies controlled for the effect of age, but others did not implement age as confounding factor. In those cases, it is impossible to evaluate whether observed brain changes are caused by age or by depression.
This is even more important in light of the vascular depression hypothesis. Research states that there is a type of depression occurring more frequently in subjects aged 65 or older. It is suggested that small lesions contribute to the pathogenesis of depression and therefore differs from pathogenesis in younger groups. More precisely, white matter lesions disrupt neural circuits or fiber tracts connecting frontal and subcortical regions that in turn lead to changes in circuits involved in the mood regulation, contributing to the pathogenesis of depression (Alexopoulos, 1997; Godin et al., 2008). In this context, it is important not only to control for the effect of age, but to treat both types of depression as two different groups (early onset depression vs. late onset depression). A joint analysis of both groups can explain the mentioned heterogeneity in studies with older samples.
Results indicate that brain changes develop in opposite directions depending on remission status at follow-up. Therefore, it is important to assess the mood state at follow-up and analyze subgroups separately. By treating patients as one group, all variance in the data that is based on differences in the course of depression is lost.
Most studies assessed depressive symptoms only once at baseline and follow-up. However, depressive symptoms typically fluctuate in severity over time (Stegenga et al., 2012). Therefore, inconsistencies in longitudinal data may well be explained by the failure to capture variations in depression severity over time.
In order to evaluate the possible influence of depressive mood states on brain alterations, it seems of great importance to consider the total time the brain was affected by the disorder, not merely the current condition (Sheline et al., 2003). This would be of less relevance if complete normalization of brain alterations in remitted patients had been achieved. However, only two studies found a full recovery of volume alterations, whereas the majority merely indicated an interrupted progression. Accordingly, it is likely that patients experiencing more episodes show stronger brain structural changes than first episode patients. However, at least one larger cross-sectional study contradicts this notion (Stratmann et al., 2014). Depressive episodes can vary considerably in their duration (Spijker et al., 2002), and the cumulative duration of depression thus seems a better indicator for the past influence of the disorder than the number of depressive episodes. However, valid data on the course of disease are notoriously difficult to acquire. Patients often fail to reliably recall incidents of previous episodes and symptoms (or state unrealistic numbers), and provide diverging reports from one session to the next, for example depending on the current mood state. Careful data collection, establishing memorable anchor points and retrograde recall of the clinical history might help to increase the reliability of the course of disease (Barsky, 2010). Post et al. (1988) provide an instrument to assess the course of unipolar and bipolar depression disorder by a graphic representation of the life course of the illness, that facilitates accurate assessment of episode patterns and elucidates the relationship to environmental events and psychosocial stressors. The application of such instruments could massively improve the validity of variables that cover the clinical course of depression.
Three studies indicate that there is at least a slow ongoing progression of brain alterations independent of depressive episodes. Therefore, the onset of the first episode (i.e. duration of illness) appears to be a second important variable. Apart from clinical history, it is important to document the course of disease during follow-up. Especially the time in remission can be regarded as crucial for considering the time for recovery from a depressive episode. So far, only one study indirectly took this into account, by including the days to remission, with higher values indicating a shorter recovery time for the brain.
One of the most influencing confounders seems to be the type and duration of treatment received. Recent studies demonstrated that ECT causes a massive increase in hippocampal neurogenesis (Redlich et al., 2016), and therefore patients treated with ECT must be controlled for, or excluded from analysis. However, the same might also apply for pharmacological treatment. It has been argued that antidepressant treatment enhances hippocampal neurogenesis and is associated with larger hippocampal volume (Eisch and Petrik, 2012), and there is evidence for this from structural MRI in patients (Arnone et al., 2013). Therefore, it is crucial to find ways of controlling for medication effects, given that most patients receive some form of pharmacological treatment. None of the presented studies included information on dose and duration, which could be done by creating scores for the medication load (e.g. Sackeim, 2001). Further information on history of depression treatment might help to figure out the distinct effects of depression and its treatment on cerebral volume.
Some methodological aspects about MRI data acquisition also need to be mentioned. Some studies used different scanners at baseline and follow-up. Reliability is lower between sites, because images vary more due to technological factors (Jovicich et al., 2006). This variability may be confounded with changes of interest in the image. As a consequence, the power to detect brain changes caused by depression is limited, and different sites should thus be avoided. Next, measurements were obtained at different field strengths, with most scanners operating at 1.5 Tesla and only a few at 3 Tesla. Another critical aspect of most presented studies concerns the use of non-blinded, manual segmentation techniques to define brain structures. Manual methods are subject to errors in both accuracy and reproducibility, for example through subjectivity in structure interpretation or atlas slice selection (Collins et al., 1995). All these aspects can reduce the quality of the data, and thus have to be taken into account.
Another methodological aspect concerns a lack of homogeneity in imaging methods to extrapolate comparable effect sizes. Unfortunately, this is a general problem in imaging research given that different analysis strategies relate to very different dependent variables (e.g. volume [mL] in subcortical segments, thickness [mm] or surface [mm2] in cortical segmentations, and completely other units in voxel-based approaches [gray matter ‘density’ or ‘concentration’]). Furthermore, segmentation results massively depend on the underlying atlas/manual segmentation protocol. Particularly VBM is affected by differences in which voxels are underlying a given test statistic. For example, commonly reported statistics are peak voxel statistics, which however overestimate ‘true’ effect sizes of an anatomically defined structure dramatically since only values of the most significant voxel are provided. Using cluster-wise statistics still overestimates these effects and is furthermore vulnerable to effects of different statistical cluster-forming thresholds. For these reasons, the presentation of effect sizes across these studies did not appear meaningful to us.
As mentioned above, the presented studies fail to resolve the causality between the course of depression and neurobiological changes. One main reason is that they may investigate the state point of view, but do not have the means to investigate the trait point of view. One approach for this topic is to investigate high-risk samples. Studies found that healthy subjects with a familial risk for depression, such as an affected parent (Chen et al., 2010) or an affected twin (Baaré et al., 2010), had smaller hippocampal volumes than did their low-risk counterparts. The findings suggest that reductions in hippocampal volume may be present before depression onset and display a predisposition. Longitudinal studies that tried to contribute findings relevant for the trait position examined whether brain changes at baseline indicate the course of depression at follow-up. This was indeed confirmed by three research groups (Frodl and Meisenzahl, 2004; Frodl et al., 2008a; Lavretsky et al., 1999), but there is a strong confound in these studies with the history of depression. Instruments such as the LIFE-CHART could clarify the relationship between brain changes and total affective morbidity. So far, the presented results allow only speculations. To evaluate whether brain changes are already present before depression onset, participants need to be assessed before diagnosis of MDD. This constitutes a difficult research goal, requiring large numbers of participants, as is the case in epidemiological studies.
Epidemiological studies can help to shed light on the trait point of view. Such studies comprise huge, primarily populations-based samples and focus on gray and white matter changes in late-life depression (Chen et al., 2006; Dotson et al., 2009; Elbejjani et al., 2014, 2015; Firbank and Teodorczuk, 2012; Godin et al., 2008; Kirton et al., 2014; Park et al., 2015; Teodorczuk and Firbank, 2010; Teodorczuk et al., 2007; Van Sloten et al., 2015; Verdelho and Madureira, 2013; Versluis et al., 2006). Typically, studies applied the Mini-International Neuropsychiatric Interview (Sheehan et al., 1998) for diagnostic purposes and the Center for Epidemiologic Studies Depression Scale (Radloff, 1977), to assess frequency and severity of depressive symptoms. A valuable advantage of large sample sizes is the chance to detect converters, that is, participants that were healthy participants at baseline but developed a depression during follow-up. The results from such studies partially support the trait point of view; they indicate that white matter changes precede depression and therefore might be causal in the pathogenesis of depression (Firbank and Teodorczuk, 2012; Godin et al., 2008; Park et al., 2015). Other studies found that alterations at baseline predict the course of depression, but did not control for history of disorder (e.g. Elbejjani et al., 2014; Teodorczuk and Firbank, 2010; Van Sloten et al., 2015).
Note that epidemiological studies come along with methodological weaknesses. First of all, reported studies focused on late onset depression and most studies comprised samples aged over 70. As mentioned above, recent research suggests that this type of depression might have different pathogenesis and is associated with a strong vascular component. As a result, findings for this subgroup cannot be generalized. A next limitation concerns the reliance on brief interviews or self-rating scales to assess current depression, rather than a proper assessment of DSM criteria based depression diagnoses. As mentioned above, brain atrophy progresses as age advances. As a consequence, brain changes due to depression are disguised or confounded by volume reductions caused by progressing age. Accordingly, the results need to be treated with caution.
Future perspectives
We discussed important variables that need to be considered when investigating the causal relation between depression and brain changes. First of all, an extensive documentation of the course of depression is required. Techniques to maximize the validity of the patients’ report and to assess fluctuations in depression severity could enhance the quality of the data. Repeated data acquisition would provide information about different mood states at different points in time. Furthermore, detailed monitoring of treatment is essential to rule out confounding effects. Besides treatment effects, there are other factors of great influence that need to be systematically assessed. For instance, recent research revealed the strong morphometric impact of childhood maltreatment, which provides an alternative explanation for observed brain alterations, especially given the elevated prevalence of childhood traumata in MDD (Opel et al., 2014).
Another approach for future research may be the assessment of symptoms rather than diagnostic categories. MDD is a heterogeneous disorder that comprises many symptoms such as sad mood, anhedonia, cognitive and somatic complaints. Research indicates that neuronal alterations are associated with different symptom dimensions (Heinzel et al., 2009), and a symptom approach might therefore provide more precise knowledge of brain changes in MDD. Finally, future studies should combine the strength of high methodological standards with the strength of large sample sizes. Such projects can probably only be achieved when several study centers cooperate, as already happening for the investigation of genetic variants in MDD. Studies that include all these considerations should be able to evaluate the weight of factors in favor of the state point of view and those supporting a trait point of view.
The studies presented here concerned structural MRI only. Another approach to investigate the state-trait debate would be the implementation of functional MRI. So far only three longitudinal functional MRI studies are available (Heller et al., 2013; Opmeer et al., 2015; Wang et al., 2015), all three employing a resting-state sequence. To our knowledge, no longitudinal study applied paradigm-based fMRI investigating the activity of regions associated with learning and memory processes, or emotion and reward processing. Structural brain changes are thought to be associated with changes in their function, but the investigation of altered brain functions would be a more direct approach and future studies should address this challenge.
Conclusion
This review tried to shed some light onto the causality between the course of depression and neurobiological changes over time in MDD and presented a critical discussion on methodological challenges for future studies. The evidence reviewed here supports a strong influence of depressive state on changes of brain structures. Cooperation in multi-center studies is needed to attain large sample sizes, along with a careful assessment of possible confounders to clarify the influence of pre-existing brain changes on depressive outcome.
Footnotes
Declaration of Conflicting Interests
The author(s) declared no potential conflicts of interest with respect to the research, authorship and/or publication of this article.
Funding
The author(s) disclosed receipt of the following financial support for the research, authorship, and/or publication of this article: The study was supported by grants from the German Research Foundation (Deutsche Forschungsgemeinschaft [DFG]; grant FOR 2107; DA1151/5-1 to U.D.).