
Abstract
Objective:
The results from observation studies on the relationship between coffee intake and risk of depression and the relationship between caffeine consumption and depression remain controversial. We conducted a meta-analysis with a dose–response analysis to quantitatively summarize the evidence about the association between coffee and caffeine intakes and risk of depression.
Method:
Relevant articles were identified by researching PubMed, Web of Science, China National Knowledge Infrastructure and WANFANG DATA in English or Chinese from 1 January 1980 to 1 May 2015. Case-control, cohort or cross-sectional studies evaluating coffee or caffeine consumption and depression were included. A random-effects model was used to combine study-specific relative risk and 95% confidence interval. Dose–response relationship was assessed by restricted cubic spline functions.
Results:
Data were obtained from 11 observation articles; 330,677 participants from seven studies in seven articles were included in the coffee-depression analysis, while 38,223 participants from eight studies in seven articles were involved in the caffeine-depression analysis. Compared with the lowest level consumption, the pooled relative risk (95% confidence interval) for coffee-depression and caffeine-depression was 0.757 [0.624, 0.917] and 0.721 [0.522, 0.997], respectively. For dose–response analysis, evidence of a linear association was found between coffee consumption and depression, and the risk of depression decreased by 8% (relative risk = 0.92, 95% confidence interval = [0.87, 0.97], p = 0.002) for each cup/day increment in coffee intake; a nonlinear association was found between caffeine consumption and depression, the risk of depression decreased faster and the association became significant when the caffeine consumption was above 68 mg/day and below 509 mg/day.
Conclusions:
Coffee and caffeine consumption were significantly associated with decreased risk of depression.
Introduction
Depression is an important public health issue, and is expected to rank third among disorders contributing to the global burden of disease by 2030 (Mathers and Loncar, 2006). The lifetime prevalence rate of depression is approximately 15% among adults in high-income countries worldwide (Bromet et al., 2011). Accumulating epidemiological evidence supports that depression is associated with several dietary factors (Murakami and Sasaki, 2010) such as tea (Dong et al., 2015), smoking (Luger et al., 2014) and alcohol intake (Boden and Fergusson, 2011). Evidence shows that depression is also associated with lifestyle factors such as physical activity (Krogh et al., 2011), sedentary behaviour (Zhai et al., 2014), etc. Along with tea, coffee is one of the top two commonly consumed beverages in the world (Popkin et al., 2006). Coffee is also a major source of caffeine (1, 3, 7-trimethylxanthine). It is suggested that caffeine can immediately facilitate the release of serotonin and dopaminergic transmission, and these two chemicals contribute to depression (Ferre, 2008; Ferre et al., 2008). Recently, several epidemiologic studies have found a connection between coffee or caffeine intake and depression risk, but the results of existing literature have yielded inconsistent results. For example: some studies discovered an inverse relationship between coffee or caffeine and risk of depression (Guo et al., 2014; Lucas et al., 2011; Park and Moon, 2014; Pham et al., 2014; Ruusunen et al., 2010), while several studies did not find any beneficial effect between coffee or caffeine and depression (Hintikka et al., 2005; Niu et al., 2009; Pham et al., 2014; Ruusunen et al., 2010). What is more, an individual study may not have enough power to reach a dependable conclusion. Therefore, we conducted a meta-analysis with a dose–response analysis systematically by combining all available data of observational studies to derive a quantitative estimation of the association between coffee or caffeine intake and depression.
Methods
Literature search and selection
We performed a literature search up to 1 May 2015 using PubMed database, Web of Science China National Knowledge Infrastructure (CNKI) and WANFANG DATA with the key words ‘coffee’ or ‘caffeine’ combined with ‘depression’ without restrictions. The reference lists of retrieved articles were also scrutinized to identify undetected relevant articles. For dose–response analysis, the article had to report relative risk (RR) (95% confidence interval [CI]) for at least three quantitative categories of coffee or caffeine intake. Besides, the number of cases and participants or person-years for each category of coffee or caffeine intake must be also be provided (or data available to calculate them). If data were duplicated in more than one study, we included the study with the largest number of cases or the latest published one.
Data extraction
The following data were extracted from each study by two investigators: (1) the first author’s last name, (2) publication year, (3) country and region where the study was conducted, (4) research type and sample size (number of cases and total number of participants), (5) gender of the participant, (6) coffee and caffeine intake categories, (7) the RRs with their 95% CIs for each category of coffee and caffeine intake and (8) covariates adjusted for in the multivariable analysis. We extracted the RRs that reflected the greatest degree of adjustment for potential confounders. For dose–response analysis, the number of cases and participants (person-years) for each category was also extracted. The median or mean level of coffee and caffeine intake for each category was assigned to the corresponding RR for every study. If the upper boundary of the highest category was not provided, we assumed that the boundary had the same amplitude as the adjacent category (Larsson and Orsini, 2011). A study conducted by Ruusunen et al. adopted mL/day as the unit the coffee consumption; we convert 125 mL/day to 1 cup/day by reference to one article which is conducted in the same country (Happonen et al., 2008).
Statistical analysis
Pooled measure was calculated as the inverse variance-weighted mean of the logarithm of RR (95% CI) of depression for the highest versus lowest category of coffee and caffeine, respectively. We adopted the I2 of Higgins and Thompson to assess heterogeneity. In our study, we used the random effect model (REM) as the pooling method. Univariate meta-regression analysis by study region, research type, number of participants and gender was conducted to investigate the potential sources of heterogeneity. Publication bias was assessed with visual inspection of the funnel plots and Egger’s linear regression test (Egger et al., 1997). All statistical analyses were conducted by Stata V.12.0 (Stata Corp., College Station, TX, USA). A two-tailed p < 0.05 was considered statistically significant.
Two investigators independently reviewed the identified articles, and articles were included if they met the following criteria: (1) the article reports a human-based study and published in English or Chinese, (2) the exposure of coffee or caffeine was given in the articles, (3) the outcome of interest was depression and (4) RR with 95% CI was provided (we presented all results with RR for simplicity).
Result
Literature search and study characteristics
The flow diagram of the literature search is shown in Figure 1.
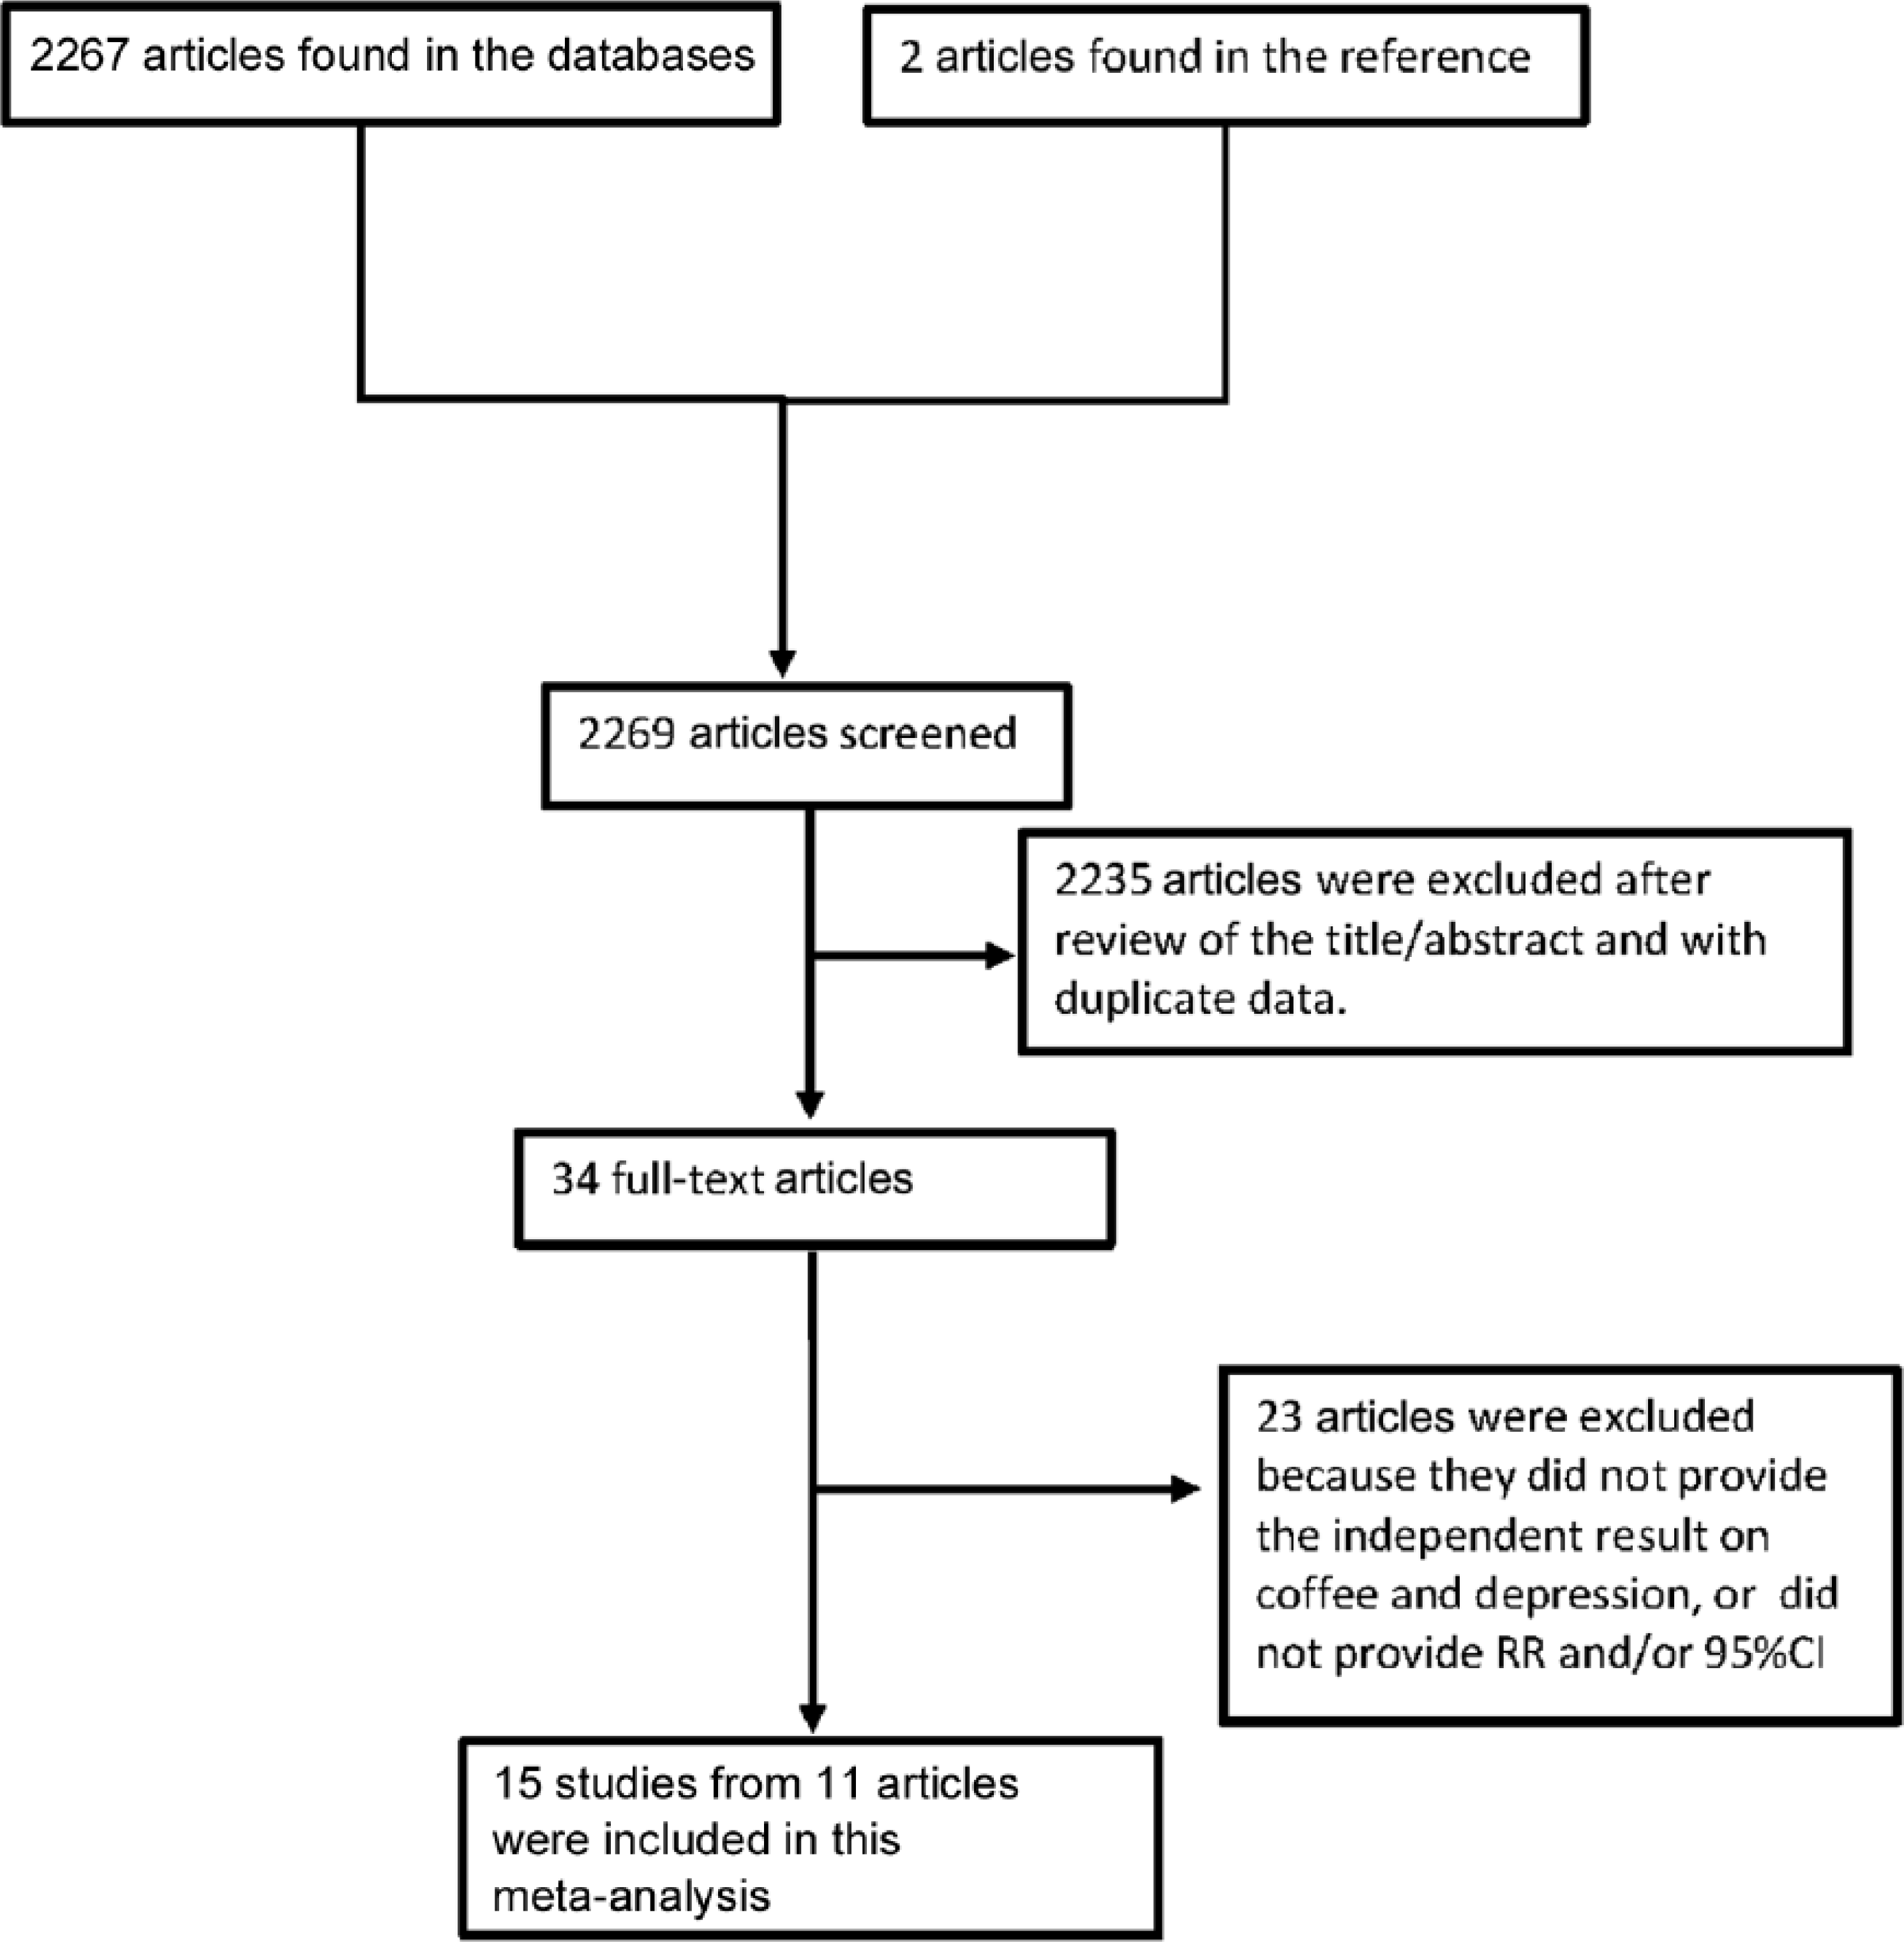
Flowchart of the selection of studies included in the meta-analysis.
The baseline characteristics of the study participants and design characteristics in the published articles are shown in Tables 1–3. In the 11 articles, eight studies from seven articles provided the result for caffeine, and seven studies from seven articles provided the result for coffee. Among the seven coffee-depression studies, one study was of case-control design (Guo et al., 2014), four studies were cross-sectional designs (Hintikka et al., 2005; Niu et al., 2009; Park and Moon, 2014; Pham et al., 2014) and the remaining two studies were cohort designs (Lucas et al., 2011; Ruusunen et al., 2010). With regard to the study region, two studies were conducted in Europe (Hintikka et al., 2005; Ruusunen et al., 2010), three in Asia (Niu et al., 2009; Park and Moon, 2014; Pham et al., 2014) and two in America (Guo et al., 2014; Lucas et al., 2011). In the eight caffeine-depression studies, four studies were cross-sectional designs (Kendler et al., 2006; Kuczmarski et al., 2015; Pham et al., 2014; Smith, 2009) and the other four studies were cohort designs (Lucas et al., 2011; Ritchie et al., 2014; Ruusunen et al., 2010). The major adjustment confounding factors included age, gender, education, smoking, alcohol use, body mass index, etc.
Characteristics of studies and participants included in the meta-analysis of the association between coffee and caffeine consumption and risk of depression.
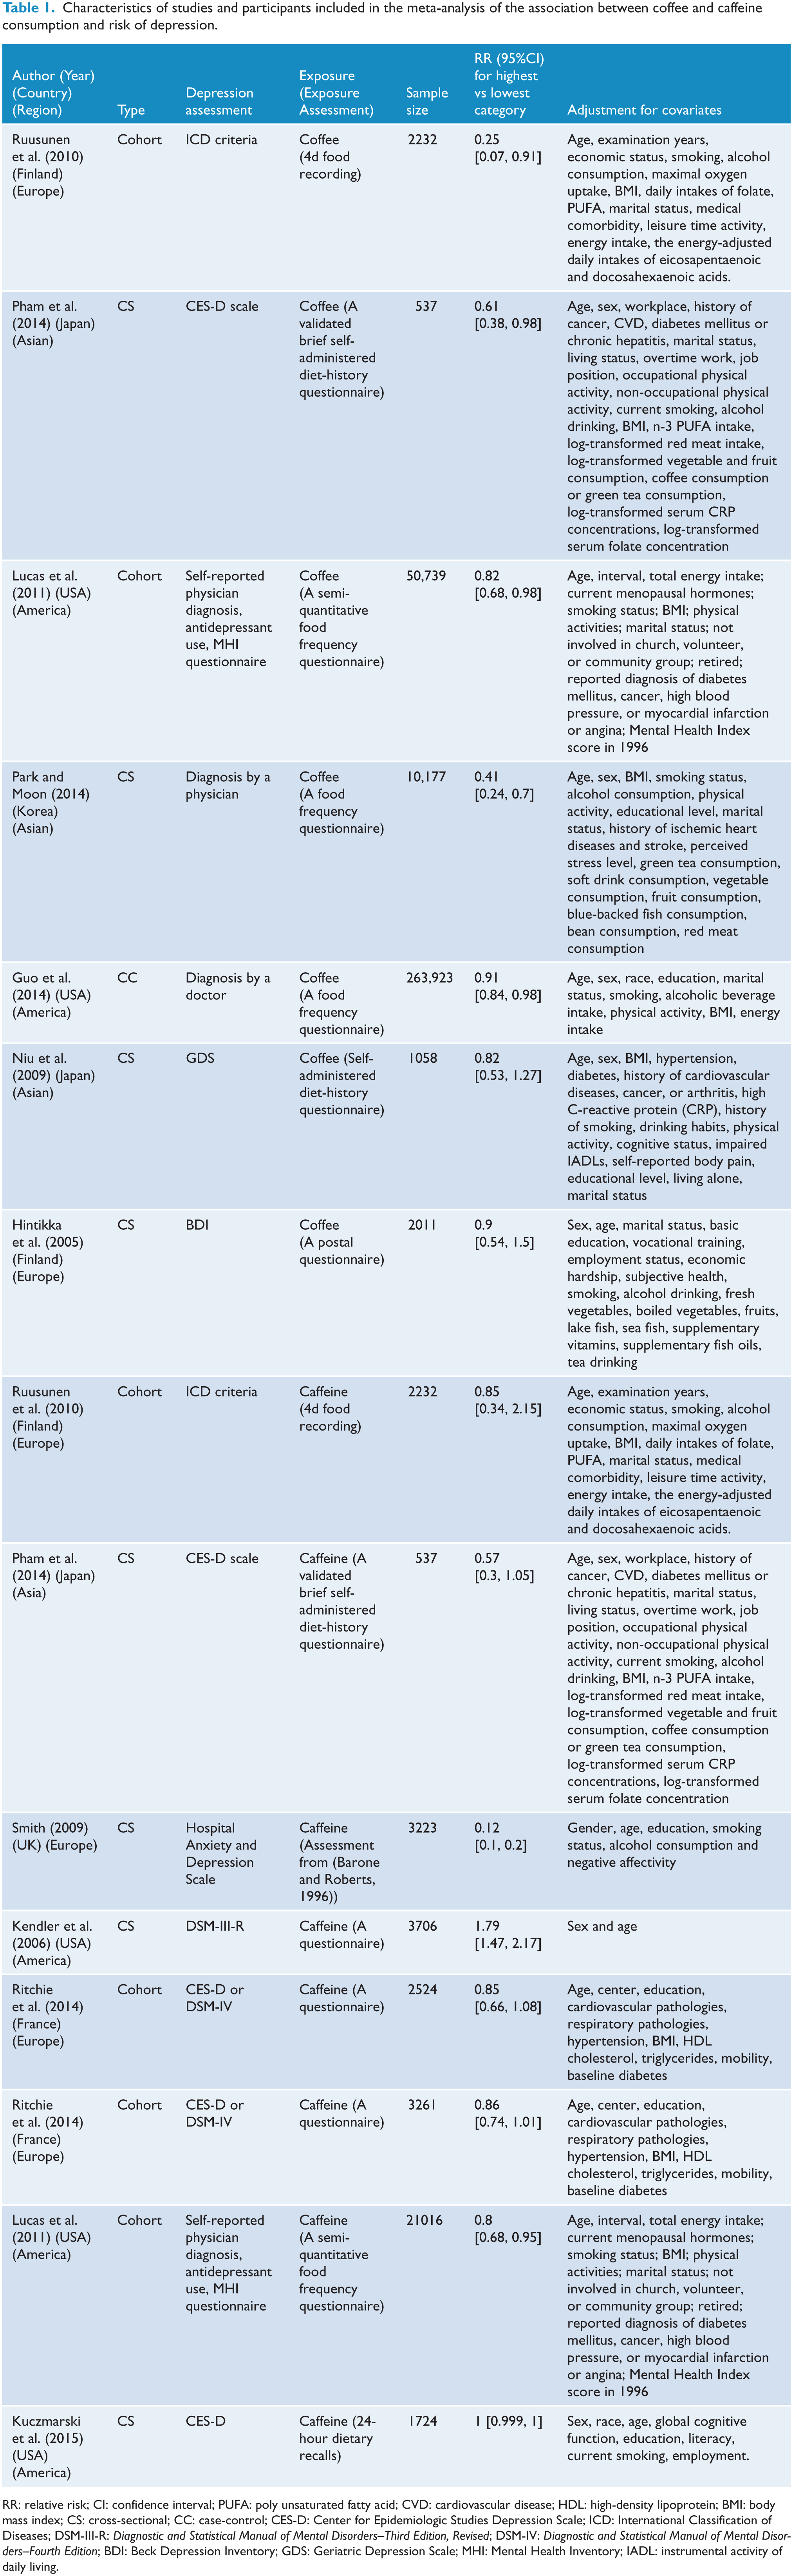
RR: relative risk; CI: confidence interval; PUFA: poly unsaturated fatty acid; CVD: cardiovascular disease; HDL: high-density lipoprotein; BMI: body mass index; CS: cross-sectional; CC: case-control; CES-D: Center for Epidemiologic Studies Depression Scale; ICD: International Classification of Diseases; DSM-III-R: Diagnostic and Statistical Manual of Mental Disorders–Third Edition, Revised; DSM-IV: Diagnostic and Statistical Manual of Mental Disorders–Fourth Edition; BDI: Beck Depression Inventory; GDS: Geriatric Depression Scale; MHI: Mental Health Inventory; IADL: instrumental activity of daily living.
Characteristics of studies and participants included in the dose–response analysis of the association between coffee consumption and risk of depression.
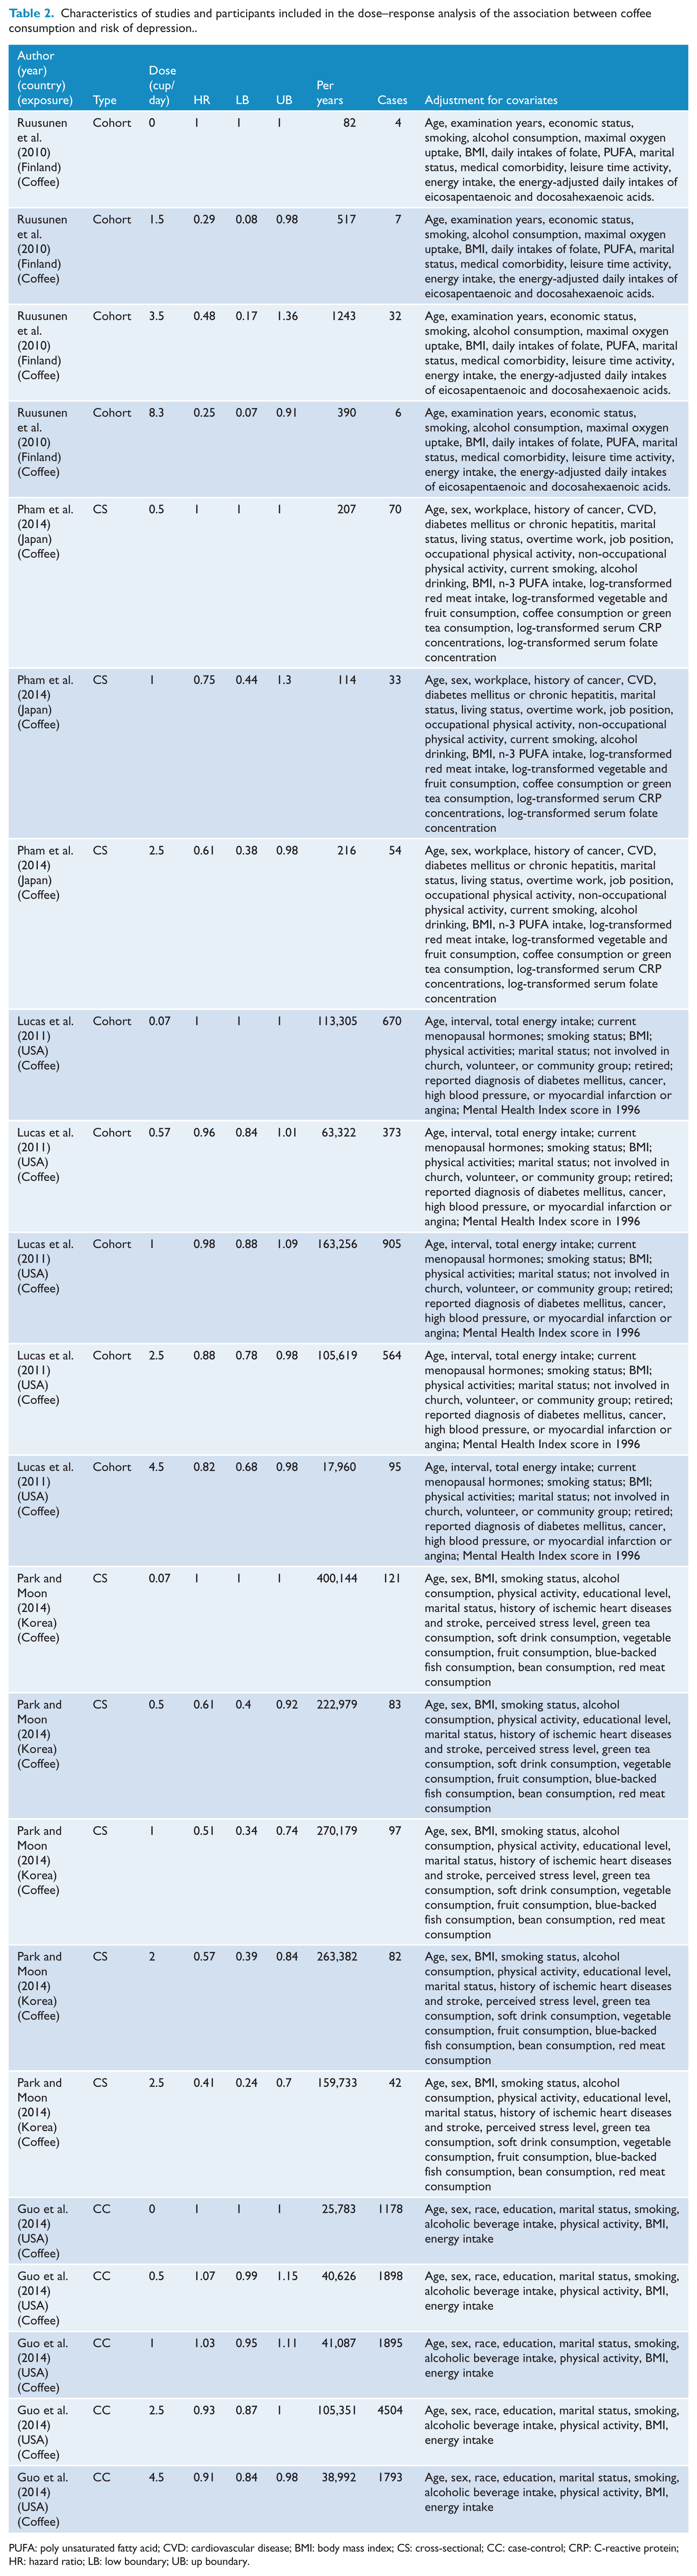
PUFA: poly unsaturated fatty acid; CVD: cardiovascular disease; BMI: body mass index; CS: cross-sectional; CC: case-control; CRP: C-reactive protein; HR: hazard ratio; LB: low boundary; UB: up boundary.
Characteristics of studies and participants included in the dose–response analysis of the association between caffeine consumption and risk of depression.
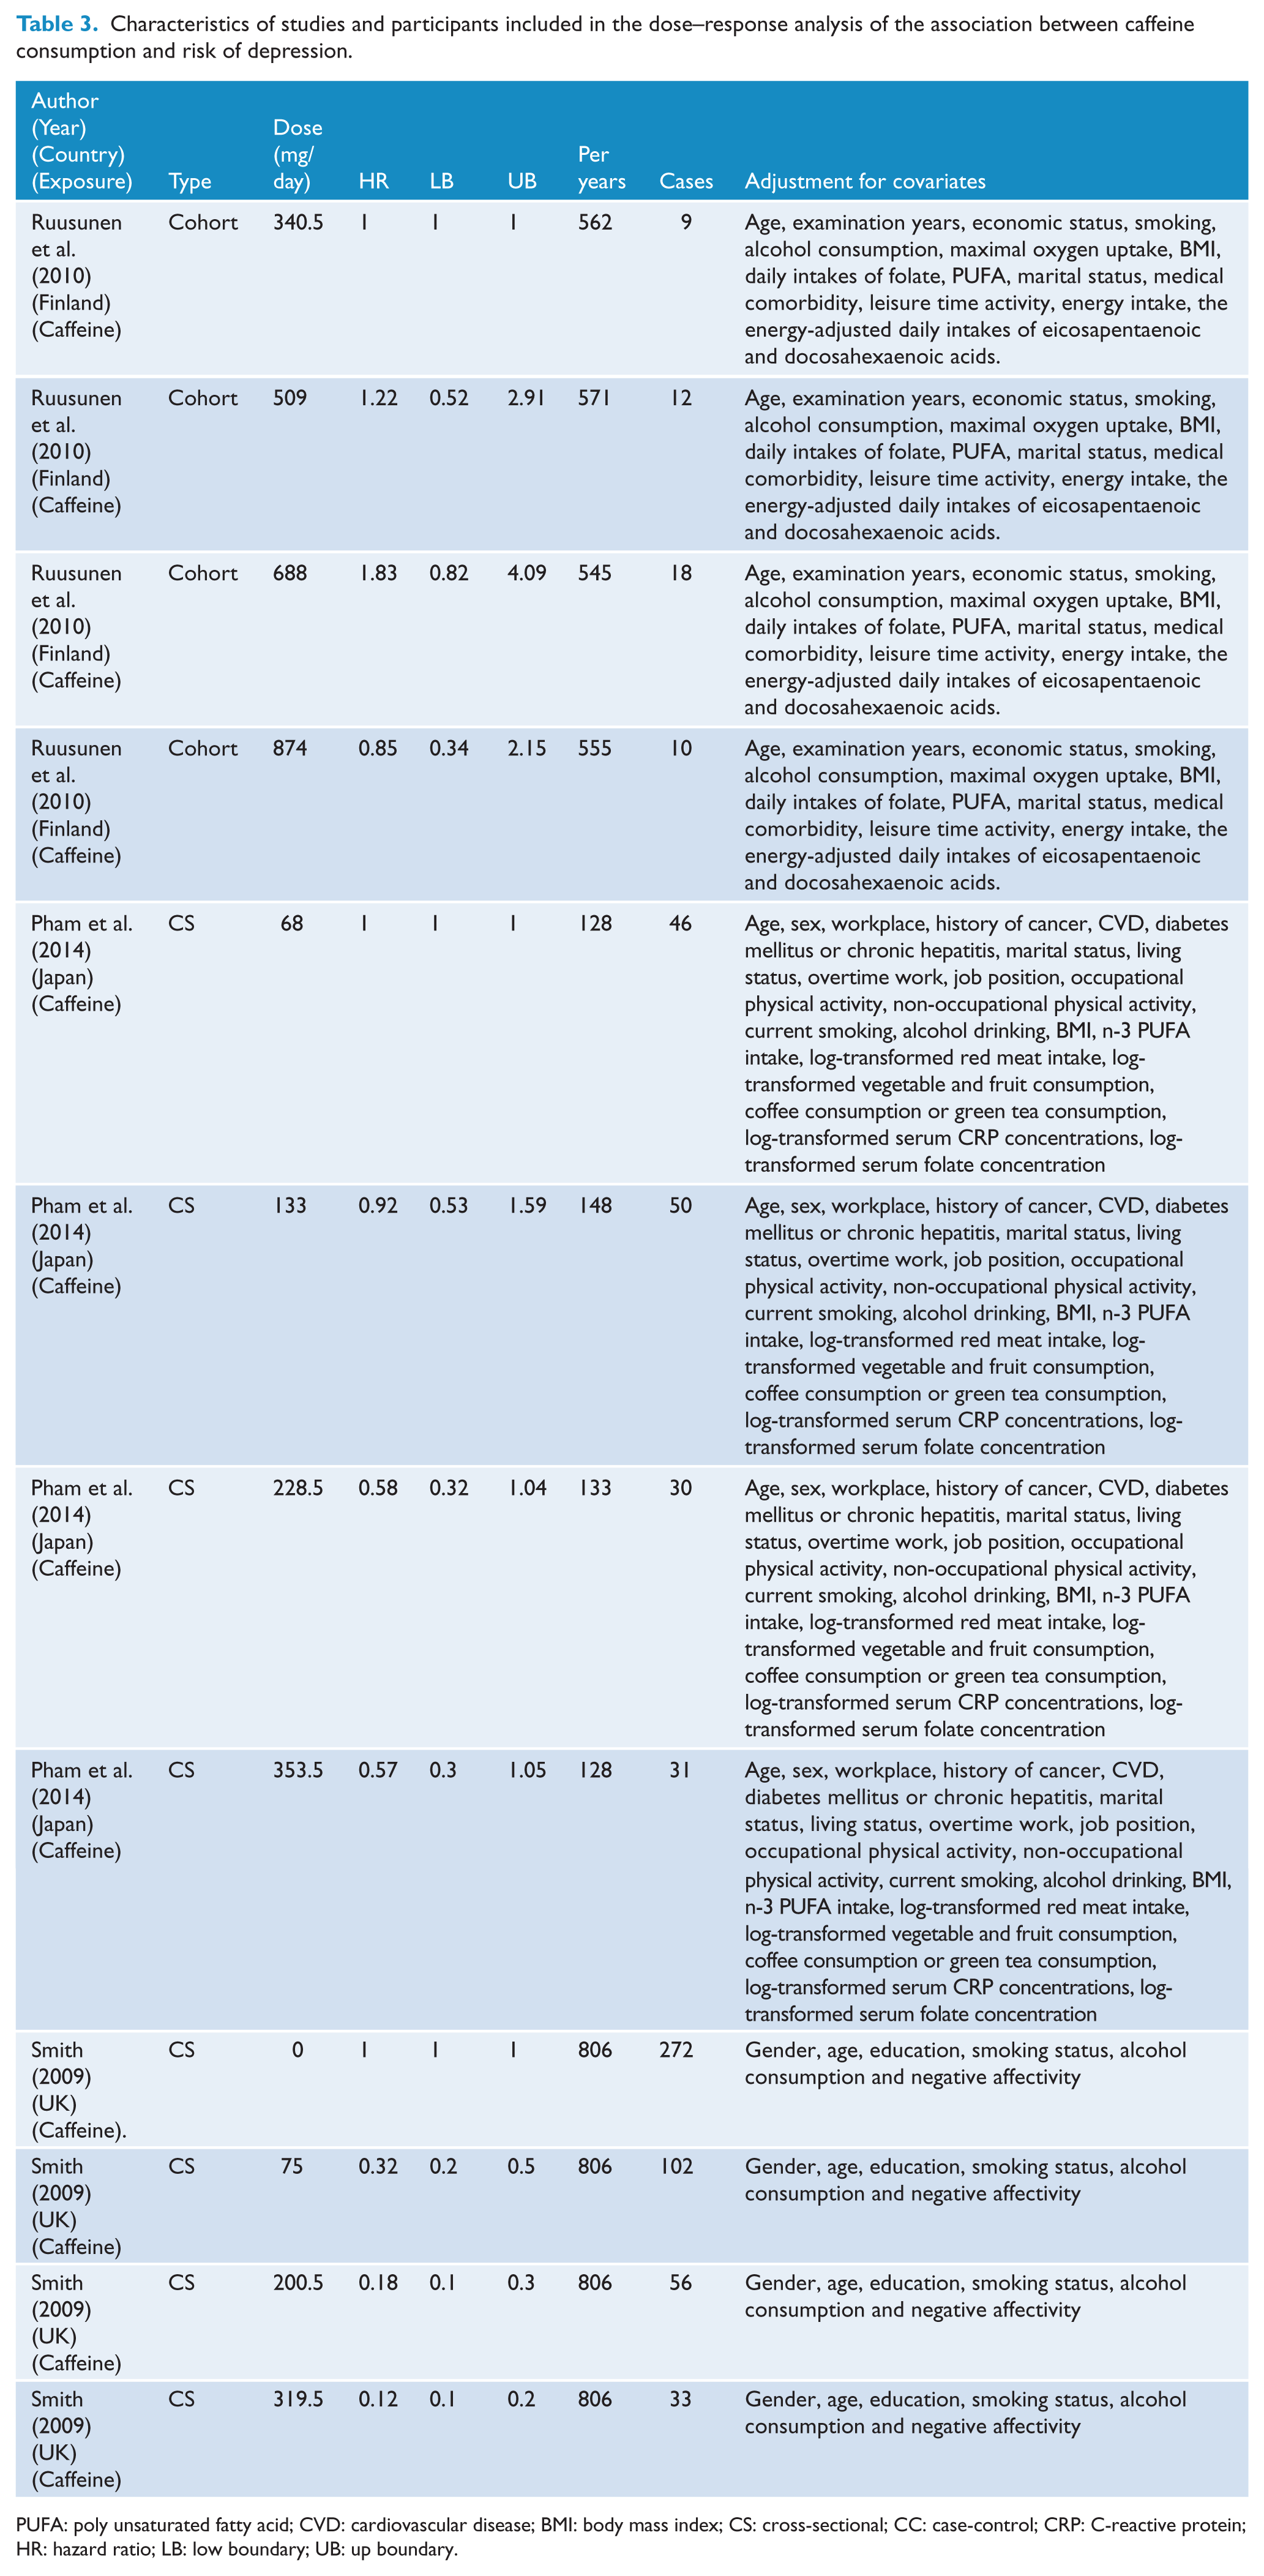
PUFA: poly unsaturated fatty acid; CVD: cardiovascular disease; BMI: body mass index; CS: cross-sectional; CC: case-control; CRP: C-reactive protein; HR: hazard ratio; LB: low boundary; UB: up boundary.
Quantitative synthesis
Association of coffee with depression risk
The results were summarized in Figure 2 and Figure 3.
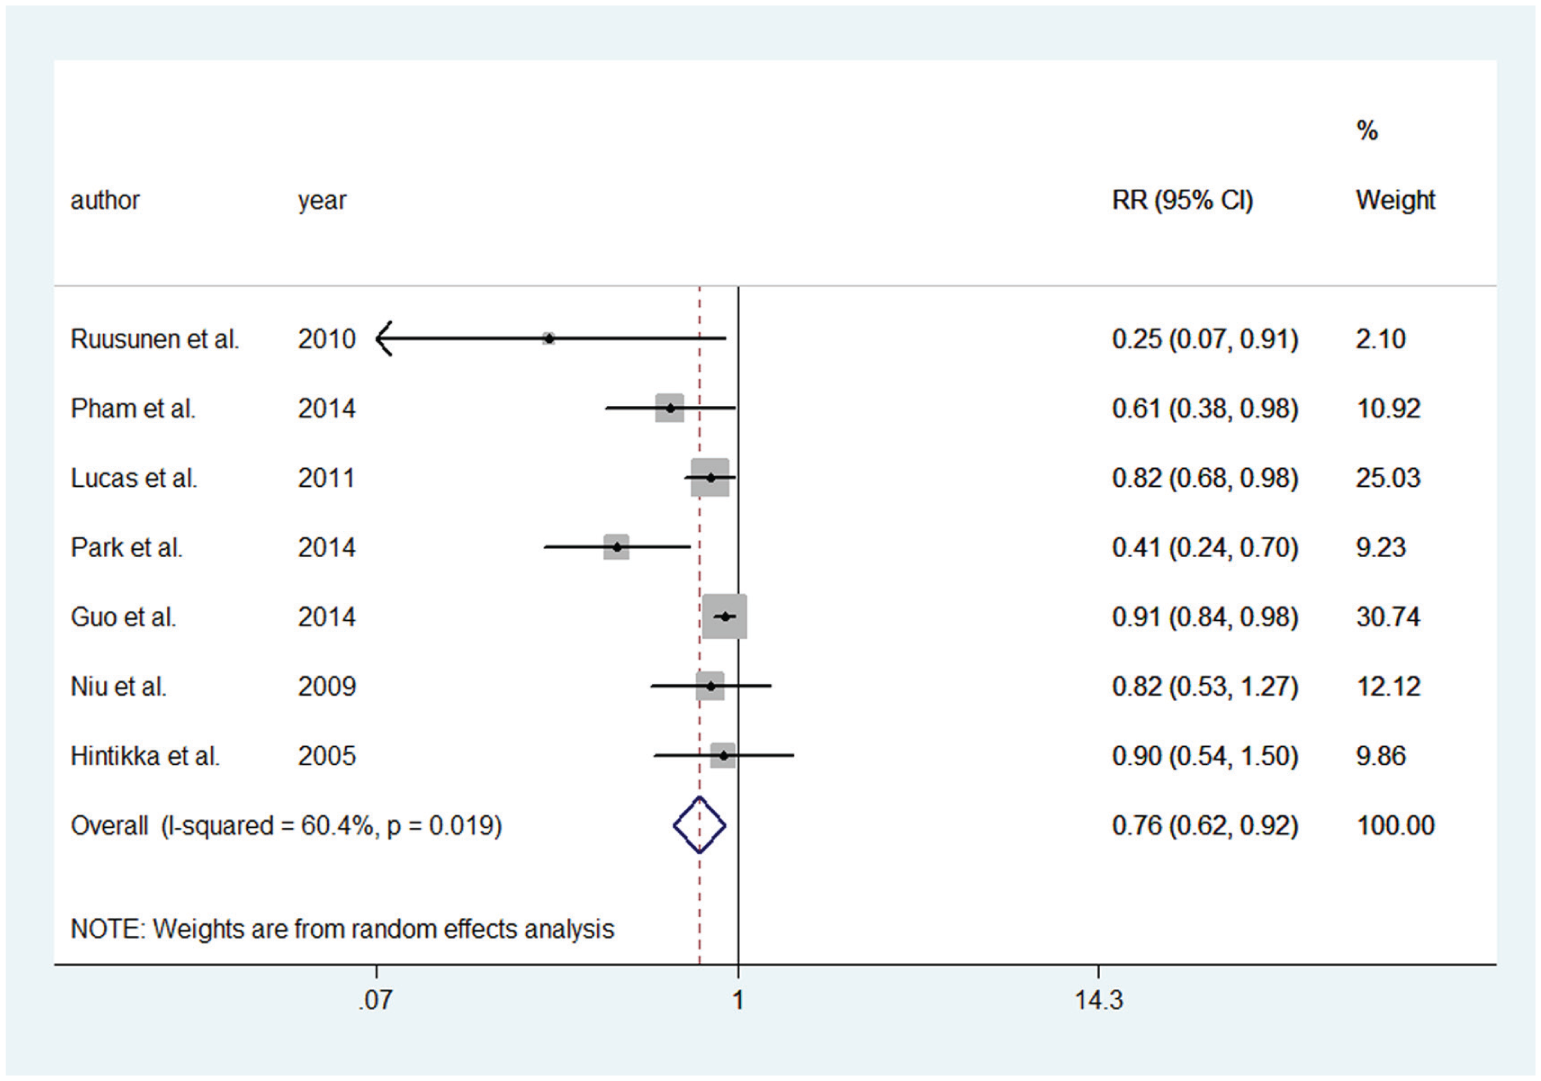
Meta-analysis of the association between coffee intake and depression risk. The size of gray box is positively proportional to the weight assigned to each study, which is inversely proportional to the standard error of the OR, and horizontal lines represent the 95 % confidence interval.
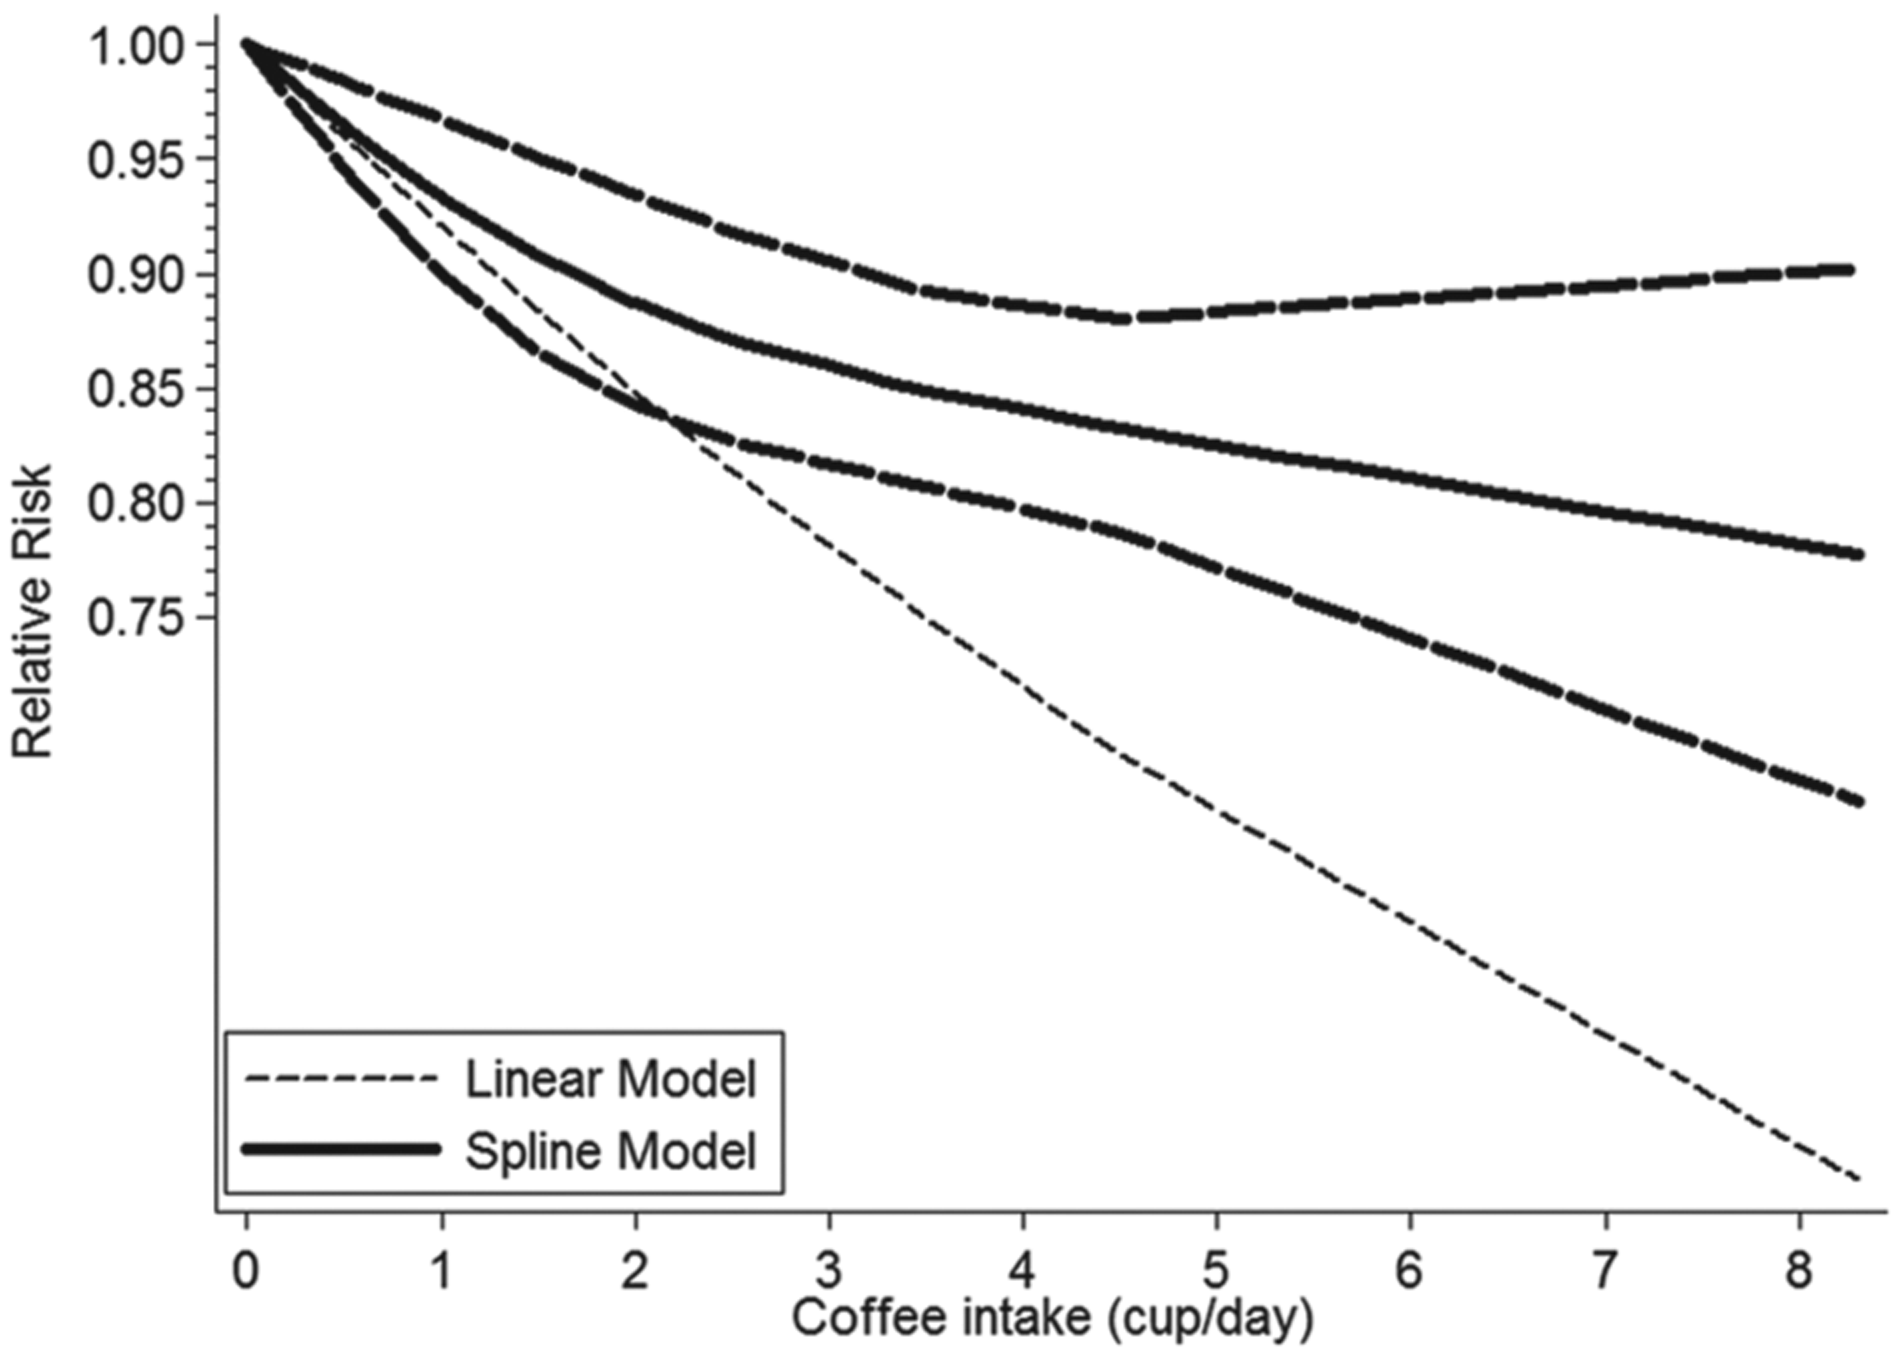
Dose-response relationships between coffee intake and depression risk.
Seven studies from seven articles (Guo et al., 2014; Hintikka et al., 2005; Lucas et al., 2011; Niu et al., 2009; Park and Moon, 2014; Pham et al., 2014; Ruusunen et al., 2010) involving 330,677 participants were included in the coffee consumption analysis. Five studies (Guo et al., 2014; Lucas et al., 2011; Park and Moon, 2014; Pham et al., 2014; Ruusunen et al., 2010) showed significant associations between coffee consumption and depression, while the other two studies (Hintikka et al., 2005; Niu et al., 2009) indicated slight relation between coffee consumption and depression. The overall result indicated that coffee consumption was a protective factor to depression (RR = 0.757; 95% CI = [0.624, 0.917]; I2 = 60.4%, pheterogeneity = 0.019).
For the dose–response analysis of the relation between coffee consumption and depression, data from five studies (Guo et al., 2014; Lucas et al., 2011; Park and Moon, 2014; Pham et al., 2014; Ruusunen et al., 2010), including 14,506 depression cases were used. A linear relationship was found between coffee intake and depression risk (p for nonlinearity = 0.103) and the RR (95% CI) of depression was 0.96 [0.95, 1.00], 0.93 [0.90, 0.97], 0.91 [0.87, 0.95], 0.89 [0.84, 0.93], 0.87 [0.83, 0.92], 0.85 [0.81, 0.89], 0.83 [0.79, 0.88] for 0.5, 1, 1.5, 2, 2.5, 3.5 and 4.5 cups/day of coffee intake, respectively. The risk of depression decreased by 8% (RR = 0.92, 95% CI = [0.87, 0.97], p = 0.002) for each cup/day increment in coffee intake.
Caffeine consumption and depression
Eight studies from seven articles (Kendler et al., 2006; Kuczmarski et al., 2015; Lucas et al., 2011; Pham et al., 2014; Ritchie et al., 2014; Ruusunen et al., 2010; Smith, 2009) including 38,223 participants were involved in the caffeine analysis. The pooled RR of overall data was 0.721 (95% CI = [0.522, 0.997]) for the highest category versus the lowest category of caffeine consumption, with a high heterogeneity (I2 = 96.4%, pheterogeneity = 0) (Figure 4).
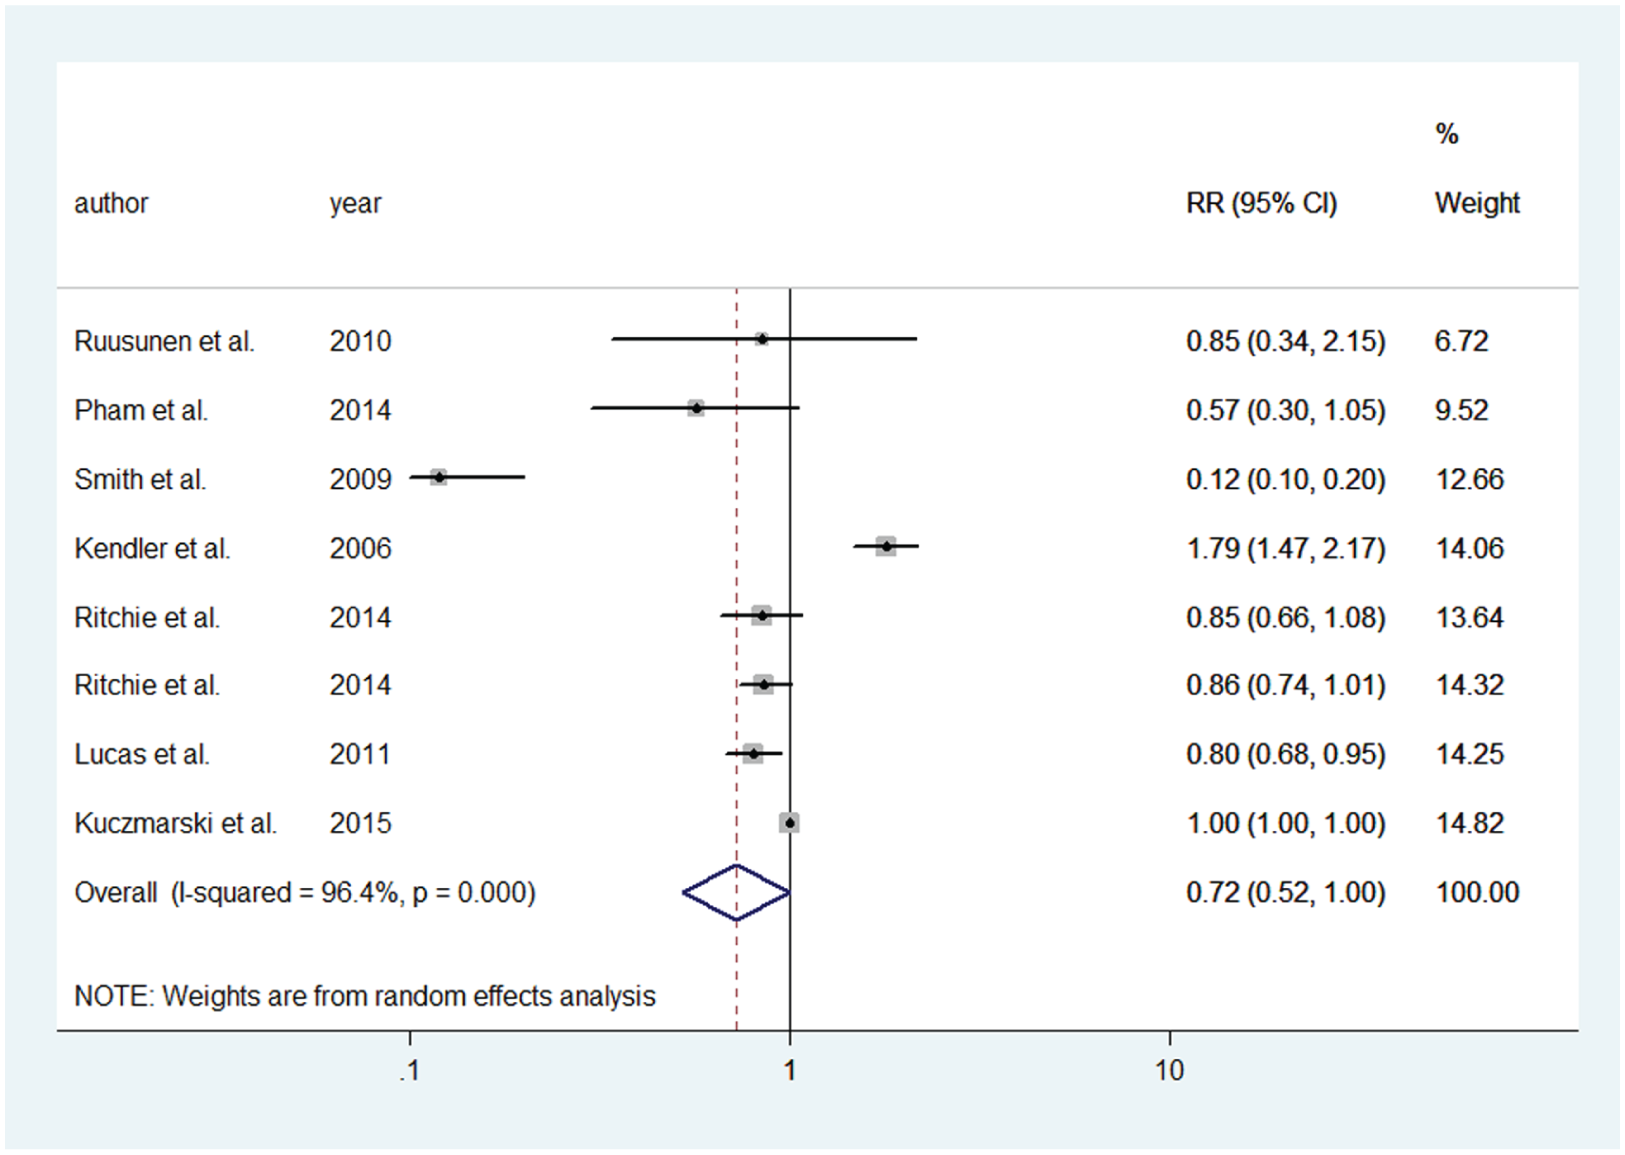
Meta-analysis of the association between caffeine intake and depression risk. The size of gray box is positively proportional to the weight assigned to each study, which is inversely proportional to the standard error of the OR, and horizontal lines represent the 95 % confidence interval.
For dose–response analysis, data from three studies (Pham et al., 2014; Ruusunen et al., 2010; Smith, 2009) were used, including 669 depression cases. Evidence of a nonlinear association was found (p for nonlinearity = 0.0000, Figure 5) between caffeine consumption and risk of depression. The risk of depression decreased faster and the association became significant when the caffeine consumption was above 68 mg/day and below 509 mg/day. The RRs with 95% CIs of depression risk were 0.67 (95% CI = [0.62, 0.72]), 0.46 (95% CI = [0.40, 0.53]), 0.21 (95% CI = [0.16, 0.28]), 0.25 (95% CI = [0.18, 0.35]), 0.43 (95% CI = [0.25, 0.75]) and 0.83(95% CI = [0.36, 1.93]) for 68,133,353.5,509,688 and 874 mg/day of caffeine consumption, respectively.
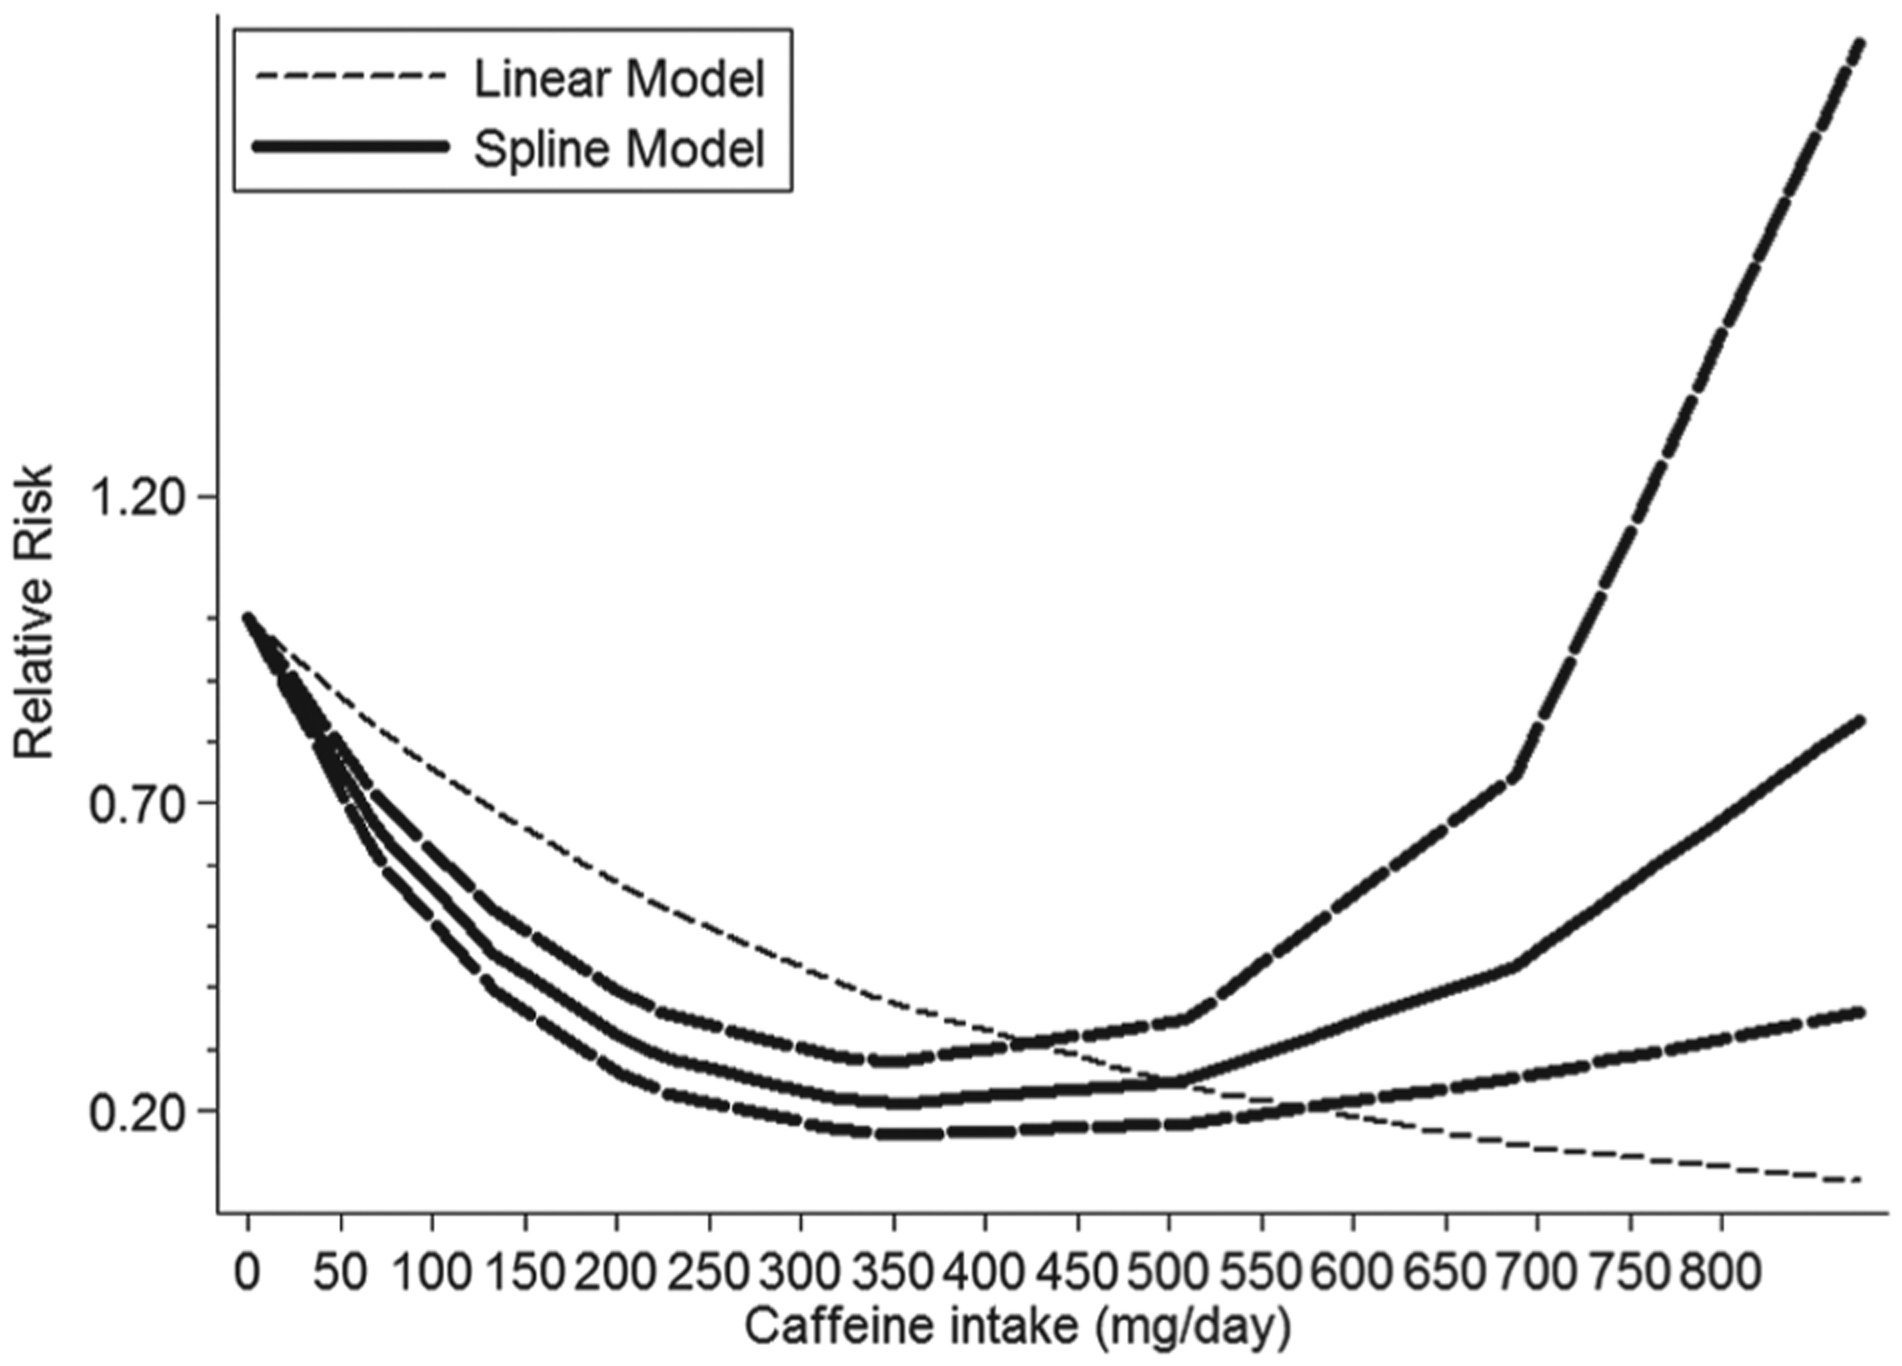
Dose-response relationships between caffeine intake and depression risk.
Sources of heterogeneity and subgroup analysis
Coffee and depression risk
As seen in Figure 2, moderate heterogeneity (I2 = 60.4%, pheterogeneity = 0.019) between our seven studies was demonstrated for coffee consumption with depression; p values of univariate meta-regression analysis with the covariates of study region, research type, number of participants and gender were 0.322, 0.713, 0.282 and 0.550, respectively. According to the result, these factors were not the resources of heterogeneity .We also conducted a subgroup analysis stratified by population region for coffee consumption. The results were shown in Table 4. We found that two articles conducted by Ruusunen et al. (2010) and Park and Moon (2014) were the key articles contributing to this high between-study heterogeneity. After further excluding these two articles, no heterogeneity (I2 = 0.0%) was found, and the pooled RR was 0.887 (95% CI = [0.828, 0.950]).
Subgroup analysis of relative risk (RR) of coffee or caffeine consumption and depression.
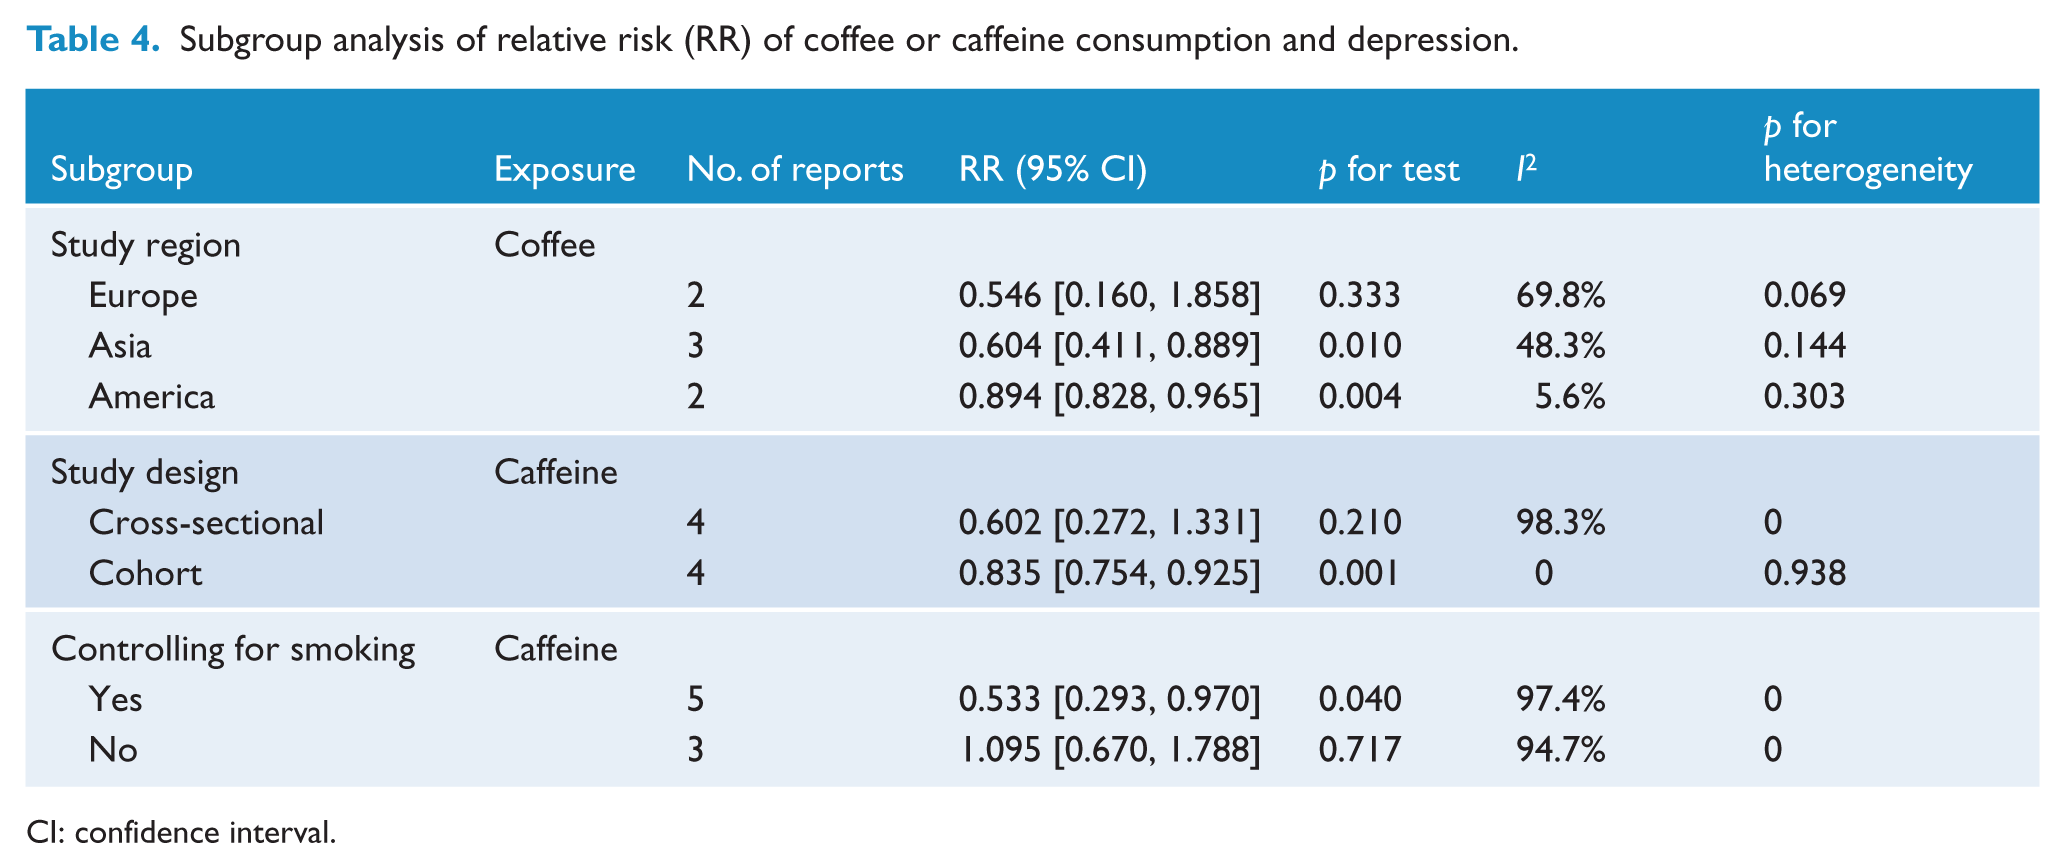
CI: confidence interval.
Caffeine and depression risk
As seen in Figure 4, high heterogeneity (I2 = 96.4%, pheterogeneity = 0.000) among all included studies was stated for caffeine consumption with depression; p values of univariate meta-regression analysis with the covariates of study region, research type, number of participants and gender were 0.216, 0.597, 0.879 and 0.640, respectively. But we still did not find the resources of heterogeneity. We conducted two subgroup analyses stratified by study design and smoking status for caffeine consumption. The results are shown in Table 4.
Sensitivity analysis and publication bias
The results of the influence analysis showed that no individual study had excessive influence on the above-mentioned pooled effect in both caffeine/coffee consumption and depression risk. The results of Egger’s linear regression test showed no evidence of publication bias for the analysis between depression risk and caffeine consumption (p = 0.351 for caffeine) but a publication bias for the analysis between depression risk and coffee consumption (p = 0.027 for coffee). However, no publication bias was found (p = 0.161) in the relationship between coffee consumption and depression after removing two studies (Park and Moon, 2014; Ruusunen et al., 2010) which had strong effect on heterogeneity.
Discussion
Our study is the first meta-analysis of observational studies examining the association between coffee or caffeine consumption and depression. This meta-analysis included 330,677 participants for coffee consumption and 38,223 participants for caffeine consumption and strongly identified that coffee and caffeine consumption was significantly associated with decreased risk of depression in adults. Besides, the result of dose–response analysis suggested that the risk of depression decreased by 8% (RR = 0.92, 95% CI = [0.87, 0.97], p = 0.002) for each cup/day increment in coffee intake. And then evidence of a nonlinear association was found between caffeine consumption and depression, the risk of depression increased faster and the association became significant when the caffeine consumption was above 68 mg/day and below 509 mg/day.
The mechanisms underlying the association between coffee or caffeine and depression are still not completely determined. There have been several possible biological explanations so far: First of all, coffee is a complex mixture of chemicals that provides significant amounts of chlorogenic acid (Dorea and Da Costa, 2005; Whiteford et al., 2013), nicotinic acid, trigonelline, quinolinic acid, tannic acid and pyrogallic acid. For instance, chlorogenic acid has anti-inflammatory and antioxidant effects (Dos Santos et al., 2006; Natella et al., 2002), and inflammation and oxidation may contribute to the pathophysiology of depression (Behr et al., 2012; Bufalino et al., 2013; McNally et al., 2008). Second, caffeine, as a nonspecific adenosine A1/A2A receptor antagonist, generates psychostimulant effects through modulating dopaminergic transmission(Ferre, 2008; Morelli et al., 2010), and major metabolites of caffeine act on adenosine receptors in the brain (Morelli et al., 2010), which may in turn contribute to lower risk of depression among coffee drinkers. Further studies in understanding the underlying biological mechanisms linking coffee or caffeine consumption and depression are needed.
Between-study heterogeneity is common in meta-analysis because of diversity in population stratification, characteristics of the sample, measurement of coffee/caffeine consumption, variation of the covariates, lengths of follow-up, etc. Thus, we used meta-regression that aimed to explore the potential important causes of the between-study heterogeneity. But our meta-analysis did not find the covariates of sex, sample size, study design or region of study as the important contributors to the between-study heterogeneity of coffee or caffeine and depression. After we conducted the ‘leave-one-out’ sensitive analysis to access the key articles contributed to this between-study heterogeneity of coffee-depression, we found two articles (Park and Moon, 2014; Ruusunen et al., 2010) contributing to the high between-study heterogeneity. After further excluding these articles, no heterogeneity was left, and the result was stable.
As we know, this is the first meta-analysis with dose–response analysis to explore the association between coffee or caffeine consumption and risk of depression. There are a few advantages in our study. To begin with, our study included a large number of participants, reducing sampling error to a great extent, and allowed a much greater possibility of reaching reasonable conclusions. Second, we extracted RRs that reflected the greatest degree of control for potential confounders, increasing the credibility of the results. For example, smoking is a major confounding factor because it is associated with both caffeine intake and depression. The pooled RR for studies adjusted for smoking status was 0.533 (95% CI = [0.293, 0.970]), which did not change substantially. Third, after conducting the subgroup analysis and sensitive analysis, the results showed consistent significant association with the one based on all studies, strongly identifying the association stable. Fourth, we conducted dose–response analyses to explore the relationship between coffee or caffeine consumption and depression quantitatively.
However, there are some limitations in our study too. (1) High between-study heterogeneity existed in the relationship between caffeine consumption and depression due to the limited amount of included articles. (2) Residual confounding could not be ruled out, and the fact that potential confounders adjusted in each study were different might bias the results in either direction, toward exaggeration or underestimation of risk estimates. (3) Our results could also be confounded by some side effects; i.e., if depressed patients ingested less caffeine due to its anxiogenic effect, then there would appear to be a correlation between greater caffeine intake and less depression, especially in the cross-sectional studies. (4) There was a publication bias in the analysis between depression risk and coffee consumption. However, no publication bias was left (p = 0.161) after removing two studies (Park and Moon, 2014; Ruusunen et al., 2010) that had strong effect on heterogeneity, and the results were still stable. (5) The consumption of caffeine was assessed by different methods and depression was diagnosed by diverse criteria, hence these two factors may influence our results.
Conclusion
In summary, results from our meta-analysis indicate that coffee consumption might be associated with depression risk. But the association between caffeine and depression risk deserves further investigation.
Footnotes
Declaration of interest
The author(s) declared no potential conflicts of interest with respect to the research, authorship and/or publication of this article.
Funding
The author(s) disclosed receipt of the following financial support for the research and/or authorship of this article: This study was funded by the National Natural Science Foundation of China (No.31371024).