
Abstract
Objective:
Primary care is an important setting for the treatment of depression. The aim of the study was to describe the accuracy of unassisted general practitioner judgements of patients’ depression compared to a standardised depression-screening tool delivered via touch-screen computer.
Method:
English-speaking patients, aged 18 or older, completed the Patient Health Questionnaire-9 (PHQ-9) when presenting for care to one of 51 general practitioners in Australia. General practitioners were asked whether they thought the patients were clinically depressed. General practitioner judgements of depression status were compared to PHQ-9 results.
Results:
A total of 1558 patients participated. Twenty per cent of patients were identified by the PHQ-9 as being depressed. General practitioners estimated a similar prevalence; however, when compared to the PHQ-9, GP judgement had a sensitivity of 51% (95% CI [32%, 66%]) and a specificity of 87% (95% CI [78%, 93%]).
Conclusions:
General practitioner unassisted judgements of depression in their patients lacked sensitivity when compared to a standardised psychiatric measure used in general practice.
Introduction
Depression is a highly prevalent condition affecting approximately 350 million people worldwide (World Health Organization, 2012). Around 76% of people seeking help for depression will present to their general practitioner (GP) (Parslow and Jorm, 2000). Given that most GPs do not use standardised psychiatric instruments to assess depression in their patients (Baik et al., 2010), their ability to accurately assess this largely modifiable illness, unassisted, is critical. Detection of depression in the primary care setting presents challenges for GPs as patients often present with undefined or somatic illness (Tylee and Gandhi, 2005).
How accurate is GP unassisted diagnoses of depression?
A meta-analysis of 41 studies indicated that GPs’ unassisted diagnoses of depression among primary care patients agreed with diagnoses from structured interviews in 47% of cases (Mitchell et al., 2009). Of the included studies, 19 assessed sensitivity and specificity of GP diagnosis, giving an average of 50% for sensitivity and 81% for specificity (Mitchell et al., 2009). GP accuracy of detection of depression also varies across countries. A meta-analysis reported that GPs in The Netherlands were significantly better at case finding than those in the USA and Australia (Mitchell et al., 2011). However, three of the four Australian studies were specific to older patients (Bowers et al., 1990; O’Connor et al., 2001; Pond et al., 1994). The other study used GP judgement of psychological problems as the benchmark for caseness, which may not be appropriate given the low sensitivity and specificity reported above (Wilhelm et al., 2008).
Issues in detection of depression by GPs
GP judgements about the presence of depression are likely to result in some false negatives and some false positives (Gilbody et al., 2006; Klinkman et al., 1998). While some degree of inaccuracy is inevitable with such judgements or with any screening test (Williams et al., 2002), there are a range of implications that need to be considered where the rates of false positives and/or false negatives are high.
Consequences of a true low rate of appropriate detection of depression by GPs
Low sensitivity of accurate GP identification of depression can lead to appropriate treatment not being offered to those who may benefit from treatment. On the individual level, untreated depression may result in increased morbidity due to lack of energy, impaired cognitive focus and adverse effects on an individual’s social, work or study, and home life (Slade et al., 2009). However, depression is a largely treatable condition, with a number of evidence-based pharmacological and non-pharmacological treatments available (Cuijpers et al., 2008). At the healthcare system level, the under-detection, and subsequent under-treatment, of depression leads to an increased burden on services, as those suffering from depression are more likely to present for medical treatment for both mental and physical issues (Simon et al., 1995). Studies in the primary care setting have found a 50–75% increase in healthcare costs in depressed patients compared to non-depressed patients (Simon et al., 2000; World Health Organisation, 2001). At the community level, depression is associated with loss of productivity and time off work, a high burden on caregivers, relationship breakdown and unemployment leading to dependence on government benefits (Beck et al., 2011).
Low specificity in GP screening for depression leads to people without depression being diagnosed with depression. Such stereotyping may be reflected in GPs more frequently diagnosing female, older and racial minority patients as depressed when they are not. The consequence of over-diagnosis of depression creates an unwarranted treatment burden at the healthcare system level, wasting resources and health services. Over-diagnosis contributes to unnecessary increased dependence on community services and benefits by well patients who have been wrongly diagnosed with depression as well as potential iatrogenic effects of un-needed treatments.
The effect of prevalence of depression on GP accuracy of detection
The prevalence of depression in the general practice setting has been reported to range between 10% and 23% (Mitchell et al., 2009), depending on the measures used. The base prevalence has implications for the interpretation of indicators of test accuracy. For example, positive predictive value (PPV) refers to the proportion of positive test results which reflect the true presence of depression; while negative predictive value (NPV) refers to the proportion of negative tests that reflect the true absence of depression (Altman and Bland, 1994). These values vary with the prevalence of the condition in the setting in which the test is administered, with PPV low and NPV high when the prevalence of the condition is low (Altman and Bland, 1994). In contrast, likelihood ratios (LRs) compare the probability of a positive (or negative) test result in those with and without the condition of interest. The LR gives an indication of the diagnostic value of the test independent of the prevalence of the condition, with an LR greater than 1 indicating that the test has diagnostic value (McGee, 2002). Therefore, it is useful to consider LRs in addition to PPV, NPV, sensitivity and specificity when evaluating the accuracy of GP assessments of depression.
Possible reasons for apparent misclassification
There are reasons why an apparent failure to detect or classify depression may not necessarily reflect a genuine problem in clinical practice. Within the Australian healthcare system patients have a choice of GPs and can attend multiple providers. Patients may choose to attend one GP, or a specialist, for mental health care – and another or others for other health conditions. They may choose not to divulge depressive symptoms to the second group of providers. Although this may lead to problems with care coordination, it is not necessarily a sign of inadequate clinical care.
Many of the diagnostic tools have been validated against diagnoses of major depressive disorder in the Diagnostic and Statistical Manual of Mental Disorders, Fourth Edition (DSM-IV) (American Psychiatric Association, 2000). However GPs may use a label of depression to refer to various other instances of depressed mood requiring attention; these may include bereavement, subthreshold disorders, adjustment disorders, depressed mood secondary to a medical condition, substance-induced mood disorder and dysthymia. Given that all of these are causes of depressed mood requiring clinical attention, the application of a label of clinical depression may not be a cause for particular concern in terms of compromising proper clinical care. GPs also may apply a diagnosis of depression where the disorder is currently in partial or full remission, perhaps on account of active treatment by the GP themselves. Further, complex presentations with prominent somatic symptoms, or comorbidity with other medical or psychiatric conditions may hinder accurate diagnosis of depression in the primary care setting (Wilhelm et al., 2008). Each of these could be a cause of disagreement between GP judgements and standardised assessments of depression. In addition to these substantially spurious causes of misclassification, there also is the intrinsic misclassification rate of any questionnaire-based instrument.
How has previous research been conducted?
Previous studies have compared the accuracy of GP judgements of depression with standardised tools or structured interview, or through medical record audit (Freeling et al., 1985; Wilhelm et al., 2008). Studies that involve significant temporal separation between the assessment of patients by GPs and the use of the standardised tools give rise to the possibility that there is a change in the course of depression between the two time points. Further, medical records have been shown to be inaccurate or incomplete (Joling et al., 2011; Mitchell et al., 2011). Other studies have asked GPs to provide an assessment of a patient’s depression status after a consultation (Hanel et al., 2009). This may promote response bias in GPs by encouraging specific recall of depression indicators, increasing detection as a result of ‘cueing’ or sensitising GPs to depression symptoms (Joling et al., 2011). The present research sought to overcome this limitation by asking GPs to assess patients’ depression with a range of other health risk factors included in the assessment to minimise response bias. Specifically, we aimed to assess indicators of screening properties of GP assessment of depression compared to a standardised depression screening tool (The Patient Health Questionnaire (PHQ-9)). Variability in sensitivity across GPs in the detection of depression compared to the PHQ-9 was also assessed.
Methods
Design and procedure
A cross-sectional survey was conducted with data collection from 51 GPs in three different urban regions within two states of Australia. Full details of the sampling and recruitment of practices have been reported elsewhere (Yoong et al., 2012). In summary, practices in a defined geographical area were approached randomly until four from within an area each agreed to participate. Practices were eligible if two or more full-time equivalent GPs agreed to participate. Walk-in and solo practices were excluded. Patients were eligible to participate if they were aged 18 years or older, had sufficient English to complete the survey, and were presenting for general practice care. Patients unable to provide informed consent or complete the survey independently were excluded.
A research assistant approached consecutive eligible patients presenting to reception for their general practice appointment and invited them to participate. Consenting participants completed an electronic survey presented on a touch-screen computer tablet. The survey assessed a range of health risks and took 12 minutes on average to complete. If participants were called into their appointment before completing, they could exit the survey and the completed data were retained.
Patients were asked to provide their name and date of birth to facilitate the linking of survey results to those of their GP’s assessment. GPs were provided with one-page paper and pencil surveys for a consecutive sample of their patients. GPs had the option of completing the surveys at or just after each appointment or at the end of each session. Each survey included the name and date of birth of the participating patient so that the GP knew which patient it corresponded to. GPs were not restricted from consulting their notes in completing the paper survey.
Study measures
Demographic characteristics
Patients were asked to provide information on their age, sex, education, whether or not they were attending the practice for the first time and their main reason for presenting for general practice care.
Depressive symptoms
The PHQ-9 was used to assess depression in patients. The PHQ-9 has been used extensively in the primary care setting and has been found to be brief, accurate and reliable (Gilbody et al., 2007; Spitzer et al., 1999). Scores of 1–4 are classified as minimal depression; 5–9 as mild; 10–14 as moderate; 15–19 as moderately severe; and 20–27 as severe depression (Kroenke et al., 2001). For the purpose of this study, a score of 10 or above was used to classify participants as ‘depressed’. A score of ≥ 10 on this scale has been shown to have a sensitivity of 88% and specificity of 88% for major depression in the context of a pre-test probability of 7%, when compared against a mental health professional assessment (Kroenke et al., 2001).
GP assessment of patient health status
GPs were asked to complete a checklist for 35 of their patients. The checklist asked if the patient had the following health risk factors: current cigarette smoker, obesity, clinical depression, risky alcohol consumption, inadequate physical activity and whether the patient was up to date with recommended screening including mammography, cervical cancer and bowel cancer screening and cholesterol, blood pressure and blood sugar tests. Response options were ‘yes’, ‘no’ and ‘unsure’. A ‘not applicable’ option was also available for screening tests not indicated for the patient’s age and/or sex. Only results pertaining to GP assessment of depression are presented here.
Statistical analysis
Demographic characteristics of patients and GPs are presented using frequency distributions for categorical measures and means and standard deviations for continuous measures. Where GPs reported being unsure of whether they thought the patient was depressed, this was coded as not depressed. Sensitivity, specificity, positive and negative predictive power and LRs, with 95% confidence intervals (95% CIs) (Rodríguez-Moranta et al., 2006) of GP assessment relative to the PHQ-9 were calculated. The sensitivity and specificity for individual GPs were also generated and summarised. All analyses were conducted using STATA 11.0 and 95% CIs were adjusted for clustering of patients within GPs using the svy jackknife command.
This study aimed to obtain 1200 surveys from participating GPs. Assuming a design effect of approximately 1.2 (for correlation of outcomes among patients within GPs), this would provide an effective sample size of approximately 1000. Assuming that the estimated prevalence of depression was approximately 15%, based on previous studies in Australian general practice, this would enable the estimation of sensitivity of GP detection of depression with a precision of approximately 8% and specificity with a precision of approximately 3.5%.
Ethics approval
Full ethical approval was obtained from the University of Newcastle (H-2009-0341), the University of New South Wales (HREC09393/UN H-2009-0341) and Monash University (2009001860) Human Research Ethics Committees.
Results
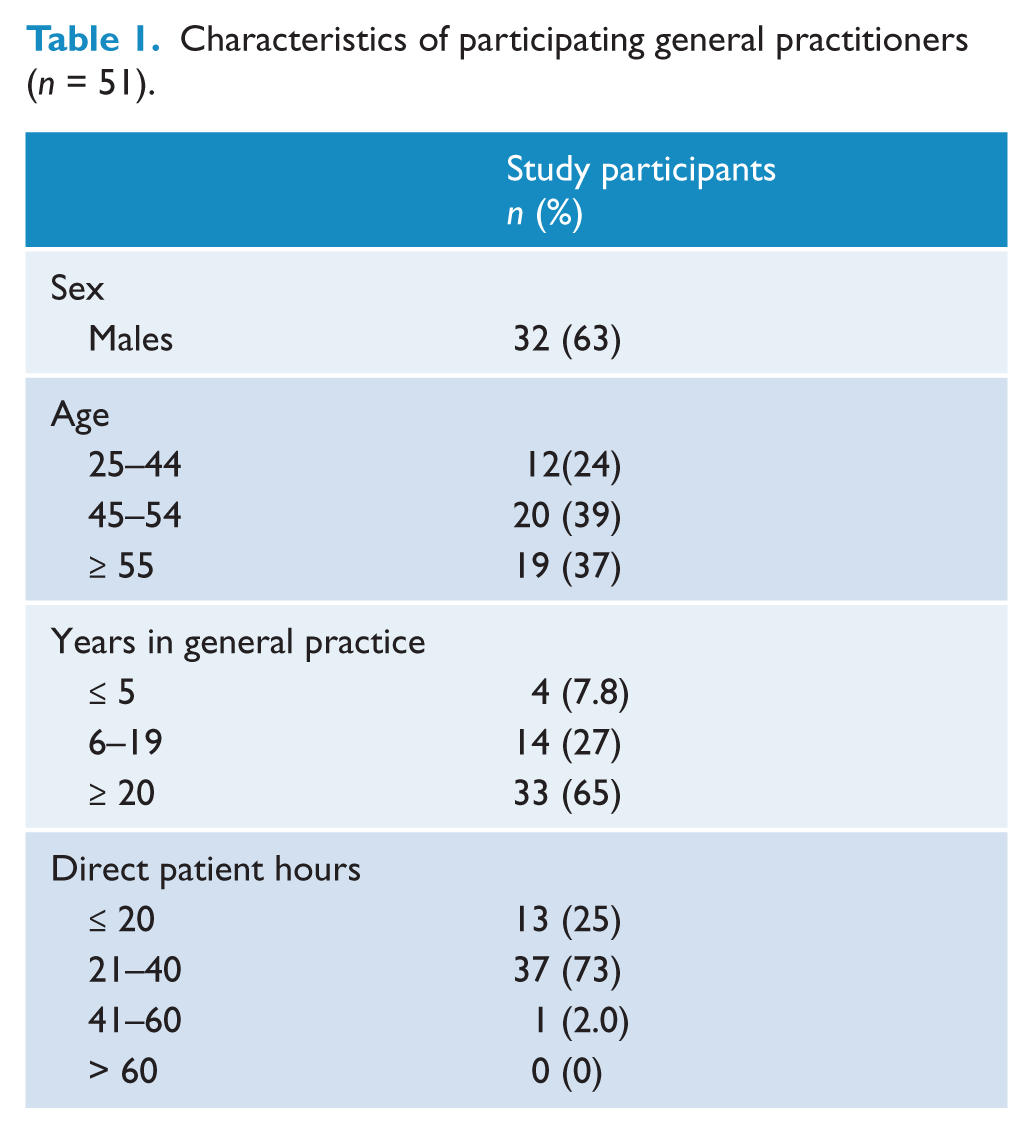
Forty-eight practices were approached to participate in the study, with 12 consenting (response rate 25%). A total of 53 GPs from participating practices consented to participate, with 51 GPs completing at least one survey. The characteristics of participating GPs are shown in Table 1 and are in line with average Australian GP workforce statistics (Britt et al., 2011; Department of Health and Aging, 2011). This study was conducted as part of a larger study where 4079 patients (86%) consented to participate in the study. There were no significant differences in the sex of consenters (39% males) and non-consenters (41% male; χ2 = 0.5211, df = 1, p = 0.5).
Characteristics of participating general practitioners (n = 51).
GPs completed surveys for 1645 patients, with an average of 33 surveys per GP (minimum seven, maximum 53). GPs were unsure of the depression status of 91 patients. The sensitivity and specificity values for two GPs could not be calculated as one GP indicated being unsure of the depression status of all patients and one GP did not think that any of the presenting patients were depressed. Thus, final analyses present results from 49 doctors on 1558 patients. The characteristics of participating patients are shown in Table 2.
Characteristics of participating patients (n = 1558).
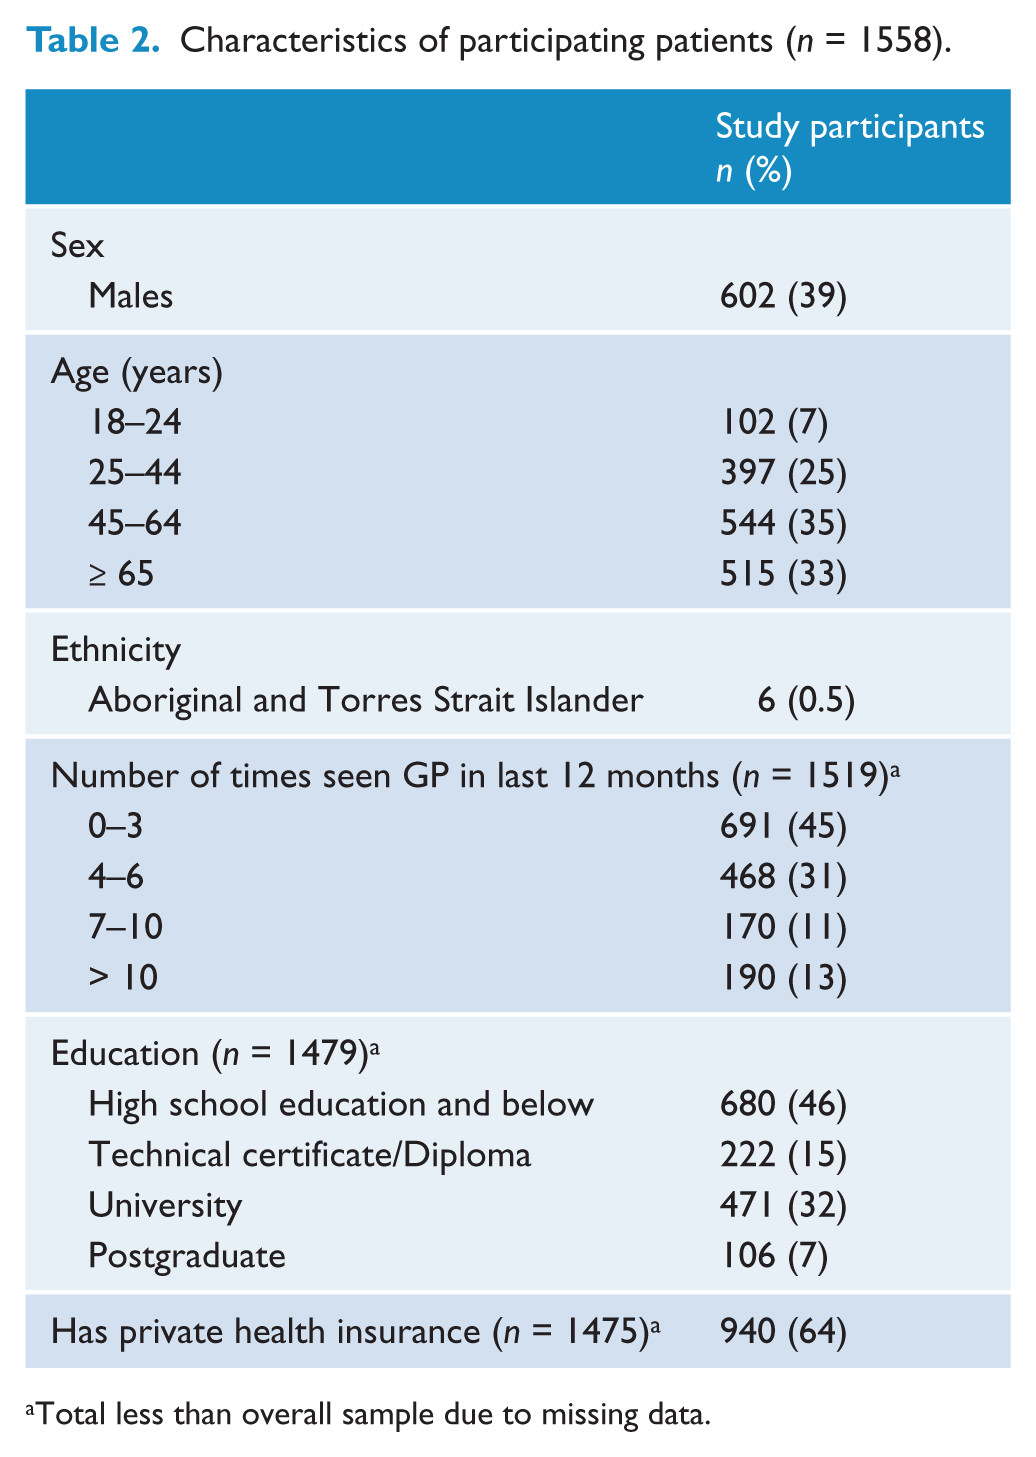
Total less than overall sample due to missing data.
GP assessment compared with the PHQ-9 regarding classification of patients as depressed or non-depressed
GP-identified point prevalence of clinical depression was similar to patient-reported point prevalence of depression on the PHQ-9 (20%). However, of those who were identified as depressed on the PHQ-9, only 51% (95% CI [32%, 66%]) were correctly identified as depressed by their GPs (sensitivity) (see Table 3). When compared to a patient identified as not depressed based on the PHQ-9, GP assessment of no depression was 87% (95% CI [78%, 93%]) (specificity). In this sample, the PPV was 47% (95% CI [30, 62]) and NPV was 88% (95% CI [73, 97]). Positive LR was 3.8 and negative LR 0.57.
GP assessment of clinical depression compared to patient self-report of depression on PHQ-9.
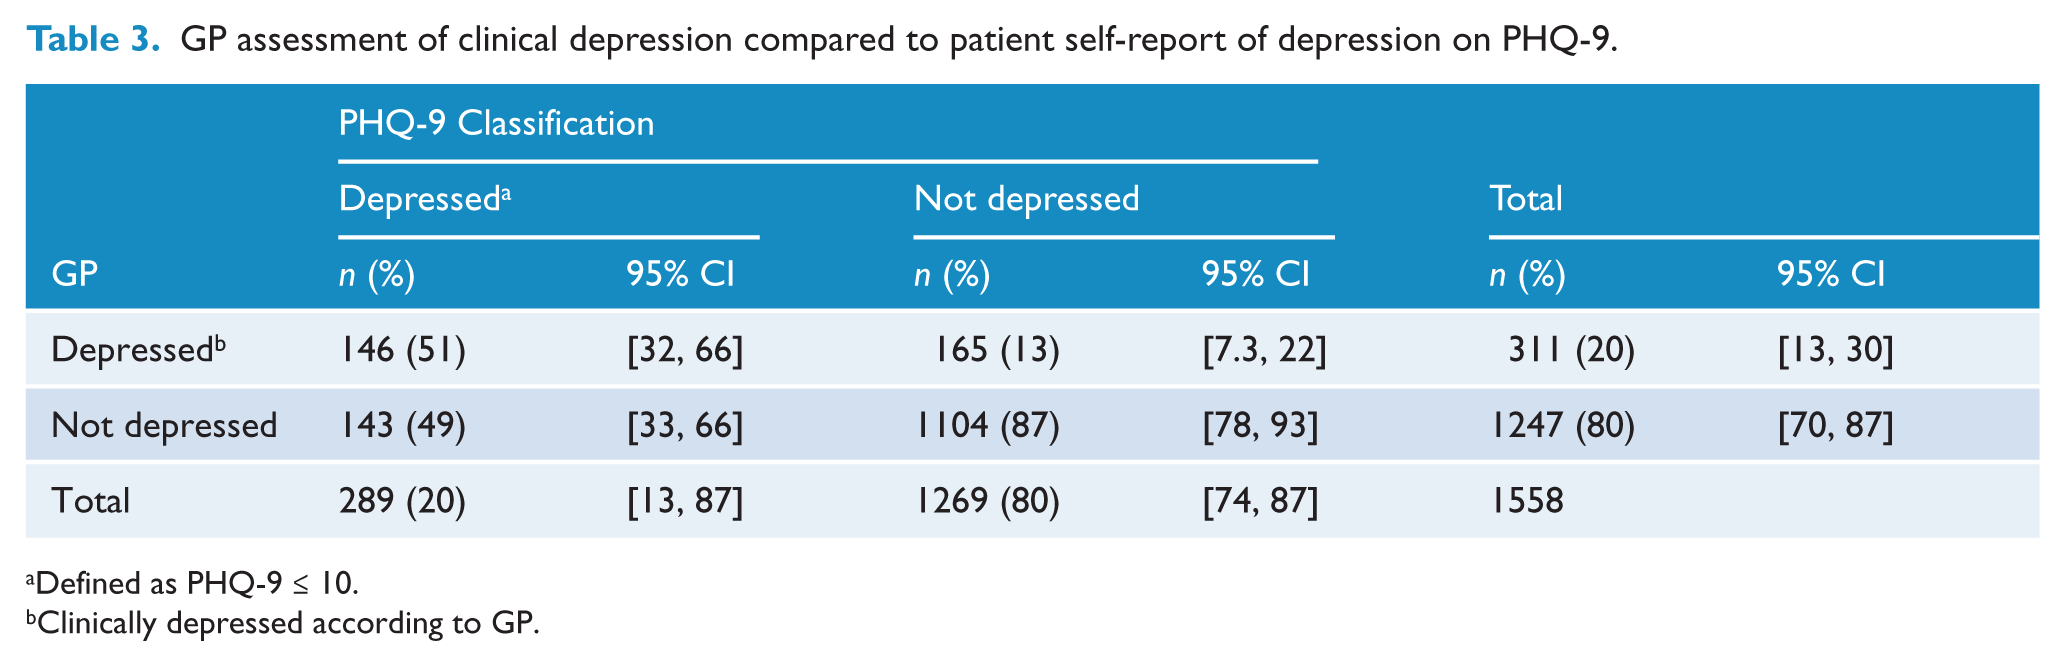
Defined as PHQ-9 ≤ 10.
Clinically depressed according to GP.
Variation in GP assessment
GPs’ sensitivity scores varied widely, with 23% (95% CI [12%, 37%]) (n = 11) of GPs having a sensitivity of 30% and below, 23 (47%; 95% CI [33,62]) with a sensitivity of more than 30% but less than 70%, and 15 (31%; 95% CI [18%, 45%]) with a sensitivity of 70% and above. Mean sensitivity scores were 52% (95% CI [37%, 67%]). In terms of specificity, the majority of GPs had a value of ≥ 80% (n = 41; 84% (95% CI [70%, 93%]). Mean specificity scores were 86% (95% CI [73%, 94%]).
Discussion
Early detection and treatment of depression is important to maximise patient wellbeing and to reduce unnecessary suffering. Therefore, the accuracy of detection of depression in the primary care setting is important to establish.
Accuracy of GP assessment compared to PHQ-9
Interestingly, a 20% prevalence of depression was reported by both GPs and the PHQ-9. Despite the similar prevalence estimate, the moderate sensitivity of GPs in detecting depression compared to the PHQ-9 indicates that different groups of people were identified as depressed by GPs and by the PHQ-9. It appears that a substantial proportion of those who are classified as depressed by the PHQ-9 are not identified as such by their GPs. GP assessments were highly specific (87%), but relatively poor in terms of sensitivity (51%). This means that in only 13% of cases did GPs give a diagnosis of depression to a patient who was not classified as depressed by the PHQ-9. However, GPs gave a diagnosis in only about half the cases where the PHQ-9 score indicated possible depression. Our findings regarding the sensitivity and specificity of GPs’ assessment for depression were similar to that reported in a meta-analysis of previous studies examining the accuracy of unassisted GP diagnosis of depression against a clinical interview (pooled analysis sensitivity of 50% and specificity of 81%).
There was variation between individual GPs in sensitivity, indicating that some GPs are more accurate at detecting depression than others; however, the small number of GPs prevented the examination of characteristics which may have contributed to this difference.
Implications of the results
The low sensitivity and PPV identified in this study highlight the substantial disagreement between GP assessment of depression and PHQ-9 assessment, suggesting that relying on GP assessment as the basis for identifying and initiating treatment for depression may be insufficient. However, as identified above, there may be multiple reasons for such apparent disagreement. Research on the mental health diagnostic processes of GPs indicates that GPs may have a cautious approach to diagnosis, preferring a watchful waiting approach (Lampe et al., 2012). This may reflect a problem-based (rather than diagnosis-based) approach to management (Lampe et al., 2012). It is also possible that depression in the primary care setting has a shorter course compared with the specialist setting (Gilbody et al., 2006). This may contribute to disageeements between GP judgements and PHQ assessments.
Implications for individuals
It is of concern that a patient presenting to a GP while suffering from depression as identified by the PHQ-9 seems to have only a 50% chance of being recognised by the GP as having depression. While the various reasons for possible misclassification have been mentioned previously, there is a risk that a substantial part of this is true misclassification and that these individuals may remain untreated and subsequently continue to suffer from the functional impairment and reduced quality of life associated with depression. Of those who suffer from a major depressive episode (15% of the population from high-income countries and 11% from low/middle-income countries) (Bromet et al., 2011), it is estimated that approximately 2.2–2.4% will die by suicide (Australian Institute for Suicide Research and Prevention, 2003). It is therefore important to explore ways to improve rates of accurate diagnosis of depression in primary care.
Implications for the healthcare system
The burden on the individual suffering from undiagnosed depression flows on to the healthcare system via increased demand for health services to treat somatic symptoms of depression. Fifty-nine per cent of cases of depression are rated as severely disabling (Kessler et al., 2003). Improved GP detection of depression and subsequent initiation of treatment in these patients may lead to a significant reduction in demand for health services and a corresponding reduction of health care costs due to improved outcomes and lowered disability. An estimated 10–30% of the burden of depression could be alleviated through the implementation of evidence-based interventions in primary care (Chisholm et al., 2004).
Implications for the community
The societal cost of depression annually has been estimated at over $83.1 billion in the US (Greenberg et al., 2003) and $12.6 billion in Australia (LaMontagne et al., 2010). The majority of these costs are to employers, rather than from health condition-related costs (LaMontagne et al., 2010). The cost to employers of implementing programs targeting the identification and treatment of depression has been shown to be outweighed by improvements in productivity (Hilton et al., 2009; Wang et al., 2007).
What can be done to improve detection of depression in the GP setting?
One way to improve the accuracy of detection of depression in general practice may be to improve education and training in depression detection. However, trials evaluating the effect of GP training have provided no evidence of improved GP detection or patient outcomes (Sikorski et al., 2012; Thompson et al., 2000). Further research examining diagnostic and decision-making processes and the impact of different work settings on such processes may help to further refine and target educational approaches. For example, part-time GPs may experience more pressure to record a diagnosis in order to facilitate continuity of care (Lampe et al., 2012). Similarly, GP life experience (e.g. personal experience of depression) and attitudes towards treatments have been shown to be more strongly associated with treatment choices than access to specialist services and continuing medical education (Dumesnil et al., 2012; Hickie et al., 2001).
The use of standardised depression tools, which have been validated for use in the GP setting, could potentially improve the detection of depression in this setting. However, time and resources needed to implement routine screening have been reported as significant barriers in busy practices (Mitchell and Coyne, 2007; Mitchell et al., 2008).
The use of a mobile computer tablet provides a method by which data can be instantly recorded, scored and fed into patients’ electronic medical records. This method has been shown to be acceptable by patients and GPs (Bliven et al., 2001). Thus, delivery of a patient self-assessment depression question via computer tablet has the potential to alleviate several barriers to standard screening procedures.
Despite the potential for this method to assist in the detection of depression, evidence for clinical benefits of screening are needed before such systems are implemented. A Cochrane review found no benefit of screening for depression on patient outcomes at 6–12-month follow-up (Gilbody et al., 2006). One potential risk of screening for depression is that when depression is detected, there are insufficient resources to provide appropriate treatment and follow-up care (US Preventative Services Task Force, 2009). Because the prevalence of depression is low in the primary care setting, PPV is also low (Altman and Bland, 1994), increasing the likelihood of making an incorrect diagnosis of depression (Summerton, 2004). This also leads to the risk that false positives identified through screening will result in unnecessary treatments and uncecessary exposure to the risk and costs associated with such treatments (Gilbody et al., 2006; Lampe et al., 2012).
Limitations and strengths
A strength of this study was that GPs were presented with a checklist, including a range of health risk factors and screening behaviours. This reduced the likelihood that GPs were ‘cued’ to assess for symptoms of depression and thus provides a less biased indication of GP judgement. It is possible that practices and GPs participating within the present study were not representative of the broader general practice setting in Australia, given that only 12 practices were included in the study. However, a very high patient consent rate (86%) was achieved, indicating that patients are likely to have been representative of those presenting for care in participating practices. A key limitation of this study was that GP assessment of depression was compared to the PHQ-9 classification of depression, rather than a gold standard clinical structured psychiatric diagnostic interview. Despite this, the current study provides a good indication of the validity of GP assessment of depression in their patients as the PHQ-9 has been shown to have high sensitivity and specificity compared to clinical interview (Kroenke et al., 2001). These characteristics, combined with its brevity, make the PHQ-9 a promising candidate for use in the primary care setting. The cross-sectional design of this study allowed for data collection at a single time point. As patients consult their GP on average five times every 12 months, a longitudinal design would allow for the assessment of GP detection over subsequent consultations, which may reveal greater sensitivity of depression detection.
GPs in this study performed well in identifying patients who do not have depression as evidenced by high specificity; however, performance was poor in regard to identifying all patients who do have depression. Screening with touch-screen computer tablets in waiting rooms appears to be acceptable to patients and may be useful in supporting GPs in the detection of depressive disorders in primary care.
Footnotes
Funding
This work was supported by a grant from beyondblue and the National Heart Foundation of Australia Strategic Research Partnership (G08S4042).
Declaration of interest
The authors declare that there is no conflict of interest.