
Abstract
Objectives:
The aim of this study was to model estimates related to (a) the incidence of psychotic disorders and (b) the mortality associated with these disorders based on a large, population-based prevalence study.
Methods:
Data were drawn from the second national survey of adults with psychotic disorders conducted in seven Australian catchment areas during March to December 2010. To generate incidence rate estimates, we identified recent onset cases recruited as part of the prevalence study and then imputed population-based incidence rates using a set of conservative assumptions. Similarly, for mortality rates, we identified individuals who had died after being identified as ‘screen-positive’ for psychosis, but prior to full clinical assessment. Using a set of conservative assumptions, we then used these estimates to infer population-based mortality rates.
Results:
Based on our models, we estimated that the incidence rate for psychotic disorders was 28 cases per 100,000 population. The rate estimates were significantly higher in males than females, with an overall male:female ratio of 1.57:1. Incidence rate estimates peaked in the youngest age group (18–24 years). The adjusted mortality rate estimated during the whole period of observation was 12.5 per 1000 persons, with a standardised mortality ratio of 5.5.
Conclusions:
Using treated prevalence data and observed deaths with appropriate algorithms, we were able to impute incidence and mortality rates for psychotic disorders consistent with the published literature. While the second national survey of psychotic disorders was not designed to identify mortality, our estimates provide a stark reminder of the increased mortality associated with these disorders.
Introduction
Precise estimates of disease frequencies such as incidence, prevalence and mortality are vital inputs to strategies for improving population health. As an example, these frequency measures are essential for generating disability-adjusted life years (DALYs), a metric that provides burden estimates of different diseases and their associated disabilities (Murray et al., 2012). Such estimates are used in a range of public health contexts such as the prioritisation of government funding for health service delivery and care. These measures are also important for risk factor epidemiology (McGrath, 2003). Incidence and prevalence express disease frequencies in different ways: incidence counts the number of new cases per given population per year while prevalence measures the proportion of surviving individuals who manifest a disorder at a specified time (e.g. point prevalence) or during a specified period (e.g. annual prevalence) (McGrath et al., 2004; Saha et al., 2005). While prevalence estimates can be measured with cross-sectional population-based surveys, the direct measurement of incidence for less common disorders (such as psychotic disorders) usually requires a longer recruitment period and/or larger catchment areas. In most settings, incidence studies are more expensive than prevalence studies and present more logistical challenges. Mortality studies are more tractable because many nations have population-based death registers. However, not all nations have readily accessible record-linkage between mental health and death registers (Gale et al., 2012; Morgan and Jablensky, 2010).
As has been demonstrated by the Global Burden of Disease project (Murray et al., 2012), disease frequency measures such as incidence, prevalence, mortality and recovery/remission can be mathematically integrated within a given population (based on a set of reasonable assumptions). In estimating prevalence from incidence, researchers can explore the crude interrelationship between prevalence, incidence and course of illness (prevalence proportion = incidence * course of illness) (Freeman and Hutchison, 1980). Recently, Vanasse et al. (2012) estimated the incidence of schizophrenia using a register-based cohort of affected individuals. Based on prevalent cases identified during a set period of observation, a sliding temporal window was used prior to the first appearance of an individual within the period of observation in order to identify previous admissions. For those with no prior admissions for schizophrenia during the preceding temporal window, these were assumed to be incident cases. Thus, this ‘washout’ method can identify putative incidence cases from mental health registers, and this estimate can be used for the numerator in incidence-related estimates.
Other fields of epidemiology derive incidence rates from cross-sectional prevalence estimates. For example, Hallett et al. (2008) estimated incidence rates in HIV infections using two algorithms from cross-sectional prevalence studies on the HIV epidemics in southern and eastern Africa. The calculation used changes in HIV infection in a cohort observed at two time periods allowing new infections and mortality among infected and non-infected persons. Because of high mortality in HIV, the numerator was the survival cases from infection at earlier ages to the midpoint of the different age groups at the end of the time interval. The denominator was the survival population to the beginning of the interval.
While there are several techniques for estimating incidence rates, in most settings, mortality rates estimates require either follow-up observations or linking outcomes based on population-based death registers.
We had the opportunity to model incidence rates nested within a well-described population-based prevalence survey of individuals with psychotic disorders from the second Australian national survey of psychosis. We also estimated mortality rates from the deaths recorded within the period of observation of the survey, and compared the rates with mortality rates of the general population. Mindful that the original study was not designed to directly examine these measures, these estimates should be treated cautiously.
Methods
Data were drawn from the second Australian national survey of psychosis (SHIP: Survey of High Impact Psychosis). The full details of the methodology have been described elsewhere (Morgan et al., 2011). In summary, the study was a multicentre, cross-sectional survey covering a population of 1.5 million people aged between 18 and 64 years (covering approximately 10% of the Australian population in this age group). A two-phase design was used. In Phase 1, screening for psychosis took place in public specialised mental health services and in non-government organisations supporting people with a mental illness. This phase was based on individuals presenting to target sites during a ‘census period’, based on a census month (March 2010) and the preceding 11 months (based on administrative records). In Phase 2, people who were screen-positive for psychosis (in Phase 1, n =7955) were randomly selected, stratified by age group, and interviewed in 2010. Overall, 1825 were interviewed in Phase 2. The 1-month and 12-month treated prevalences were calculated using the proportion of people in the survey periods who met criteria for a diagnosis of schizophrenia, bipolar, schizoaffective, delusions, depressive psychosis and other psychoses using an appropriately weighted screen-positive sample (International Classification of Diseases, Tenth Revision; ICD-10). Aggregate estimates were obtained by combining prevalence estimates at each site weighted by the proportion of the total population represented by each site adjusted to reflect the age and sex distributions of the Australian population aged 18–64 years. The study was approved by institutional human research ethics committees at each site, and all participants provided written, informed consent.
Algorithm of calculating incidence rate estimates
To generate incidence rate estimates we developed an algorithm based on different durations of psychosis for prevalent cases during the survey period. For our analyses, we used counts of subjects identified for the 12-month prevalence estimates (Morgan et al., 2011). For the purpose of this analysis, we were interested in identifying cases who may have had their onset of the psychotic disorder within 6 months of their contact with the service.
We were able to explore putative incident cases nested within the prevalence survey by applying a set of reasonable assumptions. We derived total duration of psychosis (TDP) from several observed variables: (a) age of onset, as assessed during the formal diagnostic interview using the Diagnostic Interview for Psychosis, (b) date of birth, and (c) age at interview. All potential cases were identified during a set 12-month census period; however, the timing of the follow-up diagnostic interviews varied between sites, with most interviews being completed in the 9 months following the census period. Because we lacked information on when the subject made first contact during the census period, we explored a range of plausible scenarios. For example, a ‘longest case’ scenario was based on the following parameters: (a) an actual onset of just under 6 months prior to their appearance during the census period (thus, just meeting the criteria for incident cases); (b) first contact in the first days of the census period (thus, making contact with services at the start of the 12-month period); and (c) assessed in the last days of the follow-up period (thus, not seen until the last days of the 9-month follow-up period). Based on this scenario, the TDP would be approximately 27 months (i.e. 6 + 12 + 9 = 27). In contrast, a ‘best case’ scenario was based on the following parameters: (a) an actual onset of only 1 month prior to their appearance during the census period (thus, very recent onset incident cases); (b) first contact in the last month of the census period (thus, making contact with services at the end of the 12-month period); and (c) assessed in the first month of the follow-up period (thus, seen the first month of the 9-month follow-up period). Under this scenario, the TDP would be approximately 3 months (i.e. 1 + 1 + 1 = 3). Assuming that these variables were randomly distributed (i.e. there was no systematic bias for the selection of cases during the follow-up period by recency of onset or month of presentation during census period), we based our main analysis on a TDP of 15 months, which is the midpoint TDP between 3 and 27 months. As a planned sensitivity analyses, we also examined estimates based on TDP plus or minus 3 months around 15 months (i.e. 12 and 18 months). Incidence rate estimates were expressed as per 100,000 population.
The denominator population was the corresponding age-matched resident population which was estimated from data provided by the Australian Bureau of Statistics for each catchment area. The same population estimates were used for the calculation of prevalence estimates in the SHIP (Morgan et al., 2011). Population estimates for 2010 were not available at the time of calculation, so growth rates for each stratum in the whole Australian population were applied using 2009 population estimates (Australian Bureau of Statistics, 2011a).
The application of sampling weights derived from Phase 1 to Phase 2 data has been applied according to sex and age strata, and screen status within sites, the same weighting strategy as the main study (Morgan et al., 2011).
Algorithm of calculating mortality rates
While the study was not designed to assess mortality, some individuals who were identified during the census period (i.e. who presented to a mental health site and who were screen-positive for psychosis) were deceased by the time survey staff attempted to contact them for interview during the follow-up period. This information was derived from the medical records and/or their case manager. Cause of death was not available (e.g. suicide, cardiovascular event, etc.), nor were we able to precisely define the date of death (other than to the window during the census period and the end of the follow-up phase). To estimate mortality rates of people with psychotic disorders, we enumerated the total number of deaths by age and sex to constitute the numerator population. The denominator population was defined as the risk set of screen-positive individuals who staff attempted and/or completed contact with during the follow-up period (and thus received feedback on known deaths). Of the original 7955 sample, age- and sex-specific data were available on 6942 screen-positive individuals who met this criterion. In keeping with the models related to incidence estimates, we assumed that the deaths were randomly distributed during the period of observation, and we default the deaths to the midpoint of this period. We then derived annual mortality rates, which were expressed per 1000 population.
Mortality rates for people with psychotic disorders were compared with the all-cause mortality rates of the Australian general population. First, age- and sex-specific all-cause deaths were enumerated as provided by the Australian Bureau of Statistics (2011b). For the denominator, we used the same population estimates that were used in calculating prevalence estimates in the survey provided by the Australian Bureau of Statistics (Morgan et al., 2011). Access to these data allowed us to calculate the standardised mortality ratio (SMR), which compared mortality in people with psychotic disorders versus the age-matched general population. Thus, SMRs are calculated by dividing the observed deaths of people with psychotic disorders by the expected age- and sex-specific deaths of the Australian general population (Australian Bureau of Statistics, 2011b). Wald confidence limits were calculated following Boice and Monson (1977).
Results
Incidence rate estimates
Table 1 shows the incidence rate estimates for ICD-10 psychotic disorders in contact with public specialised mental health services in Australia by age and sex. The overall incidence rate estimate for persons (males and females combined) was 28 cases per 100,000 per year. Of 7955 included participants, we estimated that 387 (male: 237, female: 150) had incident cases of psychotic disorders with a TDP of 15 months or less. The comparable age- and sex-specific prevalence estimates from the main prevalence survey are also provided for comparison in this table.
Incidence rate estimates per 100,000 per year with ICD-10 psychotic disorders, and 12-month treated prevalence estimates (extracted from the survey report).
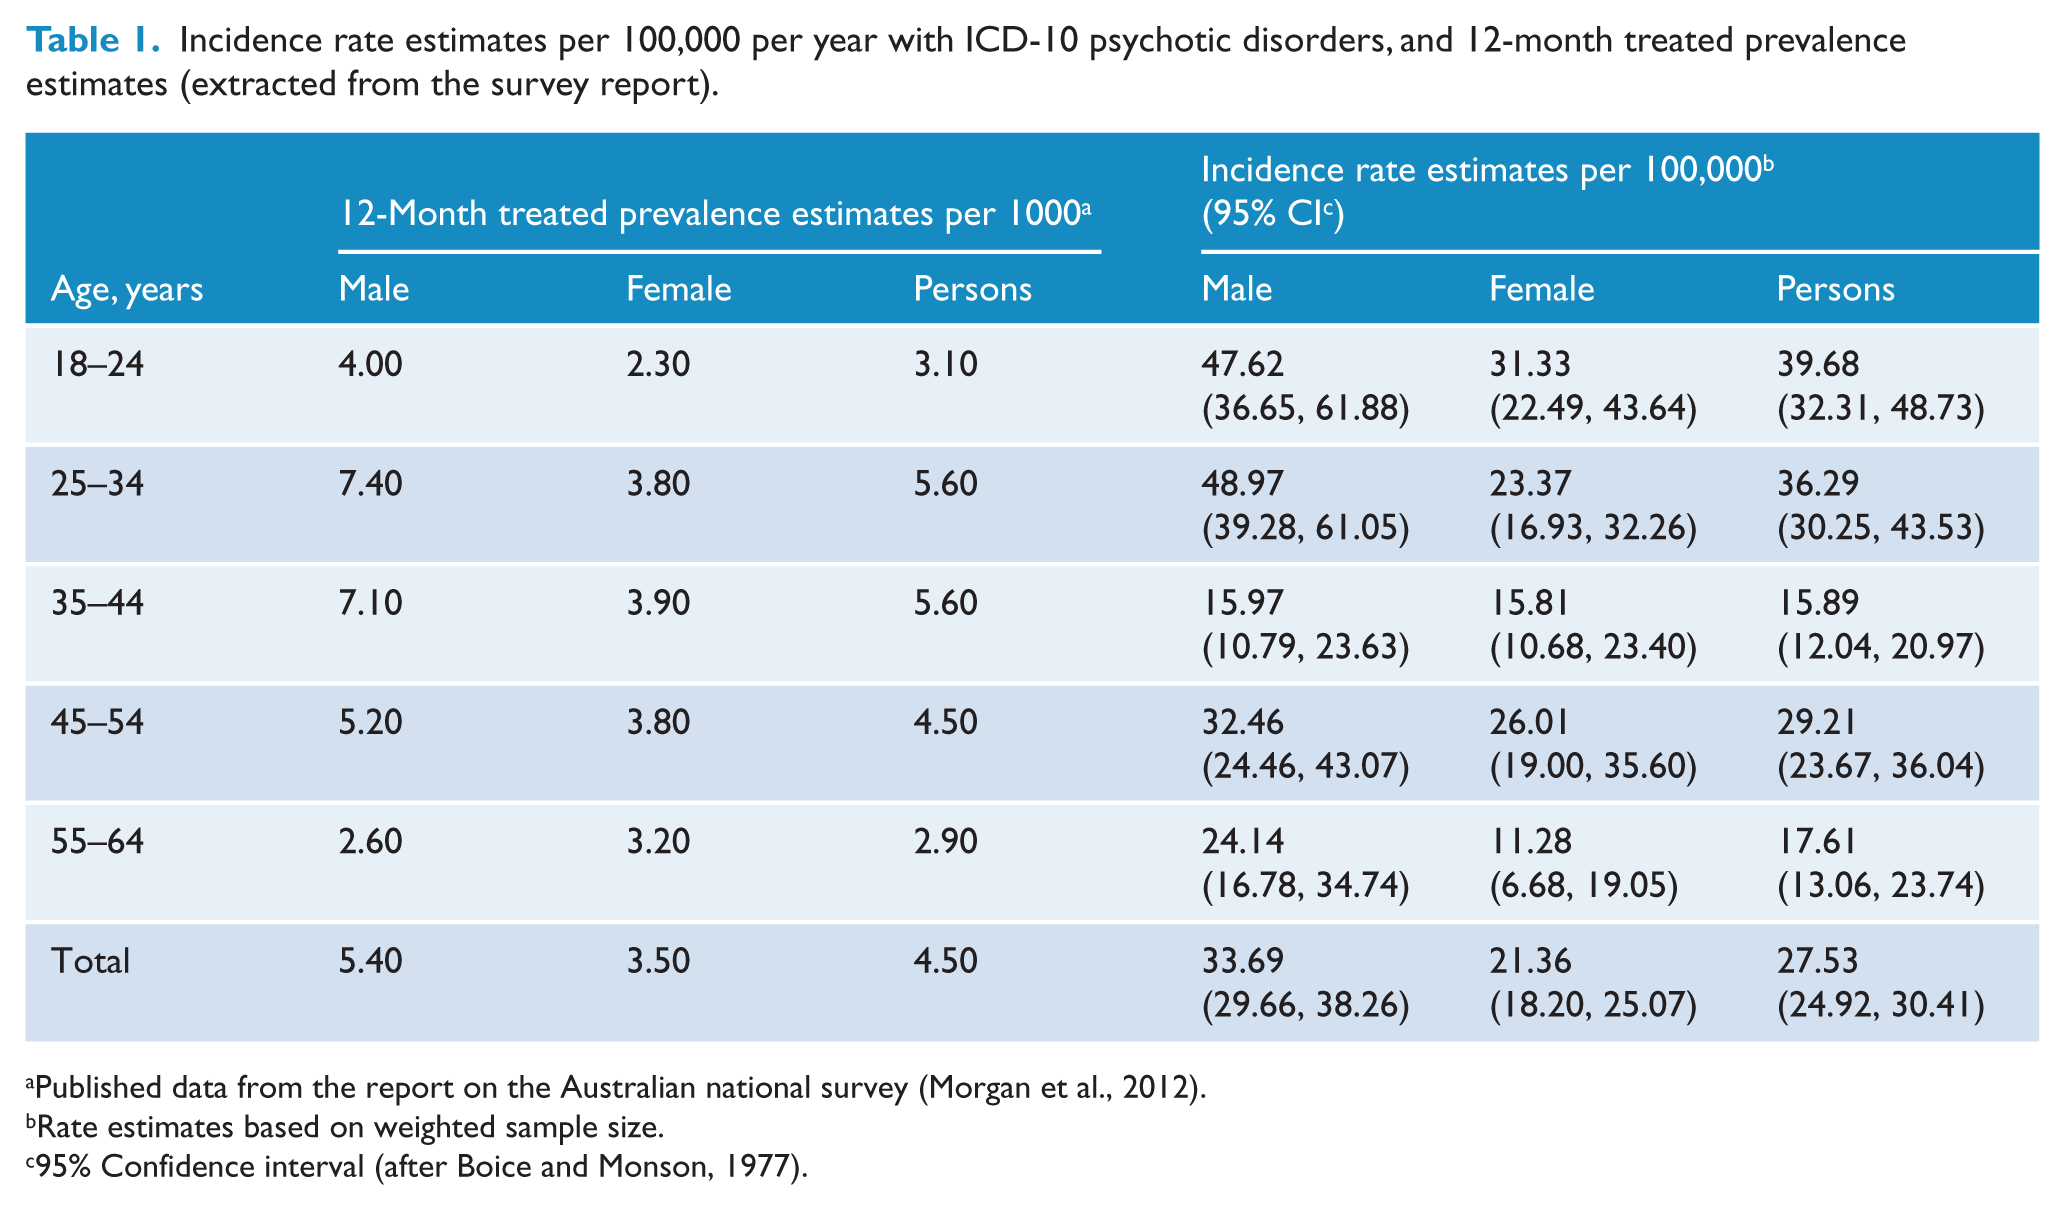
Published data from the report on the Australian national survey (Morgan et al., 2012).
Rate estimates based on weighted sample size.
95% Confidence interval (after Boice and Monson, 1977).
The incidence rate estimates were significantly higher in males than females, with an overall male:female ratio of 1.57:1 (z = 3.44, p < 0.01). Incidence rate estimates were generally higher among younger age groups (18–24 years).
In a planned sensitivity analysis when we repeated the analyses using 3 months plus or minus TDPs, similar patterns of the incidence rate estimates were observed (Table 2). For higher TDPs, there was a slight increase in the incidence rate estimates across the age groups. The rate estimates were much lower when we repeated the analyses using lower DTPs.
Sensitivity analysis: adjusted incidence rate estimates per 100,000 per year with ICD-10 psychotic disorders using two estimates of 12 months and 18 months of Total Duration of Psychosis.
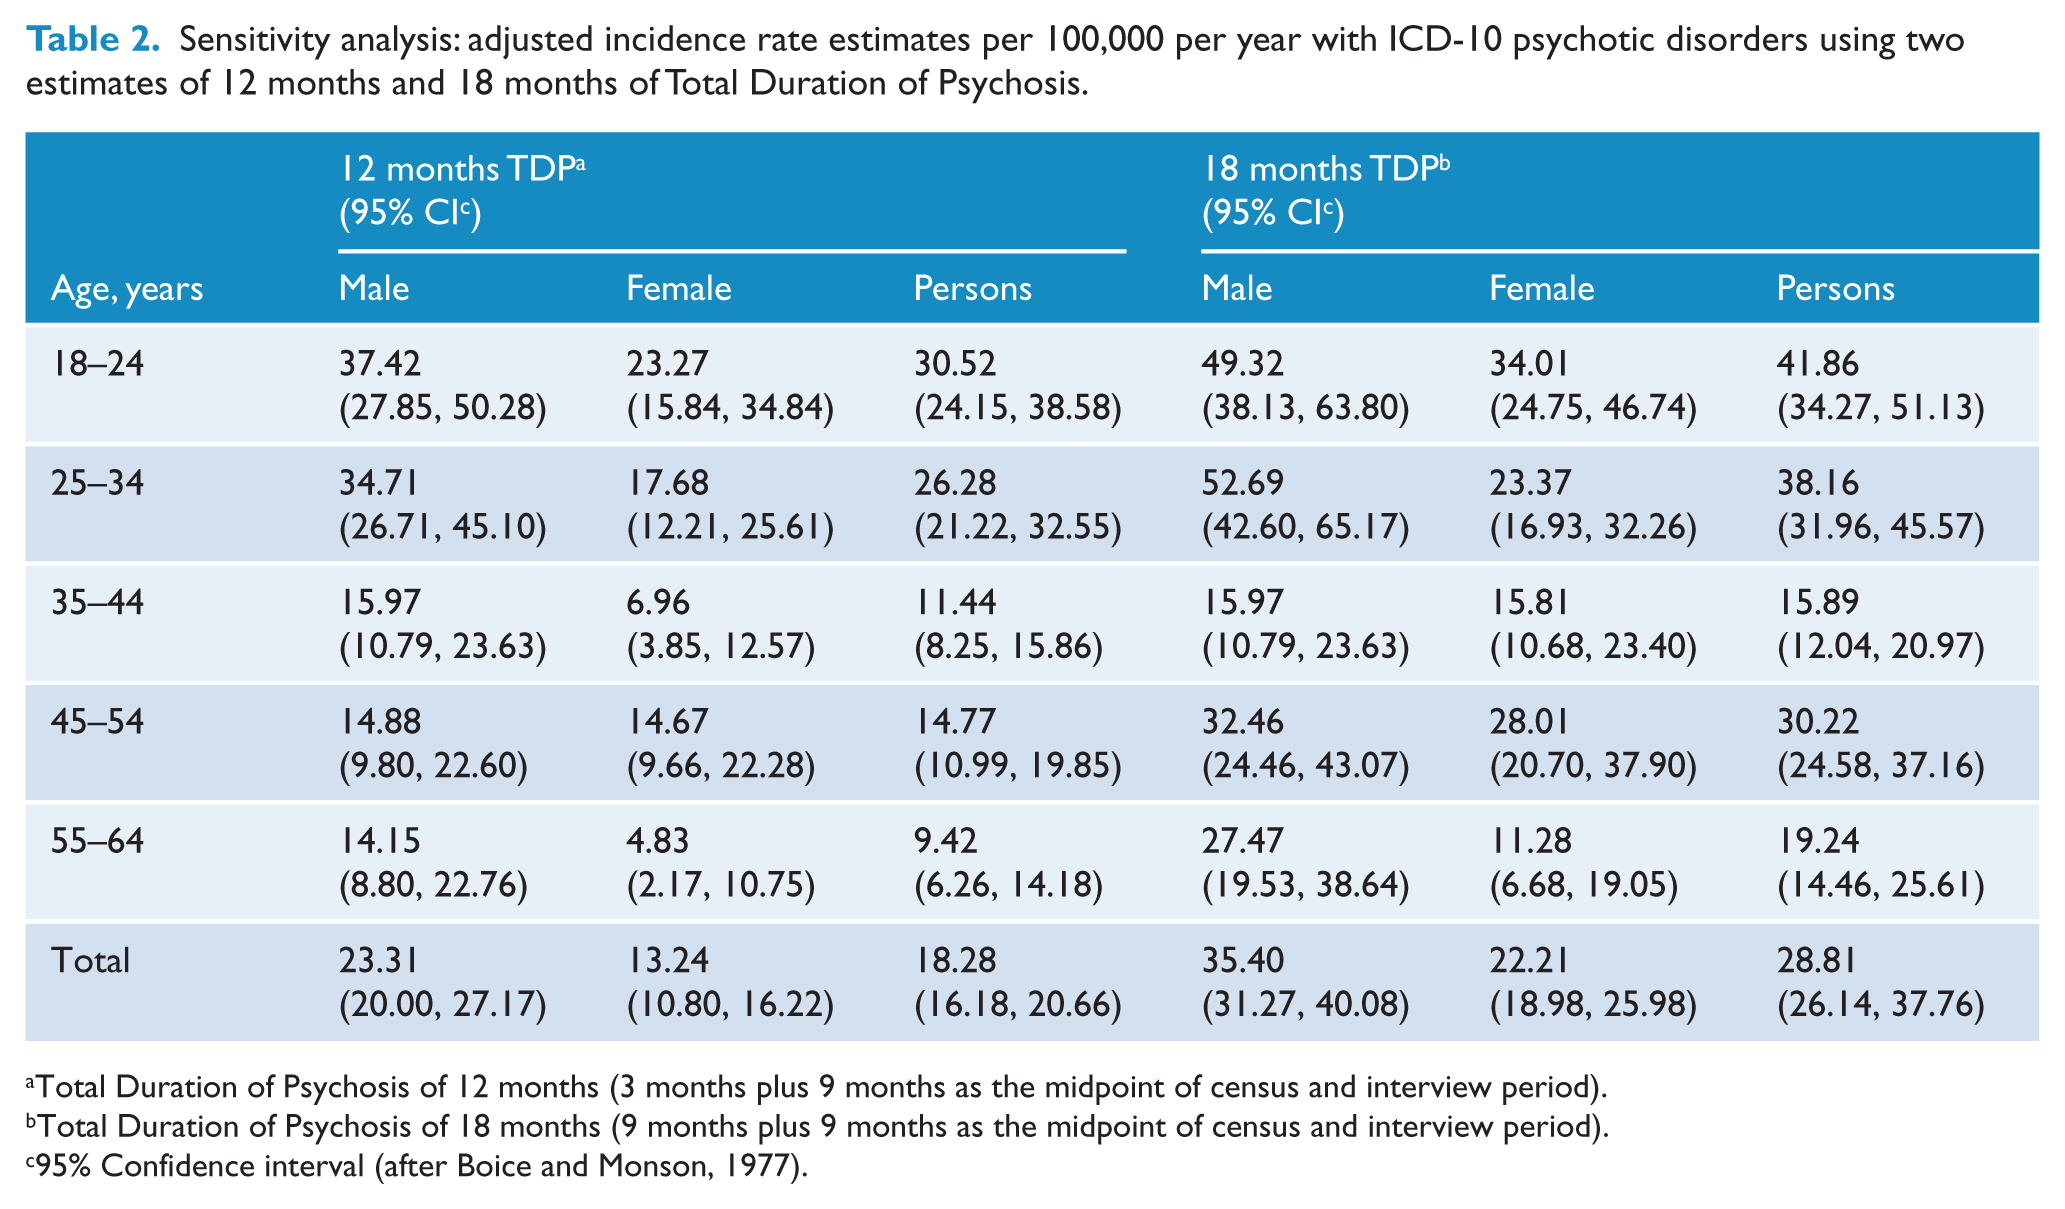
Total Duration of Psychosis of 12 months (3 months plus 9 months as the midpoint of census and interview period).
Total Duration of Psychosis of 18 months (9 months plus 9 months as the midpoint of census and interview period).
95% Confidence interval (after Boice and Monson, 1977).
Mortality rates and SMRs
Those who were in contact from the cohort of 6942, we were made aware that 47 men (1.1%) and 18 women (0.7%) died during the total period of observation. This gives a crude mortality rate of 9.4 per 1000 persons (Table 3). When adjusted for the period of observation (in order to generate annual rates) and weighted to reflect the underlying population structure, the overall mortality rate was 12.5 per 1000 persons. Except in the 25–34 and 18-24 age groups, rates were higher among men than women in all age groups.
Mortality rates per 1000 people with ICD-10 psychotic disorders.
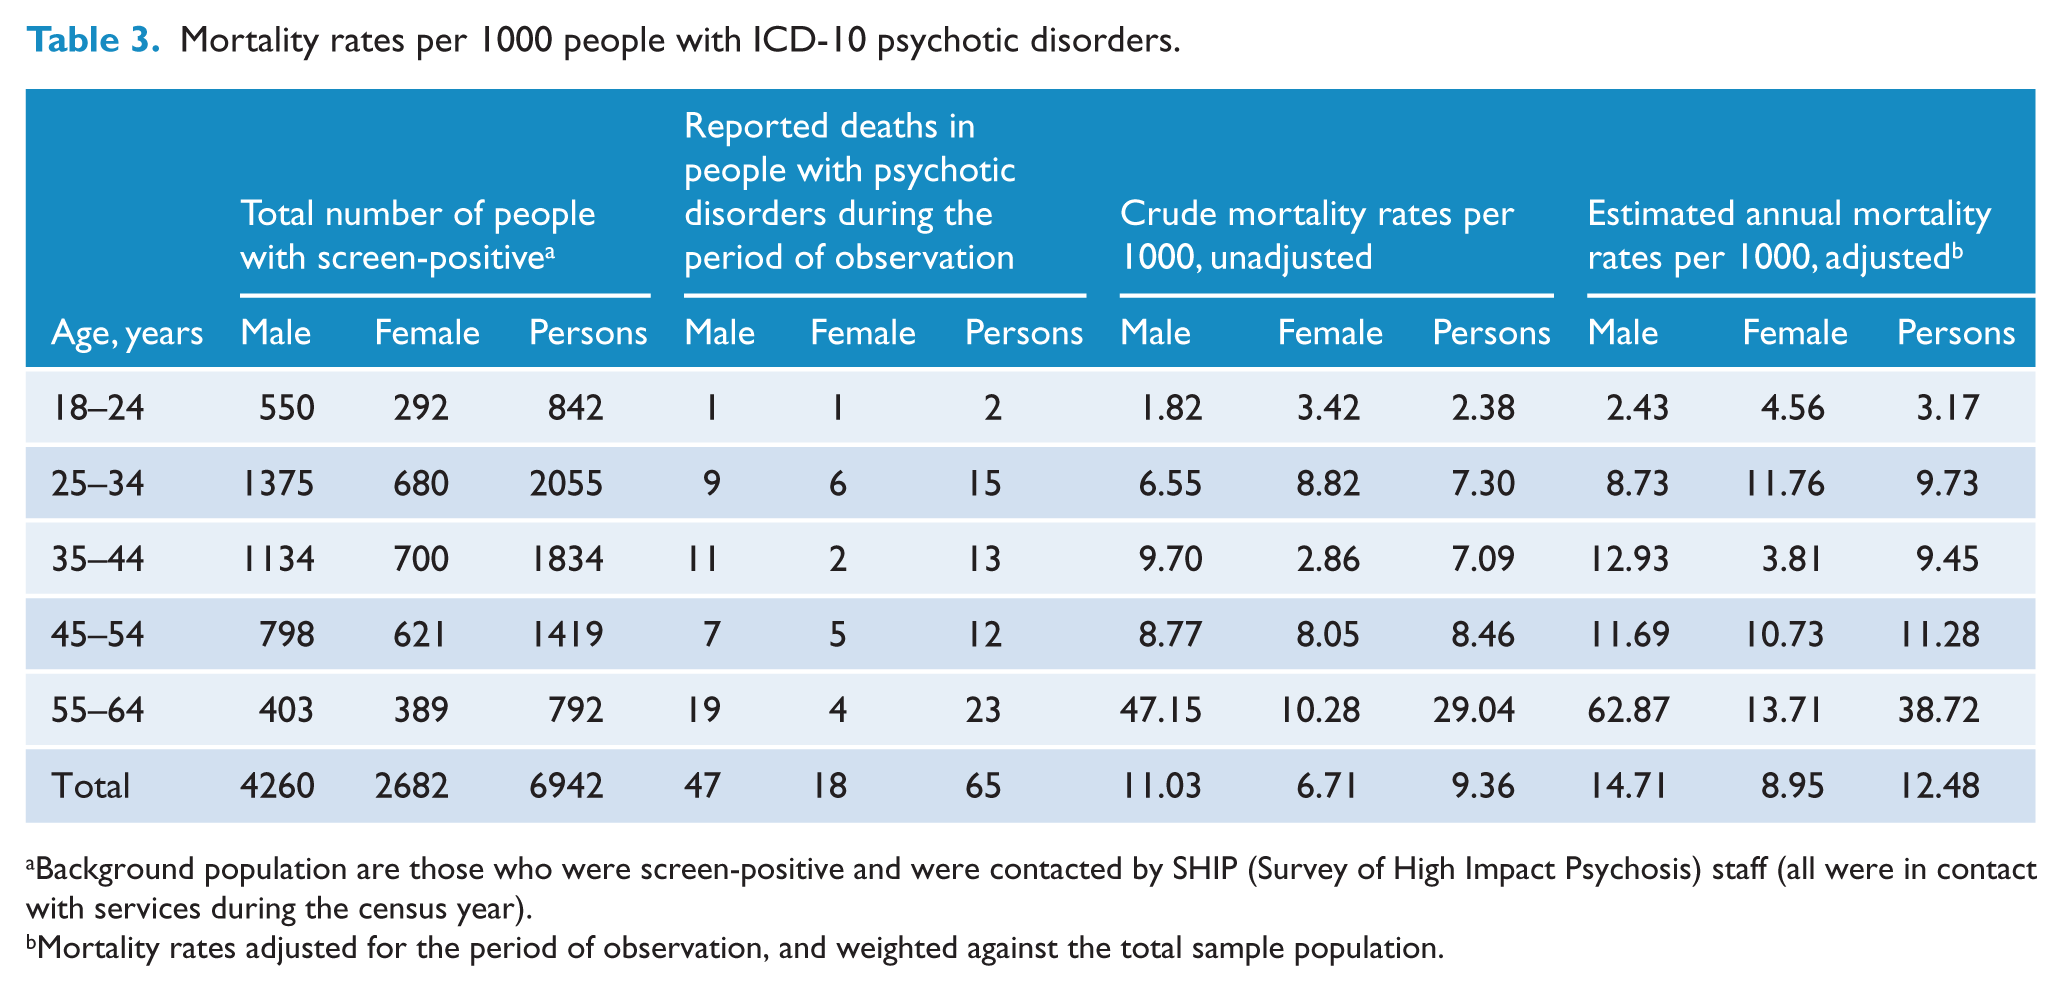
Background population are those who were screen-positive and were contacted by SHIP (Survey of High Impact Psychosis) staff (all were in contact with services during the census year).
Mortality rates adjusted for the period of observation, and weighted against the total sample population.
Table 4 shows the standardised mortality ratio (SMR) for men, women and persons. The total SMR was 5.5, indicating that overall mortality in people with psychotic disorders was more than five times that of the general population. There was no significant difference between males and females, although ratios for males were slightly higher than females.
Observed and expected deaths, and standardised mortality ratios with 95% confidence intervals.
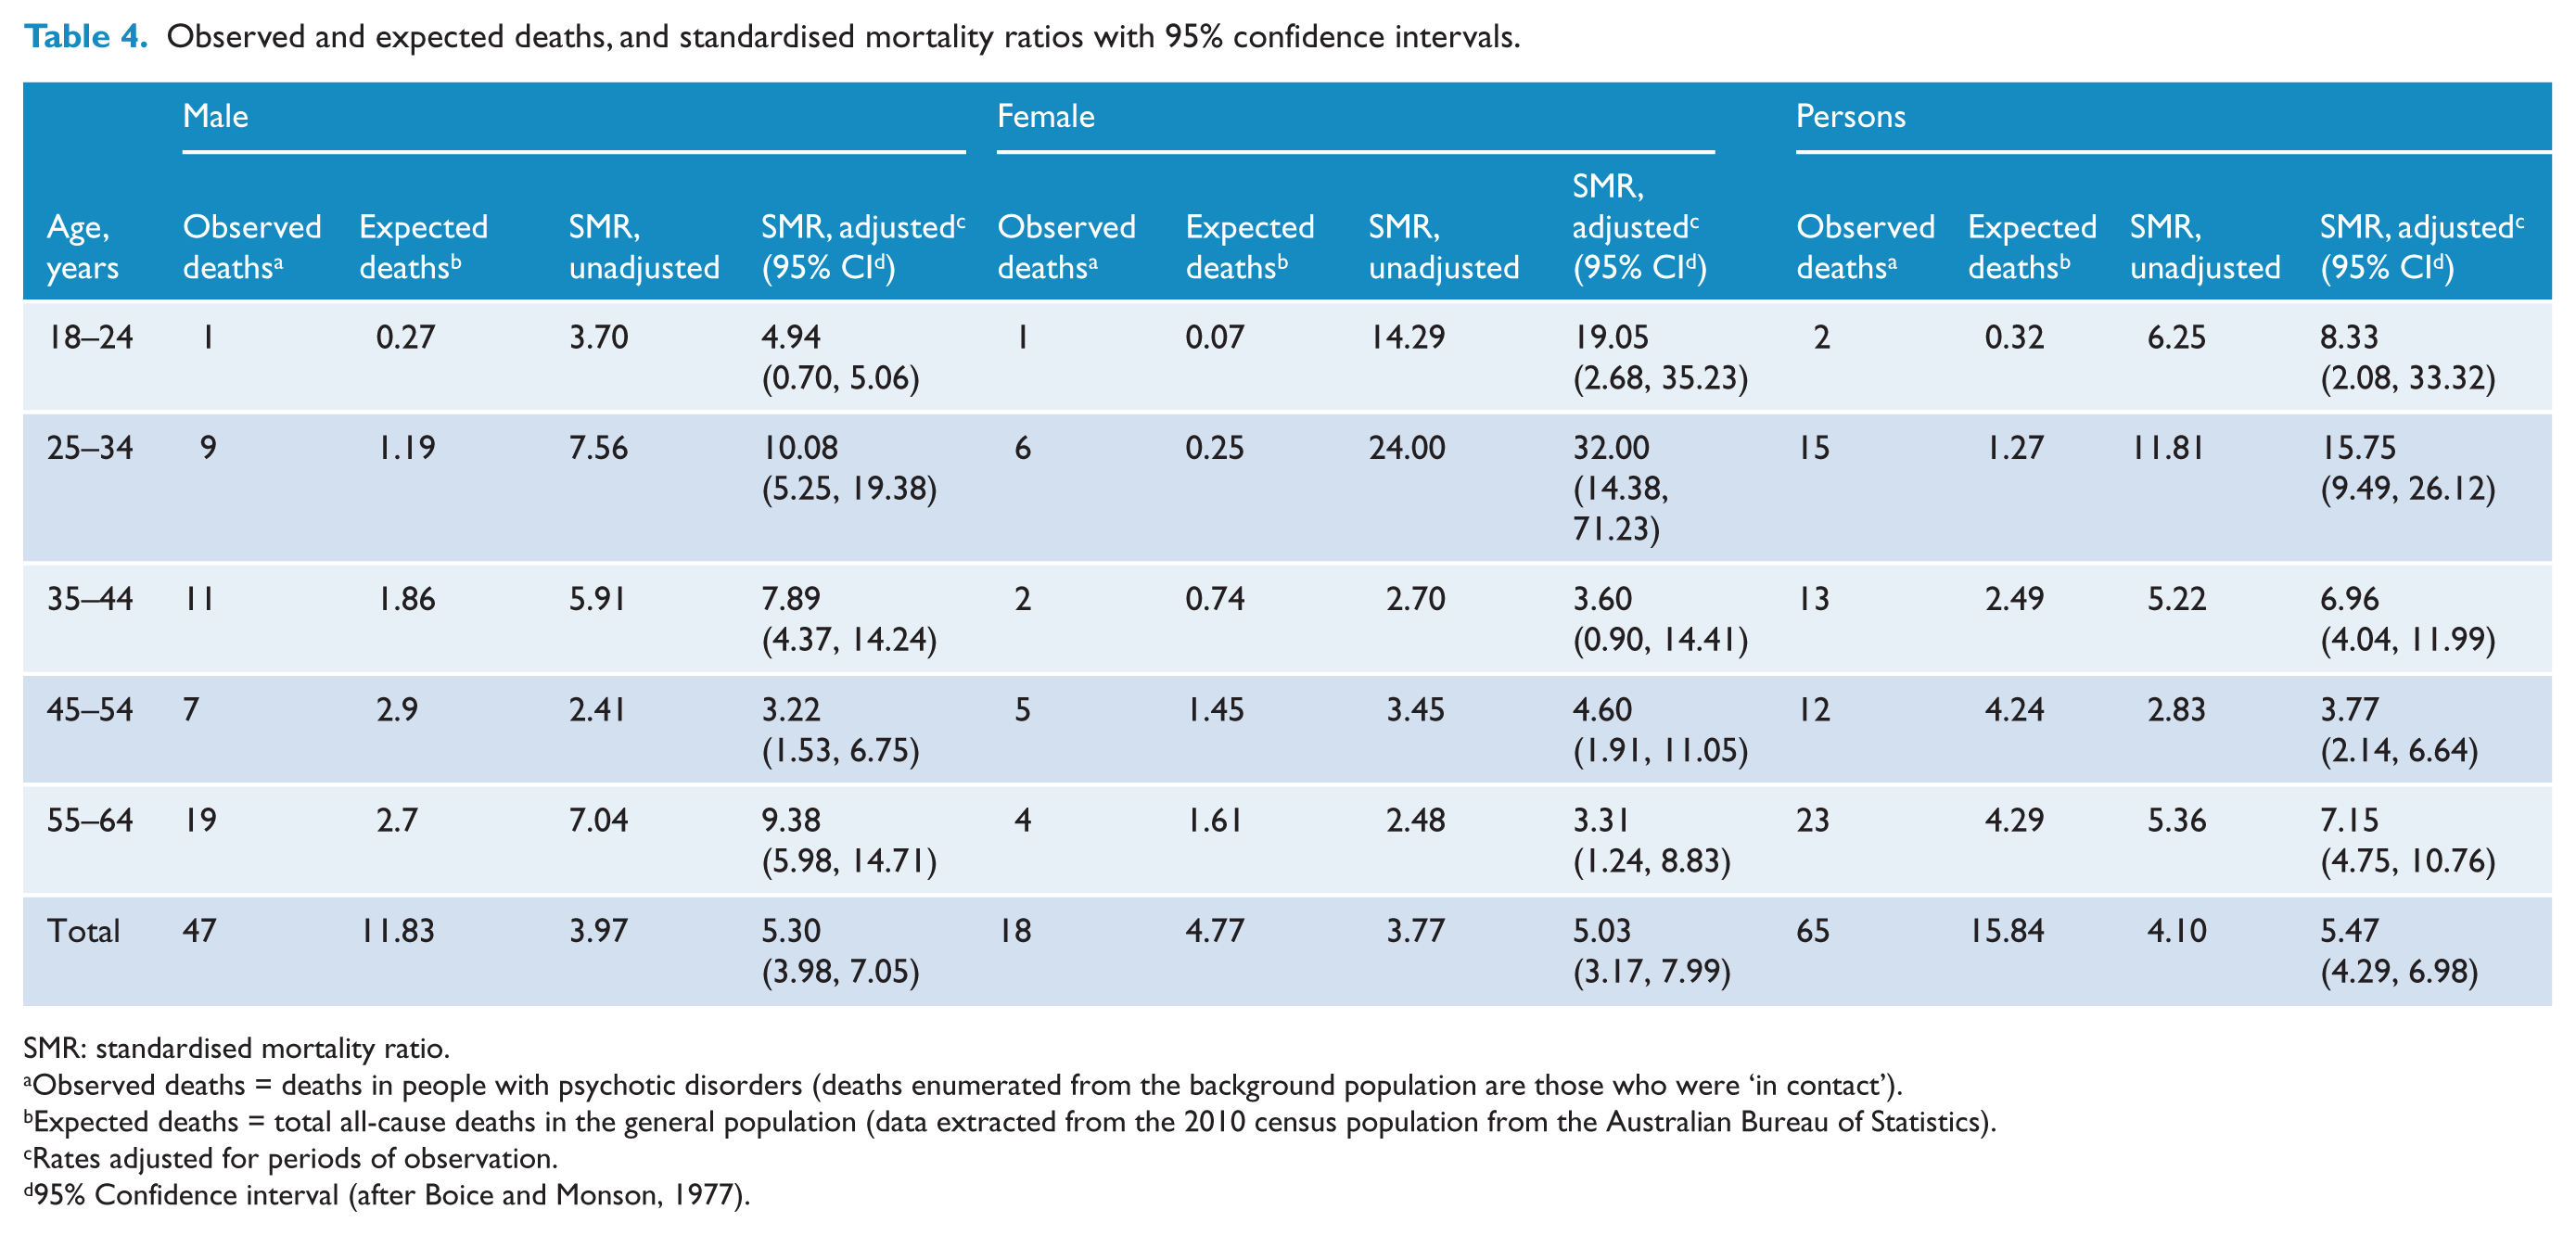
SMR: standardised mortality ratio.
Observed deaths = deaths in people with psychotic disorders (deaths enumerated from the background population are those who were ‘in contact’).
Expected deaths = total all-cause deaths in the general population (data extracted from the 2010 census population from the Australian Bureau of Statistics).
Rates adjusted for periods of observation.
95% Confidence interval (after Boice and Monson, 1977).
Discussion
Based on our model, we estimated that the incidence of psychotic disorders in those aged 18–64 years was 28 cases per 100,000 individuals per year. These rates are comparable to incidence rates of schizophrenia and other psychoses found in studies from Australia and other countries with similar socio-economic conditions. Using case register data from New South Wales, Goldstein and colleagues (1984) found that the incidence rate of schizophrenia was 30 per 100,000 for individuals aged 15–54 years. The few studies that have investigated incidence rates in similar age groups in Australia have provided figures for either schizophrenia or schizophrenia spectrum syndromes (schizophrenia, schizophreniform and schizoaffective disorders). However, several recent population-based studies from other countries reported similar incidence rates in a wider band of psychotic disorders (Fearon et al., 2006; Kirkbride et al., 2006). For example, a multicentre study from the UK (Kirkbride et al., 2006) found that the overall incidence of psychosis (all psychosis: affective, non-affective and schizophrenia spectrum) was 35 per 100,000 person-years in individuals aged 16–64 years. Mindful that the UK study included a high proportion of migrant groups in one site (southeast London), our modelled incidence rate appears plausible.
As expected, there were sex differences in the incidence of psychosis: the overall incidence for males was significantly higher than females, with a male:female ratio of 1.57:1. Similar sex differences have been reported in schizophrenia and other psychoses. In recent studies, the male/female differences for psychotic disorders were between 1.5- and 2-fold (Cheng et al., 2011; Kirkbride et al., 2006). In schizophrenia, the male:female ratio of around 1.4:1 has been reported in several systematic reviews (Aleman et al., 2003; McGrath et al., 2004, 2008).
The incidence rates in different age groups were also broadly consistent with other studies. In our study, we found two peaks: one in the younger age group (18–24) and the other for the 45–54 age group. Similar incidence peaks in younger groups for the psychotic disorders were observed in the literature (Amminger et al., 2006; Cheng et al., 2011). Mindful that psychotic disorders have a relatively low incidence rate (compared to other mental disorders such as depression, anxiety and substance use), the age-stratified rates lack precision and we recommend caution in the use of these estimates for service planning.
In order to estimate the stability of the incidence rate estimates under different assumptions, when we repeated the calculation using 18 months of TDP, the rate estimates for persons, males and females did not change substantially. In contrast, when we modelled rate estimates based on 12-month TDPs, the actual counts fell substantially. These analyses suggest that our analyses are relatively robust when we make the algorithm less conservative, but we lack power to define estimates based on more stringent criteria.
Regarding mortality, we found that there was a fivefold increase in mortality from all causes of death among psychotic patients compared to the general population. This elevated trend in mortality among schizophrenia and other psychoses has been observed from the time of Ødegard (1951) to the present era. In a case register study from Western Australia, Ruschena et al. 1998) found a similar mortality ratio (SMR = 4.9) for persons with schizophrenia. We found a higher SMR for the study individuals with psychosis compared to other Australian studies (where SMRs were reported between 2 and 3). Mindful that the participants in the present survey were recruited from a specialist service, the higher SMRs may reflect that those in contact with services tend to be more severe. Data from a systematic review that included 37 studies from all over the world showed that the median SMR for schizophrenia was 2.58, with a quantile distribution (10–90%) between 1.2 and 5.8 for persons (Saha et al., 2007). The study also reported that this differential mortality gap between individuals with schizophrenia and the general population had increased over time. While Australian studies have shown conflicting findings with a differential mortality gap between psychiatric patients and the general population (Kisely et al., 2013; Lawrence et al., 2000a, 2000b), recent studies from other countries have confirmed a rise in mortality gaps. As an example, a recent study from the UK reported that there was a significant increase in the mortality gap in the last 20–25 years for individuals with psychosis rising from 0.85 in 1970–1974 to 2.42 in 1995–1999 (Dutta et al., 2012).
Several important caveats to this modelling exercise should be noted. The original survey was not designed to assess incidence rates and mortality estimates and therefore our findings should be treated cautiously and are indicative values only. We used treated prevalence data for the estimation of incidence rates, which may underestimate the real incidence of psychiatric disorders because the survey did not cover private treatment services including GP and private psychiatrists/psychologists or people who were homeless. In our modelling exercise, we did not have access to all the key variables needed to derive reliable estimates. However, by making a set of reasonable assumptions based on available variables, we were able to derive plausible estimates for these two frequency measures which can be used as benchmark data for future use.
From a research perspective, it may be feasible that future population-based prevalence surveys of mental disorders could be optimised to derive more valid and reliable incidence- and mortality-related estimates. Several sites in the SHIP study received ethics approval to undertake future linkage studies with death registers; these studies will provide more reliable mortality-related estimates. We hope to explore these options in future studies. Future prevalence studies might like to include variables that can facilitate incidence and mortality modelling exercises (e.g. by recording information on date of first contact during the period of observation, date and cause of death, etc.).
In summary, we have demonstrated that incidence and mortality-related estimates can be imputed from prevalence surveys. Regardless of the precision of these estimates, and the technical aspects of how they were derived, the most important finding from this exercise is the worrying number of deaths identified during the period of observation. During the follow-up period we identified 65 deaths in individuals who were screen-positive for psychosis during the census period, whereas we would have predicted approximately only 16 deaths during a comparable period based on an age-matched population sample. This finding is consistent with the very high rates of comorbid physical illness identified in the sample (Galletly et al., 2012; Morgan et al., 2012). Our study adds further weight to the urgent call to address comorbid physical health problems in those with psychotic disorders.
Footnotes
Acknowledgements
The members of the Survey of High Impact Psychosis Study Group are: V Morgan (Project Director); A Jablensky (Chief Scientific Advisor); A Waterreus (Project Coordinator); A Mackinnon (Statistician); R Bush, D Castle, M Cohen, C Galletly, C Harvey, P McGorry, J McGrath, H Stain (Site Directors); V Carr (Australian Schizophrenia Research Bank); A Neil (Health Economics); B Hocking (SANE Australia); S Saw (Australian Government Department of Health and Ageing). The study was funded by the Australian Government Department of Health and Ageing. This report acknowledges, with thanks, the hundreds of mental health professionals who participated in the preparation and conduct of the survey and the many Australians with psychotic disorders who gave their time and whose responses form the basis of this publication.
Funding
This report was funded in full by the Queensland Centre for Mental Health Research (QCMHR) and is a secondary analysis of data collected in the framework of the 2010 Australian National Survey of High Impact Psychosis.
Declaration of interest
The authors report no conflicts of interest. The authors alone are responsible for the content and writing of the paper.