
Abstract
Objective:
The aim of this paper was to explore attitudes towards people with mental disorders among Australian health professionals (psychiatrists, psychologists and general practitioners (GPs)) and to compare their attitudes with members of the general community.
Methods:
The study involved a postal survey of 518 GPs, 506 psychiatrists and 498 clinical psychologists and a telephone survey of 6019 members of the general community. Participants were given a case vignette describing a person with either depression, depression with suicidal thoughts, early schizophrenia, chronic schizophrenia, post-traumatic stress disorder (PTSD) or social phobia and two questionnaires to assess stigmatising attitudes (the Depression Stigma Scale and the Social Distance Scale). Exploratory structural equation modelling was used to elucidate the structure of stigma as measured by the two scales, to establish dimensions of stigma and to compare patterns of association according to gender, age, vignette and professional grouping.
Results:
The measurement characteristics of stigmatising attitudes in health professionals were found to be comparable to those in members of the general community in social distance and also in personal and perceived attitude stigma, with each forming distinct dimensions and each comprising ‘Weak-not-sick’ and ‘Dangerous/unpredictable’ components. Among health professionals, female gender, age and being a GP were associated with higher scores on the personal stigma scales. Mental health professionals had lower scores on the personal ‘Weak-not-sick’ and ‘Dangerous/unpredictable’ scales than members of the general community, while there were no significant differences in the desire for social distance between health professionals and the general community.
Conclusions:
While mental health professionals have less stigmatising attitudes than the general public, the greater beliefs in dangerousness and personal weakness by GPs should be addressed.
Introduction
The need to combat stigmatising attitudes towards people with mental disorders is widely recognised, owing to the adverse effects on help seeking, treatment compliance, personal relationships and the ability of people with mental disorders to achieve their educational and vocational goals (Corrigan, 2004; Link et al., 1997; Wells et al., 1994). Eliminating stigma is a feature of national and international health policy, and anti-stigma programs are now common in many countries (Corrigan et al., 2012). In Australia, a ‘sustained and comprehensive national stigma reduction strategy’ is a central component of the Fourth National Mental Health Plan (Department of Health and Ageing, 2009).
Health professionals often play a central role in stigma reduction campaigns and programs through their research activities, expert advice, advocacy and, in some cases, direct initiation of programs (Crisp, 2000). At the level of the individual, the relationship between a health professional and a person with a mental disorder can play a key role in recovery. Experiences of discrimination, which may involve stereotypical attitudes towards and desire for social distance from a person with a mental disorder, lack of interest in a client’s personal circumstances and an unwillingness to include the person in treatment decisions, may limit help seeking and adherence to treatment (Horsfall et al., 2010; Schulze, 2007). There is a clear need for mental health professionals to be aware of their own attitudes to those with mental disorders and the adverse consequences that stigmatising attitudes and discriminatory behaviours might have for patients and clients (Caldwell and Jorm, 2000).
A number of studies have shown that mental health professionals hold negative attitudes towards individuals with mental disorders (Schulze, 2007). These include studies of psychiatrists, psychologists, nurses and allied health professionals in a number of countries. Such studies have attempted to assess a range of attitudes to those with mental disorders including beliefs about the person’s functioning in social roles, clinical outcomes, desire for social distance, beliefs about dangerousness and restriction of individual rights (Bjorkman et al., 2008; Caldwell and Jorm, 2001; Nordt et al., 2006; Rao et al., 2009). In some studies, such attitudes were more negative than those held by the general public (Jorm et al., 1999; Nordt et al., 2006; Schulze, 2007), while other studies suggest that health professionals hold less stigmatising beliefs (Jorm et al., 2012).
In order to address the issue of stigmatising attitudes on the part of health professionals, it is necessary to further advance our understanding of the nature of mental disorder stigma. Although stigma is often discussed as a unitary construct, there is evidence that it is complex and multidimensional, with dimensions that depend on the measures used and the type of disorders investigated (Griffiths et al., 2004; Stansfield et al., 2008; Watson et al., 2005). While there are a number of scales that have attempted to assess attitudes towards those with mental disorders (Gabbidon et al., 2013), two of the most commonly used in Australia are the Depression Stigma Scale (DSS; Griffiths et al., 2004) and the Social Distance Scale (SDS; Link et al., 1999). The DSS, which has also been used to assess attitudes to disorders other than depression, asks respondents about their own attitudes to a mentally ill person depicted in a vignette (personal stigma) as well as their perceptions of the attitudes held by other people (perceived stigma). Questions cover attitudes to mental disorders as ‘real illnesses’ and beliefs about the dangerousness or unpredictability of the person with the disorder.
In a previous study, we used exploratory structural equation modelling (ESEM) techniques to establish the measurement structure for both personal and perceived stigma as measured by the DSS in a general community sample (Yap et al., 2013). ESEM is a novel alternative to exploratory and confirmatory factor analysis which we chose because it did not impose a structure on the stigma items and allowed us determine the extent to which these structures were comparable for personal and perceived stigma. As an integral part of the model, we examined how the more established SDS construct related to the items in the DSS. These analyses revealed that personal and perceived stigma formed distinct dimensions with each comprising ‘Weak-not-sick’ and ‘Dangerous/unpredictable’ components. The social distance dimension of stigma was separate from other components of stigma, supporting the appropriateness of the existing SDS. Scales reflecting these dimensions had different patterns of association with respondent age and gender, and the type of mental disorder portrayed in the vignette.
The aim of the current study was to apply ESEM techniques to explore the structure of stigma as measured by the DSS and SDS in psychiatrists, clinical psychologists and general practitioners (GPs). It may be particularly useful to explore perceived stigma in health professionals, as there is some evidence that doctors are less likely to accept mental illness in themselves or their colleagues, as readily as in their patients (Adams et al., 2010; White et al., 2006). A further aim was to compare levels of the various dimensions of stigma between these professional groups and also to members of the general community.
Methods
Health professional survey
Sample
The questionnaire was mailed to 6848 health professionals registered with Medicare Australia in June 2012. The sample was a random sample of 3000 GPs who had provided more than 50 services in the past year, a random sample of 1800 registered clinical psychologists, and all active psychiatrists (2048). We conservatively assumed response rates of 20% for GPs and 33% for psychologists and psychiatrists, based on response rates for a previous professional survey on youth mental health literacy (Jorm et al., 2008).
Survey questionnaire
The questionnaire was based on an unlabelled vignette of a person with a mental disorder. On a random basis, respondents received a questionnaire with one of six vignettes: depression, depression with suicidal thoughts, early schizophrenia, chronic schizophrenia, social phobia and PTSD. In all cases, the person described in the vignette was male (‘John’). All vignettes were written to satisfy the diagnostic criteria for the disorders according to the Diagnostic and Statistical Manual of Mental Disorders, Fourth Edition (DSM-IV) and the International Classification of Diseases, Tenth Revision (ICD)-10. The first four vignettes have been published previously (Jorm et al., 2005) and the latter two, which were used for the first time, are given elsewhere (Reavley and Jorm, 2011).
After being presented with the vignette, respondents were asked what, if anything, they thought was wrong with the person described in the vignette and a series of questions about the likely helpfulness of a wide range of interventions, the likely outcomes for the person with and without professional help and stigmatising attitudes towards the person. Data relating to these other questions are reported elsewhere (Morgan et al., 2013). The focus of this paper is on stigmatising attitudes.
Personal and perceived stigma
Stigmatising attitudes were assessed with two sets of statements: one assessing the respondent’s personal attitudes towards the person described in the vignette (personal stigma) and the other assessing the respondent’s beliefs about other people’s attitudes towards the person in the vignette (perceived stigma) (Griffiths et al., 2004). The personal stigma items were: (1) People with a problem like John’s could snap out of it if they wanted; (2) A problem like John’s is a sign of personal weakness; (3) John’s problem is not a real medical illness; (4) People with a problem like John’s are dangerous; (5) It is best to avoid people with a problem like John’s so that you don’t develop this problem; (6) People with a problem like John’s are unpredictable; (7) If I had a problem like John’s I would not tell anyone; (8) I would not employ someone if I knew they had a problem like John’s; (9) I would not vote for a politician if I knew they had suffered a problem like John’s.
The perceived stigma items covered the same statements but started with ‘Most other people believe that …’. Ratings of each were made on a 5-point Likert scale ranging from ‘strongly agree’ to ‘strongly disagree’.
Social distance
Self-reported willingness to have contact with the person described in the vignette was measured using the 5-item scale developed by Link et al. (1999). The items rated the person’s willingness to: (1) move next door to John; (2) spend an evening socialising with John; (3) make friends with John; (4) work closely with John on a job; (5) have John marry into their family. Each item was rated on a 4-point scale ranging from ‘definitely willing’ to ‘definitely unwilling’.
General community survey
Sample
The survey involved computer-assisted telephone interviews (CATI) with a national sample of 6019 members of the general community aged 15+ years. The survey was carried out by the survey company Social Research Centre. The sample was contacted by random-digit dialling of both landlines and mobile phones covering the whole country from January to May 2011. Further details of the methods are given elsewhere (Reavley and Jorm, 2011).
Survey questionnaire
The questionnaire was identical to that described for the health professional survey described above, although respondents were randomly assigned to receive either male (‘John’) or female (‘Jenny’) versions of the vignette. For this study, only those assigned to receive the male vignette were included.
Ethics approval
The study received ethical approval from the Human Research Ethics Committee at The University of Melbourne. It was also approved by the External Requests Evaluation Committee at the Department of Human Services (DHS), which conducted the health professional survey mail-out on our behalf to comply with privacy legislation. Follow-up of non-responders was not permitted by the DHS.
Statistical analysis
Exploratory structural equation models
The ESEM model defined two factors each for both personal and perceived stigma, but did not constrain the pattern of loadings of items on each. For the social distance items, a single confirmatory factor on which all items were permitted to load was specified. This factor was permitted to correlate freely with all exploratory factors. Item responses were treated as ordinal data with polychoric correlations estimated between items. Model parameters were estimated using the weighted least squares means and variance adjusted method in Mplus 7 and were compared using the DiffTest procedure (Muthén and Muthén, 1998–2010). A key objective of this modelling was to establish the measurement structures for both personal and perceived stigma in health professionals and to determine the extent to which these structures were comparable with those seen in the general population. The current study followed the methodology outlined in the previous study that used ESEM to explore the structure of stigma as measured by the DSS and SDS in the general community (Yap et al., 2013).
Results
We received 1536 returned surveys from 518 GPs, 506 psychiatrists and 498 psychologists (14 respondents did not indicate a profession). Response rates were 17.3%, 24.7% and 27.7%, respectively. Responses for each of the six vignette types were: depression (280), depression with suicidal thoughts (261), early schizophrenia (237), chronic schizophrenia (259), social phobia (242) and PTSD (257).
Exploratory structural equation models
A series of nested ESEM models were fitted to the health professionals’ survey data. The models allowed for two factors each for personal and perceived stigma items. These were exploratory factors onto which all items were permitted to load freely and were rotated to an oblique solution using the Geomin algorithm. Residuals of corresponding personal and perceived stigma items were permitted to correlate. The social distance items were modelled as a single confirmatory factor that was permitted to correlate with the personal and perceived stigma factors. Model 1 allowed differing loadings on personal and perceived stigma factors. Model 2 constrained loadings on corresponding personal and perceived factors to be equal. Model 3 added this equality constraint to response category thresholds. The outcome of a final constraint, that of equality of residual variances for corresponding personal and perceived stigma items, is not reported due to failure of this model to converge.
Table 1 reports model fit indices for the increasingly constrained models. Model 1 provided an excellent fit to the data, with all indices exceeding recommended thresholds for acceptable fit. Constraining personal and perceived factor loadings (Model 2) resulted in relatively minor decrements in fit. The magnitude and statistical significance of the chi-squared goodness-of-fit tests reflect the large sample sizes involved. Constraining item thresholds (Model 3) introduced a notable decrease in model fit in both surveys, although fit generally remained acceptable
Model fit statistics for health professionals survey.
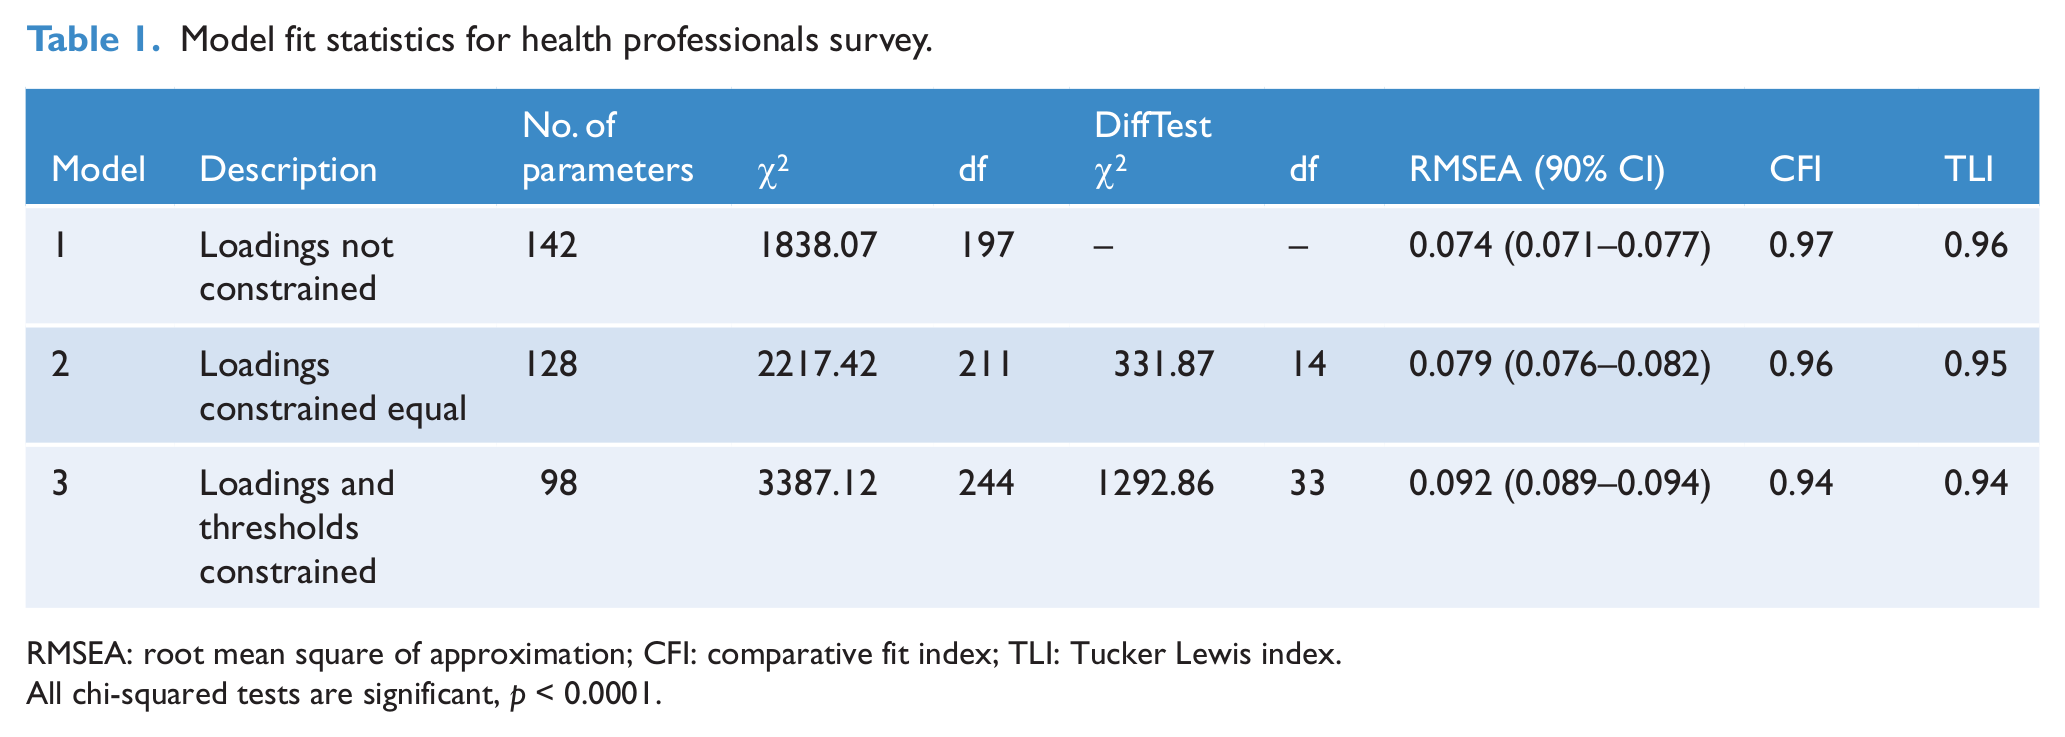
RMSEA: root mean square of approximation; CFI: comparative fit index; TLI: Tucker Lewis index.
All chi-squared tests are significant, p < 0.0001.
Model 2 provided a good, parsimonious fit to the data. This model is important because it demonstrates that personal stigma and stigma perceived in others have comparable measurement structures in health professionals. Accordingly, only parameters for this model are reported. Owing to the size of the sample, even very small factor loadings were highly statistically significant. Consequently, parameters are discussed in terms of their substantive magnitude. The p-values and confidence intervals are not reported.
Factor loadings shown in Table 2 indicate that the first factor, referred to as ‘Weak-not-sick’, comprises items which characterise the problem portrayed in the vignette as a personal weakness under the control of the person rather than as a medical condition. The item indicating a preference to avoid the person also loaded moderately on this factor. The second factor, referred to as ‘Dangerous/unpredictable’, was defined by items characterising the vignette character as unpredictable and dangerous. The ‘best to avoid people with this problem’ item again loaded on this factor, but more modestly than on the first factor. The items concerning not employing or voting for the person also loaded substantially on the second factor. All social distance items loaded substantially and relatively uniformly on the single factor specified for them.
Factor loadings for model with personal and perceived item loadings constrained to be equal.
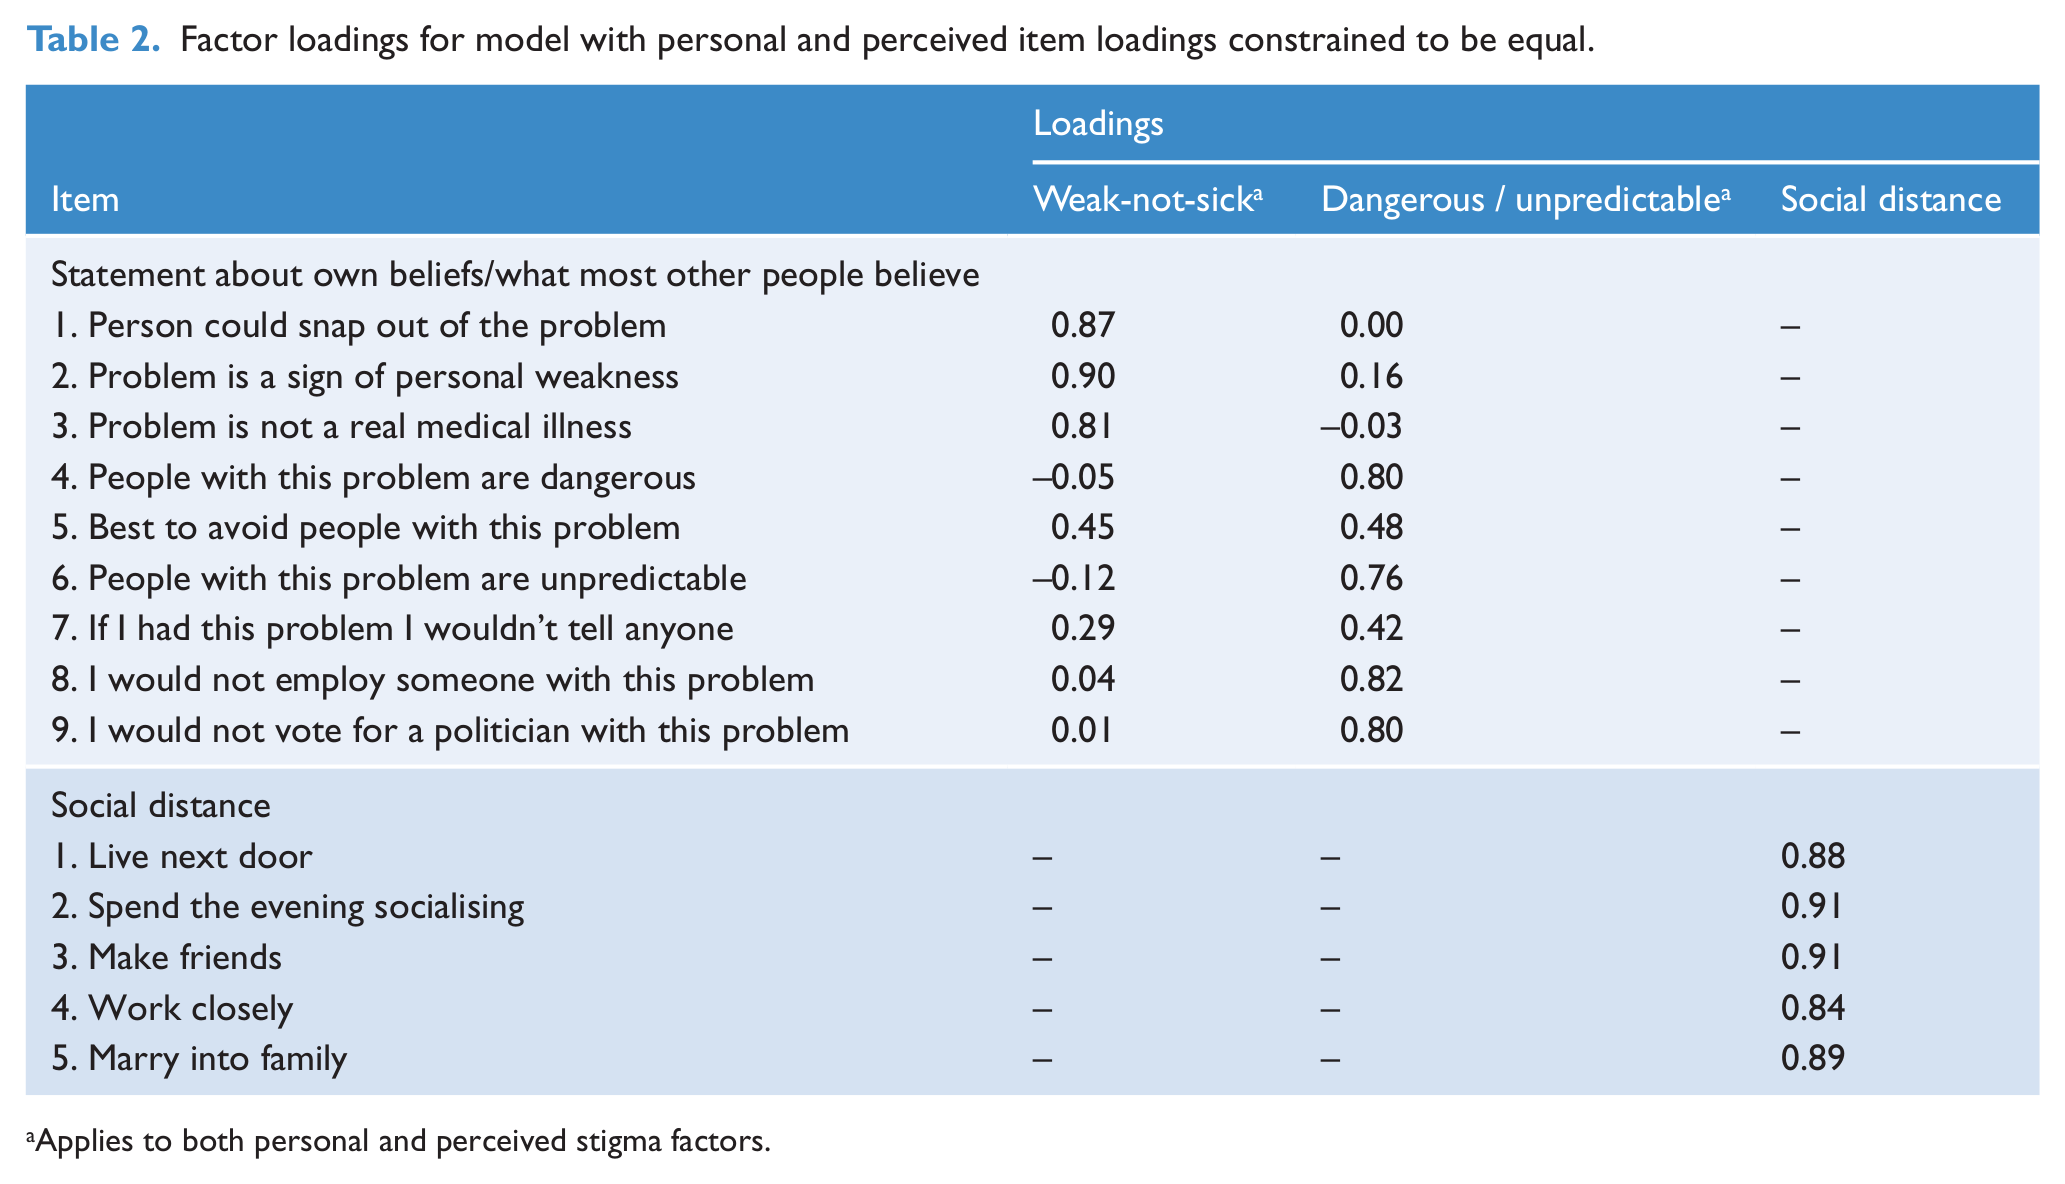
Applies to both personal and perceived stigma factors.
All factors were permitted to correlate freely. As shown in Table 3, the correlation between the two personal stigma factors was small (0.24), with the comparable association for perceived stigma being smaller (0.14). There was a small association between the personal and perceived Weak-not-sick factors (0.14), although the Dangerous/unpredictable factors were moderately correlated (0.53). The social distance factor was highly correlated with the personal dangerous/unpredictable factor (0.74) and moderately correlated with the perceived Dangerous/unpredictable factor (0.56).
Factor and scale correlations (upper and lower off diagonal, respectively), correlations of scale scores with factor scores and scale reliabilities.
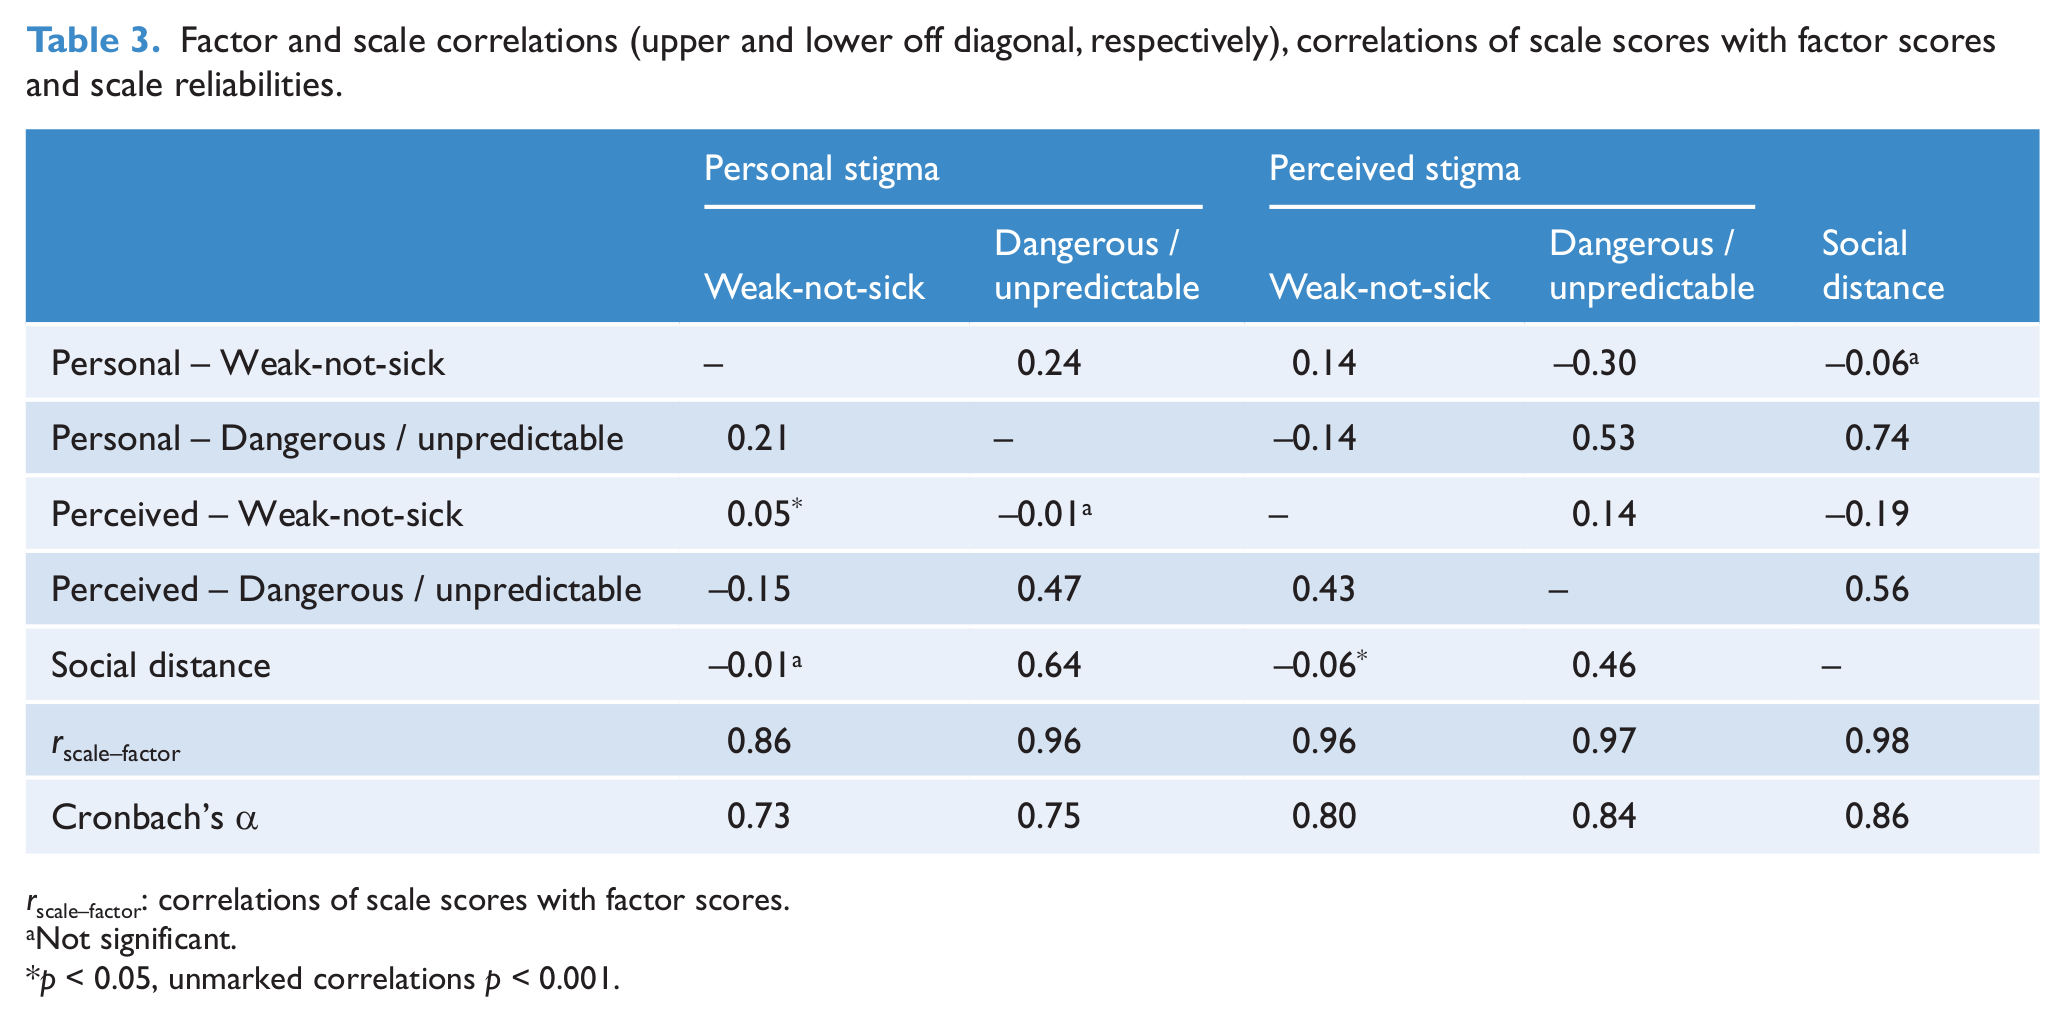
rscale–factor: correlations of scale scores with factor scores.
Not significant.
p < 0.05, unmarked correlations p < 0.001.
Scale scores
As in the previous study, scores reflecting each factor were calculated as the mean of items that loaded substantially (> 0.30) on the factor, with higher mean scores indicating more stigmatising attitudes. Table 3 shows that, despite the small number of items comprising the scales, most correlated very highly with the corresponding factor scores and had good reliability.
Professional group differences and correlates of the stigma scales
Table 4 shows the means and standard deviations of the stigma scales by gender, age and professional groups. ANOVA was used to investigate differences due to gender, age and professional group. While some statistically significant interactions between these factors were found, these were small compared to the main effects. Consequently, only the main effects are described.
Stigma scales by gender, age and professional group.
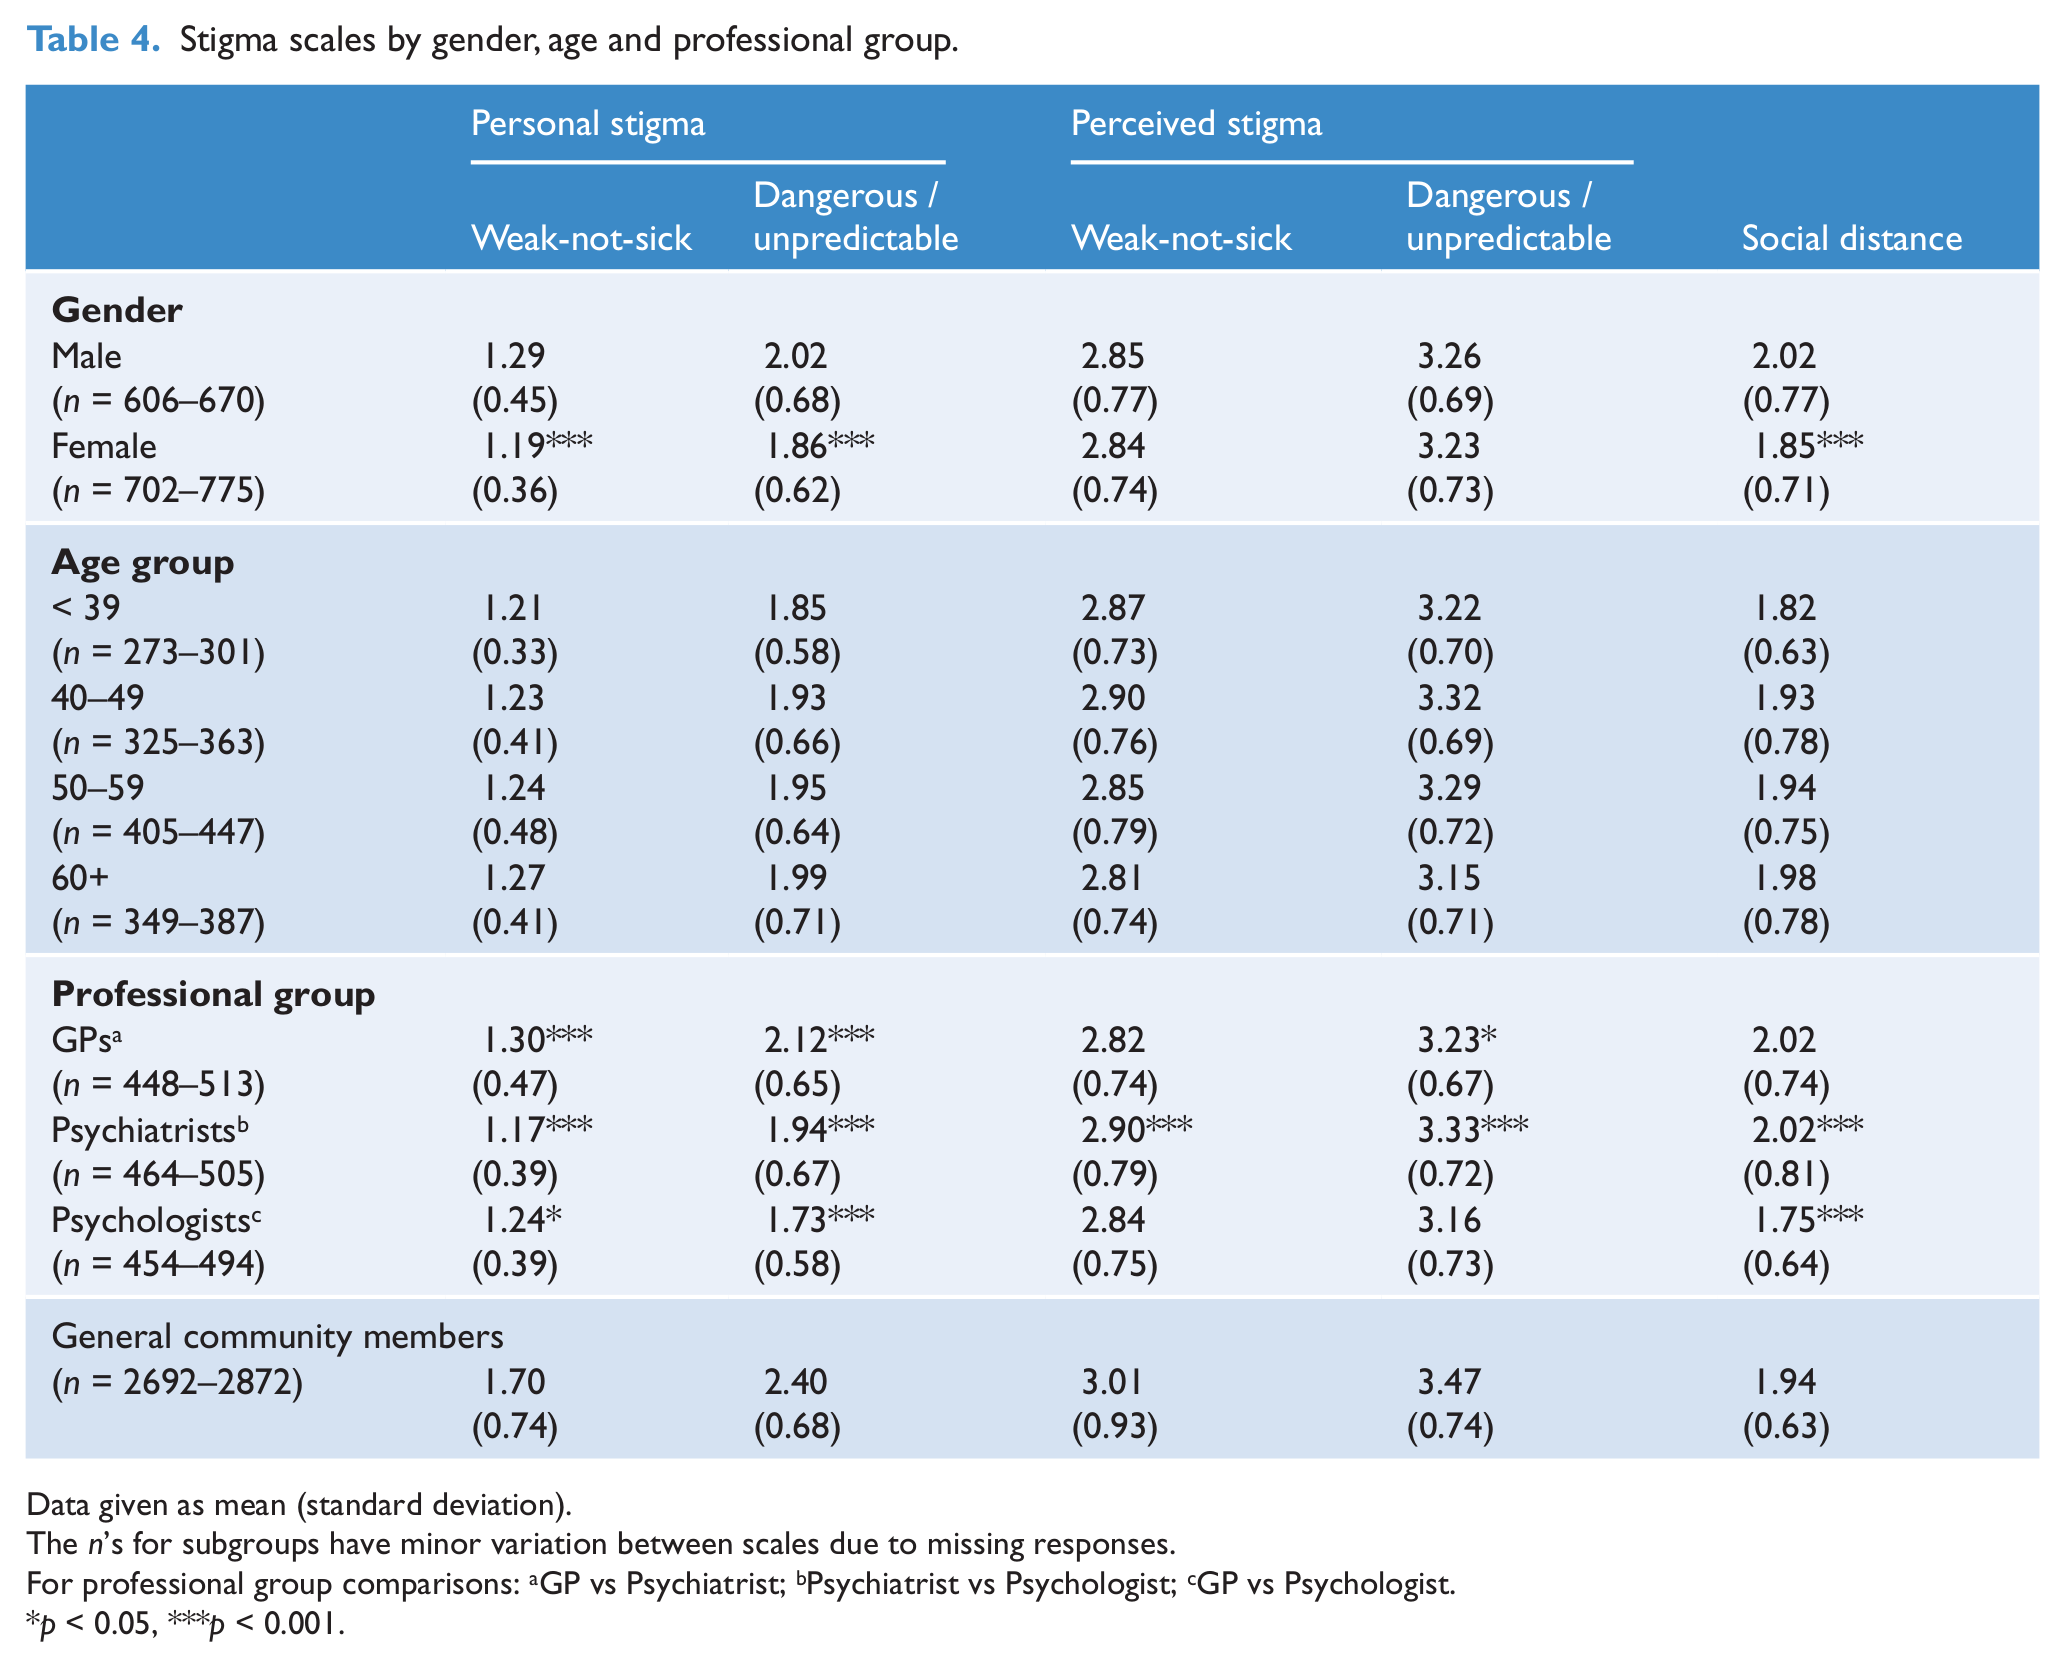
Data given as mean (standard deviation).
The n’s for subgroups have minor variation between scales due to missing responses.
For professional group comparisons: aGP vs Psychiatrist; bPsychiatrist vs Psychologist; cGP vs Psychologist.
p < 0.05, ***p < 0.001.
Gender
Males had higher mean scores on both personal stigma scales and on the SDS. No differences between males and females were seen on the perceived stigma scales.
Age
Both personal stigma scales showed a pattern of increase with age, although this was significant only for the Dangerous/unpredictable scale (linear trend F(1,1488) = 6.74, p = 0.0095). The perceived stigma scales had an inverted U relation with age, peaking in the 40–49 year group, although this pattern was significant only for the Dangerous/unpredictable scale (quadratic trend F(1,1488) = 10.01, p = 0.0016). The SDS also had a pattern of increase with age (linear trend F(1,1348) = 6.77, p = 0.0094).
Vignette
Although many comparisons were statistically significant, the largest differences observed between vignettes were between the two schizophrenia vignettes and the non-psychotic disorders (Table 5). Differences in patterns were particularly striking for both personal and perceived Dangerous/unpredictable scales, with respondents viewing others as having highly stigmatising attitudes towards individuals with schizophrenia. This pattern was paralleled for the personal Dangerous/unpredictable scale, but with average attitudes overall being lower. Respondents had lower mean scores for schizophrenia on both personal and perceived Weak-not-sick scales, but the difference between disorders was greater for perceived stigma.
Stigma scales by disorder vignette.
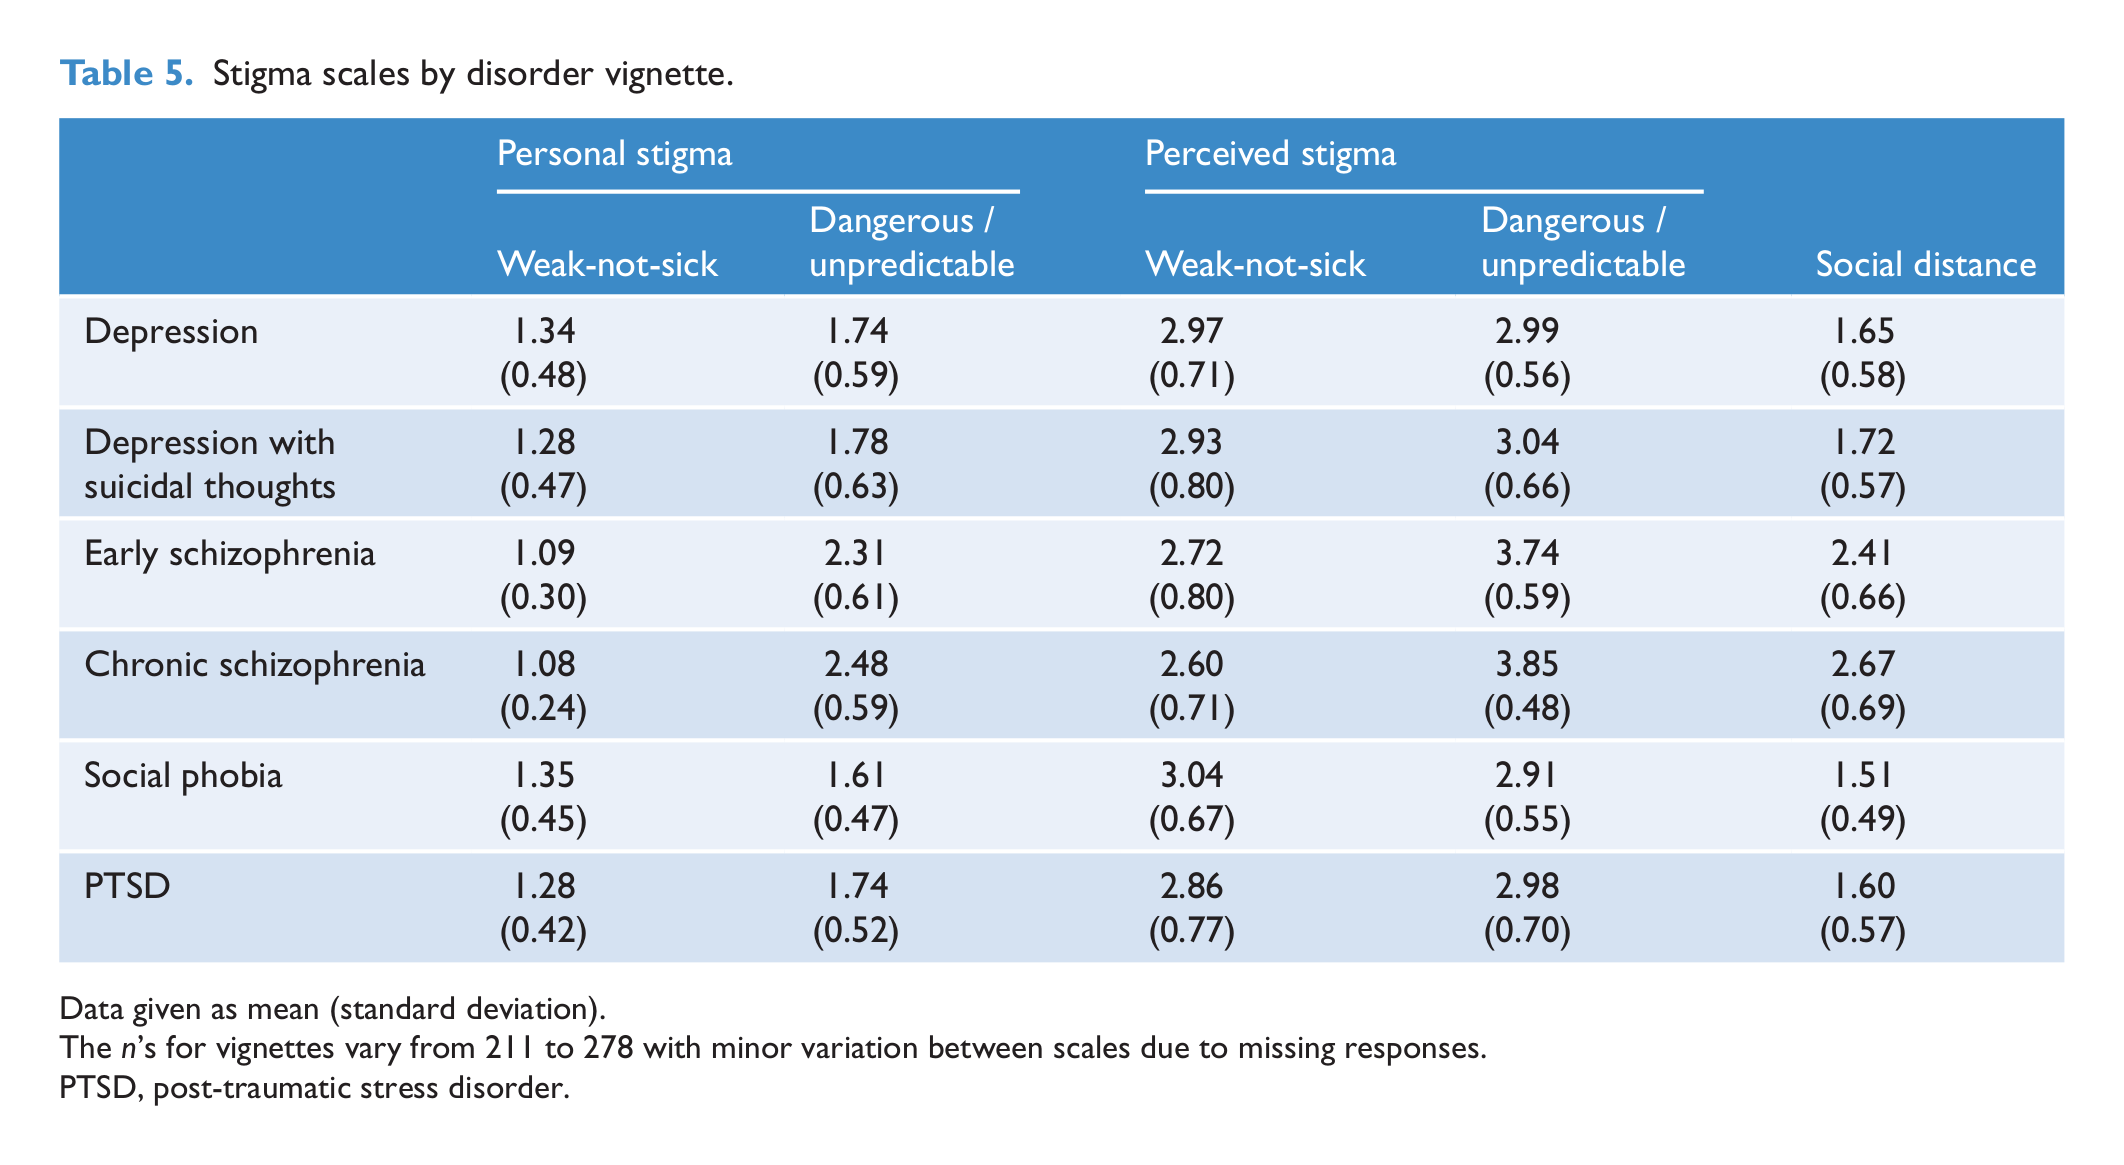
Data given as mean (standard deviation).
The n’s for vignettes vary from 211 to 278 with minor variation between scales due to missing responses.
PTSD, post-traumatic stress disorder.
Professional group
Psychiatrists had the lowest mean scores on the personal Weak-not-sick scale, followed by psychologists, with GPs having significantly higher scores than either group. For the personal Dangerous/unpredictable scale, GPs had the highest means, followed by psychiatrists, with psychologists having the lowest scores. There were no significant differences between groups for the perceived Weak-not-sick scale and differences on the perceived Dangerous/unpredictable scale were relatively small, although psychiatrists’ scores were significantly higher than the other two groups. GPs and psychiatrists had almost identical mean scores on the SDS, being significantly higher than those of psychologists.
Comparison with the general community
Analyses comparing professional groups were replicated, adding data from the general community survey sample, in effect creating a ‘general community participant’ as an additional level of the ‘professional group’ factor. Interaction effects were small, allowing focus on the comparison of each profession to participants in the general community survey. As Table 4 shows, differences were greatest for personal stigma. General community survey participants had substantially higher scores on both the Weak-not-sick and Dangerous/unpredictable scales than any profession. All differences were highly significant (p < 0.001). In contrast, for perceived stigma, the only significant difference was that between psychologists and general community survey participants on the Dangerous/unpredictable scale (F(1,4090) = 15.09, p = 0.0001). For the SDS, there were no significant differences between general community survey participants and the various professional groups.
Discussion
The replication of ESEM methods originally employed in a survey of members of the general community to the stigmatising attitudes in health professionals has demonstrated the comparability of the measurement structures of these groups regarding personally held attitudes and those perceived in others. In addition, among health professionals, scales reflecting these dimensions had different patterns of association with age, gender, vignette and professional group, with stigmatising attitudes typically higher for the schizophrenia vignettes, higher in males and increasing with age. As a professional group, GPs typically had the highest stigmatising attitudes and psychologists the lowest.
This study extends the results of Yap et al. (2013) by demonstrating an analogous structure in a sample of health professionals, that is: personally held stigmatising attitudes and those perceived in others form distinct dimensions; that each comprises two components: Weak-not -sick and Dangerous/unpredictable; and that the social distance dimension of stigma is separate from the other components. As in Yap et al., but unlike Jorm and Wright (2008) with a youth sample, we found that the items about believing that ‘It is best to avoid people with a problem like John’s so that you don’t develop this problem yourself’ loaded moderately on both the Weak-not-sick and Dangerous/unpredictable factors for both the personal and perceived stigma dimensions. Thus, it is likely that a preference to avoid people with mental disorders in health professionals is also associated with both the belief that mental illness is a reflection of a personal weakness, as well as the belief that it makes the person dangerous or unpredictable. The item ‘If I had a problem like John’s, I would not tell anyone’ had the weakest loading of any item on the Dangerous/unpredictable factor (0.42) and its content is less related to the others. It may reflect another factor, perhaps involving ‘secrecy’, which is not well represented in the items of the DSS (Link et al., 1991, 2002). However, the item did load adequately on the Dangerous/unpredictable factor and was included in the current study to maintain consistency with previous surveys (Griffiths et al., 2006).
The study revealed some differences in beliefs according to professional grouping. Psychologists were less likely to hold stigmatising attitudes or desire social distance, and GPs were generally more likely to do so, possibly due to workload pressures or a lack of awareness and training about mental health. These results point to the need to better understand and address the attitudes of GPs, particularly those relating to personal beliefs about dangerousness and mental disorders as personal weakness. This might be done through anti-stigma interventions involving education and contact with a person with a mental illness (Corrigan et al., 2012). Interventions of this type targeted to GPs and, more commonly, medical students have previously shown benefits (Friedrich et al., 2013; Ucok et al., 2006). A relatively small number of studies have compared stigmatising attitudes between different health professional groups (Adams et al., 2010; Magliano et al., 2004; Nordt et al., 2006), but there are no previous studies comparing stigmatising attitudes and desire for social distance between GPs, psychologists and psychiatrists. In a UK study, Adams et al. (2010) found no differences between GPs and psychiatrists in terms of perceived stigma, while, in a Swiss study, Nordt et al. (2006) found that psychiatrists had more personally stigmatising attitudes than psychologists, nurses and other therapists.
The results of the current study showed that health professionals had less personally stigmatising attitudes than members of the general public, while there were no significant differences in the desire for social distance between general community survey participants and the various professional groups. These results are in line with most other studies comparing the stigmatising attitudes of health professionals with those of members of the public. Some of these showed no differences, while others suggest that health professionals have more negative attitudes than the general population (Schulze, 2007). However, health professionals are less likely than the general public to believe in the dangerousness of those with mental disorders (Jorm et al., 2012). It should be noted that comparison with other studies is complicated by the multidimensional nature of stigma, the different ways of measuring stigma and the variation in the types of health professionals whose attitudes have been assessed. However, the finding that health professionals do not differ from the general population in terms of the desire for social distance is consistent with other studies, which despite varying modes of administration and sample populations, typically use Link et al.’s SDS to measure this construct (Jorm and Oh, 2009).
While health professionals were less likely than members of the general public to have personally stigmatising attitudes for perceived stigma, GPs and psychiatrists held similar views to members of the general public. Thus, while they themselves may be less personally stigmatising, they are as likely as members of the general public to believe that other people would stigmatise. These results are in line with other studies suggesting that health professionals are more reluctant to accept an illness in themselves than in a patient, possibly due to concerns about confidentiality and adverse effects on career progression (Adams et al., 2010; White et al., 2006).
The pattern of association with gender was similar to that seen in the general community survey (Yap et al., 2013). Males had higher mean scores on the personal stigma and social distance scales in both surveys, but unlike in the general community survey, there were no significant differences in perceived stigma. This is in contrast to other studies, which have not generally found reliable gender differences in stigmatising attitudes (Jorm and Oh, 2009; Jorm et al., 2012). Among health professionals, belief in dangerousness/unpredictability increased with age, while belief in perceived dangerousness/unpredictability peaked in the 40–49 age group. SDS scores also increased with age, reflecting similar results seen in other studies (Jorm and Oh, 2009; Jorm et al., 2012).
Limitations of the study include the differences in survey methodology used to collect data from the public (telephone interview) and the professionals (postal survey), which have the potential to introduce social desirability biases. However, while there were differences in survey methodology, the observed differences are not consistent with the likelihood that telephone interviews would elicit more socially desirable responses. Other limitations include the small number of items on each scale; the lack of measurement of other components of stigma (e.g. self-stigma, discriminatory behaviour and experienced stigma), which were not the focus of the general community survey and therefore not included in the health professional survey; and the use of vignettes that represent hypothetical situations rather than real-life experiences. Further research to explore these aspects of stigma is necessary, particularly that relating to discriminatory behaviour, an area which is relatively under-researched (Jorm and Reavley, 2013). A further limitation is that the health professional survey had a low response rate, particularly for GPs, which may reduce the generalisability of the results (Cook et al., 2009).
Conclusions
The structure of stigmatising attitudes in health professionals and the general community is comparable in personally held attitudes, those perceived in others and in a desire for social distance. In addition, among health professionals, scales reflecting these dimensions have different patterns of association. GPs are more likely to hold personally stigmatising attitudes and to desire social distance than psychologists and psychiatrists, pointing to the need to address such beliefs among GPs. Health professionals had less personally stigmatising attitudes than members of the general public, while there were no significant differences in the desire for social distance between health professionals and the general community.
Footnotes
Funding
The study was funded by the Commonwealth Government Department of Health and Ageing. The authors receive salary support from the National Health and Medical Research Council.
Declaration of interest
The authors report no conflicts of interest. The authors alone are responsible for the content and writing of the paper.