
Abstract
Background:
Increased oxidative stress is thought to contribute to the pathophysiology of major depressive disorder (MDD), which is in part due to diminished levels of glutathione, the primary anti-oxidant of the brain. Oral administration of N-acetyl-cysteine (NAC) replenishes glutathione and has therefore been shown to reduce depressive symptoms. Proton magnetic spectroscopy (1H-MRS) that allows quantification of brain metabolites pertinent to both MDD and oxidative biology may provide some novel insights into the neurobiological effects of NAC, and in particular metabolite concentrations within the anterior cingulate cortex (ACC) are likely to be important given the key role of this region in the regulation of affect.
Objective:
The aim of this study was to determine whether the metabolite profile of the ACC in MDD patients predicts treatment with adjunctive NAC versus placebo.
Methods:
This study was nested within a multicentre, randomized, double-blind, placebo-controlled study of MDD participants treated with adjunctive NAC. Participants (n = 76) from one site completed the spectroscopy component at the end of treatment (12 weeks). Spectra from a single-voxel in the ACC were acquired and absolute concentrations of glutamate (Glu), glutamate-glutamine (Glx), N-acetyl-aspartate (NAA) and myo-inositol (mI) were obtained. Binary logistic regression analysis was performed to determine whether metabolite profiles could predict NAC versus placebo group membership.
Results:
When predicting group outcome (NAC or placebo), Glx, NAA and mI were a significant model, and had 75% accuracy, while controlling for depression severity and sex. However, the Glu, NAA and mI profile was only predictive at a trend level, with 68.3% accuracy. For both models, the log of the odds of a participant being in the NAC group was positively related to NAA, Glx and Glu levels and negatively related to mI levels.
Conclusion:
The finding of higher Glx and NAA levels being predictive of the NAC group provides preliminary support for the putative anti-oxidative role of NAC in MDD.
Introduction
The aetiology of major depressive disorder (MDD) is complex and multifactorial, involving genetic and psychosocial factors that produce neurotransmitter changes in the brain and compromise cellular resilience (Charney and Manji, 2004). Currently, available antidepressants principally target monoamine neurotransmitter systems (Feighner, 1999); however, their overall efficacy in the treatment of MDD has been questioned because of a lack of clear benefit over placebo, except in more severely ill individuals (Kirsch, 2009). Therefore, the focus of therapeutic research in MDD has gradually shifted towards understanding the pathophysiology of depression in terms of other transmitter systems such as glutamate (Glu), an excitatory transmitter with a known role in depression (Chung, 2012), cellular mechanisms and oxidative biology (Maes et al., 2011).
Intracellular accumulation of toxic metabolic by-products creates oxidative stress that compromises cellular integrity (Halliwell, 2006). Glutathione is an important and abundant brain anti-oxidant (Dringen, 2000) that scavenges oxygen and nitrogen species and counters oxidative stress (Wu et al., 2004). Chemically, glutathione is a tripeptide compromising Glu, glycine and cysteine (Dringen, 2000; Wu et al., 2004) and availability of the latter is a rate-limiting step in its synthesis (Dean et al., 2011; Dodd et al., 2008). Oral administration of N-acetyl-cysteine (NAC), a mucolytic that is also used in the treatment of paracetamol overdose, increases the availability of cysteine, and this in turn stimulates glutamate–cysteine exchange, which eventually increases the concentration of Glu (Dodd et al., 2008) and the synthesis of glutathione (Wu et al., 2004). Glutathione metabolism dysfunction has been implicated in a number of psychiatric disorders (Berk et al., 2008b; Dodd et al., 2008), including depression (Kodydková et al., 2009; Ozcan et al., 2004), and recently adjunctive NAC treatment has been shown to improve depressive symptoms in bipolar disorder (Berk et al., 2008a; Magalhães et al., 2011). The precise mechanism of this clinical effect remains unknown.
Proton magnetic resonance spectroscopy (1H-MRS) affords a non-invasive window on in vivo brain chemistry, and may help in understanding the mechanism of NAC as well as the biochemical pathology of MDD (Currie et al., 2012; Malhi et al., 2002; Stanley, 2002). In order to understand the effect of NAC in the context of MDD, it is therefore important to investigate its effect, particularly on Glu because (a) it has been found to be dysregulated in MDD and (b) glutamate–glutamine (Glx) neurotransmitter exchange is an important step in the synthesis of glutathione (see Figure 1). However, it is also important to investigate metabolites which have been implicated in cellular resilience, such as N-acetyl-aspartate (NAA) and myo-inositol (mI) (see Figure 1) (Currie et al., 2012; Malhi et al., 2002; Stanley, 2002). These metabolites have also been implicated in the pathophysiology of mood disorders. For instance, there is evidence for dysfunction in glutamatergic neurotransmission in MDD (Sanacora et al., 2008) and low prefrontal cortex NAA levels have been found to be correlated with chronic depressive illness (Portella et al., 2011). In addition, alterations in mI levels have been found in both bipolar depression and MDD (Frey et al., 1998; Silverstone et al., 2005).

Key metabolites identified in the anterior cingulate voxel. (a) Glutamate (Glu) is the primary excitatory neurotransmitter in the brain. When released into the synaptic cleft it is taken up by astrocytes where Glu is synthesised from glucose, α-ketoglutarate and glutamine (Gln). This forms the Glu-Gln (Glx) neurotransmitter cycle which is an important step in the synthesis of glutathione within the astrocyte (Malhi et al., 2011). (b) Myo-inositol (mI) is an important metabolite which is necessary for the maintenance of cellular signalling. When a neurotransmitter activates the post-synaptic receptor, the mI cycle is activated, triggering downstream intracellular second messenger systems which modulate subsequent neurotransmission. Changes in mI levels reflect cellular function and integrity (Malhi et al., 2013). (c) N-Acetyl-aspartate (NAA) is one of the most abundant metabolites in the mammalian brain and consequently produces a prominent signal in proton magnetic spectroscopy. NAA is primarily synthesised within the mitochondria and is therefore often used as a measure of mitochondrial and neuronal integrity. NAA is synthesised from aspartate and acetyl CoA. Aspartate enters into the mitochondria via the malate aspartate shuttle, catalysed by aspartate aminotransferase (AAT). Pyruvate is provided in the intracellular space through glycolysis and transported through the mitochondrial membrane to produce acetyl CoA, which then enters the tricarboxylic acid (TCA) cycle. The enzyme aspartate N-acetyltransferase (Asp-NAT) facilitates conversion of acetyl CoA and aspartate into NAA (Arun et al., 2009).
The anterior cingulate cortex (ACC) has a key role in the pathophysiology of depression (Drevets et al., 2008), making it an important target for sampling metabolites. Anatomically, it has extensive connections with cortical and subcortical structures, including the brainstem, and this allows it to play an important role in affect generation and regulation (Bush et al., 2000; Luykx et al., 2012; Paus, 2001). Hence, many MDD spectroscopy studies have sampled Glu, Glx, NAA and mI in ACC, but the findings vary considerably.
For example, decreased levels of Glu/Glx have been found in the ACC of MDD patients when compared with healthy controls (Auer et al., 2000; Mirza et al., 2004; Pfleiderer et al., 2003), but one study has found no change in unmedicated remitted MDD patients (Taylor et al., 2009). With respect to NAA, several studies have shown no difference in levels in patients compared to controls (Auer et al., 2000; Coupland et al., 2005; Kumar et al., 2002; Mirza et al., 2004; Pfleiderer et al., 2003), but again a study examining unmedicated MDD patients found decreased NAA levels in the ACC compared to healthy controls that increased following antidepressant treatment (Gonul et al., 2006). Finally, mI levels have been reported as decreased in MDD patients (Coupland et al., 2005) but increased in unmedicated remitted MDD patients (Taylor et al., 2009); however, some studies have failed to find any such differences (Auer et al., 2000; Kumar et al., 2002; Mirza et al., 2004). Thus, overall, a consistent pattern is yet to be identified.
The levels of individual metabolites probably vary considerably because of phenotypic and treatment effects, and are subject to regional differences within the brain. In addition, the concentrations of metabolites are naturally related by virtue of associations within an integrated metabolic system. Therefore, when attempting to understand a complex disorder such as depression and the putative effects of medication, it is perhaps necessary to examine groups of interrelated metabolites and to understand their profile as opposed to determining their individual characteristics.
Thus, the aim of this preliminary study was to investigate the effects of adjunctive NAC treatment compared to placebo in MDD patients by examining a group of metabolites such as Glu, Glx, NAA and mI that are pertinent to depression and oxidative biology. We set out to determine whether depressed treatment groups could be differentiated according to the treatment (NAC or placebo) they received. Specifically, in this exploratory study that was nested within a multicentre clinical trial, it was hypothesised that ACC metabolite profiles would distinguish those receiving NAC from the placebo group.
Methods
Participants
Eligible individuals were aged 18 years and over and met Diagnostic and Statistical Manual of Mental Disorders, Fourth Edition (DSM-IV) criteria for MDD, Single Episode or Recurrent (determined by the Mini International Neuropsychiatric Interview; MINI); scored 18 or over on the Montgomery Asberg Depression Rating Scale (MADRS) (Montgomery and Asberg, 1979); and were stable on therapy for at least 2 weeks prior to randomization. All participants were required to have the capacity to consent and comply with study procedures and were eligible for spectroscopy if they had no contraindications for undergoing magnetic resonance imaging (MRI) (e.g. recent surgery, internal metallic objects).
Exclusion criteria included diagnosis of bipolar disorder, gastric ulcers, known unstable systemic medical disorder, pregnancy or breastfeeding, current use of NAC (> 500 mg/day), selenium (> 200 mg/day) or vitamin E (> 500 IU/day), or history of anaphalactic reaction to NAC or components of its preparation. Participants were withdrawn from the trial if they ceased trial medication for 7 consecutive days, stopped effective contraception or became pregnant or revoked consent. Participants were permitted to continue with on-going medications throughout the study.
Study design
The spectroscopy study was a nested investigation within an ongoing clinical trial where participants were randomized in a double-blind fashion to receive either NAC or placebo. The clinical trial and spectroscopy component was approved by the Northern Sydney Local Health District Human Research Ethics Committee (HREC) as part of a larger multicentre project. Only the Sydney site had facilities for spectroscopy, and it is this subset of the data that is presented in the current paper. Ethics for the spectroscopy component were received after the trial had commenced and therefore the first 20 participants were not scanned. Of the remaining 116 recruited, 20 were excluded because of medical reasons, claustrophobia or other MRI contraindications, and 20 did not provide consent for this component. Therefore, a total of 76 participants underwent spectroscopy.
Trial medication
NAC was acquired from a recognized source and formulated as per previous studies (Berk et al., 2008a). Randomized participants received NAC (1000 mg BID) or matching placebo capsules. This daily dose was based on previous clinical trials using NAC (Berk et al., 2008a).
Study procedure
Participants were recruited through newspaper advertisements and specialist mood disorders clinics at Royal North Shore Hospital (www.cadeclinic.com). Participants were given the trial medication for 12 weeks with a washout period of a further 4 weeks. At the end of the 12-week treatment, eligible participants underwent MRI to obtain spectroscopy data.
MRI and MRS data acquisition
A 3T Siemens Magnetom Trio Scanner (Erlangen, Germany) located at the Advanced Research Clinical High-field Imaging (ARCHI) facility of the University of Sydney was used to acquire MRI and proton spectroscopy data using an 8-channel radiofrequency head coil. A high-resolution T1-weighted image was collected in the sagittal plane using a 3D MPRAGE sequence (TR/TE/TI = 15700/3.22/1200 ms, flip angle = 15°, field of view (FOV) = 240 × 240 mm, matrix = 256 × 256, 192 slices). Using this image as a guide, a single 1H-MRS voxel (15 × 15 × 20 mm) was positioned in the ventral medial frontal cortex. The voxel was placed such that it was predominantly in a grey matter area and the voxel was superior to the orbits and the middle of the voxel was aligned with the genu of the corpus callosum containing primarily anterior cingulate gyrus (see Figure 2). A PRESS (point-resolved spectroscopy) sequence (TR/TE = 3.0 s/30 ms, averages = 128) was used to quantify metabolites. An unsuppressed water sequence for use as a concentration reference and eddy current correction in post-processing was collected with 16 averages and otherwise identical parameters.
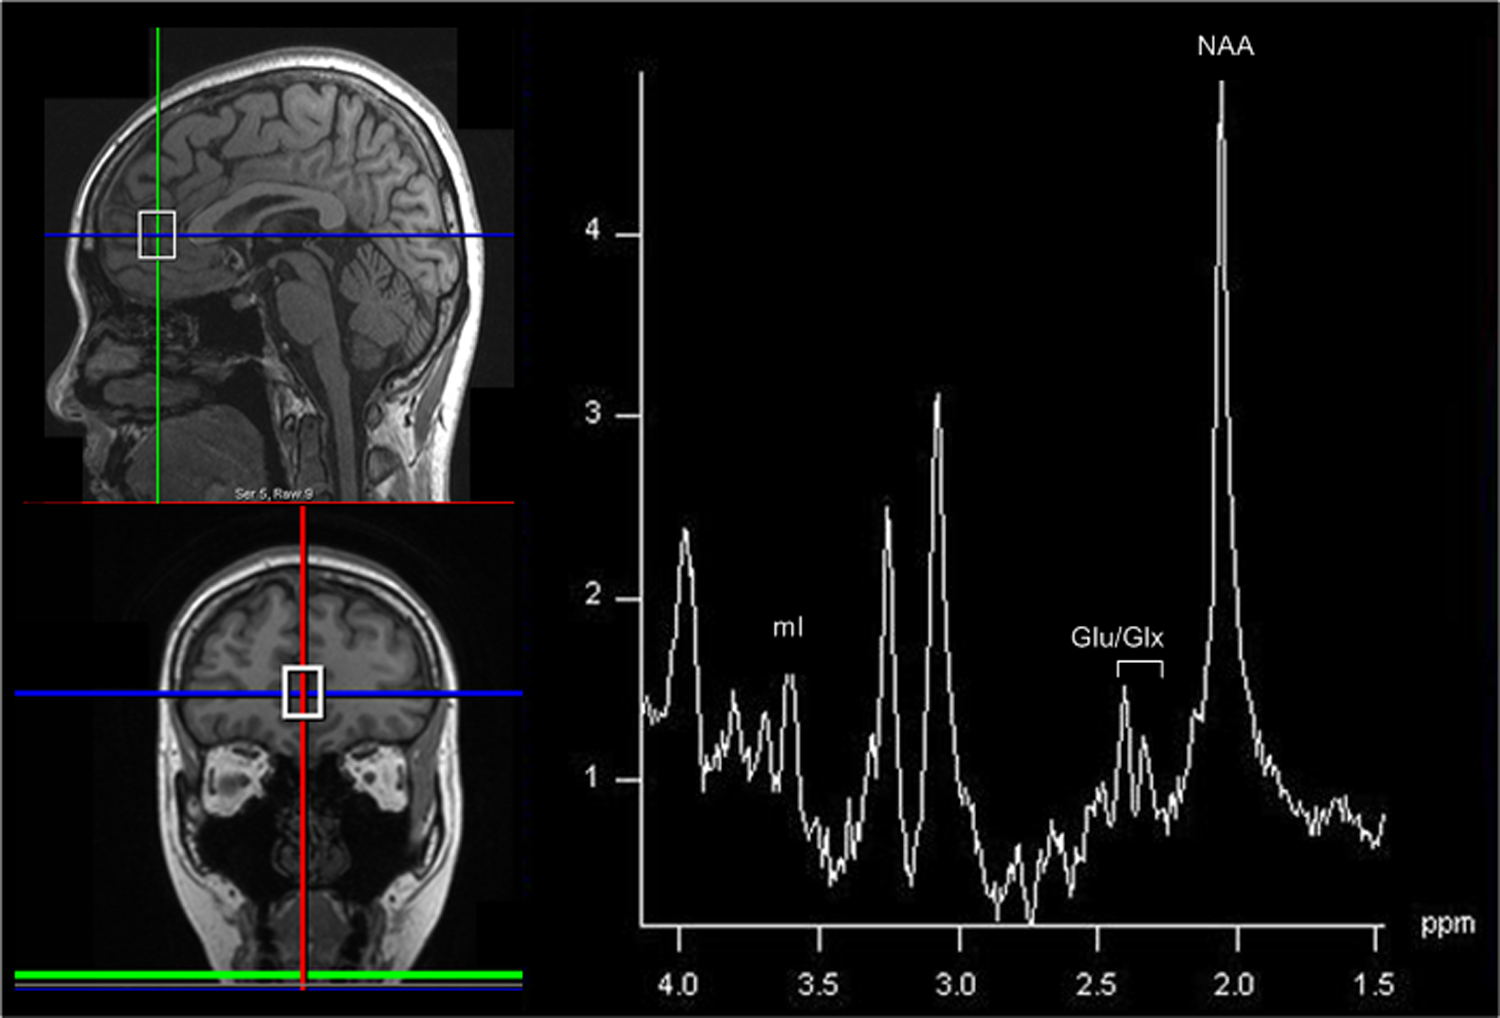
A typical spectrum from the anterior cingulate cortex (ACC). A single voxel was placed in the ACC (shown on the left). This region was chosen because of its prominent role in human emotion and behaviour (Luykx et al., 2012; Paus, 2001). A typical spectrum from this voxel is shown on the right, and demonstrates metabolite peaks for glutamate (Glu) / glutamate-glutamine (Glx), N-acetyl-aspartate (NAA) and myo-inositol (mI), which have been implicated in oxidative stress and the pathophysiology of depression.
MRS data analysis
LCModel (Provencher, 2001) was used to analyse the raw time-domain 1H-MRS data from 4.0 to 1.0 ppm in the spectral dimension with the unsuppressed water scan as a concentration reference. LCModel produces a Cramer-Rao lower bound (CRLB) that fits the peak of interest and serves as a quality-assurance measure. Using this, a value greater than 20% indicated that the fit was unreliable and thus excluded from analysis. Additionally, if the signal-to-noise ratio (computed by LCModel as the height of the largest peak of fit minus baseline over twice the root mean squared of the residuals of the fit) was below 5, that was also excluded from analysis. Metabolite concentrations were computed for NAA, mI, Glu and Glx. T1-weighted images were segmented into grey matter, white matter and cerebrospinal fluid using SPM5. To calculate tissue and cerebrospinal fluid (CSF) fraction with the spectroscopic voxel, the spatial coordinates of the voxel and T1-weighted image were used to register the voxel volume to the segmentation maps generated from the T1-weighted image. Once this was done, the grey matter, white matter and CSF pixels from the segmentation maps that were included in the voxel volume were simply summed and normalized by the total number of pixels in the volume to arrive at the grey matter, white matter and CSF fractions in the voxel. Metabolite concentrations were then computed, correcting for partial-volume and T1 and T2 relaxation effects, using methods described previously (Gasparovic et al., 2006). Figure 2 shows a representative spectrum from a research participant.
Statistical analyses
Independent t-test analyses were conducted to compare the NAC and placebo groups on age and change scores from baseline to week 12 on clinical and functioning measures. The clinical groups were also compared on sex and severity of depression using chi-squared analyses. The MADRS and Clinical Global Impression – Severity scale (CGI-S) at week 12 were used to identify the severity of depression. Both clinical scales were used to establish a strict criterion for severity. Scores on both the MADRS and CGI-S were standardised and participants who scored above the mean on both scales were allocated to the severe group, whereas those who scored lower than the mean on both scales were included in the mild group (Table 1). Participants who did not fall into one of the two groups were not included in the analyses.
To test the hypothesis that metabolite profiles are indicative of group membership, two binary logistic regression analyses were conducted to predict group membership: NAC (coded as 1) or placebo. Separate analyses including Glx and Glu were conducted for two reasons: (a) both Glx and Glu are variations of glutamate and therefore highly related – whilst the latter provides a direct indication of glutamate levels, the former provides a more robust measurement of glutametergic function; and (b) the sample size dictated the analysis and therefore this could accommodate only three predictors. Therefore, for each analysis a combination of three metabolite levels (Glx, mI and NAA; Glu, mI and NAA) were used in separate analyses as predictors. Sex (male = 1) and severity (severe = 1) were controlled for, and therefore entered simultaneously in block 1. The three metabolites were then entered simultaneously into block 2.
Distribution of NAC and Placebo groups according to severity of depression at week 12 as determined by MADRS and CGI-S.

NAC: N-acetyl-cysteine; MADRS: Montgomery Asberg Depression Rating Scale; CGI-S: Clinical Global Impression - Severity scale.
Results
Demographics
During analysis of spectroscopy data, three participants were excluded because of a poor signal-to-noise ratio and four were excluded owing to a higher CRLB value. Therefore, a total of 69 participants (mean age = 50.35 years (SD = 12.17)) were included in the analyses. The majority were female (n = 46, 66%). By design, participants were randomly allocated to one of two clinical groups that received NAC (n = 37) or placebo (n = 32).
The groups did not significantly differ on age, t(64) = 0.03, p > 0.05, or severity, χ2 = 1.22, df = 1, p > 0.05, but clinical groups differed by sex, χ2 = 4.40, df = 1, p = 0.04. In the placebo group, the sexes were evenly balanced but the majority of the NAC group was female (78%). Therefore, sex was controlled for in all analyses.
Multivariate analysis
After controlling for sex and depression severity, which were entered in block 1, Glx, NAA and mI were entered in the second block. This final predicting block, χ2 = 8.95, p < 0.05, and overall model, χ2 = 14.15, p < 0.05, were significant. This overall model had 75% accuracy.
For the Glx, NAA and mI profile, mI and Glx were significant individual predictors and there was a trend for NAA (p = 0.07) (Table 2). According to the model, the log of the odds of a participant being in the NAC group was negatively related to mI levels and positively related to NAA and Glx levels. There was also a trend for sex as an individual predictor.
Glx, NAA and mI as predictors in the logistic regression analysis.

Glx: glutamate–glutamine; NAA: N-acetyl-aspartate; mI: myo-inositol.
p < 0.05.
For the second analysis, which included Glu, after controlling for sex and depression severity (block 1), Glu, NAA and mI were entered in the second block. The overall model, χ2 = 12.53, p < 0.05, was significant and had 68.3% accuracy, although there was only a trend for the second predicting block, χ2 = 7.33, p = 0.06.
For the Glu, NAA and mI profile, similar to the previous results, the log of the odds of a participant being in the NAC group was negatively related to mI levels and positively related to NAA and Glu levels. mI and NAA were significant individual predictors, whereas there was a trend for Glu (p = 0.08) (Table 3).
Glu, NAA and mI as predictors in the logistic regression analysis.

Glu: glutamate; NAA: N-acetyl-aspartate; mI: myo-inositol.
p < 0.05.
Discussion
The main finding in this study was as hypothesised, that the metabolite profiles differentiated the two treatment arms. Specifically, NAC group membership was positively related to the levels of Glx and NAA and negatively related to the level of mI.
The metabolite profile of higher Glx and NAA predicting the NAC group suggests that this group was associated with lower levels of oxidative stress that is possibly mediated by glutathione. Given the links between Glx and glutathione synthesis (Dodd et al., 2008), as well as NAA with glutathione levels (Heales et al., 1995), it is likely that the NAC group had increased glutathione levels. Interestingly, when the Glu, NAA and mI profile was entered into the multivariate model, while it predicted group membership it was only at a trend level; this is perhaps because in vivo glutamate and glutamine are physiologically coupled (Rothman et al., 1999). Therefore, quantification of Glx perhaps provides a more meaningful measure of glutamatergic function than Glu alone. Also, it is important to note that while others have previously shown a relationship with ACC Glx levels and depression severity (Horn et al., 2010), the metabolite profiles reported in the current study were obtained after controlling for severity. These results provide some preliminary insights into the putative anti-oxidative effects of NAC, but should be interpreted somewhat conservatively since these ACC metabolite profiles have been obtained from a single time point.
Several reports have shown that elevated mI levels are related to an antidepressant effect in MDD (Kaymak et al., 2009; Taylor et al., 2009); however, we have found that lower mI levels predict NAC group membership. The above studies failed to find concurrent changes in NAA in the dorsolateral prefrontal cortex (Kaymak et al., 2009) or Glx in the ACC (Taylor et al., 2009). It is therefore possible that NAC affects the complex metabolite systems in a different way to traditional antidepressants. These findings may also highlight the importance of considering metabolite profiles together in understanding the effects of medication. It is also noteworthy that though the role of mI has been more thoroughly investigated and described in bipolar disorder, there still remain inconsistencies as to its ACC spectroscopic findings in both bipolar and unipolar depression (Silverstone et al., 2005).
With respect to clinical changes, the findings in the neuroimaging subsample at week 12 were in keeping with the overall findings in the multisite clinical trial (at week 16). Specifically, NAC benefits depressive symptoms and social and occupational functioning (Berk et al., 2013). The significant clinical changes of NAC observed in the substantive clinical trial occurred at a later time point and therefore may not have achieved separation from placebo in our neuroimaging sample both because of fewer numbers and earlier sampling.
Limitations and future directions
Only one site conducted neuroimaging and therefore this limited the sample size. Also, this study was designed as an exploratory study and metabolites were only examined at the end of the active treatment phase and thus the baseline profile is unknown and it was not possible to evaluate change. Hence, while the findings presented here are informative they should be regarded as tentative. Further, changes to participants’ medications were accepted throughout the trial such that it reflected real-world depression making it difficult to elucidate whether other medications and mood change per se may have influenced metabolite profiles. Lastly, when this study was initiated, spectroscopy protocols for direct quantification of glutathione were not readily available at ARCHI and, as such, levels of glutathione were inferred from its relationship with other metabolites, in particular Glx. Therefore, future studies should attempt, in addition, to directly measure glutathione using tailored sequences and specific editing techniques.
Conclusion
In summary, to our knowledge this is the first translational study of its kind in which in vivo metabolite measurement has been linked to the clinical administration of NAC. Specifically, elevated Glx and NAA profiles in the ACC are indirectly associated with NAC treatment, which supports its putative anti-oxidative role in MDD. This study shows that examination of metabolite profiles may provide a better platform for understanding the effects of medication.
Footnotes
Acknowledgements
We thank Dr Oddbjørn Sæ-ther for his expertise with proton spectroscopy. We are indebted to the participants that made this study possible and we acknowledge the contributions of C Allwang, H Cobb, J Lagopoulos and K Moss.
Funding
This work was financially supported by a National Health and Medical Research Council (NHMRC) project grant (APP628395) and a NHMRC program grant (510135) and Australian Rotary Health.
Declaration of interest
GSM has received research support from AstraZeneca, Eli Lilly, Organon, Pfizer, Servier and Wyeth; has been a speaker for AstraZeneca, Eli Lilly, Janssen-Cilag, Lundbeck, Pfizer, Ranbaxy, Servier and Wyeth; and has been a consultant for AstraZeneca, Eli Lilly, Janssen-Cilag, Lundbeck and Servier.
MB has received research support from the Medical Benefits Fund of Australia, Bristol-Myers Squibb, Eli Lilly, GlaxoSmithKline, Organon, Novartis, Mayne Pharma and Servier; has been a speaker for AstraZeneca, Bristol-Myers Squibb, Eli Lilly, GlaxoSmithKline, Janssen-Cilag, Lundbeck, Merck, Pfizer, Sanofi-Synthelabo, Servier, Solvay and Wyeth; and has served as a consultant to AstraZeneca, Bristol-Myers Squibb, Eli Lilly, GlaxoSmithKline, Janssen-Cilag, Lundbeck and Servier.
OMD has received grant support from the Brain and Behavior Foundation, Simons Autism Foundation, Stanley Medical Research Institute, Lilly, NHMRC and an ASBD/Servier grant.
SD has received grant/research support from the Stanley Medical Research Institute, NHMRC, Beyond Blue, ARHRF, Simons Foundation, Geelong MRF, Eli Lilly, GlaxoSmithKline, Organon, Mayne Pharma and Servier; speaker’s and advisory board fees from Eli Lilly; and conference travel support from Servier.